User login
Even a year of increased water intake did not change CKD course
Coaching adults with stage 3 chronic kidney disease (CKD) to increase water intake did not significantly slow decline in kidney function, results of a randomized clinical trial show.
Compared with coaching to maintain water intake, coaching to increase water intake did in fact increase water intake but did not prevent a decrease in estimated glomerular filtration rate (eGFR) over 1 year, according to findings of the study, which was published in JAMA..
However, the study may have been underpowered to detect a clinically important difference in this primary endpoint, and certain secondary endpoints did suggest a favorable effect of the intervention, according to William F. Clark, MD, of the London (Ontario) Health Sciences Centre and his coauthors.
“The increased water intake achieved in this trial was sufficient to lower vasopressin secretion, as assessed by plasma copeptin concentrations,” Dr. Clark and his colleagues said in their report
An increasing number of studies suggest that drinking water may benefit the kidneys. In some human studies, water intake was associated with reduced risk of kidney stones and better kidney function.
However, it remains unknown whether increasing water intake would benefit patients with CKD. To evaluate this question, Dr. Clark and colleagues initiated CKD WIT (Chronic Kidney Disease Water Intake Trial), a randomized clinical trial conducted in 9 centers in Ontario.
The study included 631 patients with stage 3 CKD and a 24-hour urine volume below 3 L. Patients randomized to the hydration group were coached to increase water intake gradually to 1-1.5 L/day for 1 year, while those randomized to the control group were coached to maintain their usual water intake.
Patients in the hydration group were also given reusable drinking containers and 20 vouchers per month redeemable for 1.5 L of bottled water, investigators reported.
Urine volume did significantly increase in the hydration group versus controls, by 0.6 L per day (P less than .001). However, change in eGFR – the primary outcome – was not significantly different between groups. Mean change in eGFR was –2.2 mL/min per 1.73 m2 in patients coached to drink more water and –1.9 mL/min per 1.73 m2 in those coached to maintain water intake (P = .74).
Some secondary outcome measures demonstrated significant differences in favor of the hydration group. Plasma copeptin and creatinine clearance both showed significant differences in favor of the hydration group. In contrast, there were no significant differences between intervention arms in urine albumin or quality of health, according to analyses of secondary outcomes described in the study report.
There are several ways to interpret the finding that drinking more water had no effect on eGFR, investigators said. Increasing water intake may simply not be protective against kidney function decline. Perhaps follow-up longer than 1 year would be needed to see an effect, or perhaps there was an effect, but the study was underpowered to detect it.
It could also be that a greater volume of water would be needed to demonstrate a protective effect for the kidneys. Despite the coaching efforts of dietitians and research assistants, the mean urine volume increase in the hydration group relative to the control group was just 0.6 liter per day, or 2.4 cups.
“This highlights how difficult it would be to achieve a large sustained increase in water intake in routine practice,” Dr. Clark and colleagues said in their report.
Dr. Clark reported disclosures related to Danone Research. Thermo Fisher Scientific provided instrumentation, assay reagent, and disposables used in the study.
SOURCE: Clark WF et al. JAMA. 2018;319(18):1870-9.
Key clinical point: Adults with CKD were coached to increase water intake, but that intervention did not appear to slow their decline in kidney function.
Major finding: The 1-year change in eGFR was –2.2 mL/min per 1.73 m2 in patients coached to drink more water and –1.9 mL/min per 1.73 m2 in those coached to maintain water intake; the difference was not significant.
Study details: The CKD WIT (Chronic Kidney Disease Water Intake Trial), a randomized clinical trial was conducted in 9 centers in Ontario, Canada, from 2013 until 2017 and included 631 patients with stage 3 CKD and a 24-hour urine volume below 3.0 L.
Disclosures: Authors reported disclosures related to Danone Research and the ISN/Danone Hydration for Kidney Health Research Initiative. Thermo Fisher Scientific provided instrumentation, assay reagent, and disposables used in the study.
Source: Clark WF et al. JAMA. 2018;319(18):1870-9.
Multidisciplinary Diabetes Care in a Safety Net Clinic: Lessons Learned from a Quality Improvement Initiative
From the Department of Family and Community Medicine, McGovern Medical School at the University of Texas Health Science Center, Houston, TX (Dr. Zare, Ms Klawans, Dr. Moreno), Department of Family Medicine and Community Medicine, Baylor College of Medicine, Houston, TX (Dr. Mejia de Grubb, Dr. Juneja, Dr. Zoorob), Department of Psychiatry, McGovern Medical School at the University of Texas Health Science Center, Houston, TX (Dr. Suchting), andHarris Health System, Houston TX (Ms. Mathis).
Abstract
- Objective: To describe a pilot project to improve care for patients with uncontrolled diabetes in a safety net clinic.
- Methods: One of 3 clinical teams was designated the intervention team. Changes implemented by the intervention team included patient referral to a dietician and/or clinical pharmacist, provision of patient education, and assignment of a case manager. We compared outcomes of patients in the intervention group (n = 71), vs those receiving care from the other 2 teams (usual care) (n = 188).
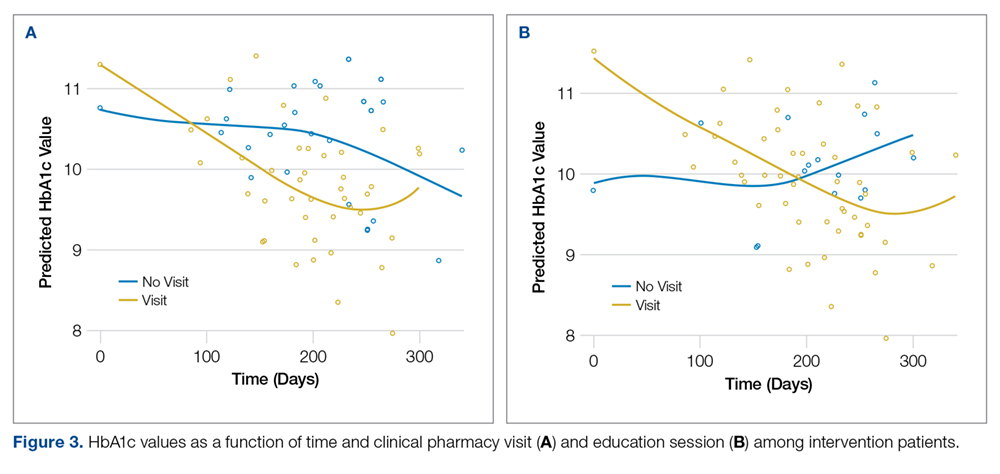
- Results: HbA1c significantly decreased over time for patients in the intervention group as well as the usual care group. Within the intervention group, visits to clinical pharmacist (P = 0.034) and education (P = 0.004) predicted significantly greater decreases in HbA1c over time.
- Conclusions: Diffusion of treatment may account for the overall HbA1c reduction regardless of treatment group. Results support the need for further pragmatic research to weigh the impact of unblinded designs, outcome measurement, and real-world behaviors on evidence-based interventions.
Key words: diabetes; safety net; multidisciplinary diabetes care; primary care; diffusion of treatment.
The prevalence of type 2 diabetes in the United States is significantly higher among Hispanics and African Americans than in the general population (13% vs. 9.3%) [1]. Similarly, diabetes is highly prevalent among the uninsured, and many patients delay or forgo treatment due to cost [2]. Subsequently, the rates of comorbidities, including stroke, hypertension, and CVD, are elevated in these groups [3].
Association between elevated HbA1c and morbidity and mortality is well-documented, and an HbA1c reduction of just 1% has been shown to reduce mortality and improve quality of life [4]. Uncontrolled diabetes also results in increased medical costs. Reducing HbA1c from 9.0 to 7.5 reduces annual expenditures by as much as 73% [5].
Metropolitan Houston and Harris County, Texas, has one of the largest uninsured metro populations in the United States (over 3.6 million) [6]. Harris Health System serves this uninsured population and is the fourth largest safety net health system in the nation. Approximately 40,000 patients with diabetes receive care within the health system, and 34% of them have an HbA1c value greater than 9.
Developing novel, cost-efficient treatment and management models is crucial when providing care for patients with uncontrolled diabetes. However, the study of implementation strategies to successfully integrate evidence-based interventions in primary care using pragmatic approaches that aim to determine the effectiveness of interventions in “the real world” remain a challenge [7,8]. To address this issue, a quality improvement project was instituted at one of the system’s health centers to improve the care of patients with uncontrolled diabetes (known HbA1c above 9).
Methods
Setting
The pilot project was conducted from 1 Oct 2015 to 31 Dec 2015 in a primary care community health center within Harris Health System in Houston, Texas. This pilot was the first step of an institutional effort to introduce a multidisciplinary model of care across all clinics [9]. Our health center has 6 family medicine providers and 1 advanced practice nurse practitioner, organized into 3 pods with 2 physicians each. We randomly selected 1 pod (team) and designated it the intervention group.
The Standards for Quality Improvement Reporting Excellence guidelines [10] were followed and institutional review board approval was obtained.
Intervention
Practice changes introduced in the intervention team were assignment of a case manager to all patients, referral to a dietician and clinical pharmacist as needed, and patient education sessions. The team’s nurse assumed the role of case manager. The case manager was responsible for reviewing a patient checklist based on the America Diabetes Association guideline for comprehensive diabetes medical evaluation at initial and follow-up visits. Referrals were based on ADA guideline recommendations. Onsite brief patient education was provided to all patients. In addition, patients were enrolled in a “Diabetes 101” class, which follows an evidence-based curriculum that includes participation in at least 2 monthly sessions. Patients were asked to return to the clinic for a follow-up visit after 3 months in order to monitor medication compliance, re-evaluate their care plan, and measure HbA1c The usual care group patients were managed based on the current Standards of Medical Care in Diabetes [11]. The usual care group included patients from the same clinic under the care of providers in the teams that were not included in the multidisciplinary intervention.
Analysis
Data abstracted from de-identified patient records included HbA1c values, interventions received, and sociodemographic data. Generalized linear mixed modeling (GLMM) was used to examine changes in patient HbA1c levels over time [12]. All models included a random intercept to account for correlated observations within patient. All analyses were performed using Proc GLIMMIX in SAS v. 9.3 [13].
Results
A total 271 patients with HbA1c above 9 were included in the analysis: 71 in the intervention group and 188 in the usual care group. The intervention group was further differentiated by month of enrollment: October (n = 37), November (n = 27), and December (n = 9). Mean patient age in the overall sample was 51.6 years. 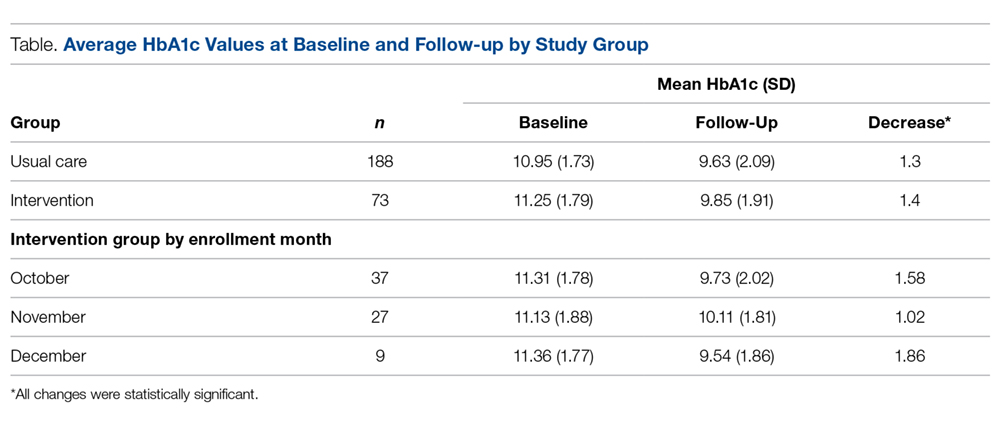
In the intervention group, most patients received patient education 56% (n = 40), almost half had a clinical pharmacy visit, but only 17% (n = 12) received a dietitian consultation. Overall, there was a 1.4% decrease in HbA1c in the intervention group, compared to a 1.3% HbA1c decrease in the usual care group.
GLMM was used to examine differences in HbA1c levels according to month of intervention enrollment (October vs. November vs. December) in the intervention group over time. Figure 1 shows predicted HbA1c values over time with trend lines fit for each of the three subgroups. 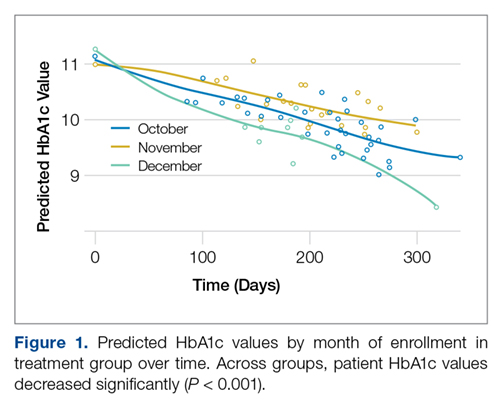
Preliminary analysis showed that potential contamination (diffusion of the treatment) would be likely to attenuate differences in the outcomes between the intervention and usual care conditions. Further analysis by subgroups were conducted to describe the intervention potential “spillover” to the usual care group participants not intended to receive the intervention. GLMM also examined differences in HbA1c levels between the intervention and usual care groups over time. The interaction between each treatment group and time was not statistically significant (F(2,268) = 1.34, P = 0.26), indicating that changes in HbA1c over time were not related to treatment group. A statistically reliable main effect for time (F(1,268) = 44.33, P < 0.001) indicated that in all groups, HbA1c values significantly decreased over time.
Follow-up analyses utilized GLMM to examine differences in HbA1c levels among patients in both groups who received at least one of the interventions (visiting a dietician, clinical pharmacist, education session, and clinical case manager). The interaction between intervention and time was not statistically significant for visiting the dietician, receiving education, or being assigned a case manager. The interaction between time and visiting a clinical pharmacist was statistically significant (F(1,204)= 7.78, P = 0.01) such that patients visiting the clinical pharmacist had lower HbA1c values over time relative to those that did not (Figure 2). 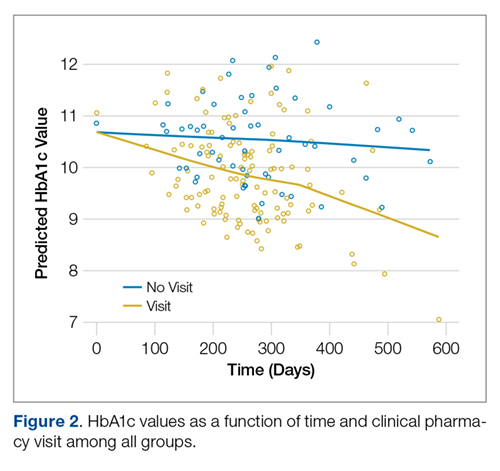
Discussion
HbA1c decreased significantly among intervention patients with uncontrolled diabetes over a 3-month period, regardless of which month they entered the study. However, there was no significant difference in HbA1c reduction between patients who received all 4 multidisciplinary interventions, one intervention, or those who received usual care. Patients in the intervention who attended clinical pharmacist visits had significantly greater HbA1c reduction than patients who did not, as did patients who attended a diabetes education session by a patient educator.
Diffusion of treatment may account for the overall HbA1c reduction regardless of treatment group. Diffusion refers to the unintended spread of a treatment effect when participants receive some or all treatments from an intervention to which they were not assigned, making outcomes descriptions of all study groups more challenging [14]. During the implementation period, other physicians and nurses in the clinic were aware of the multidisciplinary care model being piloted, and may have taken the initiative to connect their patients with clinical pharmacists, dieticians, certified diabetes educators, and clinical case managers. Pragmatic interventions are intended to maintain the internal validity of randomized control trials, yet they are meant to be implemented as close as possible to real-world settings in order to help patients, clinicians, and payers making informed health care decisions [8]. In this regard, participants in the control group could be exposed to the intervention through staff contact between the assigned groups implementing some of the intervention under study. In that case, the diffusion of treatment would be likely to attenuate differences in the outcomes between treatment and control groups [15].
This study has several limitations. We studied a small sample of patients that reflected the primary care population in one clinic in a safety net system with minority, underserved, and high-risk patients. Although attempts were made to keep the intervention limited to the intervention pod, diffusion of treatment might have impacted the internal validity of this intervention.
In summary, our results support the need for further systematic research work to weigh the impact of unblinded designs, simplified recruitment and outcome measurement, and real-world behaviors (such as noncompliance, cross over, and dropout) on evidence-based and multidisciplinary clinical interventions.
Acknowledgements: The authors would like to thank Krystal Gamarra, MSW, LCSW, and Hope Galvan, MS, RN, CVRN-BC, CDE for assistance with project implementation and data collection throughout this process.
Corresponding author: Maria C. Mejia de Grubb, MD, MPH, 3751 Kirby Dr, Suite 600, Houston, TX 77098, mcgrubb@bcm.edu.
Financial disclosures: None.
1. Centers for Disease Control and Prevention. National Diabetes Statistics Report: Estimates of diabetes and its burden in the United States, 2014. Atlanta, GA: U.S. Department of Health and Human Services; 2014. Accessed at www.cdc.gov/diabetes/pubs/statsreport14/national-diabetes-report-web.pdf.
2. Casagrande SS, Cowie CC. Health insurance coverage among people with and without diabetes in the US adult population. Diabetes Care 2012;35:2243–9.
3. American Diabetes Association. Statistics about diabetes. Arlington, VA; 2017.
4. Eeg-Olofsson K, Eliasson B, Zethelius B, et al. HbA1c reduction and risk of cardiovascular diseases in type 2 diabetes: an observational study from the Swedish NDR. Diabetes 2012.
5. Baxter M, Hudson R, Mahon J, et al. Estimating the impact of better management of glycaemic control in adults with type 1 and type 2 diabetes on the number of clinical complications and the associated financial benefit. Diabet Med 2016;33:1575–81.
6. Harris County Healthcare Alliance. The State of Health in Houston/Harris County 2015-2016. Accessed 17 Mar 2015 at http://houstonstateofhealth.org/soh_doc/.
7. Chalkidou K, Tunis S, Whicher D, et al. The role for pragmatic randomized controlled trials (pRCTs) in comparative effectiveness research. Clin Trials (London, England) 2012;9:436–46.
8. Tricoci P, Allen JM, Kramer JM, et al. Scientific evidence underlying the ACC/AHA clinical practice guidelines. JAMA 2009;301:831–41.
9. Wagner EH, Austin BT, Von Korff M. Organizing care for patients with chronic illness. Milbank Qty 1996:511–44.
10. Ogrinc G, Davies L, Goodman D, et al. SQUIRE 2.0 (Standards for QUality Improvement Reporting Excellence): revised publication guidelines from a detailed consensus process. BMJ Qual Safety 2016;25:986–92.
11. Standards of Medical Care in Diabetes—2015 Abridged for Primary Care Providers. American Diabetes Association. Clin Diabetes 2015;33:97–111.
12. Gelman A, Hill J. Data analysis using regression and multilevelhierarchical models. New York: Cambridge University Press; 2007.
13. SAS Institute I. Base SAS Procedures Guide: Statistical procedures. In: SAS Institute I, editor. Cary, NC; 2011.
14. Shadish WR, Cook TD, Campbell DT. Experimental and quasi-experimental designs for general causal inference. Boston: Houghton Mifflin; 2002.
15. Kane R. Understanding health care outcomes research. 2nd ed. In: Learning JB, editor. Burlington, MA: Jones and Bartlett; 2006: 44–6.
From the Department of Family and Community Medicine, McGovern Medical School at the University of Texas Health Science Center, Houston, TX (Dr. Zare, Ms Klawans, Dr. Moreno), Department of Family Medicine and Community Medicine, Baylor College of Medicine, Houston, TX (Dr. Mejia de Grubb, Dr. Juneja, Dr. Zoorob), Department of Psychiatry, McGovern Medical School at the University of Texas Health Science Center, Houston, TX (Dr. Suchting), andHarris Health System, Houston TX (Ms. Mathis).
Abstract
- Objective: To describe a pilot project to improve care for patients with uncontrolled diabetes in a safety net clinic.
- Methods: One of 3 clinical teams was designated the intervention team. Changes implemented by the intervention team included patient referral to a dietician and/or clinical pharmacist, provision of patient education, and assignment of a case manager. We compared outcomes of patients in the intervention group (n = 71), vs those receiving care from the other 2 teams (usual care) (n = 188).
- Results: HbA1c significantly decreased over time for patients in the intervention group as well as the usual care group. Within the intervention group, visits to clinical pharmacist (P = 0.034) and education (P = 0.004) predicted significantly greater decreases in HbA1c over time.
- Conclusions: Diffusion of treatment may account for the overall HbA1c reduction regardless of treatment group. Results support the need for further pragmatic research to weigh the impact of unblinded designs, outcome measurement, and real-world behaviors on evidence-based interventions.
Key words: diabetes; safety net; multidisciplinary diabetes care; primary care; diffusion of treatment.
The prevalence of type 2 diabetes in the United States is significantly higher among Hispanics and African Americans than in the general population (13% vs. 9.3%) [1]. Similarly, diabetes is highly prevalent among the uninsured, and many patients delay or forgo treatment due to cost [2]. Subsequently, the rates of comorbidities, including stroke, hypertension, and CVD, are elevated in these groups [3].
Association between elevated HbA1c and morbidity and mortality is well-documented, and an HbA1c reduction of just 1% has been shown to reduce mortality and improve quality of life [4]. Uncontrolled diabetes also results in increased medical costs. Reducing HbA1c from 9.0 to 7.5 reduces annual expenditures by as much as 73% [5].
Metropolitan Houston and Harris County, Texas, has one of the largest uninsured metro populations in the United States (over 3.6 million) [6]. Harris Health System serves this uninsured population and is the fourth largest safety net health system in the nation. Approximately 40,000 patients with diabetes receive care within the health system, and 34% of them have an HbA1c value greater than 9.
Developing novel, cost-efficient treatment and management models is crucial when providing care for patients with uncontrolled diabetes. However, the study of implementation strategies to successfully integrate evidence-based interventions in primary care using pragmatic approaches that aim to determine the effectiveness of interventions in “the real world” remain a challenge [7,8]. To address this issue, a quality improvement project was instituted at one of the system’s health centers to improve the care of patients with uncontrolled diabetes (known HbA1c above 9).
Methods
Setting
The pilot project was conducted from 1 Oct 2015 to 31 Dec 2015 in a primary care community health center within Harris Health System in Houston, Texas. This pilot was the first step of an institutional effort to introduce a multidisciplinary model of care across all clinics [9]. Our health center has 6 family medicine providers and 1 advanced practice nurse practitioner, organized into 3 pods with 2 physicians each. We randomly selected 1 pod (team) and designated it the intervention group.
The Standards for Quality Improvement Reporting Excellence guidelines [10] were followed and institutional review board approval was obtained.
Intervention
Practice changes introduced in the intervention team were assignment of a case manager to all patients, referral to a dietician and clinical pharmacist as needed, and patient education sessions. The team’s nurse assumed the role of case manager. The case manager was responsible for reviewing a patient checklist based on the America Diabetes Association guideline for comprehensive diabetes medical evaluation at initial and follow-up visits. Referrals were based on ADA guideline recommendations. Onsite brief patient education was provided to all patients. In addition, patients were enrolled in a “Diabetes 101” class, which follows an evidence-based curriculum that includes participation in at least 2 monthly sessions. Patients were asked to return to the clinic for a follow-up visit after 3 months in order to monitor medication compliance, re-evaluate their care plan, and measure HbA1c The usual care group patients were managed based on the current Standards of Medical Care in Diabetes [11]. The usual care group included patients from the same clinic under the care of providers in the teams that were not included in the multidisciplinary intervention.
Analysis
Data abstracted from de-identified patient records included HbA1c values, interventions received, and sociodemographic data. Generalized linear mixed modeling (GLMM) was used to examine changes in patient HbA1c levels over time [12]. All models included a random intercept to account for correlated observations within patient. All analyses were performed using Proc GLIMMIX in SAS v. 9.3 [13].
Results
A total 271 patients with HbA1c above 9 were included in the analysis: 71 in the intervention group and 188 in the usual care group. The intervention group was further differentiated by month of enrollment: October (n = 37), November (n = 27), and December (n = 9). Mean patient age in the overall sample was 51.6 years.
In the intervention group, most patients received patient education 56% (n = 40), almost half had a clinical pharmacy visit, but only 17% (n = 12) received a dietitian consultation. Overall, there was a 1.4% decrease in HbA1c in the intervention group, compared to a 1.3% HbA1c decrease in the usual care group.
GLMM was used to examine differences in HbA1c levels according to month of intervention enrollment (October vs. November vs. December) in the intervention group over time. Figure 1 shows predicted HbA1c values over time with trend lines fit for each of the three subgroups.
Preliminary analysis showed that potential contamination (diffusion of the treatment) would be likely to attenuate differences in the outcomes between the intervention and usual care conditions. Further analysis by subgroups were conducted to describe the intervention potential “spillover” to the usual care group participants not intended to receive the intervention. GLMM also examined differences in HbA1c levels between the intervention and usual care groups over time. The interaction between each treatment group and time was not statistically significant (F(2,268) = 1.34, P = 0.26), indicating that changes in HbA1c over time were not related to treatment group. A statistically reliable main effect for time (F(1,268) = 44.33, P < 0.001) indicated that in all groups, HbA1c values significantly decreased over time.
Follow-up analyses utilized GLMM to examine differences in HbA1c levels among patients in both groups who received at least one of the interventions (visiting a dietician, clinical pharmacist, education session, and clinical case manager). The interaction between intervention and time was not statistically significant for visiting the dietician, receiving education, or being assigned a case manager. The interaction between time and visiting a clinical pharmacist was statistically significant (F(1,204)= 7.78, P = 0.01) such that patients visiting the clinical pharmacist had lower HbA1c values over time relative to those that did not (Figure 2).
Discussion
HbA1c decreased significantly among intervention patients with uncontrolled diabetes over a 3-month period, regardless of which month they entered the study. However, there was no significant difference in HbA1c reduction between patients who received all 4 multidisciplinary interventions, one intervention, or those who received usual care. Patients in the intervention who attended clinical pharmacist visits had significantly greater HbA1c reduction than patients who did not, as did patients who attended a diabetes education session by a patient educator.
Diffusion of treatment may account for the overall HbA1c reduction regardless of treatment group. Diffusion refers to the unintended spread of a treatment effect when participants receive some or all treatments from an intervention to which they were not assigned, making outcomes descriptions of all study groups more challenging [14]. During the implementation period, other physicians and nurses in the clinic were aware of the multidisciplinary care model being piloted, and may have taken the initiative to connect their patients with clinical pharmacists, dieticians, certified diabetes educators, and clinical case managers. Pragmatic interventions are intended to maintain the internal validity of randomized control trials, yet they are meant to be implemented as close as possible to real-world settings in order to help patients, clinicians, and payers making informed health care decisions [8]. In this regard, participants in the control group could be exposed to the intervention through staff contact between the assigned groups implementing some of the intervention under study. In that case, the diffusion of treatment would be likely to attenuate differences in the outcomes between treatment and control groups [15].
This study has several limitations. We studied a small sample of patients that reflected the primary care population in one clinic in a safety net system with minority, underserved, and high-risk patients. Although attempts were made to keep the intervention limited to the intervention pod, diffusion of treatment might have impacted the internal validity of this intervention.
In summary, our results support the need for further systematic research work to weigh the impact of unblinded designs, simplified recruitment and outcome measurement, and real-world behaviors (such as noncompliance, cross over, and dropout) on evidence-based and multidisciplinary clinical interventions.
Acknowledgements: The authors would like to thank Krystal Gamarra, MSW, LCSW, and Hope Galvan, MS, RN, CVRN-BC, CDE for assistance with project implementation and data collection throughout this process.
Corresponding author: Maria C. Mejia de Grubb, MD, MPH, 3751 Kirby Dr, Suite 600, Houston, TX 77098, mcgrubb@bcm.edu.
Financial disclosures: None.
1. Centers for Disease Control and Prevention. National Diabetes Statistics Report: Estimates of diabetes and its burden in the United States, 2014. Atlanta, GA: U.S. Department of Health and Human Services; 2014. Accessed at www.cdc.gov/diabetes/pubs/statsreport14/national-diabetes-report-web.pdf.
2. Casagrande SS, Cowie CC. Health insurance coverage among people with and without diabetes in the US adult population. Diabetes Care 2012;35:2243–9.
3. American Diabetes Association. Statistics about diabetes. Arlington, VA; 2017.
4. Eeg-Olofsson K, Eliasson B, Zethelius B, et al. HbA1c reduction and risk of cardiovascular diseases in type 2 diabetes: an observational study from the Swedish NDR. Diabetes 2012.
5. Baxter M, Hudson R, Mahon J, et al. Estimating the impact of better management of glycaemic control in adults with type 1 and type 2 diabetes on the number of clinical complications and the associated financial benefit. Diabet Med 2016;33:1575–81.
6. Harris County Healthcare Alliance. The State of Health in Houston/Harris County 2015-2016. Accessed 17 Mar 2015 at http://houstonstateofhealth.org/soh_doc/.
7. Chalkidou K, Tunis S, Whicher D, et al. The role for pragmatic randomized controlled trials (pRCTs) in comparative effectiveness research. Clin Trials (London, England) 2012;9:436–46.
8. Tricoci P, Allen JM, Kramer JM, et al. Scientific evidence underlying the ACC/AHA clinical practice guidelines. JAMA 2009;301:831–41.
9. Wagner EH, Austin BT, Von Korff M. Organizing care for patients with chronic illness. Milbank Qty 1996:511–44.
10. Ogrinc G, Davies L, Goodman D, et al. SQUIRE 2.0 (Standards for QUality Improvement Reporting Excellence): revised publication guidelines from a detailed consensus process. BMJ Qual Safety 2016;25:986–92.
11. Standards of Medical Care in Diabetes—2015 Abridged for Primary Care Providers. American Diabetes Association. Clin Diabetes 2015;33:97–111.
12. Gelman A, Hill J. Data analysis using regression and multilevelhierarchical models. New York: Cambridge University Press; 2007.
13. SAS Institute I. Base SAS Procedures Guide: Statistical procedures. In: SAS Institute I, editor. Cary, NC; 2011.
14. Shadish WR, Cook TD, Campbell DT. Experimental and quasi-experimental designs for general causal inference. Boston: Houghton Mifflin; 2002.
15. Kane R. Understanding health care outcomes research. 2nd ed. In: Learning JB, editor. Burlington, MA: Jones and Bartlett; 2006: 44–6.
The Effects of Ranolazine on Hemoglobin A1c in a Veteran Population
Diabetes mellitus (DM) is a risk factor for cardiovascular disease(CVD).1-4 Death rates from heart disease are 2- to 4-times higher among adults with DM compared with those of adults without DM. In the US, it is estimated that 21.1 million adults have diagnosed DM, 8.1 million adults have undiagnosed DM, and 80.8 million adults have prediabetes.3 The American Heart Association has identified an untreated fasting blood glucose level < 100 mg/dL as a component of ideal cardiovascular health.3
Although the use of antidiabetic agents has been shown to reduce the risks of microvascular complications among patients with DM, a cardiovascular benefit has not been consistently demonstrated with all available agents, and some used in the treatment of DM are associated with cardiovascular harm.5 In addition, some cardiovascular medications may contribute to the development of DM or may mask the symptoms of hypoglycemia.6 Given the risk for CVD among patients with DM, a medication with utility in both DM and CVD could be beneficial.
Evidence for Use of Ranolazine
Ranolazine is indicated for the treatment of chronic angina.7 In clinical trials, ranolazine also was found to decrease hemoglobin A1c (HbA1c).8-15 The possible mechanisms for lowering HbA1c with ranolazine include preservation of pancreatic β-cells and an increase in glucose-dependent insulin secretion.6 The most common adverse effects associated with ranolazine include dizziness, headache, constipation, and nausea.7
Ranolazine has been shown to be efficacious and safe in the reduction of angina symptoms among patients with and without DM.8-12 In addition to improving symptoms of angina, studies have demonstrated a reduction in HbA1c among patients taking ranolazine.9,13-15 In an open-label extension of the Combination Assessment of Ranolazine in Stable Angina (CARISA) trial, ranolazine 750 mg twice daily and 1,000 mg twice daily led to a greater reduction in HbA1c when each was compared with placebo (-0.48% HbA1c, P = .008; and -0.70% HbA1c, P = .001, respectively).9
Among the 5,576 patients enrolled in the Metabolic Efficiency With Ranolazine for Less Ischemia in Non-ST-Elevation Acute Coronary Syndromes—Thrombolysis in Myocardial Infarction 36 (MERLIN-TIMI 36) trial with a baseline HbA1c, ranolazine significantly reduced HbA1c at 4 months when compared with placebo among patients with and without DM.13 In addition, patients with DM who were treated with ranolazine were more likely to achieve a HbA1c < 7% at 4 months when compared with placebo (59% vs 49%; P < .001). Ranolazine was not found to increase the incidence of hypoglycemia.
A subgroup analysis of MERLIN-TIMI 36 evaluated the effects of ranolazine compared with those of placebo on fasting plasma glucose and HbA1c in patients with moderate DM (HbA1c ≥ 6% but < 8%, fasting plasma glucose < 250 mg/dL) and severe DM (A1c ≥ 8%, fasting plasma glucose 150-400 mg/dL).14 A significant reduction in HbA1c with ranolazine in addition to standard of care antidiabetes treatment was observed among both groups. The placebo-corrected decrease in HbA1c in the moderate DM group was 0.28% (95% confidence interval [CI] -0.55 to 0; P = .045) and in the severe DM group was 0.59% (95% CI -0.99 to -0.20; P < .001).
In a trial designed to evaluate change in HbA1c in patients taking ranolazine 1,000 mg twice daily compared with that of placebo, ranolazine led to a greater decrease in HbA1c compared with that of placebo (placebo corrected change in HbA1c -0.56%, P = .001).15 In addition, a higher percentage of patients achieved HbA1c < 7% at 24 weeks in the ranolazine group compared with that of placebo (41.2% vs 25.7%; P = .001). No patient experienced severe hypoglycemia or had documented hypoglycemia in this study.
These trials suggest that ranolazine, in addition to decreasing anginal events, is potentially beneficial in achieving better control of DM. However, more studies are needed to determine this benefit. In addition, no trials have examined the 500-mg twice daily dose of ranolazine in HbA1c reduction.
The purpose of this study was to evaluate the change in HbA1c among veterans with DM after the initiation of ranolazine. The study compared the percentage of veterans achieving HbA1c < 7% or < 8% after initiation of ranolazine with the baseline, to determine whether there is a dose-related change in HbA1c among different ranolazine regimens and to determine whether there is a change in the incidence of hypoglycemia after the initiation of ranolazine.
Methods
This was a multicenter, retrospective study. The institutional review board and research and development committee for 3 Veterans Affairs medical centers (VAMCs) approved this study and waived informed consent. Additionally, this study was approved for access to national patient information through the Corporate Data Warehouse (CDW).
Subjects were eligible for inclusion in this study if they were aged ≥ 18 years, had a diagnosis of type 2 DM, and received their first prescription of ranolazine at a VAMC from January 1, 2008 through March 31, 2015. Exclusion criteria included subjects with no baseline HbA1c (defined as the HbA1c result closest to the ranolazine initiation date and within 90 days before to 14 days after ranolazine initiation), no follow-up HbA1c (defined as the first HbA1c result within 60 to 180 days after the ranolazine initiation date), any change to their DM medication regimen during the follow-up period, or who discontinued ranolazine prior to collection of the follow-up HbA1c.
Data were collected from the electronic health record (EHR) for each subject from 6 months prior to the ranolazine initiation date through 6 months after the ranolazine initiation date. The ranolazine initiation date was defined as the date ranolazine was picked up in person at a VAMC pharmacy or 7 days after the date filled for medications sent by mail. 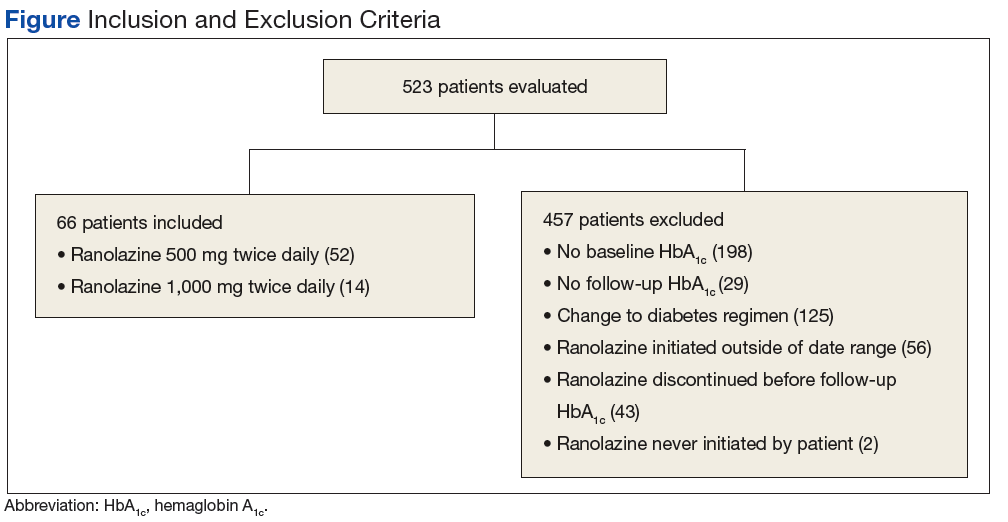
The primary endpoint of this study was the change in HbA1c after ranolazine initiation. The secondary endpoint was the percentage of study subjects achieving HbA1c < 7% and < 8% before and after the initiation of ranolazine.
To achieve 80% power to detect a change in HbA1c of 0.4%, a sample size of 52 patients was required. For the primary endpoint, a paired t test was used to test for statistical significance. The McNemar test was used to evaluate for a significant change in subjects achieving an HbA1c < 7% and HbA1c < 8% with the initiation of ranolazine.
Results
A total of 523 patients were evaluated for study inclusion, of which 66 patients were included (Figure). The most common reasons for exclusion included no HbA1c at baseline and changes to the DM medication regimen during follow-up. 
Ranolazine at any dose was associated with a change in HbA1c of -0.3% (P < .001). 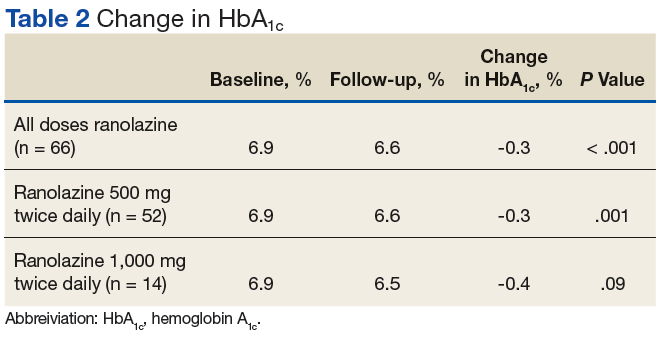
A dose of 500 mg ranolazine twice daily also was associated with a significant decrease in HbA1c by 0.3% (P = .001). A significant increase in veterans achieving HbA1c < 7% after ranolazine initiation was observed (42.3% before ranolazine initiation vs 73.1% after ranolazine initiation; P = .001), and a nonsignificant increase in veterans achieving HbA1c < 8% was observed (82.7% before ranolazine initiation vs 90.4% after ranolazine initiation, P = .37).
At a dose of 1,000 mg twice daily, a 0.4% decrease in HbA1c was observed. However, this result was not found to be statistically significant (P = .09), and the study was underpowered to detect a significant change in HbA1c at this dose. 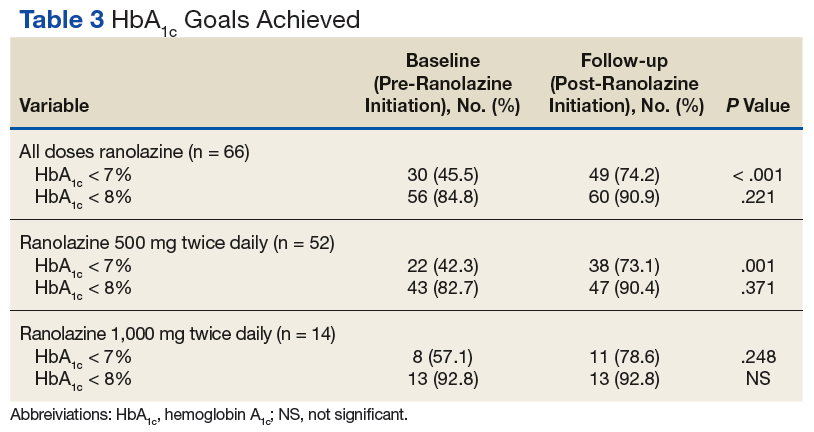
Hypoglycemia was not reported in a majority of study patient progress notes; thus, it was not evaluated further.
Discussion
In this study of a veteran population, ranolazine was associated with an HbA1c decrease of 0.3%. This change is less than that observed in previous studies, which may be related to a lower baseline HbA1c for the patients in this study. In addition, a greater percentage of veterans achieved an HbA1c < 7% after initiation of ranolazine compared with that of the baseline.
To the authors’ knowledge, this is the first study evaluating ranolazine and HbA1c in a veteran population. It also is the first study to demonstrate an association between HbA1c lowering and ranolazine at a dose of 500 mg twice daily. These results suggest that in patients with chronic angina and type 2 DM, ranolazine could potentially play a dual role in therapy.
Limitations
The authors recognize several limitations in this study. Given its observational design, it cannot be definitively concluded that the decrease in HbA1c was due to the initiation of ranolazine. While excluding patients with changes to their antidiabetic medication regimen was done in an effort to minimize confounding factors, it is possible that other factors, such as lifestyle, also could explain changes in HbA1c. It is possible that changes to the DM medication regimen were made but not documented in the EHR. In addition, information on hypoglycemia was not readily available; thus, the safety of ranolazine among patients with DM could not be evaluated fully. Finally, the patient population characteristics may limit external validity.
Conclusion
In this observational study, ranolazine was associated with a statistically significant decrease in HbA1c among veterans with DM, which supports previously published literature.9, 13-15 However, no randomized controlled trials have been performed specifically studying the impact of ranolazine on HbA1c among patient with DM. Ideally, future prospective, randomized placebo-controlled studies will take place to further evaluate the association between ranolazine use and HbA1c lowering.
1. Kannel WB, McGee DL. Diabetes and cardiovascular disease—the Framingham study. JAMA. 1979;241(19): 2035-2038.
2. Selvin E, Coresh J, Golden SH, Boland LL, Brancati FL, Steffes MW; Atherosclerosis risk in communities study. Glycemic control, atherosclerosis, and risk factors for cardiovascular disease in individuals with diabetes: the atherosclerosis risk in communities study. Diabetes Care. 2005;28(8):1965-1973.
3. Writing Group Members, Mozaffarian D, Benjamion EJ, et al; American Heart Association Statistics Committee and Stroke Statistics Subcommittee. Heart disease and stroke statistics—2016 update: a report from the American Heart Association. Circulation. 2016;133(4):e38-e360.
4. Conaway DG, O’Keefe JH, Reid KJ, Spertus J. Frequency of undiagnosed diabetes mellitus in patients with acute coronary syndrome. Am J Cardiol. 2005;96(3):363-365.
5. Hiatt WR, Kaul S, Smith RJ. The cardiovascular safety of diabetes drugs—insights from the rosiglitazone experience. N Engl J Med. 2013;369(14):1285-1287.
6. Ning Y, Zhen W, Fu Z, et al. Ranolazine increases β-cell survival and improves glucose homeostasis in low-dose streptozotocin-induced diabetes in mice. J Pharmacol Exp Ther. 2011;337(1):50-58.
7. Ranexa [package insert]. Foster City, CA: Gilead Sciences Inc; 2016.
8. Chaitman BR, Pepine CJ, Parker JO, et al; Combination Assessment of Ranolazine In Stable Angina (CARISA) Investigators. Effects of ranolazine with atenolol, amlodipine, or diltiazem on exercise tolerance and angina frequency in patients with severe chronic angina: a randomized controlled trial. JAMA. 2004;291(3):309-316.
9. Timmis AD, Chaitman BR, Crager M. Effects of ranolazine on exercise tolerance and HbA1c in patients with chronic angina and diabetes. Eur Heart J. 2006;27(1):42-48.
10. Morrow DA, Scirica BM, Karwatowska-Prokopczuk E, et al; MERLIN-TIMI 36 Trial Investigators. Effects of ranolazine on recurrent cardiovascular events in patients with non-ST-elevation acute coronary syndromes: the MERLIN-TIMI 36 randomized trial. JAMA. 2007;297(16):1775-1783.
11. Kosiborod M, Arnold SV, Spertus JA, et al. Evaluation of ranolazine in patients with type 2 diabetes mellitus and chronic stable angina: results from the TERISA randomized clinical trial (Type 2 Diabetes Evaluation of Ranolazine in Subjects With Chronic Stable Angina). J Am Coll Cardiol. 2013;61(20):2038-2045.
12. Arnold SV, McGuire DK, Spertus JA, et al. Effectiveness of ranolazine in patients with type 2 diabetes mellitus and chronic stable angina according to baseline hemoglobin A1c. Am Heart J. 2014;168(4):457-465.e2.
13. Morrow DA, Scirica BM, Chaitman BR, et al; MERLIN-TIMI 36 Trial Investigators. Evaluation of the glycometabolic effects of ranolazine patients with and without diabetes mellitus in the MERLIN-TIMI 36 randomized controlled trial. Circulation. 2009;119(15):2032-2039.
14. Chisholm JW, Goldfine AB, Dhalla AK, et al. Effect of ranolazine on A1c and glucose levels in hyperglycemic patients with non-ST elevation acute coronary syndrome. Diabetes Care. 2010;33(6):1163-1168.
15. Eckel RH, Henry RR, Yue P, et al. Effect of ranolazine monotherapy on glycemic control in subjects with type 2 diabetes. Diabetes Care. 2015;38(7):1189-1196.
Diabetes mellitus (DM) is a risk factor for cardiovascular disease(CVD).1-4 Death rates from heart disease are 2- to 4-times higher among adults with DM compared with those of adults without DM. In the US, it is estimated that 21.1 million adults have diagnosed DM, 8.1 million adults have undiagnosed DM, and 80.8 million adults have prediabetes.3 The American Heart Association has identified an untreated fasting blood glucose level < 100 mg/dL as a component of ideal cardiovascular health.3
Although the use of antidiabetic agents has been shown to reduce the risks of microvascular complications among patients with DM, a cardiovascular benefit has not been consistently demonstrated with all available agents, and some used in the treatment of DM are associated with cardiovascular harm.5 In addition, some cardiovascular medications may contribute to the development of DM or may mask the symptoms of hypoglycemia.6 Given the risk for CVD among patients with DM, a medication with utility in both DM and CVD could be beneficial.
Evidence for Use of Ranolazine
Ranolazine is indicated for the treatment of chronic angina.7 In clinical trials, ranolazine also was found to decrease hemoglobin A1c (HbA1c).8-15 The possible mechanisms for lowering HbA1c with ranolazine include preservation of pancreatic β-cells and an increase in glucose-dependent insulin secretion.6 The most common adverse effects associated with ranolazine include dizziness, headache, constipation, and nausea.7
Ranolazine has been shown to be efficacious and safe in the reduction of angina symptoms among patients with and without DM.8-12 In addition to improving symptoms of angina, studies have demonstrated a reduction in HbA1c among patients taking ranolazine.9,13-15 In an open-label extension of the Combination Assessment of Ranolazine in Stable Angina (CARISA) trial, ranolazine 750 mg twice daily and 1,000 mg twice daily led to a greater reduction in HbA1c when each was compared with placebo (-0.48% HbA1c, P = .008; and -0.70% HbA1c, P = .001, respectively).9
Among the 5,576 patients enrolled in the Metabolic Efficiency With Ranolazine for Less Ischemia in Non-ST-Elevation Acute Coronary Syndromes—Thrombolysis in Myocardial Infarction 36 (MERLIN-TIMI 36) trial with a baseline HbA1c, ranolazine significantly reduced HbA1c at 4 months when compared with placebo among patients with and without DM.13 In addition, patients with DM who were treated with ranolazine were more likely to achieve a HbA1c < 7% at 4 months when compared with placebo (59% vs 49%; P < .001). Ranolazine was not found to increase the incidence of hypoglycemia.
A subgroup analysis of MERLIN-TIMI 36 evaluated the effects of ranolazine compared with those of placebo on fasting plasma glucose and HbA1c in patients with moderate DM (HbA1c ≥ 6% but < 8%, fasting plasma glucose < 250 mg/dL) and severe DM (A1c ≥ 8%, fasting plasma glucose 150-400 mg/dL).14 A significant reduction in HbA1c with ranolazine in addition to standard of care antidiabetes treatment was observed among both groups. The placebo-corrected decrease in HbA1c in the moderate DM group was 0.28% (95% confidence interval [CI] -0.55 to 0; P = .045) and in the severe DM group was 0.59% (95% CI -0.99 to -0.20; P < .001).
In a trial designed to evaluate change in HbA1c in patients taking ranolazine 1,000 mg twice daily compared with that of placebo, ranolazine led to a greater decrease in HbA1c compared with that of placebo (placebo corrected change in HbA1c -0.56%, P = .001).15 In addition, a higher percentage of patients achieved HbA1c < 7% at 24 weeks in the ranolazine group compared with that of placebo (41.2% vs 25.7%; P = .001). No patient experienced severe hypoglycemia or had documented hypoglycemia in this study.
These trials suggest that ranolazine, in addition to decreasing anginal events, is potentially beneficial in achieving better control of DM. However, more studies are needed to determine this benefit. In addition, no trials have examined the 500-mg twice daily dose of ranolazine in HbA1c reduction.
The purpose of this study was to evaluate the change in HbA1c among veterans with DM after the initiation of ranolazine. The study compared the percentage of veterans achieving HbA1c < 7% or < 8% after initiation of ranolazine with the baseline, to determine whether there is a dose-related change in HbA1c among different ranolazine regimens and to determine whether there is a change in the incidence of hypoglycemia after the initiation of ranolazine.
Methods
This was a multicenter, retrospective study. The institutional review board and research and development committee for 3 Veterans Affairs medical centers (VAMCs) approved this study and waived informed consent. Additionally, this study was approved for access to national patient information through the Corporate Data Warehouse (CDW).
Subjects were eligible for inclusion in this study if they were aged ≥ 18 years, had a diagnosis of type 2 DM, and received their first prescription of ranolazine at a VAMC from January 1, 2008 through March 31, 2015. Exclusion criteria included subjects with no baseline HbA1c (defined as the HbA1c result closest to the ranolazine initiation date and within 90 days before to 14 days after ranolazine initiation), no follow-up HbA1c (defined as the first HbA1c result within 60 to 180 days after the ranolazine initiation date), any change to their DM medication regimen during the follow-up period, or who discontinued ranolazine prior to collection of the follow-up HbA1c.
Data were collected from the electronic health record (EHR) for each subject from 6 months prior to the ranolazine initiation date through 6 months after the ranolazine initiation date. The ranolazine initiation date was defined as the date ranolazine was picked up in person at a VAMC pharmacy or 7 days after the date filled for medications sent by mail.
The primary endpoint of this study was the change in HbA1c after ranolazine initiation. The secondary endpoint was the percentage of study subjects achieving HbA1c < 7% and < 8% before and after the initiation of ranolazine.
To achieve 80% power to detect a change in HbA1c of 0.4%, a sample size of 52 patients was required. For the primary endpoint, a paired t test was used to test for statistical significance. The McNemar test was used to evaluate for a significant change in subjects achieving an HbA1c < 7% and HbA1c < 8% with the initiation of ranolazine.
Results
A total of 523 patients were evaluated for study inclusion, of which 66 patients were included (Figure). The most common reasons for exclusion included no HbA1c at baseline and changes to the DM medication regimen during follow-up.
Ranolazine at any dose was associated with a change in HbA1c of -0.3% (P < .001).
A dose of 500 mg ranolazine twice daily also was associated with a significant decrease in HbA1c by 0.3% (P = .001). A significant increase in veterans achieving HbA1c < 7% after ranolazine initiation was observed (42.3% before ranolazine initiation vs 73.1% after ranolazine initiation; P = .001), and a nonsignificant increase in veterans achieving HbA1c < 8% was observed (82.7% before ranolazine initiation vs 90.4% after ranolazine initiation, P = .37).
At a dose of 1,000 mg twice daily, a 0.4% decrease in HbA1c was observed. However, this result was not found to be statistically significant (P = .09), and the study was underpowered to detect a significant change in HbA1c at this dose.
Hypoglycemia was not reported in a majority of study patient progress notes; thus, it was not evaluated further.
Discussion
In this study of a veteran population, ranolazine was associated with an HbA1c decrease of 0.3%. This change is less than that observed in previous studies, which may be related to a lower baseline HbA1c for the patients in this study. In addition, a greater percentage of veterans achieved an HbA1c < 7% after initiation of ranolazine compared with that of the baseline.
To the authors’ knowledge, this is the first study evaluating ranolazine and HbA1c in a veteran population. It also is the first study to demonstrate an association between HbA1c lowering and ranolazine at a dose of 500 mg twice daily. These results suggest that in patients with chronic angina and type 2 DM, ranolazine could potentially play a dual role in therapy.
Limitations
The authors recognize several limitations in this study. Given its observational design, it cannot be definitively concluded that the decrease in HbA1c was due to the initiation of ranolazine. While excluding patients with changes to their antidiabetic medication regimen was done in an effort to minimize confounding factors, it is possible that other factors, such as lifestyle, also could explain changes in HbA1c. It is possible that changes to the DM medication regimen were made but not documented in the EHR. In addition, information on hypoglycemia was not readily available; thus, the safety of ranolazine among patients with DM could not be evaluated fully. Finally, the patient population characteristics may limit external validity.
Conclusion
In this observational study, ranolazine was associated with a statistically significant decrease in HbA1c among veterans with DM, which supports previously published literature.9, 13-15 However, no randomized controlled trials have been performed specifically studying the impact of ranolazine on HbA1c among patient with DM. Ideally, future prospective, randomized placebo-controlled studies will take place to further evaluate the association between ranolazine use and HbA1c lowering.
1. Kannel WB, McGee DL. Diabetes and cardiovascular disease—the Framingham study. JAMA. 1979;241(19): 2035-2038.
2. Selvin E, Coresh J, Golden SH, Boland LL, Brancati FL, Steffes MW; Atherosclerosis risk in communities study. Glycemic control, atherosclerosis, and risk factors for cardiovascular disease in individuals with diabetes: the atherosclerosis risk in communities study. Diabetes Care. 2005;28(8):1965-1973.
3. Writing Group Members, Mozaffarian D, Benjamion EJ, et al; American Heart Association Statistics Committee and Stroke Statistics Subcommittee. Heart disease and stroke statistics—2016 update: a report from the American Heart Association. Circulation. 2016;133(4):e38-e360.
4. Conaway DG, O’Keefe JH, Reid KJ, Spertus J. Frequency of undiagnosed diabetes mellitus in patients with acute coronary syndrome. Am J Cardiol. 2005;96(3):363-365.
5. Hiatt WR, Kaul S, Smith RJ. The cardiovascular safety of diabetes drugs—insights from the rosiglitazone experience. N Engl J Med. 2013;369(14):1285-1287.
6. Ning Y, Zhen W, Fu Z, et al. Ranolazine increases β-cell survival and improves glucose homeostasis in low-dose streptozotocin-induced diabetes in mice. J Pharmacol Exp Ther. 2011;337(1):50-58.
7. Ranexa [package insert]. Foster City, CA: Gilead Sciences Inc; 2016.
8. Chaitman BR, Pepine CJ, Parker JO, et al; Combination Assessment of Ranolazine In Stable Angina (CARISA) Investigators. Effects of ranolazine with atenolol, amlodipine, or diltiazem on exercise tolerance and angina frequency in patients with severe chronic angina: a randomized controlled trial. JAMA. 2004;291(3):309-316.
9. Timmis AD, Chaitman BR, Crager M. Effects of ranolazine on exercise tolerance and HbA1c in patients with chronic angina and diabetes. Eur Heart J. 2006;27(1):42-48.
10. Morrow DA, Scirica BM, Karwatowska-Prokopczuk E, et al; MERLIN-TIMI 36 Trial Investigators. Effects of ranolazine on recurrent cardiovascular events in patients with non-ST-elevation acute coronary syndromes: the MERLIN-TIMI 36 randomized trial. JAMA. 2007;297(16):1775-1783.
11. Kosiborod M, Arnold SV, Spertus JA, et al. Evaluation of ranolazine in patients with type 2 diabetes mellitus and chronic stable angina: results from the TERISA randomized clinical trial (Type 2 Diabetes Evaluation of Ranolazine in Subjects With Chronic Stable Angina). J Am Coll Cardiol. 2013;61(20):2038-2045.
12. Arnold SV, McGuire DK, Spertus JA, et al. Effectiveness of ranolazine in patients with type 2 diabetes mellitus and chronic stable angina according to baseline hemoglobin A1c. Am Heart J. 2014;168(4):457-465.e2.
13. Morrow DA, Scirica BM, Chaitman BR, et al; MERLIN-TIMI 36 Trial Investigators. Evaluation of the glycometabolic effects of ranolazine patients with and without diabetes mellitus in the MERLIN-TIMI 36 randomized controlled trial. Circulation. 2009;119(15):2032-2039.
14. Chisholm JW, Goldfine AB, Dhalla AK, et al. Effect of ranolazine on A1c and glucose levels in hyperglycemic patients with non-ST elevation acute coronary syndrome. Diabetes Care. 2010;33(6):1163-1168.
15. Eckel RH, Henry RR, Yue P, et al. Effect of ranolazine monotherapy on glycemic control in subjects with type 2 diabetes. Diabetes Care. 2015;38(7):1189-1196.
Lower glucose target linked to improved mortality in critically ill
compared with patients with a target of 90-140 mg/dL, according to results of a retrospective cohort analysis.
With the computerized intravenous insulin protocol used in the study, the strict target could be achieved with a low rate of hypoglycemia, the authors wrote. The analysis was published in the journal CHEST®.
However, it does raise the possibility that earlier investigations finding an association between intensive insulin therapy and excess mortality “may have been accurate only in the setting of technologies which led to high rates of severe hypoglycemia,” they wrote.
The retrospective cohort analysis by Dr. Hersh and his colleagues included 1,809 adult patients treated at three different ICUs in two hospitals between January 2010 and December 2015. Treatment was delivered with a computerized ICU insulin infusion protocol that allows clinicians to choose between two blood glucose targets: 80-110 mg/dL or 90-140 mg/dL. The lower target was chosen for 951 patients, and the moderate target for 858 patients.
The most common primary admission diagnoses in the cohort included chest pain or acute coronary syndrome in 43.3%, cardiothoracic surgery in 31.9%, heart failure (including cardiogenic shock) in 6.8%, and vascular surgery in 6.0%.
While patients in the low blood glucose target group had a higher rate of moderate hypoglycemia, both groups had a low rate of severe hypoglycemia, at 1.16% in the low target group and 0.35% in the moderate target group (P = .051).
Unadjusted 30-day mortality was significantly lower in the 80-110–mg/dL group compared with the 90-140–mg/dL group (4.3% vs. 9.2%, respectively; P less than .001), according to the investigators.
Furthermore, logistic regression analysis showed that patients treated with a target of 80-110 mg/dL had a lower risk of 30-day mortality compared with patients with a target of 90-140 mg/dL (odds ratio 0.65; 95% confidence interval, 0.43-0.98; P = .04).
These results advance the debate over appropriate blood glucose targets in critically ill patients, as they suggest that the effects of targeting blood glucose and the effects of severe hypoglycemia “can be separated,” the investigators wrote.
Current guidelines on intensive insulin therapy are based in part on findings of the NICE-SUGAR trial, which found that among adults treated in the ICU, intensive glucose control increased mortality. However, a post hoc analysis suggested the mortality increase in NICE-SUGAR was “largely driven by a significant incidence of moderate hypoglycemia, and to a greater degree severe hypoglycemia,” Dr. Hersh and his coauthors noted in their report.
“Given improvements in insulin delivery and glucose monitoring, a reassessment of potential benefits of [intensive insulin therapy] should once again be evaluated in a prospective randomized trial,” they wrote.
Dr. Hersh and his coauthors declared no financial or nonfinancial disclosures related to the study.
SOURCE: Hersh AM et al. CHEST 2018. doi: 10.1016/j.chest.2018.04.025.
FROM THE JOURNAL CHEST®
Key clinical point: Among critically ill cardiac and cardiothoracic patients, a lower glucose target was associated with improved 30-day mortality.
Major finding: Patients treated with a target of 80-110 mg/dL had a lower risk of 30-day mortality compared with patients with a target of 90-140 mg/dL (odds ratio 0.65; 95% confidence interval, 0.43-0.98; P = .04).
Study details: A retrospective cohort analysis of 1,809 adult patients treated at three ICUs from two hospitals between January 2010 and December 2015.
Disclosures: The authors declared no disclosures.
Source: Hersh AM et al. CHEST 2018. doi: 10.1016/j.chest.2018.04.025.
Early endovenous ablation speeds venous ulcer healing
Intervening early with endovenous ablation in patients with venous leg ulcers could significantly improve ulcer healing times and delay their recurrence, new research has found.
A randomized study presented at the International Charing Cross Symposium and published simultaneously in the April 24 issue of the New England Journal of Medicine compared the effects of early endovenous ablation with those of deferred ablation in 450 patients with venous leg ulcers, all of whom also received compression therapy.
The study showed that patients who received endovenous ablation within 2 weeks of randomization had significantly shorter healing times, compared with patients whose ablation was deferred for 6 months or until after the ulcer healed.
In the early-treatment group, the median time to ulcer healing was 56 days, while in the deferred-treatment group, it was 82 days. By 12 months, 93.8% of the early-intervention group had healed ulcers, compared with 85.8% in the deferred-intervention group.
Even after adjustment for factors such as patient age, ulcer size, ulcer duration, and recruitment center, patients who received early endovenous ablation were 38% more likely to have healed by 12 months, compared with the deferred-intervention group.
Researchers also saw significantly higher healing rates at 12 weeks in the early-intervention group, compared with the deferred-intervention group (63.5% vs. 51.6%, respectively).
“Observational studies have suggested that endovenous treatment of varicose veins – a treatment that may be particularly appropriate for the elderly population with venous leg ulcers – may improve ulcer healing,” wrote Manjit S. Gohel, MD, from the Cambridge (United Kingdom) University Hospitals NHS Foundation Trust and from Imperial College London and his coauthors. “In the current trial, we found that faster ulcer healing can be attained if an endovenous intervention is performed promptly.”
Early endovenous ablation also was associated with a delay in the recurrence of ulcers. The rate of recurrence was 11.4% among patients in the early-intervention group whose ulcers had healed and 16.5% among those in the delayed-intervention group whose ulcers had healed.
Patients who received the early endovenous ablation had a median ulcer-free time of 306 days, compared with 278 days in the delayed-intervention group, a significant difference.
The authors noted that all patients in the study also received high-quality compression therapy, which may account for the good healing rates seen in both groups that might not otherwise be observed in a real-world clinical setting.
“Accordingly, the improvement in ulcer healing with early endovenous intervention is likely to be greater in clinical practice than was observed in this trial,” the authors wrote. “Because endovenous intervention is usually performed as a single procedure, the clinical benefits are likely to be less dependent on ongoing patient adherence than they would be with compression therapy.”
The most common method for endovenous ablation used in this multicenter study was ultrasound-guided foam sclerotherapy, a minimally-invasive procedure the authors said had versatility and acceptability.
However, they commented that some previous, large randomized trials have suggested that the rates of complete venous occlusion are lower with foam sclerotherapy than with thermal ablation.
The main complications seen with endovenous ablation were pain and deep vein thrombosis.
The authors pointed out that two limitations of their trial were that patients with a leg ulcer that had been present for more than 6 months were excluded from patient selection and that the 450 patients enrolled had been selected from a larger group of around 6,500.
The study was supported by a grant from the National Institute for Health Research Health Technology Assessment Program. One author declared grants from a pharmaceutical company outside the submitted work, and seven declared funding from the NIHR as part of the conduct of the study. No other conflicts of interest were declared.
SOURCE: Gohel MS et al. NEJM. 2018 April 24. doi: 10.1056/NEJMoa1801214
Finally! A randomized controlled trial (RCT) which proves what we all kind of expected but which until now was unsupported by available literature. That is that endovenous ablation (EVA) in the presence of a concomitant venous ulcer not only decreases ulcer recurrence rates and increases ulcer-free time, it also significantly hastens ulcer healing times. I don’t know about you, but it always made sense to me that treatment of an incompetent saphenous vein, a known cause of ulceration, could be a factor in the time to ulcer healing.
But that’s what a whole host of retrospective and or nonrandomized studies seemed to suggest: Garbage in, garbage out. Enter the RCT – Issue resolved? Yes, with some caveats, and maybe no.
First, as the authors readily admit, the compression therapy which was applied to patients in both arms of the study was of “high quality” and would not likely be reproduced in real world practice. The authors also suggest that, in a real-world, clinical practice, the benefits of early EVA may prove to be even more pronounced because of poor patient compliance with compression. Not sure about that. In fact, if – in a real-world setting – the rate of compliance with compression in both groups turned out to be less than optimal, particularly in the patients who had EVA, the benefits of early ablation with respect to ulcer healing times might disappear.
In other words, we do not know from this study whether there would be the same advantages to early saphenous vein intervention without the addition of compression as compared with compression alone. This might explain why shorter ulcer healing times of EVA have been difficult to prove in non-RCT, more real-world studies. Perhaps a randomized trial comparing ulcer healing times with early EVA without compression versus compression therapy only? Hmmm.
Also, would the outcomes of the current study be similar on this side of the pond? Only 31.7% of limbs were treated with endothermal ablation only, by far the most common form of ablation performed in the United States. Almost 65% of limbs in the study were ablated with either foamed sclerotherapy alone or in conjunction with endothermal or mechanical modalities – not a common form of treatment here in the colonies. Inexplicably, the authors do not indicate whether outcomes were in any way influenced by the type of ablation performed. I am going to assume for now that it did not.
In summary, this study does not answer all the questions related to the use of EVA for the treatment of venous ulcers, but it comes pretty close. My take away is that there is no downside (or none that I can think of) to the use of EVA early on in the treatment of venous ulcers but a whole lot of potential upside for the patient. Now I, and probably you, have proof that what we were already doing really does have some increased benefit. Finally!
Alan M Dietzek, MD, is the Linda and Stephen R. Cohen Chair in Vascular Surgery at Danbury (Conn.) Hospital and a clinical professor of surgery at the University of Vermont, Burlington. He is also an associate medical editor for Vascular Specialist.
Intervening early with endovenous ablation in patients with venous leg ulcers could significantly improve ulcer healing times and delay their recurrence, new research has found.
A randomized study presented at the International Charing Cross Symposium and published simultaneously in the April 24 issue of the New England Journal of Medicine compared the effects of early endovenous ablation with those of deferred ablation in 450 patients with venous leg ulcers, all of whom also received compression therapy.
The study showed that patients who received endovenous ablation within 2 weeks of randomization had significantly shorter healing times, compared with patients whose ablation was deferred for 6 months or until after the ulcer healed.
In the early-treatment group, the median time to ulcer healing was 56 days, while in the deferred-treatment group, it was 82 days. By 12 months, 93.8% of the early-intervention group had healed ulcers, compared with 85.8% in the deferred-intervention group.
Even after adjustment for factors such as patient age, ulcer size, ulcer duration, and recruitment center, patients who received early endovenous ablation were 38% more likely to have healed by 12 months, compared with the deferred-intervention group.
Researchers also saw significantly higher healing rates at 12 weeks in the early-intervention group, compared with the deferred-intervention group (63.5% vs. 51.6%, respectively).
“Observational studies have suggested that endovenous treatment of varicose veins – a treatment that may be particularly appropriate for the elderly population with venous leg ulcers – may improve ulcer healing,” wrote Manjit S. Gohel, MD, from the Cambridge (United Kingdom) University Hospitals NHS Foundation Trust and from Imperial College London and his coauthors. “In the current trial, we found that faster ulcer healing can be attained if an endovenous intervention is performed promptly.”
Early endovenous ablation also was associated with a delay in the recurrence of ulcers. The rate of recurrence was 11.4% among patients in the early-intervention group whose ulcers had healed and 16.5% among those in the delayed-intervention group whose ulcers had healed.
Patients who received the early endovenous ablation had a median ulcer-free time of 306 days, compared with 278 days in the delayed-intervention group, a significant difference.
The authors noted that all patients in the study also received high-quality compression therapy, which may account for the good healing rates seen in both groups that might not otherwise be observed in a real-world clinical setting.
“Accordingly, the improvement in ulcer healing with early endovenous intervention is likely to be greater in clinical practice than was observed in this trial,” the authors wrote. “Because endovenous intervention is usually performed as a single procedure, the clinical benefits are likely to be less dependent on ongoing patient adherence than they would be with compression therapy.”
The most common method for endovenous ablation used in this multicenter study was ultrasound-guided foam sclerotherapy, a minimally-invasive procedure the authors said had versatility and acceptability.
However, they commented that some previous, large randomized trials have suggested that the rates of complete venous occlusion are lower with foam sclerotherapy than with thermal ablation.
The main complications seen with endovenous ablation were pain and deep vein thrombosis.
The authors pointed out that two limitations of their trial were that patients with a leg ulcer that had been present for more than 6 months were excluded from patient selection and that the 450 patients enrolled had been selected from a larger group of around 6,500.
The study was supported by a grant from the National Institute for Health Research Health Technology Assessment Program. One author declared grants from a pharmaceutical company outside the submitted work, and seven declared funding from the NIHR as part of the conduct of the study. No other conflicts of interest were declared.
SOURCE: Gohel MS et al. NEJM. 2018 April 24. doi: 10.1056/NEJMoa1801214
FROM THE NEW ENGLAND JOURNAL OF MEDICINE
Key clinical point: Early endovenous ablation can speed healing of venous ulcers.
Major finding: Median ulcer healing time was 56 days with early venous ablation, compared with 82 days with deferred ablation.
Study details: Randomized controlled trial in 450 patients with venous leg ulcers.
Disclosures: The study was supported by a grant from the National Institute for Health Research Health Technology Assessment Program. One author declared grants from a pharmaceutical company outside the submitted work, and seven declared funding from the NIHR as part of the conduct of the study. No other conflicts of interest were declared.
Source: Gohel M et al. NEJM. 2018 April 24. doi: 10.1056/NEJMoa1801214
Glyburide failed to show noninferiority in gestational diabetes
A randomized, multicenter trial failed to find glyburide noninferior to insulin for treatment of gestational diabetes, investigators reported.
The composite rate of macrosomia, neonatal hypoglycemia, and hyperbilirubinemia was 27.6% with oral glyburide and 23.4% with subcutaneous insulin (P = .19) therapy, said Marie-Victoire Sénat, MD, PhD, of Hôpital Bicêtre in Paris, and her associates. The upper limit of the 97.5% confidence interval for the difference between groups was 10.5%, exceeding the prespecified noninferiority margin of 7%. “These findings do not justify the use of glyburide as first-line treatment,” the researchers wrote. The report was published online May 1 in JAMA.
Glyburide is a common add-on therapy for gestational diabetes in the United States but is not used regularly in Europe. The treatments exert similar glycemic control, but meta-analyses and recent studies have linked glyburide to increased rates of neonatal macrosomia and hypoglycemia. However, trials comparing glyburide with insulin focused on maternal glycemic control and thus “were not optimally designed to investigate neonatal complications,” the researchers wrote.
For the study, they randomly assigned 914 women whose gestational diabetes persisted despite dietary intervention to receive either 2.5 mg glyburide once daily or 4 IU to 20 IU insulin one to four times daily. Patients up-titrated treatment as needed based on self-measured blood glucose levels. Glyburide first was increased by 2.5 mg on day 4 and thereafter by 5 mg every 4 days in morning and evening doses to a daily maximum of 20 mg. Prandial insulin was increased by 2 IU every 2 days, while basal or intermediate insulin was dosed at 4 IU to 8 IU at bedtime and increased by 2 IU every 2 days.
The difference in the composite endpoint still exceeded 4% between groups even after the researchers controlled for multiparity and gestational age at treatment. Rates of each individual complication were higher with glyburide than with insulin, although only hypoglycemia reached statistical significance (12.2% for glyburide versus 7.2% for insulin; P = .02).
Maternal hypoglycemia affected 3.8% of the glyburide arm and 1% of the insulin arm (P = .02), and 72% of glyburide patients maintained good fasting glycemic control versus 63% of insulin recipients (P = .003). Also, 58% of glyburide recipients had good postprandial glucose control versus 49% of insulin recipients (P = .051).
Questionnaires indicated that patients were more likely to find glyburide tolerable and to report that they would use it again, if needed, during a future pregnancy (P less than .001 for between-group comparisons). “Although the data do not allow a conclusion that glyburide is not inferior to insulin in the prevention of perinatal complications, the results suggest that the increase in complications may be no more than 10.5% compared with insulin,” the investigators wrote. “This result should be balanced with the ease of use and better satisfaction with glyburide.”
Dr. Sénat reported having no conflicts of interest. One coinvestigator disclosed ties to Ferring Laboratories.
SOURCE: Sénat M-V et al. JAMA. 319(17):1773-80.
The researchers were “reasonable” to conclude that insulin should remain the first-line pharmacotherapy for gestational diabetes, according to Donald R. Coustan, MD, and Linda Barbour, MD, MSPH, whose editorial accompanied the study in JAMA.
“Use of glyburide may be most appropriate when insulin injections are not acceptable or practical,” they wrote. They suggested “frankly” counseling pregnant women about glyburide crossing the placenta and about “unanswered questions regarding long-term effects on offspring.”
Ideally, pregnant women should receive glyburide 1 hour before meals so that its effect peaks 3-4 hours later, according to the experts. But the study authors did not describe treatment timing with respect to meals, did not adjust initial dosing based on fasting or postprandial hyperglycemia, and only increased the dose every 4 days, they noted.
Although insulin was dosed much more flexibly, the glyburide group had better fasting glucose than did controls (72% vs. 63%; P = .003), the editorialists noted. Glyburide is most likely to succeed in younger women without fasting hyperglycemia and whose gestational diabetes begins later in pregnancy. Better dosing and patient selection might make glyburide more effective while also helping prevent maternal hypoglycemia and adverse perinatal outcomes, they contended.
Dr. Coustan is with Brown University, Providence, R.I. Dr. Barbour is with University of Colorado at Denver, Aurora. They reported having no conflicts of interest. These comments paraphrase their editorial ( JAMA. 2018;319[17]:1769-70 ).
A randomized, multicenter trial failed to find glyburide noninferior to insulin for treatment of gestational diabetes, investigators reported.
The composite rate of macrosomia, neonatal hypoglycemia, and hyperbilirubinemia was 27.6% with oral glyburide and 23.4% with subcutaneous insulin (P = .19) therapy, said Marie-Victoire Sénat, MD, PhD, of Hôpital Bicêtre in Paris, and her associates. The upper limit of the 97.5% confidence interval for the difference between groups was 10.5%, exceeding the prespecified noninferiority margin of 7%. “These findings do not justify the use of glyburide as first-line treatment,” the researchers wrote. The report was published online May 1 in JAMA.
Glyburide is a common add-on therapy for gestational diabetes in the United States but is not used regularly in Europe. The treatments exert similar glycemic control, but meta-analyses and recent studies have linked glyburide to increased rates of neonatal macrosomia and hypoglycemia. However, trials comparing glyburide with insulin focused on maternal glycemic control and thus “were not optimally designed to investigate neonatal complications,” the researchers wrote.
For the study, they randomly assigned 914 women whose gestational diabetes persisted despite dietary intervention to receive either 2.5 mg glyburide once daily or 4 IU to 20 IU insulin one to four times daily. Patients up-titrated treatment as needed based on self-measured blood glucose levels. Glyburide first was increased by 2.5 mg on day 4 and thereafter by 5 mg every 4 days in morning and evening doses to a daily maximum of 20 mg. Prandial insulin was increased by 2 IU every 2 days, while basal or intermediate insulin was dosed at 4 IU to 8 IU at bedtime and increased by 2 IU every 2 days.
The difference in the composite endpoint still exceeded 4% between groups even after the researchers controlled for multiparity and gestational age at treatment. Rates of each individual complication were higher with glyburide than with insulin, although only hypoglycemia reached statistical significance (12.2% for glyburide versus 7.2% for insulin; P = .02).
Maternal hypoglycemia affected 3.8% of the glyburide arm and 1% of the insulin arm (P = .02), and 72% of glyburide patients maintained good fasting glycemic control versus 63% of insulin recipients (P = .003). Also, 58% of glyburide recipients had good postprandial glucose control versus 49% of insulin recipients (P = .051).
Questionnaires indicated that patients were more likely to find glyburide tolerable and to report that they would use it again, if needed, during a future pregnancy (P less than .001 for between-group comparisons). “Although the data do not allow a conclusion that glyburide is not inferior to insulin in the prevention of perinatal complications, the results suggest that the increase in complications may be no more than 10.5% compared with insulin,” the investigators wrote. “This result should be balanced with the ease of use and better satisfaction with glyburide.”
Dr. Sénat reported having no conflicts of interest. One coinvestigator disclosed ties to Ferring Laboratories.
SOURCE: Sénat M-V et al. JAMA. 319(17):1773-80.
FROM JAMA
Key clinical point: A large trial failed to justify the use of glyburide as first-line therapy for gestational diabetes.
Major finding: Combined rates of macrosomia, neonatal hypoglycemia, and hyperbilirubinemia were 27.6% in the glyburide group and 23.4% in the insulin group (P = .19). The upper limit of the confidence interval for the difference between groups was 10.5%, exceeding the prespecified noninferiority margin of 7%.
Study details: Multicenter randomized trial of 914 women with gestational diabetes.
Disclosures: Dr. Sénat reported having no conflicts of interest. One coinvestigator disclosed ties to Ferring Laboratories.
Source: Sénat M-V et al. JAMA. 319(17):1773-80.
Commentary: Shifting the care delivery paradigm to diabetes-depression collaborative care models
Significant depressive symptoms affect approximately one in four adults with type 1 and type 2 diabetes while a formal diagnosis of depressive disorders is made in approximately 10%-15% of individuals with diabetes.1 The combination of diabetes and depression presents a major clinical challenge because the outcomes of each condition is worsened by the presence of the other, which results in worsened quality of life, impaired diabetes self-management, and poor clinical outcomes.1 While the costs of treatment are high for both individual patients and health economies, these costs do not necessarily result in significant improvements in disease or quality of life outcomes.1 This raises the question, “What is the best approach to managing patients with comorbid depression and diabetes?”

Strategies associated with at least a 0.5% reduction in hemoglobin A1c include team changes (–0.67%) and case management (–0.52%).2 The most effective team changes were those that included multidisciplinary, interactive teams with shared care between specialists and primary care providers.2 Such a collaborative care model that integrates specialty psychiatric care into primary care has been successfully demonstrated for patients with depression and poorly controlled type 2 diabetes or coronary heart disease.3
In this study, patients at 14 primary care clinics in an integrated health care system in Washington State received either a multidisciplinary, team-based intervention or usual care.3 Components of the intervention in these clinics included the following:
- Three part-time registered nurses who had diabetes education training (certified diabetes educators), as well as training on depression management, behavioral strategies, and glycemic, hypertension, and lipid control.
- Combined support for self-care with pharmacotherapy to control depression, hyperglycemia, hypertension, and hyperlipidemia with algorithm guidance.
- Motivational and encouraging coaching for problem-solving and adherence to self-care.
- Weekly nurse supervision with a psychiatrist, primary care physician, and psychologist, with a nurse communicating recommendations back to the primary care team.
An endocrinologist/diabetologist was also incorporated for consultation when needed. After 12 months, patients in the intervention group had greater reduction in hemoglobin A1c (0.58%), LDL cholesterol (6.9 mg/dL), systolic blood pressure (5.1 mm Hg), and depression scores than did those in the usual care group. Patients in the intervention group were also more likely to have adjustments made to insulin, antihypertensive medications, and antidepressants.
The success of this intervention, known as TEAMCare, highlights the critical need to incorporate mental health care into primary care and endocrinology practice. Currently, psychiatric and psychological care are largely administered separately from medical care for diabetes, despite evidence showing the success of an integrated care delivery model. In order to address the important interaction between mental health disorders, such as depression, and diabetes, it is critical that evaluation and treatment of mental health be integrated into medical practice.
What can we – endocrinologists and psychiatrists – do to facilitate adoption of such models? First, we can lobby our health systems to support reorganization of our health care delivery approach for patients with comorbid depression and diabetes so that endocrinologists, psychiatrists, and behavioral specialists are incorporated into primary care practices. This will facilitate better alignment of specialists and primary care providers and also enable patients to receive care in a clinical environment where they are most comfortable and have established relationships. Instead of the primary care physician referring the patient separately to psychiatry and endocrinology and awaiting feedback, which can sometimes take several weeks, the psychiatrist and endocrinologist would meet weekly with the primary care physician and nurse case manager team to review the entire patient panel, make timely adjustments in diabetes and antidepressant medications, and recommend behavioral therapy. This population health strategy would enable our two specialties to make a greater impact on a larger number of patients than we can in a half-day clinic session.
Second, our other critical role is to collaborate with payers to develop a sustainable financial reimbursement model to support the psychiatrist and endocrinologist in this novel health care delivery approach, which departs from the traditional fee-for-service model.
Finally, diabetes remains highly prevalent in the United States and worldwide, and depression is now a widely recognized comorbidity of diabetes. Many behavioral specialists are not trained to address the complexities of diabetes management experienced by patients who also have mental health comorbidities. To this end, the American Diabetes Association and the American Psychological Association established a partnership to build the ADA-APA Mental Health Provider Diabetes Education Program to prepare mental health providers with the knowledge and tools and treat diabetes-related psychosocial factors. Let us join them in supporting this important step toward developing diabetes-mental health collaborative health care delivery models.
Dr. Golden is the Hugh P. McCormick Family Professor of Endocrinology and Metabolism and executive vice-chair of the department of medicine at Johns Hopkins University, Baltimore.
References
1. Holt RIG et al. Current Diabetes Reports. 2014;14(6):491.
2. Shojania KG et al. JAMA. 2006;296(4):427-40.
3. Katon WJ et al. N Eng J Med. 2010;363(27):2611-20.
Significant depressive symptoms affect approximately one in four adults with type 1 and type 2 diabetes while a formal diagnosis of depressive disorders is made in approximately 10%-15% of individuals with diabetes.1 The combination of diabetes and depression presents a major clinical challenge because the outcomes of each condition is worsened by the presence of the other, which results in worsened quality of life, impaired diabetes self-management, and poor clinical outcomes.1 While the costs of treatment are high for both individual patients and health economies, these costs do not necessarily result in significant improvements in disease or quality of life outcomes.1 This raises the question, “What is the best approach to managing patients with comorbid depression and diabetes?”
Strategies associated with at least a 0.5% reduction in hemoglobin A1c include team changes (–0.67%) and case management (–0.52%).2 The most effective team changes were those that included multidisciplinary, interactive teams with shared care between specialists and primary care providers.2 Such a collaborative care model that integrates specialty psychiatric care into primary care has been successfully demonstrated for patients with depression and poorly controlled type 2 diabetes or coronary heart disease.3
In this study, patients at 14 primary care clinics in an integrated health care system in Washington State received either a multidisciplinary, team-based intervention or usual care.3 Components of the intervention in these clinics included the following:
- Three part-time registered nurses who had diabetes education training (certified diabetes educators), as well as training on depression management, behavioral strategies, and glycemic, hypertension, and lipid control.
- Combined support for self-care with pharmacotherapy to control depression, hyperglycemia, hypertension, and hyperlipidemia with algorithm guidance.
- Motivational and encouraging coaching for problem-solving and adherence to self-care.
- Weekly nurse supervision with a psychiatrist, primary care physician, and psychologist, with a nurse communicating recommendations back to the primary care team.
An endocrinologist/diabetologist was also incorporated for consultation when needed. After 12 months, patients in the intervention group had greater reduction in hemoglobin A1c (0.58%), LDL cholesterol (6.9 mg/dL), systolic blood pressure (5.1 mm Hg), and depression scores than did those in the usual care group. Patients in the intervention group were also more likely to have adjustments made to insulin, antihypertensive medications, and antidepressants.
The success of this intervention, known as TEAMCare, highlights the critical need to incorporate mental health care into primary care and endocrinology practice. Currently, psychiatric and psychological care are largely administered separately from medical care for diabetes, despite evidence showing the success of an integrated care delivery model. In order to address the important interaction between mental health disorders, such as depression, and diabetes, it is critical that evaluation and treatment of mental health be integrated into medical practice.
What can we – endocrinologists and psychiatrists – do to facilitate adoption of such models? First, we can lobby our health systems to support reorganization of our health care delivery approach for patients with comorbid depression and diabetes so that endocrinologists, psychiatrists, and behavioral specialists are incorporated into primary care practices. This will facilitate better alignment of specialists and primary care providers and also enable patients to receive care in a clinical environment where they are most comfortable and have established relationships. Instead of the primary care physician referring the patient separately to psychiatry and endocrinology and awaiting feedback, which can sometimes take several weeks, the psychiatrist and endocrinologist would meet weekly with the primary care physician and nurse case manager team to review the entire patient panel, make timely adjustments in diabetes and antidepressant medications, and recommend behavioral therapy. This population health strategy would enable our two specialties to make a greater impact on a larger number of patients than we can in a half-day clinic session.
Second, our other critical role is to collaborate with payers to develop a sustainable financial reimbursement model to support the psychiatrist and endocrinologist in this novel health care delivery approach, which departs from the traditional fee-for-service model.
Finally, diabetes remains highly prevalent in the United States and worldwide, and depression is now a widely recognized comorbidity of diabetes. Many behavioral specialists are not trained to address the complexities of diabetes management experienced by patients who also have mental health comorbidities. To this end, the American Diabetes Association and the American Psychological Association established a partnership to build the ADA-APA Mental Health Provider Diabetes Education Program to prepare mental health providers with the knowledge and tools and treat diabetes-related psychosocial factors. Let us join them in supporting this important step toward developing diabetes-mental health collaborative health care delivery models.
Dr. Golden is the Hugh P. McCormick Family Professor of Endocrinology and Metabolism and executive vice-chair of the department of medicine at Johns Hopkins University, Baltimore.
References
1. Holt RIG et al. Current Diabetes Reports. 2014;14(6):491.
2. Shojania KG et al. JAMA. 2006;296(4):427-40.
3. Katon WJ et al. N Eng J Med. 2010;363(27):2611-20.
Islet Transplantation Improves Diabetes-Related Quality of Life
Participants reported the greatest improvements in diabetes-related quality of life (QOL) and better overall health status even though they would need lifelong immune-suppressing drugs to prevent transplant rejection.
The study, conducted by the Clinical Islet Transplantation Consortium, involved 48 people with hypoglycemia unawareness who experienced frequent episodes of severe hypoglycemia despite receiving expert care. Each participant received at least 1 islet transplant.
One year after the first transplant, 42 participants (88%) were free of severe hypoglycemic events, had near-normal blood glucose control, and had restored awareness of hypoglycemia. About half of the recipients needed to continue on insulin to control blood glucose, but the reported improvements in QOL were similar between those who did and those who did not. The researchers say the elimination of severe hypoglycemia and the associated fears outweighed concerns about the need for continued insulin treatment.
Islet transplantation is investigational in the US. Although the results are promising, the National Institutes of Health cautions that the process is not appropriate for all patients with type 1 diabetes mellitus due to risks and adverse effects.
ACP issues 4 statements on T2DM treatment targets
Resource
Qaseem A, Wilt TJ, Kansagara D, et al, for the Clinical Guidelines Committee of the American College of Physicians. Hemoglobin A1c targets for glycemic control with pharmacologic therapy for nonpregnant adults with type 2 diabetes mellitus: a guidance statement update from the American College of Physicians. Ann Int Med. 2018; Mar 6. doi: 10.7326/M17-0939. [Epub ahead of print].

Metabolic syndrome scoring system predicts CVD in type 2 diabetes
CHICAGO – the system identified the association independent of hemoglobin A1c levels, according to work presented at the annual meeting of the Endocrine Society.
The findings may point toward an additional surveillance tool for coronary heart disease (CHD) in patients who have type 2 diabetes, according to Mark D. DeBoer, MD, and his coauthors, who had not previously applied the metabolic syndrome severity scoring system to individuals with diabetes.
When broken down by quartile, increasing severity of metabolic syndrome for individuals with type 2 diabetes was associated with an increased risk of future cardiovascular disease, even when blood glucose levels were not included in calculation of metabolic syndrome (P less than .001 with glucose levels and P = .001 without glucose levels).
Dr. DeBoer, of the department of pediatrics and the Child Health Research Center at the University of Virginia, Charlottesville, and his coinvestigators, had previously developed the continuous scoring system for metabolic syndrome. The system incorporates the components that form the diagnostic criteria for metabolic syndrome – waist circumference, systolic blood pressure, and levels of HDL cholesterol, triglycerides, and blood glucose.
However, rather than using cutoffs for a dichotomous score of 0 or 1 for each criterion, the investigators developed sex- and race/ethnicity-specific scores of severity. This approach may identify metabolic dysregulation that would not be apparent if measures of several different criteria were just short of missing the cutoff, for example.
“These scores are standardized like z scores such that 2.0 is two standard deviations above the mean,” wrote Dr. DeBoer and his colleagues. Thus, the scores are dubbed “MetS z scores;” a free online calculator is available.
In developing the model, the investigators performed single-factor confirmatory factor analyses using data from 6,870 adults from the National Health and Nutrition Examination Survey cohort, developing scores specific for non-Hispanic whites, non-Hispanic blacks, and Hispanics.
In the present work, MetS z scores were applied to data from the Atherosclerosis Risk in Communities (ARIC) study, which followed 8,660 participants aged 45-64 years for 12 years, with adjudicated follow-up for cardiovascular incidents up to 20 years. Only participants with no baseline CHD and with complete metabolic syndrome risk factor data were included.
Dr. DeBoer and his collaborators compared MetS z scores for patients who were never diagnosed with diabetes, those who had diabetes at baseline, and those who had an incident diagnosis of type 2 diabetes at the second, third, or fourth ARIC study visit. They found that individuals who entered ARIC with diabetes had the highest z scores, while those with incident type 2 diabetes had higher baseline scores, compared with those who never had a diabetes diagnosis. The difference in z scores was lowest for white men, while black men and women “exhibited increased scores after diagnosis, suggesting inadequate treatment,” wrote Dr. DeBoer and his colleagues.
The investigators also looked for an association between MetS z scores and the primary outcome measure, time to incident CHD, calculating the z score both with and without the inclusion of glucose levels.
Dr. DeBoer and his colleagues analyzed the association between MetS z score and CHD for patients with and without type 2 diabetes. They found metabolic syndrome severity as assessed by MetS z score was independently associated with increased risk for CHD in participants with diabetes (P = .001).
“We additionally assessed whether the [metabolic syndrome] z score predicted future CHD following adjustment for HbA1c and when using a similar score derived without glucose as a component,” wrote Dr. DeBoer and his collaborators.
When metabolic syndrome severity as assessed by z score was broken into quartiles, “increasing MetS severity (by quartile) increased the risk of future CVD [cardiovascular disease], both using the traditional 5-component MetS z score and the no-glucose score,” wrote Dr. DeBoer and his colleagues. “This continuous MetS severity z score confers risk for future CHD among individuals with type 2 diabetes, both with the traditional MetS score and a score without glucose. These findings were independent of HbA1c and may relate to risk associated with the pathophysiologic processes underlying MetS.”
The investigators plan to integrate an automated metabolic syndrome severity score calculator into the electronic medical record “to identify and track risk in individuals over time and identify those who may benefit from increased intervention,” wrote Dr. DeBoer and his collaborators.
The National Institutes of Health funded the study. Dr. DeBoer reported no relevant conflicts of interest.
SOURCE: DeBoer MD et al. ENDO 2018, Abstract SAT-015.
REPORTING FROM ENDO 2018
Key clinical point: Increasing metabolic syndrome severity was associated with increased risk for cardiovascular disease.
Major finding: Risk for future cardiovascular disease was upped with higher scores, even when glucose wasn’t considered (P = .001).
Study details: A retrospective analysis of Atherosclerosis Risk in Communities study data on 1,419 patients with and 7,241 patients without diabetes.
Disclosures: The National Institutes of Health sponsored the study. Dr. DeBoer reported no relevant conflicts of interest.
Source: DeBoer MD et al. ENDO 2018, Abstract SAT-015.