User login
Tick-borne Heartland virus circulating in U.S., researchers say
published in Emerging Infectious Diseases.
People can get the virus after being bitten by an infected tick, which can lead to hospitalization and death. The virus has also been found among deer and other wild mammals.
“Heartland is an emerging infectious disease that is not well understood,” Gonzalo Vazquez-Prokopec, PhD, the senior study author and an expert in vector-borne diseases at Emory University, Atlanta, said in a statement.
“We’re trying to get ahead of this virus by learning everything that we can about it before it potentially becomes a bigger problem,” he said.
Researchers at Emory and the University of Georgia analyzed virus samples from nearly 10,000 ticks collected in central Georgia. They found that about 1 out of every 2,000 specimens had the Heartland virus, including the adult and nymph stages.
The virus, which was first identified in Missouri in 2009, has been documented in several states across the Southeast and Midwest. There have been more than 50 cases in people from 11 states, according to the Centers for Disease Control and Prevention, with most cases requiring hospitalization. Most people diagnosed with the disease became sick from May to September, the CDC reported. Symptoms can be a high fever, fatigue, diarrhea, muscle pain, and low counts of white blood cells and platelets. It can take up to 2 weeks for symptoms to appear after a bite from an infected tick.
There are no vaccines or medications to prevent or treat the Heartland virus, according to the CDC. Doctors may be able to provide medications to improve symptoms. Overall, though, experts recommend that people avoid tick bites as much as possible, particularly during “high tick season” between April and September.
“You should be thinking about them almost any time of the year. It’s something that should be on everybody’s mind,” Jonathan Larson, PhD, an extension entomologist at the University of Kentucky, Lexington, told USA Today.
The CDC recognizes 18 tick-borne diseases in the United States, including Lyme disease, which has become the most common vector-borne disease in the country. The black-legged tick, also known as the deer tick, typically transmits the bacteria that causes Lyme disease.
But researchers are still studying how the Heartland virus spreads. In the latest study, they found the virus in the lone star tick, which is named for a distinctive white spot on its back and is the most common tick in Georgia. The tick is also widely distributed in wooded areas across the Southeast, Midwest, and Eastern United States.
The research team will now collect ticks across Georgia for testing to better understand what could raise the risk of getting the Heartland virus.
“We want to start filling in the huge gaps of knowledge of the transmission cycle for Heartland virus,” Dr. Vazquez-Prokopec said. “We need to better understand the key actors that transmit the virus and any environmental factors that may help it to persist within different habitats.”
A version of this article first appeared on WebMD.com.
FROM EMERGING INFECTIOUS DISEASES
More questions than answers when managing HIV and menopause
Note: In this article, “women” refers to ciswomen – those who identify as women and were assigned female sex at birth. Menopause also affects transmen and nonbinary people, but published research on the menopause experience has included only ciswomen participants.
Gina Brown was boarding an early morning flight in 2016 when suddenly she started to overheat. “As soon as I stepped on the plane, I immediately was drenched in sweat,” she said. Not knowing what to do, she stood still until a fellow female passenger noticed her alarm and asked a flight attendant to grab her a cup of ice. “Is this the first time this has happened to you?” the woman asked, and Ms. Brown nodded. “It’s called a hot flash,” the woman continued, “and you’re going to be okay.”
As soon as Ms. Brown returned from her trip, she visited her doctor for blood work and learned that her hormone levels were decreasing. “I knew something was going on, but [my provider and I] didn’t have a conversation about menopause,” she said. Ms. Brown, who is 56 years old, has been living with HIV for nearly 28 years, and is part of a growing group of women with HIV now entering menopause.
In 1996, a person diagnosed with HIV at 20 years of age could expect to live only to age 39. Because of antiretroviral therapy (ART), an HIV diagnosis is not nearly so dire. Now, someone with HIV who adheres to the ART regimen is estimated to have a lifespan close to that of the general population.
For women with HIV, this means going through menopause. Though this transition can be challenging for any woman, experiencing menopause with HIV adds another level of complication. On top of adhering to daily ART regimens, the woman must also deal with the hormonal changes of menopause and the symptoms that come with it. And the limited research in this area suggests that women with HIV and their clinicians may not be prepared.
“Those of us long-term survivors who have been around for a while never expected to be here, and I don’t think providers or the health care system expected us to be here,” said Vickie A. Lynn, PhD, 56, who has been living with HIV for 37 years and received an AIDS diagnosis in 1991. Her work focuses on health care interventions for people with HIV. “So now that we’re here, I don’t know that we have enough information or research to inform some of our treatment options.” Instead, these women are met with a series of unknowns due to limited studies and conflicting findings.
Earlier menopause?
The onset of menopause can be difficult to determine in women living with HIV, said Sara Looby, PhD, ANP-BC, a researcher at Massachusetts General Hospital and assistant professor of medicine at Harvard Medical School, both in Boston. Her research focuses on metabolic disorders, including bone loss, cardiovascular disease risk, and menopause in women living with HIV. This population is at an increased risk for amenorrhea, due to both behavioral and clinical factors, and sometimes this amenorrhea is mistakenly assumed to be menopause, she explained. A history of smoking, low weight, methadone use, or use of other psychotropic medications are common in women with HIV and can lead to missed periods. Some factors specific to HIV – including a low CD4 count and a history of an AIDS diagnosis – have also been linked to amenorrhea.
This is likely why research studies on the age of onset of menopause with women with HIV can reach conflicting conclusions. Some studies suggest that women with HIV tend to go through menopause 3-5 years earlier than women without HIV. Other studies suggest no difference in the age of onset in menopause between women living with and without HIV. But how menopause status has been accessed can vary from study to study, Dr. Looby said. Future research needs to consider participants’ complete menstrual and reproductive history, as well as relevant medical, social, and behavioral factors, she added, so that the findings are reliably capturing the age of onset of menopause rather than amenorrhea from other causes.
If menopause does occur earlier in women with HIV, there could be additional health implications. Estrogen regulates bone mass, and some research suggests the hormone may be cardioprotective. Estrogen is also thought to increase production of the neurotransmitter serotonin, which could affect mood and cognition. Women with HIV are already at higher risk for bone loss, cardiovascular disease, and depressed mood compared to women without HIV, Dr. Looby said, and as estrogen levels fall during menopause, these conditions may be deleteriously affected.
“If it is determined that women with HIV experience menopause at an earlier age, maybe early to mid-40s instead of 51 and older, they may be at increased risk for cardiovascular and bone conditions as well as mood symptoms associated with estrogen loss at an earlier age than women without HIV, which could be highly detrimental to their physical and mental health,” Dr. Looby said.
More frequent and severe menopausal symptoms?
Women with HIV may not only go through menopause earlier than women without HIV, but their symptoms may also be more frequent and more severe. In a 2017 study of both HIV-positive and HIV-negative Nigerian women, participants with HIV had more menopause symptoms overall and were three times as likely to report severe symptoms compared to women without HIV. A 2005 study conducted in New York found HIV-positive women were 24% more likely to report menopause symptoms compared to HIV-negative women in the study.
Looby’s own research has also found a similar pattern. In a study comparing 33 women with HIV to 33 women without HIV – all were close to menopause and matched for age, race, body mass index, and menstrual patterns – women with HIV reported more severe hot flashes and more days with hot flashes. These women also reported that their hot flashes interfered to a much greater degree with daily activities and quality of life compared to participants without HIV.
But studies of women with HIV who are entering menopause are rare, and most include only small numbers of women. As a result, many women with HIV do not know what to expect entering menopause. “I always say, I wish somebody would do some real research on HIV and menopause, because I want to know if it is worse for us or if it is the same,” said Ms. Brown, who works as the director of strategic partnership and community engagement at the Southern Aids Coalition in Powder Springs, Ga. “I would think it’s worse for me.”
More frequent and severe symptoms can have downstream effects, with some evidence suggesting that women with HIV who experience severe menopause symptoms are less likely to stick to their ART regimen. “There’s a clear picture emerging that menopausal symptoms in this group really matter,” said Shema Tariq, PhD, FRCP, an HIV physician-scientist at the University College London Institute for Global Health in England. “They really impact women’s well-being, as well as impacting their ability to look after their long-term condition.”
Providers wary of treating menopause symptoms in women with HIV
The little research we do have about women with HIV experiencing menopause suggests that this population could greatly benefit from treatment prescribed in women without HIV for menopause symptoms and conditions, including hormone replacement therapy (HRT). Women with HIV regularly experience night sweats and hot flashes during the menopause transition and may have more severe symptoms than women not living with the virus. If women with HIV also frequently enter early menopause (entering menopause before the age of 45), then this group meets two indications for hormone replacement therapy.
Despite the potential benefits of HRT in this population, some studies suggest this intervention is underutilized. In Dr. Tariq’s Positive Transitions through Menopause (PRIME) study, which explores how menopause affects more than 800 women living with HIV, only 8% of respondents reported using HRT. In a Canadian study that has not yet gone through peer review, 11.8% of perimenopausal and postmenopausal women reported ever using HRT, about half the rate of women in North America without HIV.
Provider discomfort with managing menopause-related care in women with HIV is one reason for such low HRT use in this population, Dr. Tariq said. In a survey of 88 general practitioners in the United Kingdom, nearly all (> 95%) respondents said they were comfortable managing menopause in a general population, but just 46% said they felt comfortable managing menopause in women with HIV. Their top concerns included the potential for drug-to-drug interactions between ART and HRT, missing an HIV-related diagnosis, and risks of menopausal hormone therapy in HIV. Nearly half of respondents (46%) said only specialists should be providing menopause-related care for women with HIV.
But specialists may also feel conflicted about managing menopause-related care in women with HIV, said Dr. Tariq. “If you’re looking at people who manage HIV, you’re looking primarily at infectious disease physicians and HIV physicians. We’re not trained as gynecologists. We’re not used to prescribing HRT,” she said. “And the problem is gynecologists aren’t used to managing HIV. They get nervous about prescribing anything when they see antiretroviral medication because all that people think of is a drug-drug interaction.”
This leaves women with HIV seeking care and treatment for menopause in a difficult situation, where they are “just being ping-ponged around between different health care providers,” said Susan Cole-Haley, 53, an HIV-activist in London who has been living with the virus for 23 years. “So many women with HIV have multiple health conditions and multiple health care providers, which can just make it really problematic and really exhausting in terms of getting help.”
Many unknowns
Providers may also be uncomfortable with prescribing hormone therapy because of alarming research in the early 2000s, which found that hormone replacement therapy increased the risk of breast cancer and cardiovascular disease. Later analyses have found no increased cardiovascular disease risk in women who were younger than 60 or were less than 10 years beyond the onset of menopause. Still, the “media frenzy” around the initial findings “has put off a whole load of patients and a whole load of clinicians from even thinking of HRT,” Dr. Tariq said.
Providers may be even more hesitant because people with HIV already have a higher risk for heart disease, due to behaviors such as smoking and HIV-specific factors. (Research has yet to tease out whether these cardiovascular effects are a result of the virus, a result of the antiretroviral therapy, or a result of both factors.) In addition, there have been no prospective studies looking directly at the efficacy and safety of hormone replacement therapy in women with HIV, so providers generally rely on the guidelines for the use of menopausal hormone therapy for women without HIV. While researchers from Canada and the United Kingdom have compiled recommendations for HRT in women with HIV, there is great need for a large-scale clinical trial to establish consistent guidelines for the use of HRT for women with HIV globally, Dr. Looby said.
There are also hormonal preparations and drug-to-drug interactions to consider, though none of the interactions identified so far rise to the level of contraindications. Because of how the liver metabolizes ART and HRT, hormone doses may need to be adjusted, or perhaps administered transdermally via a patch versus a pill form. (Estrogen delivered via skin patch may have reduced cardiovascular disease risk compared to other methods of delivery, some studies in women without HIV suggest.) These expected interactions are based on data from contraceptives, noted Elizabeth King, MD, whose research at the Women’s Health Research Institute at BC Women’s Hospital in Vancouver, B.C., focuses on menopause and HIV. Studies have not been done on drug-drug interactions between ART and HRT specifically, she said, and formulations for HRT are a bit different from contraceptives.
While these unknowns do need to be discussed in shared decision-making around starting HRT in women with HIV, they should not dissuade providers from considering the treatment, Dr. King said. “If women are having extremely troublesome symptoms, then withholding therapy that is potentially beneficial because of worries about some of the things we do not know – I don’t know if that is any better,” she said.
Many women with HIV may not want to start HRT – as was the case for Dr. Lynn. “I’ve taken a lot of medication in my time, and I really try to avoid it as much as possible,” she said. Uncertainties around drug interactions were the main concern for Dawn Averitt, 53, founder of the Well Project, an HIV nonprofit focused on women and girls. Ms. Averitt has lived with HIV for 34 years. “What if some of the things that I’m dealing with could be managed by HRT?” she said. “Or what if taking it exacerbates problems in a way that nobody knows to look for?” In this case, providers may work with patients to discuss nonhormonal treatment options for menopause symptom management.
While some women with HIV may not want HRT, “It’s important that women have that option, and from what we are seeing right now, not a lot of women are even being offered the therapy,” Dr. King said.
There are other nonhormonal treatments available for managing menopause symptoms, including selective serotonin reuptake inhibitors (SSRIs) as well as nonmedicinal interventions such as cognitive behavioral therapy, but these also have not been studied specifically in women with HIV.
The path forward
Dr. Tariq and Dr. Looby agreed the next step in expanding our knowledge around HIV and menopause should be to better engage women with HIV in research and clinical care around their experience with menopause. This includes studies on the symptoms they regularly experience and how these symptoms affect their quality of life, including their physical, psychological, cognitive, and social health. These studies could also help researchers and clinicians understand what these women with HIV want for their menopause care, whether that be medication, psychotherapy, and/or peer support groups. These interventions, whether pharmaceutical based or not, can then be assessed based on outcomes in women with HIV, Dr. Tariq noted.
Another important factor is increasing education, on both the patient and provider side, Dr. Looby said. Many women may not know what menopause is, what symptoms look like, and how these hormonal changes can affect their health. If providers keep an open dialogue with female patients around menopause throughout their adult care, that can better prepare women for the menopause transition and alert them to common symptoms they may experience. There also is a great need for provider education, Dr. Looby added. Infectious disease specialists may need further education on menopause management, while women’s health specialists may need additional training for managing care for patients with HIV. Ideally, this information could be shared among a team of providers, including infectious disease, primary care, and women’s health specialists, so that clinicians can collaborate in prescribing treatment for women with HIV, Dr. Looby said.
Lastly, there needs to be more research funding allocated toward answering questions related to menopause and HIV, including the age of onset of menopause in women with HIV, the severity of symptoms, how HIV may influence the menopause transition and vice versa, and regarding the effectiveness of treatment – pharmaceutical and nonpharmaceutical – for women with HIV going through the menopause transition. “If we don’t have funding for these studies, then we won’t have answers to establish clinical care guidelines necessary to support the health, well-being, and quality of life of women with HIV,” Dr. Looby said.
And the number of women living with HIV entering menopause is expected to keep growing, Dr. King added. “It was only a couple of decades ago when women were being told they wouldn’t even live to experience menopause, and now we are at a point where this is the highest proportion of menopausal women ever that we have seen in our HIV clinics,” she said. “It speaks to the success of antiretrovirals,” Dr. King acknowledged, but that also means identifying new challenges and addressing recognized gaps in care.
“We are charting a new course, in some ways,” she added. “There is a lot of work to be done.”
A version of this article first appeared on Medscape.com.
Moderna reports positive COVID-19 vaccine response in kids down to 6 months
Moderna on March 23 released interim results indicating that its mRNA-1273 COVID vaccine produced “robust” neutralizing antibody titers in children aged 6 months to 6 years – levels similar to those seen in adults.
Vaccine efficacy against infection was 43.7% in children aged 6 months to 2 years and 37.5% among children aged 2-6 years, the new data from its phase 2/3 KidCOVE study show.
The company explained the lower efficacy numbers by noting that its study involving these younger children was conducted during the Omicron wave. The same decrease in efficacy against infection was reported in adults during the Omicron surge.
A majority of COVID-19 cases were mild in the approximately 6,900 children aged 6 months to 6 years in the study. No severe COVID-19 cases, hospitalizations, or deaths were reported.
The primary series of two 25-mcg doses of the vaccine given 28 days apart was generally well tolerated. Most adverse events were mild to moderate. For example, temperature greater than 38° C (>100.4° F) was reported for 17.0% of the 6-month-old to 2-year-old group and for 14.6% of the 2- to 6-year-old group. A few children, 0.2% of each group, experienced a temperature greater than 40° C (>104° F).
Moderna plans to include these response, efficacy, and safety data in an application to the Food and Drug Administration for emergency use authorization (EUA) of the vaccine in these younger children in the coming weeks.
“We now have clinical data on the performance of our vaccine from infants 6 months of age through older adults,” Moderna CEO Stephane Bancel said in a news release. He described the interim results as “good news for parents of children under 6 years of age.”
In other news
Moderna also announced that it began the FDA EUA submission process for a 50-μg two-dose primary series for children aged 6-12 years.
The company is also updating its EUA submission for a 100-mcg two-dose primary series for children and adolescents aged 12-18 years.
Similar to its booster research in adults, Moderna plans to evaluate the potential of a booster dose for all pediatric populations, including those aged 6 months to 6 years, 6-12 years, and adolescents. The company is evaluating both a booster dose of mRNA-1273 and its bivalent booster candidate (mRNA1273.214), which includes an Omicron variant booster and mRNA-1273.
A version of this article first appeared on Medscape.com.
Pneumonia decision tool reduces death in ED patients
a 3-year, pragmatic, cluster-controlled study shows.
“We designed the ePNa specifically to require minimal input from the clinician so everything it does is already in the electronic medical record,” Nathan Dean, MD, University of Utah, Salt Lake City, told this news organization.
“So it’s actually putting the guideline recommendations into effect for physicians so that they can make better decisions by having all this information – it’s a comprehensive best practice kind of tool where best practices are likely to make the biggest difference for patients with a high severity of illness,” he added.
The study was published online in the American Journal of Respiratory and Critical Care Medicine.
Guideline-based tool
The ePNa makes use of pneumonia guidelines of 2007 and 2019 from the American Thoracic Society/Infectious Disease Society of America. The system was deployed into six geographic clusters of 16 Intermountain hospital EDs at 2-month intervals between December 2017 and November 2018. Simultaneous deployment was impractical, as implementation of the tool takes education, monitoring, and feedback that can be facilitated by focusing on only a few hospitals at a time.
The decision support tool gathers key patient indicators including age, fever, oxygen saturation, vital signs, and laboratory and chest imaging results to offer recommendations on care, including appropriate antibiotic therapy, microbiology studies, and whether a given patient should be sent to the intensive care unit, admitted to hospital, or may safely be discharged home.
Investigators analyzed a total of 6,848 patients, of whom 4,536 were managed for pneumonia before the ePNa was deployed and 2,312 after deployment.
The median age of patients was 67 years (interquartile range, 50-79 years). Roughly half were female and almost all were White. “Observed 30-day all-cause mortality including both outpatients and inpatients was 8.6% before deployment versus 4.8% after deployment of ePNa,” Dr. Dean and colleagues reported.
Adjusted for severity of illness, the odds ratio for lower mortality post-ePNa launch was 0.62 (95% confidence interval, 0.49-0.79; P < .0010) “and lower morality was consistent across hospital clusters.”
Compared with patients who were discharged home, reductions in mortality were greatest in patients who were directly admitted to ICUs from the ED (OR, 0.32; 95% CI, 0.14-0.77; P = .01). The OR for patients admitted to the medical floor was 0.53 (95% CI, 0.25-1.1; P = .09), which did not reach statistical significance.
Dr. Dean explained that the reductions in mortality were seen among those with the most severe illness, in whom best practices would benefit the most. In contrast, patients who are sent home on an antibiotic are at low risk for mortality while patients admitted to the medical floor may well have another, more lethal illness from which they end up dying, rather than simple pneumonia.
“For me, this was a clear demonstration that these best practices made the biggest difference in patients who were sick and who did not have any underlying disease that was going to kill them anyway,” he emphasized. On the other hand, both 30-day mortality and 7-day secondary hospital admission were higher among patients the tool recommended for hospital ward admission but who were discharged home from the ED.
“This was an unexpected finding,” Dr. Dean observed. However, as he explained, the authors reviewed 25% of randomly selected patients who fell into this subgroup and discovered that the ePNa tool was used in only about 20% of patients – “so doctors did not use the tool in the majority of this group.”
In addition, some of these patients declined hospital admission, so the doctors may have recommended that they be admitted but the patients said no. “The hypothesis here is that if they had been admitted to the hospital, they may have had a lower mortality risk,” Dr. Dean said.
Noticeable changes
Another noticeable change following the introduction of the ePNa tool was that guideline-concordant antibiotic prescribing increased in the 8 hours after patients presented to the ED, from 79.5% prior to the tool’s launch to 87.9%, again after adjusting for pneumonia severity (P < .001). Use of broad-spectrum antibiotics was not significantly different between the two treatment intervals, but administration of antibiotics active against methicillin-resistant Staphylococcus aureus dropped significantly between the two treatment intervals (P < .001). And the mean time from admission to the ED to the first antibiotic taken was slightly faster, improving from 159.4 minutes (95% CI, 156.9-161.9 minutes) prior to the ePNa launch to 150.9 minutes (95% CI, 144.1-157.8) post deployment (P < .001).
“Overall outpatient disposition for treatment of pneumonia from the emergency department increased from 29.2% before ePNa to 46.9% [post ePNA],” the authors noted, while a similar increase was observed in patients for whom ePNA recommended outpatient care – from 49.2% pre-ePNA to 66.6% after ePNA.
Both hospital ward admission and admission to the ICU decreased after ePNa had been introduced. Despite a significant increase in the percentage of patients being discharged home, neither 7-day secondary hospital admission nor severity-adjusted, 30-day mortality were significantly different before versus after the introduction of ePNa, the authors stressed.
A limitation of the study was that the trial was confined to a single health care system in one region of the United States with a patient population that may differ from that in other regions.
Reason for its success
Asked to comment on the findings, Adam Balls, MD, emergency department chair, Intermountain Medical Center, Murray, Utah, suggested that the reason the ePNa tool has been so successful at improving care for pneumonia patients is that it puts the guidelines directly into the hands of individual providers and tells them what’s going on. (Dr. Balls was not involved in the study.) “The tool allows us to take into consideration various clinical features – a patient’s oxygen requirements and whether or not they had prior complicated pneumonias that required additional antibiotics, for example – and then it makes the best determination for not only the disposition for that patient but antibiotic treatment as well,” he said in an interview.
This then allows physicians to either appropriately discharge less severely ill patients and admit those who are more ill – “and in general, just do a better job of treating pneumonia with this tool,” Dr. Balls said. He himself uses the decision support tool when attending to his own patients with pneumonia, as he feels that the tool really does make his care of these patients better. “There is a disparity around how we treat pneumonia in the U.S.
“Clinicians sometimes have a bias or a preference for certain antibiotics and we may not be appropriately treating these patients with broad-spectrum antibiotics or are perhaps using antibiotics that are not as effective based on an individual patient scenario so this is definitely a user-friendly tool that hopefully can be deployed throughout other health care systems to improve the treatment of pneumonia overall,” Dr. Balls emphasized.
A version of this article first appeared on Medscape.com.
FROM THE AMERICAN JOURNAL OF RESPIRATORY AND CRITICAL CARE MEDICINE
Are ‘antibiotic diets’ good practice?
Antibiotics are among the most commonly prescribed medications in both outpatient and hospital settings. Global efforts at curbing antibiotic-resistant strains have prompted clinicians to pursue better stewardship, whereby they limit their prescribing of such medications to those who truly need them.
Yet there’s another possible means of addressing antibiotic resistance – using dietary interventions to reduce the gastrointestinal complaints that so often accompany the use of antibiotics: vomiting, nausea, diarrhea, bloating/indigestion, abdominal pain, and loss of appetite. Far from being a mere nuisance, these complications can have major ramifications.
“Often [these side effects] will result in people stopping an antibiotic they need or taking a second- or third-generation one, which potentially causes even more problems with resistance,” explained Daniel J. Merenstein, MD, a professor of family medicine at Georgetown University, Washington, who has conducted multiple trials on antibiotic stewardship and probiotics.
And it’s not just clinicians who would like to find a way around these common complaints. On lifestyle blogs such as Livestrong and Goop, medical news websites, and via academic institutions, patients can learn how the right probiotic supplement or certain fermented or high-fiber foods, for example, might spare them the upset stomach that often accompanies a course of antibiotics.
Yet according to experts in the field, there are notable questions to be answered about whether there’s evidence to support this approach.
The cost of GI discomfort
Pinpointing the exact manner by which antibiotics upend GI tracts is a complex task, according to Gail Cresci, PhD, RD, a microbiome researcher in the department of pediatric gastroenterology, hepatology, and nutrition and director of nutrition research at the Cleveland Clinic.
“A lot of different mechanisms can go awry,” Dr. Cresci said. “But normally, the good microbes are there to help keep the balance, so when that balance is gone, the pathogens can take over and lead to this disruption.”
According to Lynne V. McFarland, PhD, a recently retired infectious disease epidemiologist who now serves as a private consultant, such complications can have substantial ramifications for patients and health care systems.
“If you’re an inpatient and develop antibiotic-associated diarrhea, it usually increases the length of stay from 8 to 20 days. It also increases the cost of care. And small children who have this can get severely dehydrated, which can become life threatening.”
Proponents of probiotics
Several of the researchers who were interviewed believe there’s convincing evidence supporting probiotics for the treatment of common antibiotic-related GI complaints. In many instances, they were involved in the studies themselves.
During Dr. McFarland’s 4-decade career in probiotics research, she has participated in early animal studies with strains such as Saccharomyces boulardii and was involved in meta-analyses of their role in Clostridioides difficile infection and associated diarrhea and even as a potential GI intervention for COVID-19 patients (Antibiotics (Basel). 2021 Apr 9;10(4):408).
In mouse model studies from 2013 and 2018, Dr. Cresci and colleagues showed that the probiotic strains Lactobacillus GG and Faecalibacterium prausnitzii reduced the structural gut changes that lead to antibiotic-associated diarrhea and minimized the risk of C. difficile infection.
In a 2021 randomized controlled trial led by Merenstein, healthy participants were given a trial of amoxicillin/clavulanate (days 1-7) in conjunction with either yogurt containing the probiotic Bifidobacterium animalis subsp lactis BB-12 or control yogurt (days 1-14). After assessing feces samples over a 30-day period, they found that those who received the probiotic yogurt had a significantly smaller decrease in short-chain fatty acid levels and a more stable taxonomic microbiota profile than control persons.
Dr. Merenstein said that, on the basis of results such as these and others, he’s comfortable being relatively definitive about the value of probiotics.
“I believe it’s close to standard of care that if you’re prescribing antibiotics, especially for more than 7 days, you really need to put people on probiotics that have been studied, simply because the evidence is robust enough now,” he said.
Even for proponents, there are caveats
However, all the researchers recommending the use of probiotics did so with caveats. First and foremost, they advise clinicians that the term “probiotics” is an imprecise catchall and is essentially meaningless.
“A lot of products label themselves as probiotic. It’s a great marketing scheme, but many of the products out there aren’t really probiotics; they’re not proven with randomized control trials and don’t have the scientific background,” said Dr. McFarland. “We’ve found that the efficacy is extremely strain specific and disease specific. A strain may work for one disease and not work for another.”
In 2018, Dr. McFarland coauthored an evidence-based practical guide to help clinicians and patients identify the specific strain that works in certain indications. Dr. Cresci recommends that clinicians consult websites such as Probiotics.org or the National Institutes of Health’s database to find the strains that have been proven to work in well-designed clinical trials.
There was also agreement that, to date, the most robust data support probiotics for the treatment of antibiotic-associated diarrhea.
Although the optimal timing of probiotics is a subject of debate, most proponents agreed that the general rule is “the sooner the better.”
Dr. McFarland recommended incorporating probiotics within 24 hours of starting an antibiotic “because the damage done to your GI tract microbiome is pretty quick, and the probiotics work best if they’re established before major disruption occurs.” She added that patients should continue taking probiotics for 2-8 weeks after stopping antibiotics.
“It takes a long time for your normal flora to get restored,” she said. “It’s best to cover your bases.”
For others, the evidence is not definitive
Opinions on the value of probiotics to combat antibiotic-related GI side effects are divergent, though.
“I would not recommend the routine use of probiotics, and certainly not in the prevention of C. difficile or antibiotic-related diarrhea,” said David A. Johnson, MD, professor of medicine and chief of gastroenterology at Eastern Virginia Medical School, Norfolk. “I think the evidence does not support that, and I stand strongly on that recommendation.”
Dr. Johnson cited the 2020 guidelines from the American Gastroenterological Association, which offer only a conditional recommendation for the use of specific probiotics and only in preventing antibiotic-associated C. difficile infection.
Geoffrey A. Preidis, MD, PhD, an assistant professor of pediatrics in the section of gastroenterology, hepatology, and nutrition at Baylor College of Medicine, Houston, served as a coauthor of the AGA’s guidelines. He noted that after reviewing 39 published trials of approximately 10,000 patients given probiotics while receiving antibiotics, the authors “did find some evidence that specific probiotics might decrease the risk of C. difficile diarrhea, but the quality of that evidence was low.”
Dr. Preidis attributed this to the lack of well-designed multicenter trials that can isolate the effects of certain strains and determine their benefit in this application.
“The majority of published trials have not reported safety data as rigorously as these data are reported in pharmaceutical trials, so the risk of side effects could be higher than we think,” said Dr. Preidis. “As living microbes, probiotics can move from the intestines into the bloodstream, causing sepsis. Contamination in the manufacturing process has been reported. There might be other long-term effects that we are not yet aware of.”
When asked to characterize the available data on probiotics, Dr. Johnson replied, “I’d generally label it, ‘caveat emptor.’ ”
Dr. McFarland agreed that the field would benefit from better-designed studies and called out meta-analyses that pool outcomes with various strains for particular criticism.
“When researchers do that, it’s no longer valid and shouldn’t have been published, in my opinion,” she told this news organization.
‘Antibiotic diets’ as a possible approach
A compromise between the two sides may be the so-called antibiotic diet. The theory behind such diets is that foods and beverages with biome-boosting properties may be a risk-free intervention that patients can adopt to alleviate antibiotic-related side effects.
“You want your diet to include more soluble fibers to help support the good bacteria, particularly when you’re taking antibiotics,” said Dr. Cresci. “You can get this through eating fresh fruits and vegetables, whole grains, and foods that have more prebiotic, like potatoes. You can also eat fermented food, such as kefir, kombucha, kimchi, and yogurt, so you’re adding more beneficial bacteria into your intestinal tract.”
There is ample published evidence that such foods can boost microbiome diversity and decrease inflammation, including a July 2021 study in Cell. However, the protection this may confer while taking antibiotics isn’t known. Establishing a clear role for the efficacy of such interventions is made additionally difficult by the well-established limitations of conducting dietary clinical trials.
Dr. Merenstein said that there is no compelling evidence that antibiotic-related complications can be offset by changing what goes onto our dinner plates. He joked: “We can’t say, ‘Here’s amoxicillin for your ear infection, now make sure you increase your fermented food, fiber, and water.’ ”
Dr. Johnson said he’s intrigued by studies of prebiotics – fibers that boost beneficial bacteria in the GI system.
“I would love to have more findings about prebiotic identification; that is, things we could do in a healthy way to keep the gut balanced while it’s subject to a change with antibiotics,” he said. “We’re just not there yet.”
Dr. Johnson added that he generally recommends that patients taking antibiotics eat “a bland diet, avoiding things that may have been provocative in the past.”
If patients are already enjoying foods with microbiome-boosting reputations, Dr. Johnson sees “very little downside to continuing that [while on antibiotics].” However, he noted that the period in which you’re taking antibiotics isn’t ideal for trying new foods, given the lack of experience with how the gut bacteria will react.
There are data about foods to avoid while taking antibiotics, which generally fall in line with common dietary knowledge. Many patients may know not to drink grapefruit juice with certain medications, but it’s worth a reminder. Certain antibiotics may also require delaying or avoiding dairy products, although this does not apply to yogurt.
A fiber-deficient diet can aggravate microbiota collapse following antibiotics. In a 2020 study, researchers showed that people on a high-fat diet who were using antibiotics were 8.6 times more likely to have preinflammatory bowel disease than those eating low-fat foods and who had no recent history of antibiotic use. Mouse model data from the same study indicated that poor diet and antibiotics may have worked in conjunction to reduce oxygen in the gut.
Dr. McFarland noted that building a healthy microbiome is a lifelong pursuit and that several factors (for example, environmental or genetic) are out of individuals’ hands. The general public might want a quick fix – ironically, one of the main drivers behind their requesting and receiving antibiotics when they’re not indicated – but it’s likely not available to them.
“You can’t eat one salad and suddenly have a healthy gut, unfortunately.”
A version of this article first appeared on Medscape.com.
Children and COVID: CDC gives perspective on hospitalizations
New COVID-19 cases in children fell by 23% as the latest weekly count dropped to its lowest level since July of 2021, based on data from the American Academy of Pediatrics and the Children’s Hospital Association.
, when the early stages of the Delta surge led to 23,551 cases, the AAP and CHA said in their weekly COVID report.
The two organizations put the total number of cases at nearly 12.8 million from the start of the pandemic to March 17, with children representing 19.0% of cases among all ages. The Centers for Disease Control and Prevention puts the cumulative number of COVID-19 cases at almost 12.0 million as of March 21, or 17.5% of the nationwide total.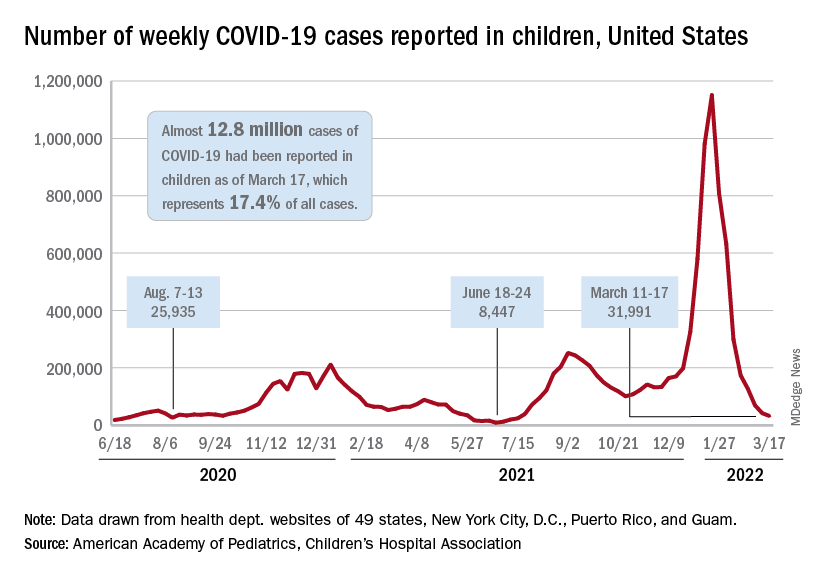
COVID-related hospitalizations also continue to fall, and two new studies from the CDC put children’s experiences during the Omicron surge and the larger pandemic into perspective.
One study showed that hospitalization rates for children aged 4 years and younger during the Omicron surge were five times higher than at the peak of the Delta surge, with the highest rates occurring in infants under 6 months of age. That report was based on the CDC’s COVID-19–Associated Hospitalization Surveillance Network (COVID-NET), which covers 99 counties across 14 states (MMWR. 2022 March 18;71[11]:429-36).
The second study compared child hospitalizations during 1 year of the COVID pandemic (Oct. 1, 2020, to Sept. 30, 2021) with three influenza seasons (2017-2018 through 2019-2020). The pre-Omicron hospitalization rate for those under age 18 years, 48.2 per 100,000 children, was higher than any of the three flu seasons: 33.5 per 100,000 in 2017-2018, 33.8 in 2018-2019, and 41.7 for 2019-2020, the investigators said in a medRxiv preprint.
Most of the increased COVID burden fell on adolescents aged 12-17, they said. The COVID hospitalization rate for that age group was 59.9 per 100,000, versus 12.2-14.1 for influenza, while children aged 5-11 had a COVID-related rate of 25.0 and flu-related rates of 24.3-31.7, and those aged 0-4 had rates of 66.8 for COVID and 70.9-91.5 for the flu, Miranda J. Delahoy of the CDC’s COVID-19 Response Team and associates reported.
WHO issues new TB guidelines for children and adolescents
The World Health Organization now recommends shortened treatment for children with mild tuberculosis, as well as two oral TB treatments (bedaquiline and delamanid) for use in children of all ages. The updated guidelines for TB management in children and adolescents were announced March 21 ahead of World Tuberculosis Day on March 24.
The agency also called for increased investment in global TB programs, noting that in 2020, TB deaths increased for the first time in over a decade. “We cannot falter in our commitment to reach and save every man, woman, child, family, and community impacted by this deadly disease,” said Tereza Kasaeva, MD, PhD, director of the WHO Global Tuberculosis Programme during a press conference.
TB is the 13th-leading cause of death and the second top infectious killer after COVID-19, with more than 4,100 people dying from TB every day. WHO estimates that 1.1 million children fall ill with TB each year.
Calls for investment
The increase in TB deaths from 1.4 million in 2019 to 1.5 million in 2020 was coupled with a decrease in funding. From 2019-2020, global spending for TB diagnostic, treatment, and prevention services fell from $5.8 billion to $5.3 billion. This is less than half of the $13 billion target funding amount for 2022, Dr. Kasaeva said.
Efforts to expand access to TB care have fallen short mainly because of this lack of funding, especially for children. In 2020, about 63% of children under 15 years of age with TB either did not receive or were not reported to have access to TB diagnosis and treatment services, which rose to 72% in children under age 5. Almost two-thirds of children under age 5 also did not receive TB preventive treatment in 2022, according to WHO statistics.
The socioeconomic ramifications of the COVID-19 pandemic as well as ongoing conflict in Eastern Europe, Africa, and the Middle East have “further exacerbated the situation,” Dr. Kasaeva said. “This conveys the urgent need to dramatically increase investments to ramp up the fight against TB and achieve commitments to end TB made by global leaders.”
Dr. Kasaeva laid out WHO’s main points for global investment in TB care:
- Increase domestic and international funding to close gaps in TB research and program implementation. For countries with smaller economies, increased international investment will be necessary in the short or medium term to help regain progress.
- Double funding for TB research, including vaccines.
- Invest in sustaining TB programs and services during the COVID-19 pandemic and ongoing crises so care is not disrupted.
New guidelines
Dr. Kasaeva also noted that adoption of WHO’s new guidelines for children and adolescents should be fast-tracked to improve access to and quality of care. The updates include:
- Rapid molecular tests called Xpert Ultra should be used as the initial test for TB in children and adolescents.
- Diagnostic testing can now include noninvasive specimens, like stool samples.
- Children with mild TB can be treated with a , rather than 6 months. This shortened regimen will allow children to return to school faster and save money for families and the health care system, said Kerri Viney, MD, PhD, a team lead for the WHO Tuberculosis Programme, with a focus on vulnerable populations, including children. She presented the new guidelines during the WHO press conference.
- The recommended treatment regimen for TB meningitis has also been shortened from 12 to 6 months.
Two oral medications for drug-resistant TB (bedaquiline and delamanid) are now recommended for use in children of all ages. “There is no longer a need for painful injections that can have serious side effects, including deafness,” Dr. Viney said.
Health systems should develop new models of decentralized and integrated TB care to bring TB care closer to where children live.
The guidelines are available on the WHO website.
“The WHO guidelines issued today are a game changer for children and adolescents with TB,” Dr. Kasaeva said. The next step is assisting countries in implementing these updates so that children and adolescents globally have access to high quality TB care,” Dr. Viney added. “We have the policy recommendations. We have the implementation guidance, we have child-friendly formulations of TB medicines,” she said. “Let us not wait any longer. Let us invest to end TB in children and adolescents.”
A version of this article first appeared on Medscape.com.
Antiretroviral therapy associated with less risk of preterm birth
Over the past decade, data have suggested that antiretroviral therapy (ART) may be associated with an increased risk for adverse pregnancy outcomes, namely, preterm birth (PTB). But a combination of methodologic challenges, demographic gaps, and spotty clinical data has left the question unresolved, especially for pregnant women with HIV who reside in developed countries.
“Given that a lot of the emerging data has come out of resource-limited settings where patient and clinical characteristics are different from developed world settings like the United States, we felt that this was an important question to address,” Kartik Venkatesh, MD, PhD, a high-risk obstetrician and perinatal epidemiologist at the Ohio State Wexner Medical Center, Columbus, told this news organization.
In a prospective cohort study of U.S. women with or at risk for HIV, Dr. Venkatesh and his colleagues found that ART exposure (including highly active antiretroviral therapy [HAART]) was associated with as much as an 80% decline in the likelihood of PTB (defined as birth less than 34 weeks). The study was published in HIV Medicine.
24 years of data analyzed
Dr. Venkatesh and his team analyzed self-reported birth data of women with singleton live-born pregnancies enrolled in the ongoing, multicenter, prospective observational Women’s Interagency HIV Study (WIHS) from Oct. 1, 1995, to March 31, 2019.
“We first looked at women with HIV versus without HIV, [who were] matched on many clinical and sociodemographic characteristics and at similarly high risk of some of these obstetrical outcomes like PTB,” explained Dr. Venkatesh. “We then looked at the relative impact of antiretroviral therapy amongst women living with HIV compared to no antiretroviral therapy.”
ART regimens were classified as none, monotherapy, dual therapy, or HAART. (HAART was defined as more than three antiretrovirals, including at least one protease inhibitor [PI], nonnucleoside reverse transcriptase inhibitor, integrase inhibitor, or entry inhibitor.) In this cohort, for 63.5% of women receiving ART, therapy was initiated before pregnancy (mean duration of HAART, 6 years), and most were virally suppressed.
Among the 4,944 women assessed in the WIHS trial, 74% (3,646) had HIV. In total, 383 women had 488 singleton deliveries, including 218 women with HIV (272 deliveries) and 165 without HIV (216 deliveries). Sociodemographics in both cohorts were well matched. For most participants, the mean age was 40-41 years at delivery, most were non-Hispanic Black persons, and the mean pregnancy body mass index was greater than or equal to 29 kg/m2. Of the women with HIV, 33% had chronic hypertension; of those without HIV, 42.1% had chronic hypertension; 4.7% and 5.0%, respectively, had pregestational diabetes.
The findings showed that PTB risk less than 34 weeks was similar between women with (10%) and without (8%) HIV (adjusted risk ratio, 1.30; 95% confidence interval, 0.74-2.31). Among deliveries to women with HIV who were receiving ART, PTB risk less than 34 weeks was lower with HAART (7%), compared with not receiving ART (26%) (aRR, 0.19), as well as with monotherapy or dual therapy (3% vs. no ART) (aRR, 0.12). Notably, 67% of deliveries to women receiving HAART included a PI-containing regimen, but these women were not significantly more likely to have a PTB less than 34 weeks, compared with women taking non-PI HAART regimens (aRR, 2.61; 95% CI, 0.65-10.59). Results were similar for secondary outcomes (PTB less than 28 weeks, less than 37 weeks).
Filling in the gaps toward the safest regimen
“This study spans 25 years, so it covers a lot of the history of HIV in pregnancy and is reassuring around using ART in pregnancy,” Shahin Lockman, MD, told this news organization. Dr. Lockman is an associate professor of infectious diseases at Brigham and Women’s Hospital and a co-PI of the Botswana Clinical Trials Unit at the Botswana Harvard AIDS Institute Partnership. She was not involved in the study. “One of the worst things for a mother and for pregnancy outcomes, for the fetus and baby’s health and development, is uncontrolled maternal HIV,’’ she said.
Dr. Lockman also noted potential confounders that drive poor birth outcomes in Southern African women, compared with U.S. women, making comparisons between this and other observational studies difficult. Still, she said that the question is not whether women should be receiving treatment but whether or not there are differences between antiretroviral regimens.
“One of the areas that we did not go deeper into was the subtype of antiretroviral therapy, given the relatively small study numbers [did not] allow us to do a robust analysis,” Dr. Venkatesh said.
Rather, he emphasized that the findings might lend more weight to speculation that immunologic characteristics associated with HIV status and immunotherapy – such as low CD4 cell counts prior to delivery, or duration of HIV infection – may be important drivers of adverse birth outcomes among women with HIV taking ART.
And at least in this cohort, many of these characteristics were similar between the treatment groups.
Both researchers agree that the findings – while reassuring – highlight the importance of collecting robust obstetric and safety data as part of prospective databases of individuals living with HIV, not only in resource-limited settings but also among the domestic U.S. population.
“We’ve learned a lot over the last 10 years,” Dr. Lockman said. “Some regimens (like lopinavir/ritonavir or nevirapine) are associated with significantly worse birth outcomes, whereas efavirenz doesn’t seem to be, or less so, and dolutegravir seems to be associated with even better outcomes. So, I think that where we are moving is to regimens that are the safest.”
Moving forward, Dr. Venkatesh explained, not only should researchers focus on exploring which antiretrovirals are safest in this context but also if the use of preexposure prophylaxis during conception periods affects birth outcomes.
Dr. Venkatesh and Dr. Lockman report no relevant financial relationships.
A version of this article first appeared on Medscape.com.
Acute STEMI During the COVID-19 Pandemic at a Regional Hospital: Incidence, Clinical Characteristics, and Outcomes
From the Department of Medicine, Medical College of Georgia at the Augusta University-University of Georgia Medical Partnership, Athens, GA (Syed H. Ali, Syed Hyder, and Dr. Murrow), and the Department of Cardiology, Piedmont Heart Institute, Piedmont Athens Regional, Athens, GA (Dr. Murrow and Mrs. Davis).
Abstract
Objectives: The aim of this study was to describe the characteristics and in-hospital outcomes of patients with acute ST-segment elevation myocardial infarction (STEMI) during the early COVID-19 pandemic at Piedmont Athens Regional (PAR), a 330-bed tertiary referral center in Northeast Georgia.
Methods: A retrospective study was conducted at PAR to evaluate patients with acute STEMI admitted over an 8-week period during the initial COVID-19 outbreak. This study group was compared to patients admitted during the corresponding period in 2019. The primary endpoint of this study was defined as a composite of sustained ventricular arrhythmia, congestive heart failure (CHF) with pulmonary congestion, and/or in-hospital mortality.
Results: This study cohort was composed of 64 patients with acute STEMI; 30 patients (46.9%) were hospitalized during the COVID-19 pandemic. Patients with STEMI in both the COVID-19 and control groups had similar comorbidities, Killip classification score, and clinical presentations. The median (interquartile range) time from symptom onset to reperfusion (total ischemic time) increased from 99.5 minutes (84.8-132) in 2019 to 149 minutes (96.3-231.8; P = .032) in 2020. Hospitalization during the COVID-19 period was associated with an increased risk for combined in-hospital outcome (odds ratio, 3.96; P = .046).
Conclusion: Patients with STEMI admitted during the first wave of the COVID-19 outbreak experienced longer total ischemic time and increased risk for combined in-hospital outcomes compared to patients admitted during the corresponding period in 2019.
Keywords: myocardial infarction, acute coronary syndrome, hospitalization, outcomes.

The emergence of the SARS-Cov-2 virus in December 2019 caused a worldwide shift in resource allocation and the restructuring of health care systems within the span of a few months. With the rapid spread of infection, the World Health Organization officially declared a pandemic in March 2020. The pandemic led to the deferral and cancellation of in-person patient visits, routine diagnostic studies, and nonessential surgeries and procedures. This response occurred secondary to a joint effort to reduce transmission via stay-at-home mandates and appropriate social distancing.1
Alongside the reduction in elective procedures and health care visits, significant reductions in hospitalization rates due to decreases in acute ST-segment elevation myocardial infarction (STEMI) and catheterization laboratory utilization have been reported in many studies from around the world.2-7 Comprehensive data demonstrating the impact of the COVID-19 pandemic on acute STEMI patient characteristics, clinical presentation, and in-hospital outcomes are lacking. Although patients with previously diagnosed cardiovascular disease are more likely to encounter worse outcomes in the setting of COVID-19, there may also be an indirect impact of the pandemic on high-risk patients, including those without the infection.8 Several theories have been hypothesized to explain this phenomenon. One theory postulates that the fear of contracting the virus during hospitalization is great enough to prevent patients from seeking care.2 Another theory suggests that the increased utilization of telemedicine prevents exacerbation of chronic conditions and the need for hospitalization.9 Contrary to this trend, previous studies have shown an increased incidence of acute STEMI following stressful events such as natural disasters.10
The aim of this study was to describe trends pertaining to clinical characteristics and in-hospital outcomes of patients with acute STEMI during the early COVID-19 pandemic at Piedmont Athens Regional (PAR), a 330-bed tertiary referral center in Northeast Georgia.
Methods
A retrospective cohort study was conducted at PAR to evaluate patients with STEMI admitted to the cardiovascular intensive care unit over an 8-week period (March 5 to May 5, 2020) during the COVID-19 outbreak. COVID-19 was declared a national emergency on March 13, 2020, in the United States. The institutional review board at PAR approved the study; the need for individual consent was waived under the condition that participant data would undergo de-identification and be strictly safeguarded.
Data Collection
Because there are seasonal variations in cardiovascular admissions, patient data from a control period (March 9 to May 9, 2019) were obtained to compare with data from the 2020 period. The number of patients with the diagnosis of acute STEMI during the COVID-19 period was recorded. Demographic data, clinical characteristics, and primary angiographic findings were gathered for all patients. Time from symptom onset to hospital admission and time from hospital admission to reperfusion (defined as door-to-balloon time) were documented for each patient. Killip classification was used to assess patients’ clinical status on admission. Length of stay was determined as days from hospital admission to discharge or death (if occurring during the same hospitalization).
Adverse in-hospital complications were also recorded. These were selected based on inclusion of the following categories of acute STEMI complications: ischemic, mechanical, arrhythmic, embolic, and inflammatory. The following complications occurred in our patient cohort: sustained ventricular arrhythmia, congestive heart failure (CHF) defined as congestion requiring intravenous diuretics, re-infarction, mechanical complications (free-wall rupture, ventricular septal defect, or mitral regurgitation), second- or third-degree atrioventricular block, atrial fibrillation, stroke, mechanical ventilation, major bleeding, pericarditis, cardiogenic shock, cardiac arrest, and in-hospital mortality. The primary outcome of this study was defined as a composite of sustained ventricular arrhythmia, CHF with congestion requiring intravenous diuretics, and/or in-hospital mortality. Ventricular arrythmia and CHF were included in the composite outcome because they are defined as the 2 most common causes of sudden cardiac death following acute STEMI.11,12
Statistical Analysis
Normally distributed continuous variables and categorical variables were compared using the paired t-test. A 2-sided P value <.05 was considered to be statistically significant. Mean admission rates for acute STEMI hospitalizations were determined by dividing the number of admissions by the number of days in each time period. The daily rate of COVID-19 cases per 100,000 individuals was obtained from the Centers for Disease Control and Prevention COVID-19 database. All data analyses were performed using Microsoft Excel.
Results
The study cohort consisted of 64 patients, of whom 30 (46.9%) were hospitalized between March 5 and May 5, 2020, and 34 (53.1%) who were admitted during the analogous time period in 2019. This reflected a 6% decrease in STEMI admissions at PAR in the COVID-19 cohort.
Acute STEMI Hospitalization Rates and COVID-19 Incidence
The mean daily acute STEMI admission rate was 0.50 during the study period compared to 0.57 during the control period. During the study period in 2020 in the state of Georgia, the daily rate of newly confirmed COVID-19 cases ranged from 0.194 per 100,000 on March 5 to 8.778 per 100,000 on May 5. Results of COVID-19 testing were available for 9 STEMI patients, and of these 0 tests were positive.
Baseline Characteristics
Baseline characteristics of the acute STEMI cohorts are presented in Table 1. Approximately 75% were male; median (interquartile range [IQR]) age was 60 (51-72) years. There were no significant differences in age and gender between the study periods. Three-quarters of patients had a history of hypertension, and 87.5% had a history of dyslipidemia. There was no significant difference in baseline comorbidity profiles between the 2 study periods; therefore, our sample populations shared similar characteristics.
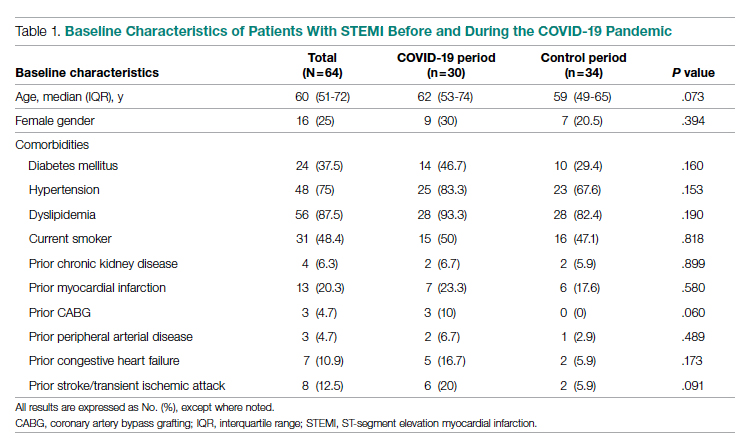
Clinical Presentation
Significant differences were observed regarding the time intervals of STEMI patients in the COVID-19 period and the control period (Table 2). Median time from symptom onset to hospital admission (patient delay) was extended from 57.5 minutes (IQR, 40.3-106) in 2019 to 93 minutes (IQR, 48.8-132) in 2020; however, this difference was not statistically significant (P = .697). Median time from hospital admission to reperfusion (system delay) was prolonged from 45 minutes (IQR, 28-61) in 2019 to 78 minutes (IQR, 50-110) in 2020 (P < .001). Overall time from symptom onset to reperfusion (total ischemic time) increased from 99.5 minutes (IQR, 84.8-132) in 2019 to 149 minutes (IQR, 96.3-231.8) in 2020 (P = .032).
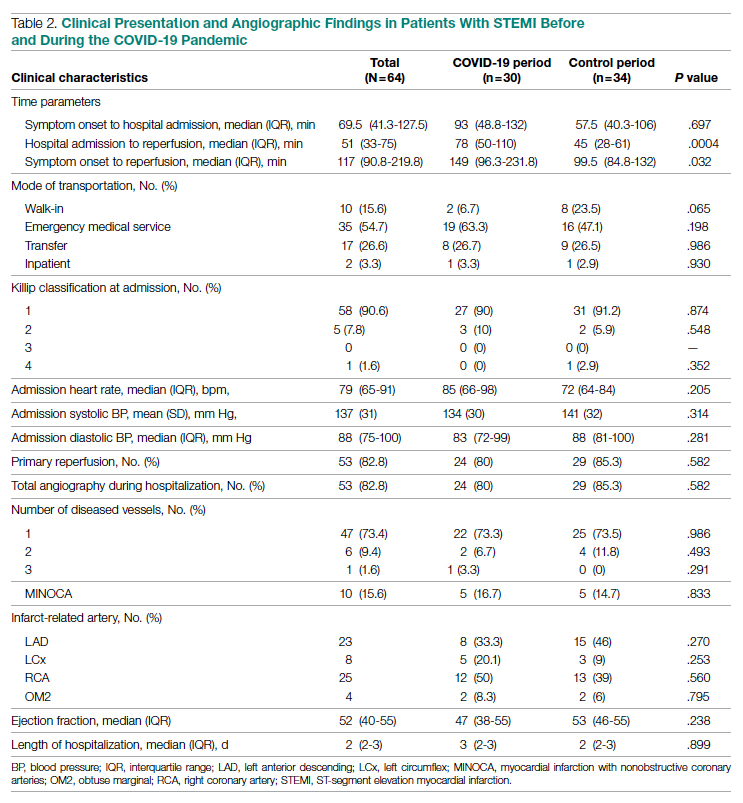
Regarding mode of transportation, 23.5% of patients in 2019 were walk-in admissions to the emergency department. During the COVID-19 period, walk-in admissions decreased to 6.7% (P = .065). There were no significant differences between emergency medical service, transfer, or in-patient admissions for STEMI cases between the 2 study periods.
Killip classification scores were calculated for all patients on admission; 90.6% of patients were classified as Killip Class 1. There was no significant difference between hemodynamic presentations during the COVID-19 period compared to the control period.
Angiographic Data
Overall, 53 (82.8%) patients admitted with acute STEMI underwent coronary angiography during their hospital stay. The proportion of patients who underwent primary reperfusion was greater in the control period than in the COVID-19 period (85.3% vs 80%; P = .582). Angiographic characteristics and findings were similar between the 2 study groups (Table 2).
In-Hospital Outcomes
In-hospital outcome data were available for all patients. As shown in Table 3, hospitalization during the COVID-19 period was independently associated with an increased risk for combined in-hospital outcome (odds ratio, 3.96; P = .046). The rate of in-hospital mortality was greater in the COVID-19 period (P = .013). We found no significant difference when comparing secondary outcomes from admissions during the COVID-19 period and the control period in 2019. For the 5 patients who died during the study period, the primary diagnosis at death was acute STEMI complicated by CHF (3 patients) or cardiogenic shock (2 patients).
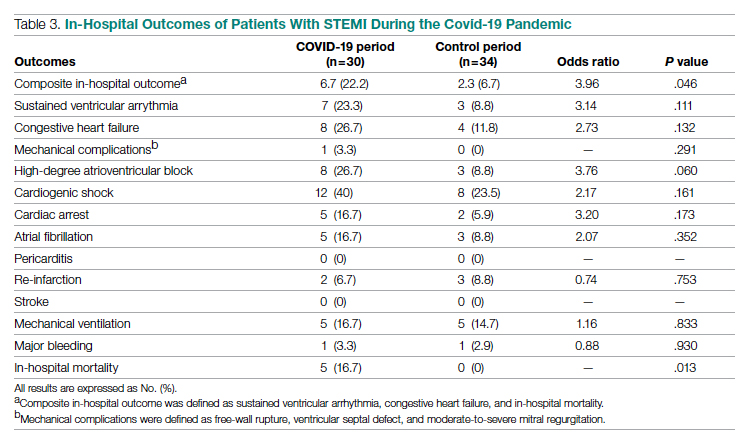
Discussion
This single-center retrospective study at PAR looks at the impact of COVID-19 on hospitalizations for acute STEMI during the initial peak of the pandemic. The key findings of this study show a significant increase in ischemic time parameters (symptom onset to reperfusion, hospital admission to reperfusion), in-hospital mortality, and combined in-hospital outcomes.
There was a 49.5-minute increase in total ischemic time noted in this study (P = .032). Though there was a numerical increase in time of symptom onset to hospital admission by 23.5 minutes, this difference was not statistically significant (P = .697). However, this study observed a statistically significant 33-minute increase in ischemic time from hospital admission to reperfusion (P < .001). Multiple studies globally have found a similar increase in total ischemic times, including those conducted in China and Europe.13-15 Every level of potential delay must be considered, including pre-hospital, triage and emergency department, and/or reperfusion team. Pre-hospital sources of delays that have been suggested include “stay-at-home” orders and apprehension to seek medical care due to concern about contracting the virus or overwhelming the health care facilities. There was a clinically significant 4-fold decrease in the number of walk-in acute STEMI cases in the study period. In 2019, there were 8 walk-in cases compared to 2 cases in 2020 (P = .065). However, this change was not statistically significant. In-hospital/systemic sources of delays have been mentioned in other studies; they include increased time taken to rule out COVID-19 (nasopharyngeal swab/chest x-ray) and increased time due to the need for intensive gowning and gloving procedures by staff. It was difficult to objectively determine the sources of system delay by the reperfusion team due to a lack of quantitative data.
In the current study, we found a significant increase in in-hospital mortality during the COVID-19 period compared to a parallel time frame in 2019. This finding is contrary to a multicenter study from Spain that reported no difference in in-hospital outcomes or mortality rates among all acute coronary syndrome cases.16 The worsening outcomes and prognosis may simply be a result of increased ischemic time; however, the virus that causes COVID-19 itself may play a role as well. Studies have found that SARS-Cov-2 infection places patients at greater risk for cardiovascular conditions such as hypercoagulability, myocarditis, and arrhythmias.17 In our study, however, there were no acute STEMI patients who tested positive for COVID-19. Therefore, we cannot discuss the impact of increased thrombus burden in patients with COVID-19. Piedmont Healthcare published a STEMI treatment protocol in May 2020 that advised increased use of tissue plasminogen activator (tPA) in COVID-19-positive cases; during the study period, however, there were no occasions when tPA use was deemed appropriate based on clinical judgment.
Our findings align with previous studies that describe an increase in combined in-hospital adverse outcomes during the COVID-19 era. Previous studies detected a higher rate of complications in the COVID-19 cohort, but in the current study, the adverse in-hospital course is unrelated to underlying infection.18,19 This study reports a higher incidence of major in-hospital outcomes, including a 65% increase in the rate of combined in-hospital outcomes, which is similar to a multicenter study conducted in Israel.19 There was a 2.3-fold numerical increase in sustained ventricular arrhythmias and a 2.5-fold numerical increase in the incidence of cardiac arrest in the study period. This phenomenon was observed despite a similar rate of reperfusion procedures in both groups.
Acute STEMI is a highly fatal condition with an incidence of 8.5 in 10,000 annually in the United States. While studies across the world have shown a 25% to 40% reduction in the rate of hospitalized acute coronary syndrome cases during the COVID-19 pandemic, the decrease from 34 to 30 STEMI admissions at PAR is not statistically significant.20 Possible reasons for the reduction globally include increased out-of-hospital mortality and decreased incidence of acute STEMI across the general population as a result of improved access to telemedicine or decreased levels of life stressors.20
In summary, there was an increase in ischemic time to reperfusion, in-hospital mortality, and combined in-hospital outcomes for acute STEMI patients at PAR during the COVID period.
Limitations
This study has several limitations. This is a single-center study, so the sample size is small and may not be generalizable to a larger population. This is a retrospective observational study, so causation cannot be inferred. This study analyzed ischemic time parameters as average rates over time rather than in an interrupted time series. Post-reperfusion outcomes were limited to hospital stay. Post-hospital follow-up would provide a better picture of the effects of STEMI intervention. There is no account of patients who died out-of-hospital secondary to acute STEMI. COVID-19 testing was not introduced until midway in our study period. Therefore, we cannot rule out the possibility of the SARS-Cov-2 virus inciting acute STEMI and subsequently leading to worse outcomes and poor prognosis.
Conclusions
This study provides an analysis of the incidence, characteristics, and clinical outcomes of patients presenting with acute STEMI during the early period of the COVID-19 pandemic. In-hospital mortality and ischemic time to reperfusion increased while combined in-hospital outcomes worsened.
Acknowledgment: The authors thank Piedmont Athens Regional IRB for approving this project and allowing access to patient data.
Corresponding author: Syed H. Ali; Department of Medicine, Medical College of Georgia at the Augusta University-University of Georgia Medical Partnership, 30606, Athens, GA; syedha.ali@gmail.com
Disclosures: None reported.
doi:10.12788/jcom.0085
1. Bhatt AS, Moscone A, McElrath EE, et al. Fewer hospitalizations for acute cardiovascular conditions during the COVID-19 pandemic. J Am Coll Cardiol. 2020;76(3):280-288. doi:10.1016/j.jacc.2020.05.038
2. Metzler B, Siostrzonek P, Binder RK, Bauer A, Reinstadler SJR. Decline of acute coronary syndrome admissions in Austria since the outbreak of Covid-19: the pandemic response causes cardiac collateral damage. Eur Heart J. 2020;41:1852-1853. doi:10.1093/eurheartj/ehaa314
3. De Rosa S, Spaccarotella C, Basso C, et al. Reduction of hospitalizations for myocardial infarction in Italy in the Covid-19 era. Eur Heart J. 2020;41(22):2083-2088.
4. Wilson SJ, Connolly MJ, Elghamry Z, et al. Effect of the COVID-19 pandemic on ST-segment-elevation myocardial infarction presentations and in-hospital outcomes. Circ Cardiovasc Interv. 2020; 13(7):e009438. doi:10.1161/CIRCINTERVENTIONS.120.009438
5. Mafham MM, Spata E, Goldacre R, et al. Covid-19 pandemic and admission rates for and management of acute coronary syndromes in England. Lancet. 2020;396 (10248):381-389. doi:10.1016/S0140-6736(20)31356-8
6. Bhatt AS, Moscone A, McElrath EE, et al. Fewer Hospitalizations for acute cardiovascular conditions during the COVID-19 pandemic. J Am Coll Cardiol. 2020;76(3):280-288. doi:10.1016/j.jacc.2020.05.038
7. Tam CF, Cheung KS, Lam S, et al. Impact of Coronavirus disease 2019 (Covid-19) outbreak on ST-segment elevation myocardial infarction care in Hong Kong, China. Circ Cardiovasc Qual Outcomes. 2020;13(4):e006631. doi:10.1161/CIRCOUTCOMES.120.006631
8. Clerkin KJ, Fried JA, Raikhelkar J, et al. Coronavirus disease 2019 (COVID-19) and cardiovascular disease. Circulation. 2020;141:1648-1655. doi:10.1161/CIRCULATIONAHA.120.046941
9. Ebinger JE, Shah PK. Declining admissions for acute cardiovascular illness: The Covid-19 paradox. J Am Coll Cardiol. 2020;76(3):289-291. doi:10.1016/j.jacc.2020.05.039
10 Leor J, Poole WK, Kloner RA. Sudden cardiac death triggered by an earthquake. N Engl J Med. 1996;334(7):413-419. doi:10.1056/NEJM199602153340701
11. Hiramori K. Major causes of death from acute myocardial infarction in a coronary care unit. Jpn Circ J. 1987;51(9):1041-1047. doi:10.1253/jcj.51.1041
12. Bui AH, Waks JW. Risk stratification of sudden cardiac death after acute myocardial infarction. J Innov Card Rhythm Manag. 2018;9(2):3035-3049. doi:10.19102/icrm.2018.090201
13. Xiang D, Xiang X, Zhang W, et al. Management and outcomes of patients with STEMI during the COVID-19 pandemic in China. J Am Coll Cardiol. 2020;76(11):1318-1324. doi:10.1016/j.jacc.2020.06.039
14. Hakim R, Motreff P, Rangé G. COVID-19 and STEMI. [Article in French]. Ann Cardiol Angeiol (Paris). 2020;69(6):355-359. doi:10.1016/j.ancard.2020.09.034
15. Soylu K, Coksevim M, Yanık A, Bugra Cerik I, Aksan G. Effect of Covid-19 pandemic process on STEMI patients timeline. Int J Clin Pract. 2021;75(5):e14005. doi:10.1111/ijcp.14005
16. Salinas P, Travieso A, Vergara-Uzcategui C, et al. Clinical profile and 30-day mortality of invasively managed patients with suspected acute coronary syndrome during the COVID-19 outbreak. Int Heart J. 2021;62(2):274-281. doi:10.1536/ihj.20-574
17. Hu Y, Sun J, Dai Z, et al. Prevalence and severity of corona virus disease 2019 (Covid-19): a systematic review and meta-analysis. J Clin Virol. 2020;127:104371. doi:10.1016/j.jcv.2020.104371
18. Rodriguez-Leor O, Cid Alvarez AB, Perez de Prado A, et al. In-hospital outcomes of COVID-19 ST-elevation myocardial infarction patients. EuroIntervention. 2021;16(17):1426-1433. doi:10.4244/EIJ-D-20-00935
19. Fardman A, Zahger D, Orvin K, et al. Acute myocardial infarction in the Covid-19 era: incidence, clinical characteristics and in-hospital outcomes—A multicenter registry. PLoS ONE. 2021;16(6): e0253524. doi:10.1371/journal.pone.0253524
20. Pessoa-Amorim G, Camm CF, Gajendragadkar P, et al. Admission of patients with STEMI since the outbreak of the COVID-19 pandemic: a survey by the European Society of Cardiology. Eur Heart J Qual Care Clin Outcomes. 2020;6(3):210-216. doi:10.1093/ehjqcco/qcaa046
From the Department of Medicine, Medical College of Georgia at the Augusta University-University of Georgia Medical Partnership, Athens, GA (Syed H. Ali, Syed Hyder, and Dr. Murrow), and the Department of Cardiology, Piedmont Heart Institute, Piedmont Athens Regional, Athens, GA (Dr. Murrow and Mrs. Davis).
Abstract
Objectives: The aim of this study was to describe the characteristics and in-hospital outcomes of patients with acute ST-segment elevation myocardial infarction (STEMI) during the early COVID-19 pandemic at Piedmont Athens Regional (PAR), a 330-bed tertiary referral center in Northeast Georgia.
Methods: A retrospective study was conducted at PAR to evaluate patients with acute STEMI admitted over an 8-week period during the initial COVID-19 outbreak. This study group was compared to patients admitted during the corresponding period in 2019. The primary endpoint of this study was defined as a composite of sustained ventricular arrhythmia, congestive heart failure (CHF) with pulmonary congestion, and/or in-hospital mortality.
Results: This study cohort was composed of 64 patients with acute STEMI; 30 patients (46.9%) were hospitalized during the COVID-19 pandemic. Patients with STEMI in both the COVID-19 and control groups had similar comorbidities, Killip classification score, and clinical presentations. The median (interquartile range) time from symptom onset to reperfusion (total ischemic time) increased from 99.5 minutes (84.8-132) in 2019 to 149 minutes (96.3-231.8; P = .032) in 2020. Hospitalization during the COVID-19 period was associated with an increased risk for combined in-hospital outcome (odds ratio, 3.96; P = .046).
Conclusion: Patients with STEMI admitted during the first wave of the COVID-19 outbreak experienced longer total ischemic time and increased risk for combined in-hospital outcomes compared to patients admitted during the corresponding period in 2019.
Keywords: myocardial infarction, acute coronary syndrome, hospitalization, outcomes.
The emergence of the SARS-Cov-2 virus in December 2019 caused a worldwide shift in resource allocation and the restructuring of health care systems within the span of a few months. With the rapid spread of infection, the World Health Organization officially declared a pandemic in March 2020. The pandemic led to the deferral and cancellation of in-person patient visits, routine diagnostic studies, and nonessential surgeries and procedures. This response occurred secondary to a joint effort to reduce transmission via stay-at-home mandates and appropriate social distancing.1
Alongside the reduction in elective procedures and health care visits, significant reductions in hospitalization rates due to decreases in acute ST-segment elevation myocardial infarction (STEMI) and catheterization laboratory utilization have been reported in many studies from around the world.2-7 Comprehensive data demonstrating the impact of the COVID-19 pandemic on acute STEMI patient characteristics, clinical presentation, and in-hospital outcomes are lacking. Although patients with previously diagnosed cardiovascular disease are more likely to encounter worse outcomes in the setting of COVID-19, there may also be an indirect impact of the pandemic on high-risk patients, including those without the infection.8 Several theories have been hypothesized to explain this phenomenon. One theory postulates that the fear of contracting the virus during hospitalization is great enough to prevent patients from seeking care.2 Another theory suggests that the increased utilization of telemedicine prevents exacerbation of chronic conditions and the need for hospitalization.9 Contrary to this trend, previous studies have shown an increased incidence of acute STEMI following stressful events such as natural disasters.10
The aim of this study was to describe trends pertaining to clinical characteristics and in-hospital outcomes of patients with acute STEMI during the early COVID-19 pandemic at Piedmont Athens Regional (PAR), a 330-bed tertiary referral center in Northeast Georgia.
Methods
A retrospective cohort study was conducted at PAR to evaluate patients with STEMI admitted to the cardiovascular intensive care unit over an 8-week period (March 5 to May 5, 2020) during the COVID-19 outbreak. COVID-19 was declared a national emergency on March 13, 2020, in the United States. The institutional review board at PAR approved the study; the need for individual consent was waived under the condition that participant data would undergo de-identification and be strictly safeguarded.
Data Collection
Because there are seasonal variations in cardiovascular admissions, patient data from a control period (March 9 to May 9, 2019) were obtained to compare with data from the 2020 period. The number of patients with the diagnosis of acute STEMI during the COVID-19 period was recorded. Demographic data, clinical characteristics, and primary angiographic findings were gathered for all patients. Time from symptom onset to hospital admission and time from hospital admission to reperfusion (defined as door-to-balloon time) were documented for each patient. Killip classification was used to assess patients’ clinical status on admission. Length of stay was determined as days from hospital admission to discharge or death (if occurring during the same hospitalization).
Adverse in-hospital complications were also recorded. These were selected based on inclusion of the following categories of acute STEMI complications: ischemic, mechanical, arrhythmic, embolic, and inflammatory. The following complications occurred in our patient cohort: sustained ventricular arrhythmia, congestive heart failure (CHF) defined as congestion requiring intravenous diuretics, re-infarction, mechanical complications (free-wall rupture, ventricular septal defect, or mitral regurgitation), second- or third-degree atrioventricular block, atrial fibrillation, stroke, mechanical ventilation, major bleeding, pericarditis, cardiogenic shock, cardiac arrest, and in-hospital mortality. The primary outcome of this study was defined as a composite of sustained ventricular arrhythmia, CHF with congestion requiring intravenous diuretics, and/or in-hospital mortality. Ventricular arrythmia and CHF were included in the composite outcome because they are defined as the 2 most common causes of sudden cardiac death following acute STEMI.11,12
Statistical Analysis
Normally distributed continuous variables and categorical variables were compared using the paired t-test. A 2-sided P value <.05 was considered to be statistically significant. Mean admission rates for acute STEMI hospitalizations were determined by dividing the number of admissions by the number of days in each time period. The daily rate of COVID-19 cases per 100,000 individuals was obtained from the Centers for Disease Control and Prevention COVID-19 database. All data analyses were performed using Microsoft Excel.
Results
The study cohort consisted of 64 patients, of whom 30 (46.9%) were hospitalized between March 5 and May 5, 2020, and 34 (53.1%) who were admitted during the analogous time period in 2019. This reflected a 6% decrease in STEMI admissions at PAR in the COVID-19 cohort.
Acute STEMI Hospitalization Rates and COVID-19 Incidence
The mean daily acute STEMI admission rate was 0.50 during the study period compared to 0.57 during the control period. During the study period in 2020 in the state of Georgia, the daily rate of newly confirmed COVID-19 cases ranged from 0.194 per 100,000 on March 5 to 8.778 per 100,000 on May 5. Results of COVID-19 testing were available for 9 STEMI patients, and of these 0 tests were positive.
Baseline Characteristics
Baseline characteristics of the acute STEMI cohorts are presented in Table 1. Approximately 75% were male; median (interquartile range [IQR]) age was 60 (51-72) years. There were no significant differences in age and gender between the study periods. Three-quarters of patients had a history of hypertension, and 87.5% had a history of dyslipidemia. There was no significant difference in baseline comorbidity profiles between the 2 study periods; therefore, our sample populations shared similar characteristics.
Clinical Presentation
Significant differences were observed regarding the time intervals of STEMI patients in the COVID-19 period and the control period (Table 2). Median time from symptom onset to hospital admission (patient delay) was extended from 57.5 minutes (IQR, 40.3-106) in 2019 to 93 minutes (IQR, 48.8-132) in 2020; however, this difference was not statistically significant (P = .697). Median time from hospital admission to reperfusion (system delay) was prolonged from 45 minutes (IQR, 28-61) in 2019 to 78 minutes (IQR, 50-110) in 2020 (P < .001). Overall time from symptom onset to reperfusion (total ischemic time) increased from 99.5 minutes (IQR, 84.8-132) in 2019 to 149 minutes (IQR, 96.3-231.8) in 2020 (P = .032).
Regarding mode of transportation, 23.5% of patients in 2019 were walk-in admissions to the emergency department. During the COVID-19 period, walk-in admissions decreased to 6.7% (P = .065). There were no significant differences between emergency medical service, transfer, or in-patient admissions for STEMI cases between the 2 study periods.
Killip classification scores were calculated for all patients on admission; 90.6% of patients were classified as Killip Class 1. There was no significant difference between hemodynamic presentations during the COVID-19 period compared to the control period.
Angiographic Data
Overall, 53 (82.8%) patients admitted with acute STEMI underwent coronary angiography during their hospital stay. The proportion of patients who underwent primary reperfusion was greater in the control period than in the COVID-19 period (85.3% vs 80%; P = .582). Angiographic characteristics and findings were similar between the 2 study groups (Table 2).
In-Hospital Outcomes
In-hospital outcome data were available for all patients. As shown in Table 3, hospitalization during the COVID-19 period was independently associated with an increased risk for combined in-hospital outcome (odds ratio, 3.96; P = .046). The rate of in-hospital mortality was greater in the COVID-19 period (P = .013). We found no significant difference when comparing secondary outcomes from admissions during the COVID-19 period and the control period in 2019. For the 5 patients who died during the study period, the primary diagnosis at death was acute STEMI complicated by CHF (3 patients) or cardiogenic shock (2 patients).
Discussion
This single-center retrospective study at PAR looks at the impact of COVID-19 on hospitalizations for acute STEMI during the initial peak of the pandemic. The key findings of this study show a significant increase in ischemic time parameters (symptom onset to reperfusion, hospital admission to reperfusion), in-hospital mortality, and combined in-hospital outcomes.
There was a 49.5-minute increase in total ischemic time noted in this study (P = .032). Though there was a numerical increase in time of symptom onset to hospital admission by 23.5 minutes, this difference was not statistically significant (P = .697). However, this study observed a statistically significant 33-minute increase in ischemic time from hospital admission to reperfusion (P < .001). Multiple studies globally have found a similar increase in total ischemic times, including those conducted in China and Europe.13-15 Every level of potential delay must be considered, including pre-hospital, triage and emergency department, and/or reperfusion team. Pre-hospital sources of delays that have been suggested include “stay-at-home” orders and apprehension to seek medical care due to concern about contracting the virus or overwhelming the health care facilities. There was a clinically significant 4-fold decrease in the number of walk-in acute STEMI cases in the study period. In 2019, there were 8 walk-in cases compared to 2 cases in 2020 (P = .065). However, this change was not statistically significant. In-hospital/systemic sources of delays have been mentioned in other studies; they include increased time taken to rule out COVID-19 (nasopharyngeal swab/chest x-ray) and increased time due to the need for intensive gowning and gloving procedures by staff. It was difficult to objectively determine the sources of system delay by the reperfusion team due to a lack of quantitative data.
In the current study, we found a significant increase in in-hospital mortality during the COVID-19 period compared to a parallel time frame in 2019. This finding is contrary to a multicenter study from Spain that reported no difference in in-hospital outcomes or mortality rates among all acute coronary syndrome cases.16 The worsening outcomes and prognosis may simply be a result of increased ischemic time; however, the virus that causes COVID-19 itself may play a role as well. Studies have found that SARS-Cov-2 infection places patients at greater risk for cardiovascular conditions such as hypercoagulability, myocarditis, and arrhythmias.17 In our study, however, there were no acute STEMI patients who tested positive for COVID-19. Therefore, we cannot discuss the impact of increased thrombus burden in patients with COVID-19. Piedmont Healthcare published a STEMI treatment protocol in May 2020 that advised increased use of tissue plasminogen activator (tPA) in COVID-19-positive cases; during the study period, however, there were no occasions when tPA use was deemed appropriate based on clinical judgment.
Our findings align with previous studies that describe an increase in combined in-hospital adverse outcomes during the COVID-19 era. Previous studies detected a higher rate of complications in the COVID-19 cohort, but in the current study, the adverse in-hospital course is unrelated to underlying infection.18,19 This study reports a higher incidence of major in-hospital outcomes, including a 65% increase in the rate of combined in-hospital outcomes, which is similar to a multicenter study conducted in Israel.19 There was a 2.3-fold numerical increase in sustained ventricular arrhythmias and a 2.5-fold numerical increase in the incidence of cardiac arrest in the study period. This phenomenon was observed despite a similar rate of reperfusion procedures in both groups.
Acute STEMI is a highly fatal condition with an incidence of 8.5 in 10,000 annually in the United States. While studies across the world have shown a 25% to 40% reduction in the rate of hospitalized acute coronary syndrome cases during the COVID-19 pandemic, the decrease from 34 to 30 STEMI admissions at PAR is not statistically significant.20 Possible reasons for the reduction globally include increased out-of-hospital mortality and decreased incidence of acute STEMI across the general population as a result of improved access to telemedicine or decreased levels of life stressors.20
In summary, there was an increase in ischemic time to reperfusion, in-hospital mortality, and combined in-hospital outcomes for acute STEMI patients at PAR during the COVID period.
Limitations
This study has several limitations. This is a single-center study, so the sample size is small and may not be generalizable to a larger population. This is a retrospective observational study, so causation cannot be inferred. This study analyzed ischemic time parameters as average rates over time rather than in an interrupted time series. Post-reperfusion outcomes were limited to hospital stay. Post-hospital follow-up would provide a better picture of the effects of STEMI intervention. There is no account of patients who died out-of-hospital secondary to acute STEMI. COVID-19 testing was not introduced until midway in our study period. Therefore, we cannot rule out the possibility of the SARS-Cov-2 virus inciting acute STEMI and subsequently leading to worse outcomes and poor prognosis.
Conclusions
This study provides an analysis of the incidence, characteristics, and clinical outcomes of patients presenting with acute STEMI during the early period of the COVID-19 pandemic. In-hospital mortality and ischemic time to reperfusion increased while combined in-hospital outcomes worsened.
Acknowledgment: The authors thank Piedmont Athens Regional IRB for approving this project and allowing access to patient data.
Corresponding author: Syed H. Ali; Department of Medicine, Medical College of Georgia at the Augusta University-University of Georgia Medical Partnership, 30606, Athens, GA; syedha.ali@gmail.com
Disclosures: None reported.
doi:10.12788/jcom.0085
1. Bhatt AS, Moscone A, McElrath EE, et al. Fewer hospitalizations for acute cardiovascular conditions during the COVID-19 pandemic. J Am Coll Cardiol. 2020;76(3):280-288. doi:10.1016/j.jacc.2020.05.038
2. Metzler B, Siostrzonek P, Binder RK, Bauer A, Reinstadler SJR. Decline of acute coronary syndrome admissions in Austria since the outbreak of Covid-19: the pandemic response causes cardiac collateral damage. Eur Heart J. 2020;41:1852-1853. doi:10.1093/eurheartj/ehaa314
3. De Rosa S, Spaccarotella C, Basso C, et al. Reduction of hospitalizations for myocardial infarction in Italy in the Covid-19 era. Eur Heart J. 2020;41(22):2083-2088.
4. Wilson SJ, Connolly MJ, Elghamry Z, et al. Effect of the COVID-19 pandemic on ST-segment-elevation myocardial infarction presentations and in-hospital outcomes. Circ Cardiovasc Interv. 2020; 13(7):e009438. doi:10.1161/CIRCINTERVENTIONS.120.009438
5. Mafham MM, Spata E, Goldacre R, et al. Covid-19 pandemic and admission rates for and management of acute coronary syndromes in England. Lancet. 2020;396 (10248):381-389. doi:10.1016/S0140-6736(20)31356-8
6. Bhatt AS, Moscone A, McElrath EE, et al. Fewer Hospitalizations for acute cardiovascular conditions during the COVID-19 pandemic. J Am Coll Cardiol. 2020;76(3):280-288. doi:10.1016/j.jacc.2020.05.038
7. Tam CF, Cheung KS, Lam S, et al. Impact of Coronavirus disease 2019 (Covid-19) outbreak on ST-segment elevation myocardial infarction care in Hong Kong, China. Circ Cardiovasc Qual Outcomes. 2020;13(4):e006631. doi:10.1161/CIRCOUTCOMES.120.006631
8. Clerkin KJ, Fried JA, Raikhelkar J, et al. Coronavirus disease 2019 (COVID-19) and cardiovascular disease. Circulation. 2020;141:1648-1655. doi:10.1161/CIRCULATIONAHA.120.046941
9. Ebinger JE, Shah PK. Declining admissions for acute cardiovascular illness: The Covid-19 paradox. J Am Coll Cardiol. 2020;76(3):289-291. doi:10.1016/j.jacc.2020.05.039
10 Leor J, Poole WK, Kloner RA. Sudden cardiac death triggered by an earthquake. N Engl J Med. 1996;334(7):413-419. doi:10.1056/NEJM199602153340701
11. Hiramori K. Major causes of death from acute myocardial infarction in a coronary care unit. Jpn Circ J. 1987;51(9):1041-1047. doi:10.1253/jcj.51.1041
12. Bui AH, Waks JW. Risk stratification of sudden cardiac death after acute myocardial infarction. J Innov Card Rhythm Manag. 2018;9(2):3035-3049. doi:10.19102/icrm.2018.090201
13. Xiang D, Xiang X, Zhang W, et al. Management and outcomes of patients with STEMI during the COVID-19 pandemic in China. J Am Coll Cardiol. 2020;76(11):1318-1324. doi:10.1016/j.jacc.2020.06.039
14. Hakim R, Motreff P, Rangé G. COVID-19 and STEMI. [Article in French]. Ann Cardiol Angeiol (Paris). 2020;69(6):355-359. doi:10.1016/j.ancard.2020.09.034
15. Soylu K, Coksevim M, Yanık A, Bugra Cerik I, Aksan G. Effect of Covid-19 pandemic process on STEMI patients timeline. Int J Clin Pract. 2021;75(5):e14005. doi:10.1111/ijcp.14005
16. Salinas P, Travieso A, Vergara-Uzcategui C, et al. Clinical profile and 30-day mortality of invasively managed patients with suspected acute coronary syndrome during the COVID-19 outbreak. Int Heart J. 2021;62(2):274-281. doi:10.1536/ihj.20-574
17. Hu Y, Sun J, Dai Z, et al. Prevalence and severity of corona virus disease 2019 (Covid-19): a systematic review and meta-analysis. J Clin Virol. 2020;127:104371. doi:10.1016/j.jcv.2020.104371
18. Rodriguez-Leor O, Cid Alvarez AB, Perez de Prado A, et al. In-hospital outcomes of COVID-19 ST-elevation myocardial infarction patients. EuroIntervention. 2021;16(17):1426-1433. doi:10.4244/EIJ-D-20-00935
19. Fardman A, Zahger D, Orvin K, et al. Acute myocardial infarction in the Covid-19 era: incidence, clinical characteristics and in-hospital outcomes—A multicenter registry. PLoS ONE. 2021;16(6): e0253524. doi:10.1371/journal.pone.0253524
20. Pessoa-Amorim G, Camm CF, Gajendragadkar P, et al. Admission of patients with STEMI since the outbreak of the COVID-19 pandemic: a survey by the European Society of Cardiology. Eur Heart J Qual Care Clin Outcomes. 2020;6(3):210-216. doi:10.1093/ehjqcco/qcaa046
Oxygen Therapies and Clinical Outcomes for Patients Hospitalized With COVID-19: First Surge vs Second Surge
From Lahey Hospital and Medical Center, Burlington, MA (Drs. Liesching and Lei), and Tufts University School of Medicine, Boston, MA (Dr. Liesching)
ABSTRACT
Objective: To compare the utilization of oxygen therapies and clinical outcomes of patients admitted for COVID-19 during the second surge of the pandemic to that of patients admitted during the first surge.
Design: Observational study using a registry database.
Setting: Three hospitals (791 inpatient beds and 76 intensive care unit [ICU] beds) within the Beth Israel Lahey Health system in Massachusetts.
Participants: We included 3183 patients with COVID-19 admitted to hospitals.
Measurements: Baseline data included demographics and comorbidities. Treatments included low-flow supplemental oxygen (2-6 L/min), high-flow oxygen via nasal cannula, and invasive mechanical ventilation. Outcomes included ICU admission, length of stay, ventilator days, and mortality.
Results: A total of 3183 patients were included: 1586 during the first surge and 1597 during the second surge. Compared to the first surge, patients admitted during the second surge had a similar rate of receiving low-flow supplemental oxygen (65.8% vs 64.1%, P = .3), a higher rate of receiving high-flow nasal cannula (15.4% vs 10.8%, P = .0001), and a lower ventilation rate (5.6% vs 9.7%, P < .0001). The outcomes during the second surge were better than those during the first surge: lower ICU admission rate (8.1% vs 12.7%, P < .0001), shorter length of hospital stay (5 vs 6 days, P < .0001), fewer ventilator days (10 vs 16, P = .01), and lower mortality (8.3% vs 19.2%, P < .0001). Among ventilated patients, those who received high-flow nasal cannula had lower mortality.
Conclusion: Compared to the first surge of the COVID-19 pandemic, patients admitted during the second surge had similar likelihood of receiving low-flow supplemental oxygen, were more likely to receive high-flow nasal cannula, were less likely to be ventilated, and had better outcomes.
Keywords: supplemental oxygen, high-flow nasal cannula, ventilator.
The respiratory system receives the major impact of SARS-CoV-2 virus, and hypoxemia has been the predominant diagnosis for patients hospitalized with COVID-19.1,2 During the initial stage of the pandemic, oxygen therapies and mechanical ventilation were the only choices for these patients.3-6 Standard-of-care treatment for patients with COVID-19 during the initial surge included oxygen therapies and mechanical ventilation for hypoxemia and medications for comorbidities and COVID-19–associated sequelae, such as multi-organ dysfunction and failure. A report from New York during the first surge (May 2020) showed that among 5700 hospitalized patients with COVID-19, 27.8% received supplemental oxygen and 12.2% received invasive mechanical ventilation.7 High-flow nasal cannula (HFNC) oxygen delivery has been utilized widely throughout the pandemic due to its superiority over other noninvasive respiratory support techniques.8-12 Mechanical ventilation is always necessary for critically ill patients with acute respiratory distress syndrome. However, ventilator scarcity has become a bottleneck in caring for severely ill patients with COVID-19 during the pandemic.13
The clinical outcomes of hospitalized COVID-19 patients include a high intubation rate, long length of hospital and intensive care unit (ICU) stay, and high mortality.14,15 As the pandemic evolved, new medications, including remdesivir, hydroxychloroquine, lopinavir, or interferon β-1a, were used in addition to the standard of care, but these did not result in significantly different mortality from standard of care.16 Steroids are becoming foundational to the treatment of severe COVID-19 pneumonia, but evidence from high-quality randomized controlled clinical trials is lacking.17
During the first surge from March to May 2020, Massachusetts had the third highest number of COVID-19 cases among states in the United States.18 In early 2021, COVID-19 cases were climbing close to the peak of the second surge in Massachusetts. In this study, we compared utilization of low-flow supplemental oxygen, HFNC, and mechanical ventilation and clinical outcomes of patients admitted to 3 hospitals in Massachusetts during the second surge of the pandemic to that of patients admitted during the first surge.
Methods
Setting
Beth Israel Lahey Health is a system of academic and teaching hospitals with primary care and specialty care providers. We included 3 centers within the Beth Israel Lahey Health system in Massachusetts: Lahey Hospital and Medical Center, with 335 inpatient hospital beds and 52 critical care beds; Beverly Hospital, with 227 beds and 14 critical care beds; and Winchester Hospital, with 229 beds and 10 ICU beds.
Participants
We included patients admitted to the 3 hospitals with COVID-19 as a primary or secondary diagnosis during the first surge of the pandemic (March 1, 2020 to June 15, 2020) and the second surge (November 15, 2020 to January 27, 2021). The timeframe of the first surge was defined as the window between the start date and the end date of data collection. During the time window of the first surge, 1586 patients were included. The start time of the second surge was defined as the date when the data collection was restarted; the end date was set when the number of patients (1597) accumulated was close to the number of patients in the first surge (1586), so that the two groups had similar sample size.
Study Design
A data registry of COVID-19 patients was created by our institution, and the data were prospectively collected starting in March 2020. We retrospectively extracted data on the following from the registry database for this observational study: demographics and baseline comorbidities; the use of low-flow supplemental oxygen, HFNC, and invasive mechanical ventilator; and ICU admission, length of hospital stay, length of ICU stay, and hospital discharge disposition. Start and end times for each oxygen therapy were not entered in the registry. Data about other oxygen therapies, such as noninvasive positive-pressure ventilation, were not collected in the registry database, and therefore were not included in the analysis.
Statistical Analysis
Continuous variables (eg, age) were tested for data distribution normality using the Shapiro-Wilk test. Normally distributed data were tested using unpaired t-tests and displayed as mean (SD). The skewed data were tested using the Wilcoxon rank sum test and displayed as median (interquartile range [IQR]). The categorical variables were compared using chi-square test. Comparisons with P ≤ .05 were considered significantly different. Statistical analysis for this study was generated using Statistical Analysis Software (SAS), version 9.4 for Windows (SAS Institute Inc.).
Results
Baseline Characteristics
We included 3183 patients: 1586 admitted during the first surge and 1597 admitted during the second surge. Baseline characteristics of patients with COVID-19 admitted during the first and second surges are shown in Table 1. Patients admitted during the second surge were older (73 years vs 71 years, P = .01) and had higher rates of hypertension (64.8% vs 59.6%, P = .003) and asthma (12.9% vs 10.7%, P = .049) but a lower rate of interstitial lung disease (3.3% vs 7.7%, P < .001). Sequential organ failure assessment scores at admission and the rates of other comorbidities were not significantly different between the 2 surges.

Oxygen Therapies
The number of patients who were hospitalized and received low-flow supplemental oxygen, and/or HFNC, and/or ventilator in the first surge and the second surge is shown in the Figure. Of all patients included, 2067 (64.9%) received low-flow supplemental oxygen; of these, 374 (18.1%) subsequently received HFNC, and 85 (22.7%) of these subsequently received mechanical ventilation. Of all 3183 patients, 417 (13.1%) received HFNC; 43 of these patients received HFNC without receiving low-flow supplemental oxygen, and 98 (23.5%) subsequently received mechanical ventilation. Out of all 3183 patients, 244 (7.7%) received mechanical ventilation; 98 (40.2%) of these received HFNC while the remaining 146 (59.8%) did not. At the beginning of the first surge, the ratio of patients who received invasive mechanical ventilation to patients who received HFNC was close to 1:1 (10/10); the ratio decreased to 6:10 in May and June 2020. At the beginning of the second surge, the ratio was 8:10 and then decreased to 3:10 in December 2020 and January 2021.
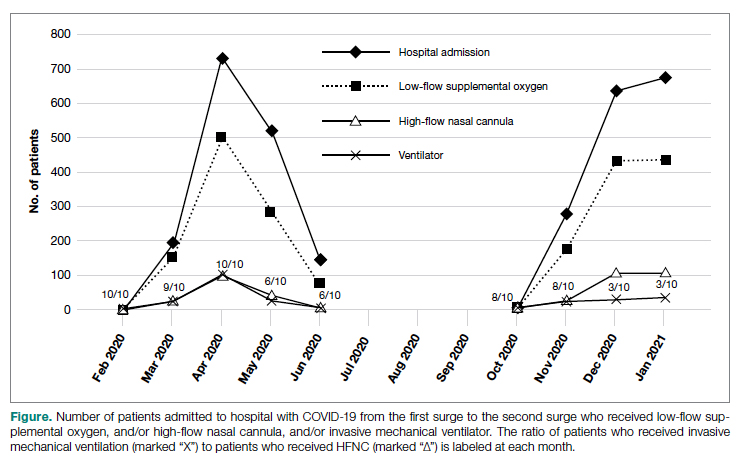
As shown in Table 2, the proportion of patients who received low-flow supplemental oxygen during the second surge was similar to that during the first surge (65.8% vs 64.1%, P = .3). Patients admitted during the second surge were more likely to receive HFNC than patients admitted during the first surge (15.4% vs 10.8%, P = .0001). Patients admitted during the second surge were less likely to be ventilated than the patients admitted during the first surge (5.6% vs 9.7%, P < .0001).
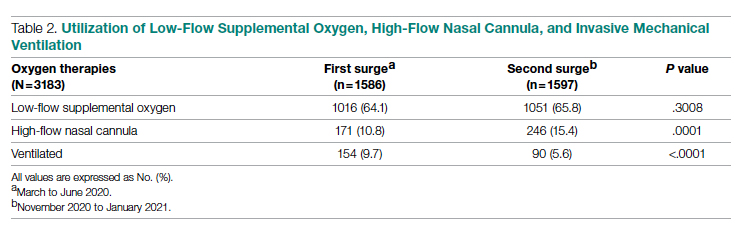
Clinical Outcomes
As shown in Table 3, second surge outcomes were much better than first surge outcomes: the ICU admission rate was lower (8.1% vs 12.7%, P < .0001); patients were more likely to be discharged to home (60.2% vs 47.4%, P < .0001), had a shorter length of hospital stay (5 vs 6 days, P < .0001), and had fewer ventilator days (10 vs 16, P = .01); and mortality was lower (8.3% vs 19.2%, P < .0001). There was a trend that length of ICU stay was shorter during the second surge than during the first surge (7 days vs 9 days, P = .09).
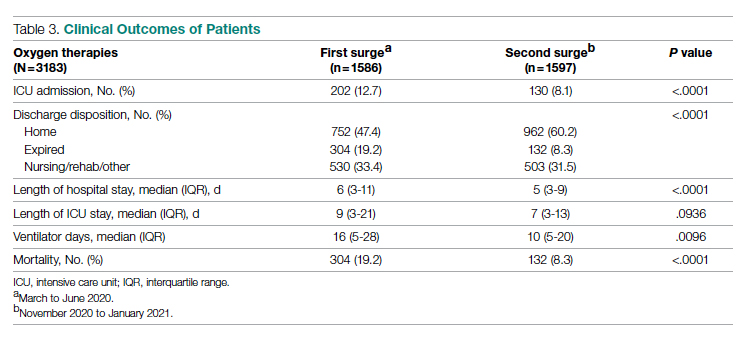
As noted (Figure), the ratio of patients who received invasive mechanical ventilation to patients who received HFNC was decreasing during both the first surge and the second surge. To further analyze the relation between ventilator and HFNC, we performed a subgroup analysis for 244 ventilated patients during both surges to compare outcomes between patients who received HFNC and those who did not receive HFNC (Table 4). Ninety-eight (40%) patients received HFNC. Ventilated patients who received HFNC had lower mortality than those patients who did not receive HFNC (31.6% vs 48%, P = .01), but had a longer length of hospital stay (29 days vs 14 days, P < .0001), longer length of ICU stay (17 days vs 9 days, P < .0001), and a higher number of ventilator days (16 vs 11, P = .001).
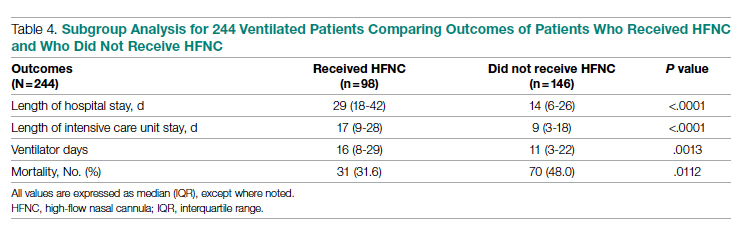
Discussion
Our study compared the baseline patient characteristics; utilization of low-flow supplemental oxygen therapy, HFNC, and mechanical ventilation; and clinical outcomes between the first surge (n = 1586) and the second surge (n = 1597) of the COVID-19 pandemic. During both surges, about two-thirds of admitted patients received low-flow supplemental oxygen. A higher proportion of the admitted patients received HFNC during the second surge than during the first surge, while the intubation rate was lower during the second surge than during the first surge.
Reported low-flow supplemental oxygen use ranged from 28% to 63% depending on the cohort characteristics and location during the first surge.6,7,19 A report from New York during the first surge (March 1 to April 4, 2020) showed that among 5700 hospitalized patients with COVID-19, 27.8% received low-flow supplemental oxygen.7 HFNC is recommended in guidelines on management of patients with acute respiratory failure due to COVID-19.20 In our study, HFNC was utilized in a higher proportion of patients admitted for COVID-19 during the second surge (15.5% vs 10.8%, P = .0001). During the early pandemic period in Wuhan, China, 11% to 21% of admitted COVID-19 patients received HFNC.21,22 Utilization of HFNC in New York during the first surge (March to May 2020) varied from 5% to 14.3% of patients admitted with COVID-19.23,24 Our subgroup analysis of the ventilated patients showed that patients who received HFNC had lower mortality than those who did not (31.6% vs 48.0%, P = .011). Comparably, a report from Paris, France, showed that among patients admitted to ICUs for acute hypoxemic respiratory failure, those who received HFNC had lower mortality at day 60 than those who did not (21% vs 31%, P = .052).25 Our recent analysis showed that patients treated with HFNC prior to mechanical ventilation had lower mortality than those treated with only conventional oxygen (30% vs 52%, P = .05).26 In this subgroup analysis, we could not determine if HFNC treatment was administered before or after ventilation because HFNC was entered as dichotomous data (“Yes” or “No”) in the registry database. We merely showed the beneficial effect of HFNC on reducing mortality for ventilated COVID-19 patients, but did not mean to focus on how and when to apply HFNC.
We observed that the patients admitted during the second surge were less likely to be ventilated than the patients admitted during the first surge (5.6% vs 9.7%, P < .0001). During the first surge in New York, among 5700 patients admitted with COVID-19, 12.2% received invasive mechanical ventilation.7 In another report, also from New York during the first surge, 26.1% of 2015 hospitalized COVID-19 patients received mechanical ventilation.27 In our study, the ventilation rate of 9.7% during the first surge was lower.
Outcomes during the second surge were better than during the first surge, including ICU admission rate, hospital and ICU length of stay, ventilator days, and mortality. The mortality was 19.2% during the first surge vs 8.3% during the second surge (P < .0001). The mortality of 19.2% was lower than the 30.6% mortality reported for 2015 hospitalized COVID-19 patients in New York during the first surge.27 A retrospective study showed that early administration of remdesivir was associated with reduced ICU admission, ventilation use, and mortality.28 The RECOVERY clinical trial showed that dexamethasone improved mortality for COVID-19 patients who received respiratory support, but not for patients who did not receive any respiratory support.29 Perhaps some, if not all, of the improvement in ICU admission and mortality during the second surge was attributed to the new medications, such as antivirals and steroids.
The length of hospital stay for patients with moderate to severe COVID-19 varied from 4 to 53 days at different locations of the world, as shown in a meta-analysis by Rees and colleagues.30 Our results showing a length of stay of 6 days during the first surge and 5 days during the second surge fell into the shorter end of this range. In a retrospective analysis of 1643 adults with severe COVID-19 admitted to hospitals in New York City between March 9, 2020 and April 23, 2020, median hospital length of stay was 7 (IQR, 3-14) days.31 For the ventilated patients in our study, the length of stay of 14 days (did not receive HFNC) and 29 days (received HFNC) was much longer. This longer length of stay might be attributed to the patients in our study being older and having more severe comorbidities.
The main purpose of this study was to compare the oxygen therapies and outcomes between 2 surges. It is difficult to associate the clinical outcomes with the oxygen therapies because new therapies and medications were available after the first surge. It was not possible to adjust the outcomes with confounders (other therapies and medications) because the registry data did not include the new therapies and medications.
A strength of this study was that we included a large, balanced number of patients in the first surge and the second surge. We did not plan the sample size in both groups as we could not predict the number of admissions. We set the end date of data collection for analysis as the time when the number of patients admitted during the second surge was similar to the number of patients admitted during the first surge. A limitation was that the registry database was created by the institution and was not designed solely for this study. The data for oxygen therapies were limited to low-flow supplemental oxygen, HFNC, and invasive mechanical ventilation; data for noninvasive ventilation were not included.
Conclusion
At our centers, during the second surge of COVID-19 pandemic, patients hospitalized with COVID-19 infection were more likely to receive HFNC but less likely to be ventilated. Compared to the first surge, the hospitalized patients with COVID-19 infection had a lower ICU admission rate, shorter length of hospital stay, fewer ventilator days, and lower mortality. For ventilated patients, those who received HFNC had lower mortality than those who did not.
Corresponding author: Timothy N. Liesching, MD, 41 Mall Road, Burlington, MA 01805; Timothy.N.Liesching@lahey.org
Disclosures: None reported.
doi:10.12788/jcom.0086
1. Xie J, Covassin N, Fan Z, et al. Association between hypoxemia and mortality in patients with COVID-19. Mayo Clin Proc. 2020;95(6):1138-1147. doi:10.1016/j.mayocp.2020.04.006
2. Asleh R, Asher E, Yagel O, et al. Predictors of hypoxemia and related adverse outcomes in patients hospitalized with COVID-19: a double-center retrospective study. J Clin Med. 2021;10(16):3581. doi:10.3390/jcm10163581
3. Choi KJ, Hong HL, Kim EJ. Association between oxygen saturation/fraction of inhaled oxygen and mortality in patients with COVID-19 associated pneumonia requiring oxygen therapy. Tuberc Respir Dis (Seoul). 2021;84(2):125-133. doi:10.4046/trd.2020.0126
4. Dixit SB. Role of noninvasive oxygen therapy strategies in COVID-19 patients: Where are we going? Indian J Crit Care Med. 2020;24(10):897-898. doi:10.5005/jp-journals-10071-23625
5. Gonzalez-Castro A, Fajardo Campoverde A, Medina A, et al. Non-invasive mechanical ventilation and high-flow oxygen therapy in the COVID-19 pandemic: the value of a draw. Med Intensiva (Engl Ed). 2021;45(5):320-321. doi:10.1016/j.medine.2021.04.001
6. Pan W, Li J, Ou Y, et al. Clinical outcome of standardized oxygen therapy nursing strategy in COVID-19. Ann Palliat Med. 2020;9(4):2171-2177. doi:10.21037/apm-20-1272
7. Richardson S, Hirsch JS, Narasimhan M, et al. Presenting characteristics, comorbidities, and outcomes among 5700 patients hospitalized with COVID-19 in the New York City area. JAMA. 2020;323(20):2052-2059. doi:10.1001/jama.2020.6775
8. He G, Han Y, Fang Q, et al. Clinical experience of high-flow nasal cannula oxygen therapy in severe COVID-19 patients. Article in Chinese. Zhejiang Da Xue Xue Bao Yi Xue Ban. 2020;49(2):232-239. doi:10.3785/j.issn.1008-9292.2020.03.13
9. Lalla U, Allwood BW, Louw EH, et al. The utility of high-flow nasal cannula oxygen therapy in the management of respiratory failure secondary to COVID-19 pneumonia. S Afr Med J. 2020;110(6):12941.
10. Zhang TT, Dai B, Wang W. Should the high-flow nasal oxygen therapy be used or avoided in COVID-19? J Transl Int Med. 2020;8(2):57-58. doi:10.2478/jtim-2020-0018
11. Agarwal A, Basmaji J, Muttalib F, et al. High-flow nasal cannula for acute hypoxemic respiratory failure in patients with COVID-19: systematic reviews of effectiveness and its risks of aerosolization, dispersion, and infection transmission. Can J Anaesth. 2020;67(9):1217-1248. doi:10.1007/s12630-020-01740-2
12. Geng S, Mei Q, Zhu C, et al. High flow nasal cannula is a good treatment option for COVID-19. Heart Lung. 2020;49(5):444-445. doi:10.1016/j.hrtlng.2020.03.018
13. Feinstein MM, Niforatos JD, Hyun I, et al. Considerations for ventilator triage during the COVID-19 pandemic. Lancet Respir Med. 2020;8(6):e53. doi:10.1016/S2213-2600(20)30192-2
14. Wu Z, McGoogan JM. Characteristics of and important lessons from the coronavirus disease 2019 (COVID-19) outbreak in China: summary of a report of 72314 cases from the Chinese Center for Disease Control and Prevention. JAMA. 2020;323(13):1239-1242. doi:10.1001/jama.2020.2648
15. Rojas-Marte G, Hashmi AT, Khalid M, et al. Outcomes in patients with COVID-19 disease and high oxygen requirements. J Clin Med Res. 2021;13(1):26-37. doi:10.14740/jocmr4405
16. Zhang R, Mylonakis E. In inpatients with COVID-19, none of remdesivir, hydroxychloroquine, lopinavir, or interferon β-1a differed from standard care for in-hospital mortality. Ann Intern Med. 2021;174(2):JC17. doi:10.7326/ACPJ202102160-017
17. Rello J, Waterer GW, Bourdiol A, Roquilly A. COVID-19, steroids and other immunomodulators: The jigsaw is not complete. Anaesth Crit Care Pain Med. 2020;39(6):699-701. doi:10.1016/j.accpm.2020.10.011
18. Dargin J, Stempek S, Lei Y, Gray Jr. A, Liesching T. The effect of a tiered provider staffing model on patient outcomes during the coronavirus disease 2019 pandemic: A single-center observational study. Int J Crit Illn Inj Sci. 2021;11(3). doi:10.4103/ijciis.ijciis_37_21
19. Ni YN, Wang T, Liang BM, Liang ZA. The independent factors associated with oxygen therapy in COVID-19 patients under 65 years old. PLoS One. 2021;16(1):e0245690. doi:10.1371/journal.pone.0245690
20. Alhazzani W, Moller MH, Arabi YM, et al. Surviving Sepsis Campaign: guidelines on the management of critically ill adults with coronavirus disease 2019 (COVID-19). Crit Care Med. 2020;48(6):e440-e469. doi:10.1097/CCM.0000000000004363
21. Wang D, Hu B, Hu C, et al. Clinical characteristics of 138 hospitalized patients with 2019 novel coronavirus-infected pneumonia in Wuhan, China. JAMA. 2020;323(11):1061-1069. doi:10.1001/jama.2020.1585
22. Zhou F, Yu T, Du R, et al. Clinical course and risk factors for mortality of adult inpatients with COVID-19 in Wuhan, China: a retrospective cohort study. Lancet. 2020;395(10229):1054-1062. doi:10.1016/S0140-6736(20)30566-3
23. Argenziano MG, Bruce SL, Slater CL, et al. Characterization and clinical course of 1000 patients with coronavirus disease 2019 in New York: retrospective case series. BMJ. 2020;369:m1996. doi:10.1136/bmj.m1996
24. Cummings MJ, Baldwin MR, Abrams D, et al. Epidemiology, clinical course, and outcomes of critically ill adults with COVID-19 in New York City: a prospective cohort study. Lancet. 2020;395(10239):1763-1770. doi:10.1016/S0140-6736(20)31189-2
25. Demoule A, Vieillard Baron A, Darmon M, et al. High-flow nasal cannula in critically ill patients with severe COVID-19. Am J Respir Crit Care Med. 2020;202(7):1039-1042. doi:10.1164/rccm.202005-2007LE
26. Hansen CK, Stempek S, Liesching T, Lei Y, Dargin J. Characteristics and outcomes of patients receiving high flow nasal cannula therapy prior to mechanical ventilation in COVID-19 respiratory failure: a prospective observational study. Int J Crit Illn Inj Sci. 2021;11(2):56-60. doi:10.4103/IJCIIS.IJCIIS_181_20
27. van Gerwen M, Alsen M, Little C, et al. Risk factors and outcomes of COVID-19 in New York City; a retrospective cohort study. J Med Virol. 2021;93(2):907-915. doi:10.1002/jmv.26337
28. Hussain Alsayed HA, Saheb Sharif-Askari F, Saheb Sharif-Askari N, Hussain AAS, Hamid Q, Halwani R. Early administration of remdesivir to COVID-19 patients associates with higher recovery rate and lower need for ICU admission: A retrospective cohort study. PLoS One. 2021;16(10):e0258643. doi:10.1371/journal.pone.0258643
29. RECOVERY Collaborative Group, Horby P, Lim WS, et al. Dexamethasone in hospitalized patients with Covid-19. N Engl J Med. 2021;384(8):693-704. doi:10.1056/NEJMoa2021436
30. Rees EM, Nightingale ES, Jafari Y, et al. COVID-19 length of hospital stay: a systematic review and data synthesis. BMC Med. 2020;18(1):270. doi:10.1186/s12916-020-01726-3
31. Anderson M, Bach P, Baldwin MR. Hospital length of stay for severe COVID-19: implications for Remdesivir’s value. medRxiv. 2020;2020.08.10.20171637. doi:10.1101/2020.08.10.20171637
From Lahey Hospital and Medical Center, Burlington, MA (Drs. Liesching and Lei), and Tufts University School of Medicine, Boston, MA (Dr. Liesching)
ABSTRACT
Objective: To compare the utilization of oxygen therapies and clinical outcomes of patients admitted for COVID-19 during the second surge of the pandemic to that of patients admitted during the first surge.
Design: Observational study using a registry database.
Setting: Three hospitals (791 inpatient beds and 76 intensive care unit [ICU] beds) within the Beth Israel Lahey Health system in Massachusetts.
Participants: We included 3183 patients with COVID-19 admitted to hospitals.
Measurements: Baseline data included demographics and comorbidities. Treatments included low-flow supplemental oxygen (2-6 L/min), high-flow oxygen via nasal cannula, and invasive mechanical ventilation. Outcomes included ICU admission, length of stay, ventilator days, and mortality.
Results: A total of 3183 patients were included: 1586 during the first surge and 1597 during the second surge. Compared to the first surge, patients admitted during the second surge had a similar rate of receiving low-flow supplemental oxygen (65.8% vs 64.1%, P = .3), a higher rate of receiving high-flow nasal cannula (15.4% vs 10.8%, P = .0001), and a lower ventilation rate (5.6% vs 9.7%, P < .0001). The outcomes during the second surge were better than those during the first surge: lower ICU admission rate (8.1% vs 12.7%, P < .0001), shorter length of hospital stay (5 vs 6 days, P < .0001), fewer ventilator days (10 vs 16, P = .01), and lower mortality (8.3% vs 19.2%, P < .0001). Among ventilated patients, those who received high-flow nasal cannula had lower mortality.
Conclusion: Compared to the first surge of the COVID-19 pandemic, patients admitted during the second surge had similar likelihood of receiving low-flow supplemental oxygen, were more likely to receive high-flow nasal cannula, were less likely to be ventilated, and had better outcomes.
Keywords: supplemental oxygen, high-flow nasal cannula, ventilator.
The respiratory system receives the major impact of SARS-CoV-2 virus, and hypoxemia has been the predominant diagnosis for patients hospitalized with COVID-19.1,2 During the initial stage of the pandemic, oxygen therapies and mechanical ventilation were the only choices for these patients.3-6 Standard-of-care treatment for patients with COVID-19 during the initial surge included oxygen therapies and mechanical ventilation for hypoxemia and medications for comorbidities and COVID-19–associated sequelae, such as multi-organ dysfunction and failure. A report from New York during the first surge (May 2020) showed that among 5700 hospitalized patients with COVID-19, 27.8% received supplemental oxygen and 12.2% received invasive mechanical ventilation.7 High-flow nasal cannula (HFNC) oxygen delivery has been utilized widely throughout the pandemic due to its superiority over other noninvasive respiratory support techniques.8-12 Mechanical ventilation is always necessary for critically ill patients with acute respiratory distress syndrome. However, ventilator scarcity has become a bottleneck in caring for severely ill patients with COVID-19 during the pandemic.13
The clinical outcomes of hospitalized COVID-19 patients include a high intubation rate, long length of hospital and intensive care unit (ICU) stay, and high mortality.14,15 As the pandemic evolved, new medications, including remdesivir, hydroxychloroquine, lopinavir, or interferon β-1a, were used in addition to the standard of care, but these did not result in significantly different mortality from standard of care.16 Steroids are becoming foundational to the treatment of severe COVID-19 pneumonia, but evidence from high-quality randomized controlled clinical trials is lacking.17
During the first surge from March to May 2020, Massachusetts had the third highest number of COVID-19 cases among states in the United States.18 In early 2021, COVID-19 cases were climbing close to the peak of the second surge in Massachusetts. In this study, we compared utilization of low-flow supplemental oxygen, HFNC, and mechanical ventilation and clinical outcomes of patients admitted to 3 hospitals in Massachusetts during the second surge of the pandemic to that of patients admitted during the first surge.
Methods
Setting
Beth Israel Lahey Health is a system of academic and teaching hospitals with primary care and specialty care providers. We included 3 centers within the Beth Israel Lahey Health system in Massachusetts: Lahey Hospital and Medical Center, with 335 inpatient hospital beds and 52 critical care beds; Beverly Hospital, with 227 beds and 14 critical care beds; and Winchester Hospital, with 229 beds and 10 ICU beds.
Participants
We included patients admitted to the 3 hospitals with COVID-19 as a primary or secondary diagnosis during the first surge of the pandemic (March 1, 2020 to June 15, 2020) and the second surge (November 15, 2020 to January 27, 2021). The timeframe of the first surge was defined as the window between the start date and the end date of data collection. During the time window of the first surge, 1586 patients were included. The start time of the second surge was defined as the date when the data collection was restarted; the end date was set when the number of patients (1597) accumulated was close to the number of patients in the first surge (1586), so that the two groups had similar sample size.
Study Design
A data registry of COVID-19 patients was created by our institution, and the data were prospectively collected starting in March 2020. We retrospectively extracted data on the following from the registry database for this observational study: demographics and baseline comorbidities; the use of low-flow supplemental oxygen, HFNC, and invasive mechanical ventilator; and ICU admission, length of hospital stay, length of ICU stay, and hospital discharge disposition. Start and end times for each oxygen therapy were not entered in the registry. Data about other oxygen therapies, such as noninvasive positive-pressure ventilation, were not collected in the registry database, and therefore were not included in the analysis.
Statistical Analysis
Continuous variables (eg, age) were tested for data distribution normality using the Shapiro-Wilk test. Normally distributed data were tested using unpaired t-tests and displayed as mean (SD). The skewed data were tested using the Wilcoxon rank sum test and displayed as median (interquartile range [IQR]). The categorical variables were compared using chi-square test. Comparisons with P ≤ .05 were considered significantly different. Statistical analysis for this study was generated using Statistical Analysis Software (SAS), version 9.4 for Windows (SAS Institute Inc.).
Results
Baseline Characteristics
We included 3183 patients: 1586 admitted during the first surge and 1597 admitted during the second surge. Baseline characteristics of patients with COVID-19 admitted during the first and second surges are shown in Table 1. Patients admitted during the second surge were older (73 years vs 71 years, P = .01) and had higher rates of hypertension (64.8% vs 59.6%, P = .003) and asthma (12.9% vs 10.7%, P = .049) but a lower rate of interstitial lung disease (3.3% vs 7.7%, P < .001). Sequential organ failure assessment scores at admission and the rates of other comorbidities were not significantly different between the 2 surges.
Oxygen Therapies
The number of patients who were hospitalized and received low-flow supplemental oxygen, and/or HFNC, and/or ventilator in the first surge and the second surge is shown in the Figure. Of all patients included, 2067 (64.9%) received low-flow supplemental oxygen; of these, 374 (18.1%) subsequently received HFNC, and 85 (22.7%) of these subsequently received mechanical ventilation. Of all 3183 patients, 417 (13.1%) received HFNC; 43 of these patients received HFNC without receiving low-flow supplemental oxygen, and 98 (23.5%) subsequently received mechanical ventilation. Out of all 3183 patients, 244 (7.7%) received mechanical ventilation; 98 (40.2%) of these received HFNC while the remaining 146 (59.8%) did not. At the beginning of the first surge, the ratio of patients who received invasive mechanical ventilation to patients who received HFNC was close to 1:1 (10/10); the ratio decreased to 6:10 in May and June 2020. At the beginning of the second surge, the ratio was 8:10 and then decreased to 3:10 in December 2020 and January 2021.
As shown in Table 2, the proportion of patients who received low-flow supplemental oxygen during the second surge was similar to that during the first surge (65.8% vs 64.1%, P = .3). Patients admitted during the second surge were more likely to receive HFNC than patients admitted during the first surge (15.4% vs 10.8%, P = .0001). Patients admitted during the second surge were less likely to be ventilated than the patients admitted during the first surge (5.6% vs 9.7%, P < .0001).
Clinical Outcomes
As shown in Table 3, second surge outcomes were much better than first surge outcomes: the ICU admission rate was lower (8.1% vs 12.7%, P < .0001); patients were more likely to be discharged to home (60.2% vs 47.4%, P < .0001), had a shorter length of hospital stay (5 vs 6 days, P < .0001), and had fewer ventilator days (10 vs 16, P = .01); and mortality was lower (8.3% vs 19.2%, P < .0001). There was a trend that length of ICU stay was shorter during the second surge than during the first surge (7 days vs 9 days, P = .09).
As noted (Figure), the ratio of patients who received invasive mechanical ventilation to patients who received HFNC was decreasing during both the first surge and the second surge. To further analyze the relation between ventilator and HFNC, we performed a subgroup analysis for 244 ventilated patients during both surges to compare outcomes between patients who received HFNC and those who did not receive HFNC (Table 4). Ninety-eight (40%) patients received HFNC. Ventilated patients who received HFNC had lower mortality than those patients who did not receive HFNC (31.6% vs 48%, P = .01), but had a longer length of hospital stay (29 days vs 14 days, P < .0001), longer length of ICU stay (17 days vs 9 days, P < .0001), and a higher number of ventilator days (16 vs 11, P = .001).
Discussion
Our study compared the baseline patient characteristics; utilization of low-flow supplemental oxygen therapy, HFNC, and mechanical ventilation; and clinical outcomes between the first surge (n = 1586) and the second surge (n = 1597) of the COVID-19 pandemic. During both surges, about two-thirds of admitted patients received low-flow supplemental oxygen. A higher proportion of the admitted patients received HFNC during the second surge than during the first surge, while the intubation rate was lower during the second surge than during the first surge.
Reported low-flow supplemental oxygen use ranged from 28% to 63% depending on the cohort characteristics and location during the first surge.6,7,19 A report from New York during the first surge (March 1 to April 4, 2020) showed that among 5700 hospitalized patients with COVID-19, 27.8% received low-flow supplemental oxygen.7 HFNC is recommended in guidelines on management of patients with acute respiratory failure due to COVID-19.20 In our study, HFNC was utilized in a higher proportion of patients admitted for COVID-19 during the second surge (15.5% vs 10.8%, P = .0001). During the early pandemic period in Wuhan, China, 11% to 21% of admitted COVID-19 patients received HFNC.21,22 Utilization of HFNC in New York during the first surge (March to May 2020) varied from 5% to 14.3% of patients admitted with COVID-19.23,24 Our subgroup analysis of the ventilated patients showed that patients who received HFNC had lower mortality than those who did not (31.6% vs 48.0%, P = .011). Comparably, a report from Paris, France, showed that among patients admitted to ICUs for acute hypoxemic respiratory failure, those who received HFNC had lower mortality at day 60 than those who did not (21% vs 31%, P = .052).25 Our recent analysis showed that patients treated with HFNC prior to mechanical ventilation had lower mortality than those treated with only conventional oxygen (30% vs 52%, P = .05).26 In this subgroup analysis, we could not determine if HFNC treatment was administered before or after ventilation because HFNC was entered as dichotomous data (“Yes” or “No”) in the registry database. We merely showed the beneficial effect of HFNC on reducing mortality for ventilated COVID-19 patients, but did not mean to focus on how and when to apply HFNC.
We observed that the patients admitted during the second surge were less likely to be ventilated than the patients admitted during the first surge (5.6% vs 9.7%, P < .0001). During the first surge in New York, among 5700 patients admitted with COVID-19, 12.2% received invasive mechanical ventilation.7 In another report, also from New York during the first surge, 26.1% of 2015 hospitalized COVID-19 patients received mechanical ventilation.27 In our study, the ventilation rate of 9.7% during the first surge was lower.
Outcomes during the second surge were better than during the first surge, including ICU admission rate, hospital and ICU length of stay, ventilator days, and mortality. The mortality was 19.2% during the first surge vs 8.3% during the second surge (P < .0001). The mortality of 19.2% was lower than the 30.6% mortality reported for 2015 hospitalized COVID-19 patients in New York during the first surge.27 A retrospective study showed that early administration of remdesivir was associated with reduced ICU admission, ventilation use, and mortality.28 The RECOVERY clinical trial showed that dexamethasone improved mortality for COVID-19 patients who received respiratory support, but not for patients who did not receive any respiratory support.29 Perhaps some, if not all, of the improvement in ICU admission and mortality during the second surge was attributed to the new medications, such as antivirals and steroids.
The length of hospital stay for patients with moderate to severe COVID-19 varied from 4 to 53 days at different locations of the world, as shown in a meta-analysis by Rees and colleagues.30 Our results showing a length of stay of 6 days during the first surge and 5 days during the second surge fell into the shorter end of this range. In a retrospective analysis of 1643 adults with severe COVID-19 admitted to hospitals in New York City between March 9, 2020 and April 23, 2020, median hospital length of stay was 7 (IQR, 3-14) days.31 For the ventilated patients in our study, the length of stay of 14 days (did not receive HFNC) and 29 days (received HFNC) was much longer. This longer length of stay might be attributed to the patients in our study being older and having more severe comorbidities.
The main purpose of this study was to compare the oxygen therapies and outcomes between 2 surges. It is difficult to associate the clinical outcomes with the oxygen therapies because new therapies and medications were available after the first surge. It was not possible to adjust the outcomes with confounders (other therapies and medications) because the registry data did not include the new therapies and medications.
A strength of this study was that we included a large, balanced number of patients in the first surge and the second surge. We did not plan the sample size in both groups as we could not predict the number of admissions. We set the end date of data collection for analysis as the time when the number of patients admitted during the second surge was similar to the number of patients admitted during the first surge. A limitation was that the registry database was created by the institution and was not designed solely for this study. The data for oxygen therapies were limited to low-flow supplemental oxygen, HFNC, and invasive mechanical ventilation; data for noninvasive ventilation were not included.
Conclusion
At our centers, during the second surge of COVID-19 pandemic, patients hospitalized with COVID-19 infection were more likely to receive HFNC but less likely to be ventilated. Compared to the first surge, the hospitalized patients with COVID-19 infection had a lower ICU admission rate, shorter length of hospital stay, fewer ventilator days, and lower mortality. For ventilated patients, those who received HFNC had lower mortality than those who did not.
Corresponding author: Timothy N. Liesching, MD, 41 Mall Road, Burlington, MA 01805; Timothy.N.Liesching@lahey.org
Disclosures: None reported.
doi:10.12788/jcom.0086
1. Xie J, Covassin N, Fan Z, et al. Association between hypoxemia and mortality in patients with COVID-19. Mayo Clin Proc. 2020;95(6):1138-1147. doi:10.1016/j.mayocp.2020.04.006
2. Asleh R, Asher E, Yagel O, et al. Predictors of hypoxemia and related adverse outcomes in patients hospitalized with COVID-19: a double-center retrospective study. J Clin Med. 2021;10(16):3581. doi:10.3390/jcm10163581
3. Choi KJ, Hong HL, Kim EJ. Association between oxygen saturation/fraction of inhaled oxygen and mortality in patients with COVID-19 associated pneumonia requiring oxygen therapy. Tuberc Respir Dis (Seoul). 2021;84(2):125-133. doi:10.4046/trd.2020.0126
4. Dixit SB. Role of noninvasive oxygen therapy strategies in COVID-19 patients: Where are we going? Indian J Crit Care Med. 2020;24(10):897-898. doi:10.5005/jp-journals-10071-23625
5. Gonzalez-Castro A, Fajardo Campoverde A, Medina A, et al. Non-invasive mechanical ventilation and high-flow oxygen therapy in the COVID-19 pandemic: the value of a draw. Med Intensiva (Engl Ed). 2021;45(5):320-321. doi:10.1016/j.medine.2021.04.001
6. Pan W, Li J, Ou Y, et al. Clinical outcome of standardized oxygen therapy nursing strategy in COVID-19. Ann Palliat Med. 2020;9(4):2171-2177. doi:10.21037/apm-20-1272
7. Richardson S, Hirsch JS, Narasimhan M, et al. Presenting characteristics, comorbidities, and outcomes among 5700 patients hospitalized with COVID-19 in the New York City area. JAMA. 2020;323(20):2052-2059. doi:10.1001/jama.2020.6775
8. He G, Han Y, Fang Q, et al. Clinical experience of high-flow nasal cannula oxygen therapy in severe COVID-19 patients. Article in Chinese. Zhejiang Da Xue Xue Bao Yi Xue Ban. 2020;49(2):232-239. doi:10.3785/j.issn.1008-9292.2020.03.13
9. Lalla U, Allwood BW, Louw EH, et al. The utility of high-flow nasal cannula oxygen therapy in the management of respiratory failure secondary to COVID-19 pneumonia. S Afr Med J. 2020;110(6):12941.
10. Zhang TT, Dai B, Wang W. Should the high-flow nasal oxygen therapy be used or avoided in COVID-19? J Transl Int Med. 2020;8(2):57-58. doi:10.2478/jtim-2020-0018
11. Agarwal A, Basmaji J, Muttalib F, et al. High-flow nasal cannula for acute hypoxemic respiratory failure in patients with COVID-19: systematic reviews of effectiveness and its risks of aerosolization, dispersion, and infection transmission. Can J Anaesth. 2020;67(9):1217-1248. doi:10.1007/s12630-020-01740-2
12. Geng S, Mei Q, Zhu C, et al. High flow nasal cannula is a good treatment option for COVID-19. Heart Lung. 2020;49(5):444-445. doi:10.1016/j.hrtlng.2020.03.018
13. Feinstein MM, Niforatos JD, Hyun I, et al. Considerations for ventilator triage during the COVID-19 pandemic. Lancet Respir Med. 2020;8(6):e53. doi:10.1016/S2213-2600(20)30192-2
14. Wu Z, McGoogan JM. Characteristics of and important lessons from the coronavirus disease 2019 (COVID-19) outbreak in China: summary of a report of 72314 cases from the Chinese Center for Disease Control and Prevention. JAMA. 2020;323(13):1239-1242. doi:10.1001/jama.2020.2648
15. Rojas-Marte G, Hashmi AT, Khalid M, et al. Outcomes in patients with COVID-19 disease and high oxygen requirements. J Clin Med Res. 2021;13(1):26-37. doi:10.14740/jocmr4405
16. Zhang R, Mylonakis E. In inpatients with COVID-19, none of remdesivir, hydroxychloroquine, lopinavir, or interferon β-1a differed from standard care for in-hospital mortality. Ann Intern Med. 2021;174(2):JC17. doi:10.7326/ACPJ202102160-017
17. Rello J, Waterer GW, Bourdiol A, Roquilly A. COVID-19, steroids and other immunomodulators: The jigsaw is not complete. Anaesth Crit Care Pain Med. 2020;39(6):699-701. doi:10.1016/j.accpm.2020.10.011
18. Dargin J, Stempek S, Lei Y, Gray Jr. A, Liesching T. The effect of a tiered provider staffing model on patient outcomes during the coronavirus disease 2019 pandemic: A single-center observational study. Int J Crit Illn Inj Sci. 2021;11(3). doi:10.4103/ijciis.ijciis_37_21
19. Ni YN, Wang T, Liang BM, Liang ZA. The independent factors associated with oxygen therapy in COVID-19 patients under 65 years old. PLoS One. 2021;16(1):e0245690. doi:10.1371/journal.pone.0245690
20. Alhazzani W, Moller MH, Arabi YM, et al. Surviving Sepsis Campaign: guidelines on the management of critically ill adults with coronavirus disease 2019 (COVID-19). Crit Care Med. 2020;48(6):e440-e469. doi:10.1097/CCM.0000000000004363
21. Wang D, Hu B, Hu C, et al. Clinical characteristics of 138 hospitalized patients with 2019 novel coronavirus-infected pneumonia in Wuhan, China. JAMA. 2020;323(11):1061-1069. doi:10.1001/jama.2020.1585
22. Zhou F, Yu T, Du R, et al. Clinical course and risk factors for mortality of adult inpatients with COVID-19 in Wuhan, China: a retrospective cohort study. Lancet. 2020;395(10229):1054-1062. doi:10.1016/S0140-6736(20)30566-3
23. Argenziano MG, Bruce SL, Slater CL, et al. Characterization and clinical course of 1000 patients with coronavirus disease 2019 in New York: retrospective case series. BMJ. 2020;369:m1996. doi:10.1136/bmj.m1996
24. Cummings MJ, Baldwin MR, Abrams D, et al. Epidemiology, clinical course, and outcomes of critically ill adults with COVID-19 in New York City: a prospective cohort study. Lancet. 2020;395(10239):1763-1770. doi:10.1016/S0140-6736(20)31189-2
25. Demoule A, Vieillard Baron A, Darmon M, et al. High-flow nasal cannula in critically ill patients with severe COVID-19. Am J Respir Crit Care Med. 2020;202(7):1039-1042. doi:10.1164/rccm.202005-2007LE
26. Hansen CK, Stempek S, Liesching T, Lei Y, Dargin J. Characteristics and outcomes of patients receiving high flow nasal cannula therapy prior to mechanical ventilation in COVID-19 respiratory failure: a prospective observational study. Int J Crit Illn Inj Sci. 2021;11(2):56-60. doi:10.4103/IJCIIS.IJCIIS_181_20
27. van Gerwen M, Alsen M, Little C, et al. Risk factors and outcomes of COVID-19 in New York City; a retrospective cohort study. J Med Virol. 2021;93(2):907-915. doi:10.1002/jmv.26337
28. Hussain Alsayed HA, Saheb Sharif-Askari F, Saheb Sharif-Askari N, Hussain AAS, Hamid Q, Halwani R. Early administration of remdesivir to COVID-19 patients associates with higher recovery rate and lower need for ICU admission: A retrospective cohort study. PLoS One. 2021;16(10):e0258643. doi:10.1371/journal.pone.0258643
29. RECOVERY Collaborative Group, Horby P, Lim WS, et al. Dexamethasone in hospitalized patients with Covid-19. N Engl J Med. 2021;384(8):693-704. doi:10.1056/NEJMoa2021436
30. Rees EM, Nightingale ES, Jafari Y, et al. COVID-19 length of hospital stay: a systematic review and data synthesis. BMC Med. 2020;18(1):270. doi:10.1186/s12916-020-01726-3
31. Anderson M, Bach P, Baldwin MR. Hospital length of stay for severe COVID-19: implications for Remdesivir’s value. medRxiv. 2020;2020.08.10.20171637. doi:10.1101/2020.08.10.20171637