User login
Blood Test Accurately Detects GLUT1 Deficiency Syndrome
A blood test can detect glucose transporter type 1 (GLUT1) deficiency syndrome accurately and rapidly, according to a brief communication published in the July issue of Annals of Neurology. The new test has a diagnostic rate comparable to that of CSF glucose and may be more cost-effective than the combination of lumbar puncture and genetic testing, according to the researchers.
To confirm the diagnosis in a patient whose phenotype suggests GLUT1 deficiency syndrome, neurologists traditionally measure CSF glucose concentration and perform SLC2A1 molecular analysis. Lumbar puncture requires fasting and may entail complications, however, and analysis of the coding regions of SLC2A1 can be tedious and may fail to identify variants.
Analysis of Red Blood Cells
Domitille Gras, MD, a neurologist at Robert-Debré University Hospital in Paris, and colleagues tested a novel diagnostic method based on flow cytometry analysis of red blood cells. For their proof-of-concept study, the researchers enrolled 30 patients (13 females) between ages 2 and 50 with GLUT1 deficiency syndrome. They also enrolled 18 patients (six females) with paroxysmal movement disorders attributed to genetic defects other than in SLC2A1. Finally, the investigators examined 346 healthy controls.
For all participants, Dr. Gras and colleagues measured CSF glucose concentration, performed SLC2A1 molecular analysis, and used flow cytometry to analyze GLUT1 surface expression on circulating red blood cells. To perform the latter method, researchers who were blinded to patients’ disease condition collected at least 0.5 mL of nonfasted venous blood from each participant. Results were available within 24 hours.
Age Did Not Affect Test Results
GLUT1 expression on red blood cells varied by 15% among healthy controls. The blood test identified 23 (78%) of the patients with GLUT1 deficiency syndrome who had a decrease in GLUT1 expression of at least 20%. Dr. Gras and colleagues saw no overlap between the test results of patients and those of controls. The new test detected three patients with GLUT1 deficiency syndrome who had a CSF glucose concentration greater than 2.2 mM, which is the most commonly used cutoff. Two patients with a presentation suggestive of GLUT1 deficiency syndrome and low CSF glucose and lactate, but no SLC2A1 mutation, had an abnormal blood test.
The blood test detected GLUT1 deficiency syndrome regardless of the patient’s age and disease severity. Patients not detected by the test may have mutations that mildly affect glucose uptake, but not GLUT1 expression, or may have a GLUT1 deficiency restricted to the brain. Most patients were analyzed at least twice, and blood test results were consistent for each patient.
Measuring GLUT1 at the surface of red blood cells could avoid diagnostic delays that currently are considerable, said Dr. Gras and colleagues. “Although more studies are required to establish the diagnostic gain of the red blood cell test on a larger cohort, such a simple diagnostic test, readily available in clinical practice, ought to greatly enlarge the screening of GLUT1 deficiency syndrome in any patient, child, or adult presenting with cognitive impairment, epilepsy, ataxia and/or dystonia, or paroxysmal movement disorder,” they concluded.
—Erik Greb
Suggested Reading
Gras D, Cousin C, Kappeler C, et al. A simple blood test expedites the diagnosis of glucose transporter type 1 deficiency syndrome. Ann Neurol. 2017;82(1):133-138.
FDA advisory committee rejects opioids in children’s cough syrup
ROCKVILLE, MD – The majority of
The voting was broken into multiple votes based on age range of patients and the specific opioid present in the cough syrup. Unlike other advisory committee meetings, this meeting did not focus on a the treatment of a disease state, but rather on the treatment of a symptom.
On Sept. 11, 2017, the FDA’s Pediatric Advisory Committee voted 21 no, 2 yes, with one abstention, that the benefit versus the risk of opioid cough suppressants for pediatric patients was not favorable.
This vote was preceded by two previous votes specifically questioning the use of codeine and hydrocodone in medications for pediatric patients. For codeine, the committee voted unanimously with 24 against that the benefit versus risk was not favorable in pediatric patients aged 12 years to less than 18 years. 
For hydrocodone, the committee asked two questions: 1) Was the benefit versus risk favorable for pediatric patients aged 6 years to less than 12 years? and 2) Was the benefit versus risk favorable for pediatric patients aged 12 years to less than 18 years? On the vote for patients aged 6 years to less than 12 years, the committee voted 23 no, 1 yes with no abstention. For the patients aged 12 years to less than 18, the committee voted 23 no, 1 yes, with no abstention.
According to Sharon Levy, MD, MPH, adolescents are the most at-risk population for opioid misuse. This susceptibility is due to the developmental neurobiology of adolescent brains. A region of the brain associated with the reward pathway, nucleus accumbens, is developing in adolescents and plays a role in salience. Salience, or the differentiation between important vs. unimportant rewards, varies widely by age group. Young children show little salience with rewards, and treat rewards equivocally. Adults have a proportional response to rewards with accurate salience. Adolescents, on the other hand, are unhappy with small rewards, but receive a massive return with large rewards. This type of neurobiological feedback makes adolescents “vulnerable to develop substance use disorders.”
Dr. Levy also noted a correlation between prescribed opioid use and alcohol, marijuana, and tobacco use as contributing factors to opioid misuse. When opioids are prescribed for pain management, there is an adjusted odds ratio (AOR) of 1.33, indicating a high likelihood of misuse. Similar AORs are seen in adolescents who have used marijuana, cigarettes, and alcohol: 2.44, 1.25, and 1.23, respectively.
Sovereign pharmaceuticals representative Leonard Lawrence presented the findings of a pharmacokinetic study for hydrocodone and guaifenesin in 25-35 pediatric patients evenly divided into groups aged 6 years to less than 12 years, and 12 years to less than 18 years. According to Mr. Lawrence, codeine appears “to be a greater risk in children younger than 12 years, and should not be used” because of difficulty breathing. Mr Lawrence went on to say that these effects were exacerbated in obese children with lung disease or obstructive sleep apnea.
Victor S. Sloan, MD, of UCB in Brussels, presented an internal review of Tussionex, a combination cough medicine (hydrocodone/chlorpheniramine). This review took into account modern pharmacovigilance methods, changes in clinical practice, and a literature review. “Upon annual review, UCB determined that benefit risk balance for use of Tussionex for cough in children was no longer favorable,” said Dr. Sloan. Based on the results of the review, UCB has filed a label supplement to limit use of Tussionex to patients aged 18 years or older.
“Codeine, in particular, is an antiquated drug,” said Kathleen Neville, MD, pediatrics and clinical pharmacology section chief of Arkansas Children’s Hospital, Little Rock. Many of the committee members echoed Dr. Neville’s opinion.
The committee members had no relevant financial disclosures.
ilacy@frontlinemedcom.com
On Twitter @ilacy_19
ROCKVILLE, MD – The majority of
The voting was broken into multiple votes based on age range of patients and the specific opioid present in the cough syrup. Unlike other advisory committee meetings, this meeting did not focus on a the treatment of a disease state, but rather on the treatment of a symptom.
On Sept. 11, 2017, the FDA’s Pediatric Advisory Committee voted 21 no, 2 yes, with one abstention, that the benefit versus the risk of opioid cough suppressants for pediatric patients was not favorable.
This vote was preceded by two previous votes specifically questioning the use of codeine and hydrocodone in medications for pediatric patients. For codeine, the committee voted unanimously with 24 against that the benefit versus risk was not favorable in pediatric patients aged 12 years to less than 18 years.
For hydrocodone, the committee asked two questions: 1) Was the benefit versus risk favorable for pediatric patients aged 6 years to less than 12 years? and 2) Was the benefit versus risk favorable for pediatric patients aged 12 years to less than 18 years? On the vote for patients aged 6 years to less than 12 years, the committee voted 23 no, 1 yes with no abstention. For the patients aged 12 years to less than 18, the committee voted 23 no, 1 yes, with no abstention.
According to Sharon Levy, MD, MPH, adolescents are the most at-risk population for opioid misuse. This susceptibility is due to the developmental neurobiology of adolescent brains. A region of the brain associated with the reward pathway, nucleus accumbens, is developing in adolescents and plays a role in salience. Salience, or the differentiation between important vs. unimportant rewards, varies widely by age group. Young children show little salience with rewards, and treat rewards equivocally. Adults have a proportional response to rewards with accurate salience. Adolescents, on the other hand, are unhappy with small rewards, but receive a massive return with large rewards. This type of neurobiological feedback makes adolescents “vulnerable to develop substance use disorders.”
Dr. Levy also noted a correlation between prescribed opioid use and alcohol, marijuana, and tobacco use as contributing factors to opioid misuse. When opioids are prescribed for pain management, there is an adjusted odds ratio (AOR) of 1.33, indicating a high likelihood of misuse. Similar AORs are seen in adolescents who have used marijuana, cigarettes, and alcohol: 2.44, 1.25, and 1.23, respectively.
Sovereign pharmaceuticals representative Leonard Lawrence presented the findings of a pharmacokinetic study for hydrocodone and guaifenesin in 25-35 pediatric patients evenly divided into groups aged 6 years to less than 12 years, and 12 years to less than 18 years. According to Mr. Lawrence, codeine appears “to be a greater risk in children younger than 12 years, and should not be used” because of difficulty breathing. Mr Lawrence went on to say that these effects were exacerbated in obese children with lung disease or obstructive sleep apnea.
Victor S. Sloan, MD, of UCB in Brussels, presented an internal review of Tussionex, a combination cough medicine (hydrocodone/chlorpheniramine). This review took into account modern pharmacovigilance methods, changes in clinical practice, and a literature review. “Upon annual review, UCB determined that benefit risk balance for use of Tussionex for cough in children was no longer favorable,” said Dr. Sloan. Based on the results of the review, UCB has filed a label supplement to limit use of Tussionex to patients aged 18 years or older.
“Codeine, in particular, is an antiquated drug,” said Kathleen Neville, MD, pediatrics and clinical pharmacology section chief of Arkansas Children’s Hospital, Little Rock. Many of the committee members echoed Dr. Neville’s opinion.
The committee members had no relevant financial disclosures.
ilacy@frontlinemedcom.com
On Twitter @ilacy_19
AT AN FDA PEDIATRIC ADVISORY COMMITTEE MEETING
Ten-year outcomes support skipping axillary lymph node dissection with positive sentinel nodes
A follow-up to a study showing the noninferiority of sentinel lymph node dissection to axillary lymph node dissection for breast cancer in overall and disease-free survival at a median of 6.3 years found similar noninferiority in overall survival at 10 years.
Axillary lymph node dissection has a risk of complications including lymphedema, numbness, axillary web syndrome, and decreased upper-extremity range of motion. The American College of Surgeons Oncology Group Z0011 trial sought to determine if the procedure could be avoided without inferior survival outcomes.
Criticism of the study focused on the potential for later recurrence, particularly in patients with hormone receptor–positive breast cancer. All enrolled patients had one or two sentinel nodes with metastases. At randomization, 436 received sentinel lymph node dissection alone, and 420 received the additional axillary lymph node dissection. The patients were assessed every 6 months for the first 3 years, then annually.
After a median of 9.3 years, 110 of the patients had died of any cause – 51 in the sentinel lymph node dissection group and 59 in the axillary lymph node dissection group – a 10-year overall survival rate of 86.3% and 83.6%, respectively. This met the study’s primary endpoint of showing noninferior overall survival without the riskier procedure. In the study’s secondary endpoint, disease-free survival, there was not a significant difference either (80.2% vs. 78.2%).
“Axillary dissections are associated with considerable morbidity, and the results of this trial demonstrated that this morbidity can be avoided without decreasing cancer control. … These findings do not support routine use of axillary lymph node dissection in this patient population based on 10-year outcomes,” wrote Armando E. Guiliano, MD, of Cedars-Sinai Medical, Los Angeles and his coauthors (JAMA. 2017;318[10]:918-26. doi: 10.1001/jama.2017.11470).
FROM JAMA
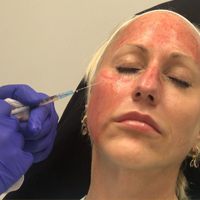
Microneedling With Stem Cells

Incidental hip CT scans could serve as osteoporosis screen
DENVER – Computed tomography (CT) scans that were taken for an unrelated purpose could potentially be used to screen for osteoporosis, according to a new study. Researchers analyzed data from CT scans that produced estimates of bone mineral density (BMD) and femoral strength, and these performed similarly to dual-energy X-ray absorptiometry (DXA) in predicting fracture risk.
“The neat thing is that there’s no additional burden to the patients, because they’ve already had the CT scan. There’s no additional radiation exposure, no additional trip to the office. Another advantage to this is there are so many more men who are getting CT scans than there are who are getting DXAs for osteoporosis, so it’s an opportunity to screen more men,” Annette Adams, PhD, research scientist at Kaiser Permanente of Southern California, said in an interview at the annual meeting of the American Society for Bone and Mineral Research.
To test the potential of the CT scans, the researchers conducted a case-control cohort analysis of patients aged 65 and over who were seen at 11 Kaiser Permanente Southern California (KPSC) hospitals. The patients had undergone abdominal or pelvic CT between 2006 and 2014. They had not experienced a fragility hip fracture before the CT scan was taken, but they had to have undergone a DXA within 3 years of the scan.
A total of 1,340 women and 619 men had a first hip fracture during the study period. They were compared to randomly selected subjects without hip fractures.
The researchers found associations between hip fractures and CT-based scores, and the relationships were stronger than those seen with DXA. In women, for each decrease in one standard deviation (SD) in hip BMD T-score, the hazard ratio (HR) for hip fracture was 2.18 (95% confidence interval [CI], 1.87-2.54). In men, the HR was 3.12 (2.35-4.14). The HRs for hip fracture based on DXA hip BMD T-score values were 1.80 (95% CI, 1.53-2.13) for women and 2.74 (95% CI, 2.15-3.49) for men.
CT-derived femoral strength values also performed well. In women, each one SD decrease in femoral strength seen in the CT-based scores was associated with an HR of 2.76 (95% CI, 2.25-3.39). In men, the value was HR 2.84 (95% CI, 2.20-3.66).
In a subanalysis of subjects who had not received osteoporosis treatment, for each one SD decrease in hip BMD T-score, the HR for hip fracture was 2.72 (95% CI, 2.24-3.32) in women and 3.93 (95% CI, 2.46-6.26) in men.
In untreated patients, each increase of one SD in femoral strength was tied to an HR in women of 3.81 (95% CI, 2.90-5.01) and 3.37 (95% CI, 2.27-5.01) in men.
The addition of established thresholds for osteoporosis (BMD T-score –2.5 or less) as well as fragile bone strength (3,000 Newtons or less in women, 3,500 Newtons or less in men) increased the 5-year sensitivity for hip fracture from 0.55 to 0.67 in women, and from 0.43 to 0.54 in men.
The technique is not yet ready for large-scale implementation because the process isn’t yet completely automated – it requires human review to eliminate some glitches, and that is likely to make it cost ineffective for now, Sally Warner, PhD, said in an interview. Dr. Warner is senior director of musculoskeletal imaging at Parexel, and was not involved in the study.
But she was nevertheless enthusiastic. “CT is such a great modality to be able to look at bone and interpret the density, the volume, the quality of the bone. It’s got great potential utility,” she said.
She said she thinks it will become cost-effective in time. “As long as the acquisition is standardized, I’m sure the automation could come a little bit more readily,” Dr. Warner said.
Amgen and Merck funded the study. Dr. Adams has received research funding from both companies. Dr. Warner reported having no financial disclosures.
AT ASBMR
Key clinical point: Use of existing abdominal or pelvic CT scans may serve as a way to screen for osteoporosis without the need for dual-energy x-ray absorptiometry.
Major finding: For each decrease in one standard deviation in CT-derived hip BMD T-score, the hazard ratio for hip fracture was 2.18 in women and 3.12 in men.
Data source: A case-control study of 1,340 women and 619 men at 11 California centers.
Disclosures: Amgen and Merck funded the study. Dr. Adams has received research funding from both companies. Dr. Warner reported having no financial disclosures.
More studies show Medicaid expansion has benefited hospitals
In 2016, a series of studies showed the impact of Medicaid expansion on hospitals.1 The news was good: Hospitals in states that accepted Medicaid expansion through the Affordable Care Act saw dramatic reductions in their uninsured patient populations, increases in their Medicaid stays, and reductions in uncompensated care costs.1,2
In 2017, additional data continue to show that Medicaid expansion has been a boon to hospitals, including an April 2017 report published by the Urban Institute and a May 2017 analysis from The Commonwealth Fund.3,4 Both show that some of the hospitals that need it most are reaping the greatest benefits of expansion.
At the same time, Craig Garthwaite, PhD, MPP, lead author of The Commonwealth Fund report, said Medicaid expansion “wiped out roughly half of the uncompensated care faced by hospitals, with relatively little or no decline in nonexpansion states.” To date, 19 states have not expanded Medicaid.
With Medicaid facing an uncertain future, Dr. Blavin said some experts are concerned about what could happen to vulnerable hospitals if Medicaid expansion is repealed or scaled back. Indeed, President Trump and Congressional Republicans have proposed significantly altering Medicaid by either transitioning it to block grants or by capping federal funding for the entitlement.6,7
“We wanted to give people a sense of the stakes of what you’re talking about with repeal of the Affordable Care Act and go back to a system where patients are able to get emergency care at the hospital but not the complete care they get if they’re insured. We’re not going to be paying hospitals for that care, so the hospital has that coming out of their profit margin,” said Dr. Garthwaite, professor of strategy and codirector of the Health Enterprise Management Program in the Kellogg School of Management at Northwestern University, Evanston, Ill.
The Commonwealth Fund report used data from the Centers for Medicare & Medicaid Services (CMS) Hospital Cost Reports to examine 1,154 hospitals in expansion and nonexpansion states. It built on a Health Affairs study Dr. Garthwaite and his coauthors published in 2016.2 The analysis found that between 2013 and 2014, uncompensated care costs declined dramatically in expansion states and continued into 2015, falling from 3.9% to 2.3% of operating costs. Meanwhile, hospitals in nonexpansion states saw uncompensated care costs drop just 0.3-0.4 percentage points. The largest reductions were seen by hospitals providing the highest proportion of care to low-income and uninsured patients and overall savings to hospitals in expansion states amounted to $6.2 billion.
“Any contraction of the Medicaid expansion will reduce overall health insurance coverage and could have important financial implications for hospitals,” Dr. Blavin said. “We are likely to see large increases in expenses attributable to uninsured patients, declines in Medicaid revenue, and increases in uncompensated care burdens that can be a significant financial strain to hospitals.”
As part of a project supported by the Robert Wood Johnson Foundation, the Urban Institute in May 2011 began to track and study the impact of health reform. The report Dr. Blavin authored is part of this endeavor and utilized data from the American Hospital Association Annual Survey and the CMS Health Care Cost Reports to update the 2016 JAMA study. It compared hospitals in expansion states to those in nonexpansion states between fiscal years 2011 and 2015, excluding hospitals in states that expanded before January 2014. It examined hospital-reported data on uncompensated care, uncompensated care as a percentage of total hospital expenses, Medicaid revenue, Medicaid as a percentage of total revenue, operating margins, and excess margins.
The analysis found that Medicaid expansion resulted in a $3.2 million reduction in uncompensated care and a $5.0 million increase in mean annual Medicaid revenue per hospital. Expansion-state hospitals also saw improvements in excess and operating margins relative to nonexpansion state hospitals.
In Connecticut, Medicaid reimbursement rates are among the lowest in the country.8 The state uses a provider tax to finance Medicaid but, facing a budget deficit, state leaders have dramatically reduced the amount of money returned to hospitals in recent years.9
“Our Medicaid patient volume has gone up but our margins have declined because the return on investment is so low,” added Dr. Kumar, a practicing hospitalist and member of the SHM Public Policy Committee. He is concerned about what happens if Medicaid is capped or transitioned to a block grant, since “block grants have not been favorable so far … It would further squeeze us.”
In Arizona, Steve Narang, MD, MHCM, a hospitalist and CEO of Banner–University Medical Center Phoenix (B-UMCP), already knows what it’s like when Medicaid funding expands and then contracts. In 2001, the state expanded Medicaid to 100% of the federal poverty level for childless adults but then in 2011, in the throes of recession, the state froze its match on federal dollars. Prior to the freeze, charity care and bad debt made up 9% of B-UMCP’s net revenue. After the state cut to Medicaid, the hospital’s uncompensated care doubled; charity care and bad debt spiked to 20% of net revenue. Once the freeze was lifted and the state expanded Medicaid through the ACA in 2014, bad debt and charity care plummeted to 7% of revenue and remains in the single digits, Dr. Narang said.
“You hear a lot, especially in debates, about Medicaid being bad coverage … From a hospital perspective, if you’re taking care of a patient who is uninsured versus a patient with Medicaid coverage, that hospital is likely better off financially treating the patient with Medicaid coverage,” said Dr. Blavin.
“From a basic commitment to our fellow human beings, are we doing the right thing as a country?” he asked, noting that states and the federal government must address the economic realities of health care while also providing safety nets for patients. “We have to do both. But I have faith that the state and federal government will find a model and we will continue to focus on what we can control.”
References
1. Tyrrell K. Benefits of Medicaid Expansion for Hospitalists. The Hospitalist. 2016 March;2016(3). http://www.the-hospitalist.org/hospitalist/article/121832/benefits-medicaid-expansion-hospitalists. Accessed May 25, 2017.
2. Dranove D., Garthwaite C., Ody C. Uncompensated Care Decreased at Hospitals in Medicaid Expansion States but Not at Hospitals in Nonexpansion States. Health Affairs, Aug. 2016 35(8):1471-9. http://content.healthaffairs.org/content/35/8/1471.abstract. Accessed May 25, 2017.
3. Blavin F. How Has the ACA Changed Finances for Different Types of Hospitals? Updated Insights from 2015 Cost Report Data. Urban Institute. Published April 2017. Accessed May 25, 2017. http://www.urban.org/sites/default/files/publication/89446/2001215-how-has-the-aca-changed-finances-for-different-types-of-hospitals.pdf.
4. Dranove D., Garthwaite C., Ody C. The Impact of the ACA’s Medicaid Expansion on Hospitals’ Uncompensated Care Burden and the Potential Effects of Repeal. Published May 3, 2017. Accessed May 25, 2017. http://www.commonwealthfund.org/publications/issue-briefs/2017/may/aca-medicaid-expansion-hospital-uncompensated-care.
5. Blavin F. Association Between the 2014 Medicaid Expansion and US Hospital Finances. http://jamanetwork.com/journals/jama/fullarticle/2565750. JAMA 2016;316(14):1475-1483. doi:10.1001/jama.2016.14765
6. President Trump’s 2018 Budget Proposal Reduces Federal Funding for Coverage of Children in Medicaid and CHIP. Kaiser Family Foundation. Published March 23, 2017. Accessed May 25, 2017. http://kff.org/medicaid/fact-sheet/presidents-2018-budget-proposal-reduces-federal-funding-for-coverage-of-children-in-medicaid-and-chip/
7. Paradise J. Restructuring Medicaid in the American Health Care Act: Five Key Considerations. Kaiser Family Foundation. Published March 15, 2017. Accessed May 25, 2017. http://kff.org/medicaid/issue-brief/restructuring-medicaid-in-the-american-health-care-act-five-key-considerations/
8. Medicaid Hospital Payment: A comparison across states and to Medicare. MACPAC Issue Brief. Published April 2017.
9. Levin Becker A. Hospitals blast Malloy’s proposal to subject them to property taxes. Published Feb. 8, 2017. Accessed May 25, 2017. https://ctmirror.org/2017/02/08/hospitals-blast-malloys-proposal-to-subject-them-to-property-taxes/
AAP annual meeting sessions you won’t want to miss

- “The preconference program ‘Pediatricians Leading Change in Physician Health and Wellness’ will be something you don’t want to miss. Speakers will address topics such as burnout among physicians and residents, compassion fatigue, and approaches to wellness that target individuals, practices, organizations, and medical education. Physician wellness is essential if we want to provide excellent medical care.” Friday, Sept. 15, 11:30 a.m. – 5:30 p.m. at McCormick Place West, W375 E.
- “Monday’s plenary session, ‘The Heat Is On: Why Climate Change Advocacy Is Essential to Child Health’ by Jonathan Patz, MD, MPH, will be particularly relevant, given recent extreme weather events. Children also are affected by climate change, because infectious diseases patterns are altered and because of changes in plant growth and pollen production. Dr. Patz will discuss how pediatricians and physicians from other specialties need to join together to protect patients from further harm, through education and advocacy.” Monday, Sept. 18, at 12:10 p.m. – 12:30 p.m. at Skyline Ballroom.

- “Tics, CANS, PANS, and Other Movement Disorders” by Joanna Blackburn, MD. “When I was in training, these diagnoses were not really recognized; but from what I have seen in practice, they exist and require support from specialists who are hard to find. Having more knowledge of the disorders would benefit any primary care physician.” Saturday, Sept. 16, at 7:30 a.m. – 8:15 a.m. at McCormick Place West, W183 C, and Sunday, Sept. 17, at 8:30 a.m. – 9:15 a.m. at McCormick Place West, W185D.
- “Are Vaccines Safe?” by Paul Offit, MD. “As physicians, we know that vaccines are safe; but our patients are very skeptical about this and don’t believe us. I hope this lecture will give us statistics and studies to bring back to our patients.” Saturday, Sept. 16, at 4 p.m. – 4:45 p.m. at McCormick Place West, W183 B, and Sunday, Sept. 17, at 2 p.m. – 2:45 p.m. at McCormick Place West, W183 B.
- “The presentation ‘Bright Futures Update: What Has Changed and Why’ by Joseph Hagan Jr., MD, is always a good guide.” Saturday, Sept. 16, at 7:30 a.m. – 8:15 a.m. at McCormick Place West, W179, and Sunday, Sept. 17, at 9:30 a.m. – 10:15 a.m. at McCormick Place West, W187 A.

- “Integrating Mental Health Services in the Primary Care Office” by Jay Rabinowitz, MD. “Pediatricians are increasingly involved in dealing with children and adolescents who have mental health problems. Enhancing their ability to do so in their office can be very beneficial.” Saturday, Sept. 16, at 7:30 a.m. – 8:15 a.m. at McCormick Place West, W178 B, and Saturday, Sept. 16, at 5:00 p.m. – 5:45 p.m. at McCormick Place West, W176 C.
- “2017 AAP Guidelines for Childhood Hypertension: Highlights” by Joseph Flynn, MD, MS. “New guidelines for diagnosis, evaluation, and management of abnormal blood pressures in the ambulatory setting were issued by the AAP in September. Pediatricians need to be updated on this important disease and incorporate these into their practices.” Tuesday, Sept. 19, at 10:30 a.m. – 10:50 a.m. at Skyline Ballroom.
- “Meet the Redbook Committee.” “This session will include discussions of issues germane to infectious diseases in children. It always includes new information on important topics for practice, including immunizations.” Monday, Sept. 18, at 8 a.m. – 10 a.m. at McCormick Place West, W190 A.
- “Vaccine Update, What’s New and What’s Changed” by Mary Anne Jackson, MD. “Recommendations change yearly, so this session is always important.” Sunday, Sept. 17, at 7:30 a.m. – 8:15 a.m. at McCormick Place West, W183 A, and Sunday, Sept. 17, at 4 p.m. – 4:45 p.m. at McCormick Place West, W183 A.
- “The presentation ‘Bright Futures Update: What Has Changed and Why’ by Joseph Hagan Jr., MD, highlights the new recommendations for the new guidelines published this year. There are important changes for all who use Bright Futures for their preventive child health visits (well-child visits).” Saturday, Sept. 16, at 7:30 a.m. – 8:15 a.m. at McCormick Place West, W179, and Sunday, Sept. 17, at 9:30 a.m. – 10:15 a.m. at McCormick Place West, W187 A.

- “Children’s Health – What’s at Stake in the New Administration” by Lynda Young, MD. “Dr. Young has significant experience in the advocacy area, which started for her when she was a young practitioner in Massachusetts and became interested in learning about how to promote the health of her patients through legislative connections and actions. Lynda is now chair of the AAP Committee on Federal Government Affairs, and with the changes in Washington adversely affecting millions of children in our country, it will be crucial for individual pediatricians to advocate in their communities and beyond. This session will share key concepts and tools for child health advocacy.” Saturday, Sept. 16, at 8:30 a.m. – 10 a.m. at McCormick Place West, W181 A.

- “AAP President’s Address.” “The AAP is our voice, our tool to improve the lives of children. I want to know what the AAP thinks is important today, and AAP President Fernando Stein, MD, will provide an update on efforts by the academy to advance the Agenda for Children.” Saturday, Sept. 16, at 10:30 a.m. – 11:15 a.m. at Skyline Ballroom.
- “Antimicrobial Update.” “Infectious diseases is a big part of pediatrics. I need to stay current on the latest antibiotic tools.” Sunday, Sept. 17, at 8:30 a.m. – 10 a.m. at McCormick Place West, W179, and Monday, Sept. 18, at 8:30 a.m. – 10 a.m. at McCormick Place West, W180.
- “Teens Gone Wild: Advising Families on Parenting Adolescents.” “Working with parenting issues with teens is fun but complicated. I look forward to the refresher.” Sunday, Sept. 17, at 8:30 a.m. – 10 a.m. at McCormick Place West, W183 A.
- “Social Determinants of Health: Practical and Sensitive Identification and Strategies.” “Yes, but what is our responsibility as pediatricians? Hopefully, I can find out at this session.” Sunday, Sept. 17, at 8:30 a.m. – 10 a.m. at McCormick Place West, W181 A.
- “Council on Community Pediatrics Program. The Intersection of Housing, Neighborhood, and Child Health.” “We must never forget that the factors that impact the health and development of our patients often are not medical, but social and environmental. This should be an interesting session.” Monday, Sept. 18, at 8 a.m. – 12 p.m. at McCormick Place West, S105 A.
- “Bright Futures Update: What Has Changed and Why.” “There is nothing more complicated or important than the well-child care we provide. Bright Futures has come out with new changes, and I need to take advantage of having the editor, Joe Hagan, guide me through the changes.” Saturday, Sept. 16, at 7:30 a.m. – 8:15 a.m. at McCormick Place West, W179, and Sunday, Sept. 17, at 9:30 a.m. – 10:15 a.m. at McCormick Place West, W187 A.
- “Children’s Health: What’s at Stake in the New Administration.” “These are scary times for children, especially for those who come from disadvantaged backgrounds. I need to prioritize where to take action.” Saturday, Sept. 16, at 8:30 a.m. – 10 a.m. at McCormick Place West, W181 A.
- “Integrating Mental Health Services in the Primary Care Office.” “We see more and more children coming in the office with mental health issues, and I need new skill development to take care of them.” Saturday, Sept. 16, at 7:30 a.m. – 8:15 a.m. at McCormick Place West, W178 B, and Saturday, Sept. 16, at 5 p.m. – 5:45 p.m. at McCormick Place West, W176 C.
- “The preconference program ‘Pediatricians Leading Change in Physician Health and Wellness’ will be something you don’t want to miss. Speakers will address topics such as burnout among physicians and residents, compassion fatigue, and approaches to wellness that target individuals, practices, organizations, and medical education. Physician wellness is essential if we want to provide excellent medical care.” Friday, Sept. 15, 11:30 a.m. – 5:30 p.m. at McCormick Place West, W375 E.
- “Monday’s plenary session, ‘The Heat Is On: Why Climate Change Advocacy Is Essential to Child Health’ by Jonathan Patz, MD, MPH, will be particularly relevant, given recent extreme weather events. Children also are affected by climate change, because infectious diseases patterns are altered and because of changes in plant growth and pollen production. Dr. Patz will discuss how pediatricians and physicians from other specialties need to join together to protect patients from further harm, through education and advocacy.” Monday, Sept. 18, at 12:10 p.m. – 12:30 p.m. at Skyline Ballroom.
- “Tics, CANS, PANS, and Other Movement Disorders” by Joanna Blackburn, MD. “When I was in training, these diagnoses were not really recognized; but from what I have seen in practice, they exist and require support from specialists who are hard to find. Having more knowledge of the disorders would benefit any primary care physician.” Saturday, Sept. 16, at 7:30 a.m. – 8:15 a.m. at McCormick Place West, W183 C, and Sunday, Sept. 17, at 8:30 a.m. – 9:15 a.m. at McCormick Place West, W185D.
- “Are Vaccines Safe?” by Paul Offit, MD. “As physicians, we know that vaccines are safe; but our patients are very skeptical about this and don’t believe us. I hope this lecture will give us statistics and studies to bring back to our patients.” Saturday, Sept. 16, at 4 p.m. – 4:45 p.m. at McCormick Place West, W183 B, and Sunday, Sept. 17, at 2 p.m. – 2:45 p.m. at McCormick Place West, W183 B.
- “The presentation ‘Bright Futures Update: What Has Changed and Why’ by Joseph Hagan Jr., MD, is always a good guide.” Saturday, Sept. 16, at 7:30 a.m. – 8:15 a.m. at McCormick Place West, W179, and Sunday, Sept. 17, at 9:30 a.m. – 10:15 a.m. at McCormick Place West, W187 A.
- “Integrating Mental Health Services in the Primary Care Office” by Jay Rabinowitz, MD. “Pediatricians are increasingly involved in dealing with children and adolescents who have mental health problems. Enhancing their ability to do so in their office can be very beneficial.” Saturday, Sept. 16, at 7:30 a.m. – 8:15 a.m. at McCormick Place West, W178 B, and Saturday, Sept. 16, at 5:00 p.m. – 5:45 p.m. at McCormick Place West, W176 C.
- “2017 AAP Guidelines for Childhood Hypertension: Highlights” by Joseph Flynn, MD, MS. “New guidelines for diagnosis, evaluation, and management of abnormal blood pressures in the ambulatory setting were issued by the AAP in September. Pediatricians need to be updated on this important disease and incorporate these into their practices.” Tuesday, Sept. 19, at 10:30 a.m. – 10:50 a.m. at Skyline Ballroom.
- “Meet the Redbook Committee.” “This session will include discussions of issues germane to infectious diseases in children. It always includes new information on important topics for practice, including immunizations.” Monday, Sept. 18, at 8 a.m. – 10 a.m. at McCormick Place West, W190 A.
- “Vaccine Update, What’s New and What’s Changed” by Mary Anne Jackson, MD. “Recommendations change yearly, so this session is always important.” Sunday, Sept. 17, at 7:30 a.m. – 8:15 a.m. at McCormick Place West, W183 A, and Sunday, Sept. 17, at 4 p.m. – 4:45 p.m. at McCormick Place West, W183 A.
- “The presentation ‘Bright Futures Update: What Has Changed and Why’ by Joseph Hagan Jr., MD, highlights the new recommendations for the new guidelines published this year. There are important changes for all who use Bright Futures for their preventive child health visits (well-child visits).” Saturday, Sept. 16, at 7:30 a.m. – 8:15 a.m. at McCormick Place West, W179, and Sunday, Sept. 17, at 9:30 a.m. – 10:15 a.m. at McCormick Place West, W187 A.
- “Children’s Health – What’s at Stake in the New Administration” by Lynda Young, MD. “Dr. Young has significant experience in the advocacy area, which started for her when she was a young practitioner in Massachusetts and became interested in learning about how to promote the health of her patients through legislative connections and actions. Lynda is now chair of the AAP Committee on Federal Government Affairs, and with the changes in Washington adversely affecting millions of children in our country, it will be crucial for individual pediatricians to advocate in their communities and beyond. This session will share key concepts and tools for child health advocacy.” Saturday, Sept. 16, at 8:30 a.m. – 10 a.m. at McCormick Place West, W181 A.
- “AAP President’s Address.” “The AAP is our voice, our tool to improve the lives of children. I want to know what the AAP thinks is important today, and AAP President Fernando Stein, MD, will provide an update on efforts by the academy to advance the Agenda for Children.” Saturday, Sept. 16, at 10:30 a.m. – 11:15 a.m. at Skyline Ballroom.
- “Antimicrobial Update.” “Infectious diseases is a big part of pediatrics. I need to stay current on the latest antibiotic tools.” Sunday, Sept. 17, at 8:30 a.m. – 10 a.m. at McCormick Place West, W179, and Monday, Sept. 18, at 8:30 a.m. – 10 a.m. at McCormick Place West, W180.
- “Teens Gone Wild: Advising Families on Parenting Adolescents.” “Working with parenting issues with teens is fun but complicated. I look forward to the refresher.” Sunday, Sept. 17, at 8:30 a.m. – 10 a.m. at McCormick Place West, W183 A.
- “Social Determinants of Health: Practical and Sensitive Identification and Strategies.” “Yes, but what is our responsibility as pediatricians? Hopefully, I can find out at this session.” Sunday, Sept. 17, at 8:30 a.m. – 10 a.m. at McCormick Place West, W181 A.
- “Council on Community Pediatrics Program. The Intersection of Housing, Neighborhood, and Child Health.” “We must never forget that the factors that impact the health and development of our patients often are not medical, but social and environmental. This should be an interesting session.” Monday, Sept. 18, at 8 a.m. – 12 p.m. at McCormick Place West, S105 A.
- “Bright Futures Update: What Has Changed and Why.” “There is nothing more complicated or important than the well-child care we provide. Bright Futures has come out with new changes, and I need to take advantage of having the editor, Joe Hagan, guide me through the changes.” Saturday, Sept. 16, at 7:30 a.m. – 8:15 a.m. at McCormick Place West, W179, and Sunday, Sept. 17, at 9:30 a.m. – 10:15 a.m. at McCormick Place West, W187 A.
- “Children’s Health: What’s at Stake in the New Administration.” “These are scary times for children, especially for those who come from disadvantaged backgrounds. I need to prioritize where to take action.” Saturday, Sept. 16, at 8:30 a.m. – 10 a.m. at McCormick Place West, W181 A.
- “Integrating Mental Health Services in the Primary Care Office.” “We see more and more children coming in the office with mental health issues, and I need new skill development to take care of them.” Saturday, Sept. 16, at 7:30 a.m. – 8:15 a.m. at McCormick Place West, W178 B, and Saturday, Sept. 16, at 5 p.m. – 5:45 p.m. at McCormick Place West, W176 C.
USPSTF backs away from cotesting in cervical cancer screening
Women aged 30-65 years should be offered a choice between two cervical cancer screening methods, according to draft recommendations from the U.S. Preventive Services Task Force. The recommendations were released on Sept. 12.
The Task Force continues to recommend that women in their 20s be screened every 3 years via cervical cytology, but in a change from the 2012 recommendations, the researchers now advise clinicians to offer women aged 30-65 years a choice of either cytology every 3 years or the high-risk human papillomavirus (hrHPV) test every 5 years as a method of screening for cervical cancer. Cotesting is no longer recommended.
Offering women aged 30-65 years a screening choice received an A recommendation. The draft retains the previous Task Force position and D recommendation against cervical cancer screening for certain groups, including women younger than 21 years, women aged 65 and older with a history of screening and a low risk of cervical cancer, and women who have had a hysterectomy.
The USPSTF based the draft recommendations in part on a review of four randomized, controlled trials of cotesting hrHPV and cytology that included more than 130,000 women.
“Modeling found that cotesting does not offer any benefit in terms of cancer reduction or life-years gained over hrHPV testing alone but increases the number of tests and procedures per each cancer case averted,” the Task Force members noted in the draft recommendation statement. “Therefore, the USPSTF concluded that there is convincing evidence that screening with either cytology alone or hrHPV testing alone provides substantial benefit and is preferable to cotesting” in otherwise healthy women aged 30-65 years.
The American College of Obstetricians and Gynecologists currently recommends cotesting with cytology and HPV testing every 5 years or cytology alone every 3 years in women aged 30-65 years (Obstet Gynecol. 2016;128[4]:e111-30).
The USPSTF draft recommendations do not apply to women at increased risk for cervical cancer, including those with compromised immune systems or those who have cervical intraepithelial neoplasia grade 2 or 3.
The draft recommendations are available online for public comment from Sept. 12 through Oct. 9, 2017, at the USPSTF website, www.uspreventiveservicestaskforce.org.
Study findings support uncapping MELD score
Uncapping the current Model for End-Stage Liver Disease score may provide a better path toward making sure that patients most in need of a liver transplant get one, results from a large, long-term analysis showed.
Established in 2002, the Model for End-Stage Liver Disease (MELD) scoring system “was arbitrarily capped at 40 based on the presumption that transplanting patients with MELD greater than 40 would be futile,” researchers led by Mitra K. Nadim, MD, reported in the September 2017 issue of the Journal of Hepatology (67[3]:517-25. doi: 10.1016/j.jhep.2017.04.022). “As a result, patients with MELD greater than 40 receive the same priority as patients with MELD of 40, differentiated only by their time on the wait list.”
The mean age of patients was 53 years, and most were white men. The researchers reported that 3.3% of wait-listed patients had a MELD score of 40 or greater at registration, while 7.3% had MELD scores increase to 40 or greater after wait-list registration. In all, 30,369 patients (40.6%) underwent liver transplantation during the study period. Of these, 2,615 (8.6%) had a MELD score of 40 or greater at the time of their procedure. Compared with patients who had a MELD score of 40, those who had a MELD score of greater than 40 had an increased risk of death within 30 days, and the risk increased with rising scores. Specifically, the hazard ratio was 1.4 for those with a MELD score of 40-44, an HR of 2.6 for those with a MELD score of 45-49, and an HR of 5.0 for those with a MELD score of 50 or greater. There were no survival differences between the two groups at 1 and 3 years, but there was a survival benefit associated with liver transplantation as the MELD score increased above 40, the investigators reported.
“The arbitrary capping of the MELD at 40 has resulted in an unforeseen lack of objectivity for patients with MELD [score of greater than] 40 who are unjustifiably disadvantaged in a system designed to prioritize patients most in need,” they concluded. “Uncapping the MELD score is another necessary step in the evolution of liver allocation and patient prioritization.” They added that a significant number of patients with a MELD score of 40 or greater “likely suffer from acute-on-chronic liver failure (ACLF), a recently recognized syndrome characterized by acute liver decompensation, other organ system failures, and high short-term mortality in patients with end-stage liver disease. A capped MELD score fails to capture acute liver decompensation adequately, and data suggest that a model incorporating sudden increases in MELD predicts wait-list mortality better.”
Dr. Nadim and her associates acknowledged certain limitations of the study, including its retrospective design “and that factors relating to a patient’s suitability for transplantation or to a center’s decision to accept or reject a liver allograft, both of which affect graft and patient survival, were not accounted for in the analysis. Despite these limitations, the study results have important implications for improving the current liver allocation policy.”
The study was supported in part by the Health Resources and Services Administration. The researchers reported having no relevant financial disclosures.
PRIMARY SOURCE: J Hepatol. 2017;67[3]:517-25. doi: 1016/j.jhep.2017.04.022
FROM THE JOURNAL OF HEPATOLOGY
Key clinical point: .
Major finding: Compared with patients who had a MELD score of 40, the increased risk of death within 30 days was 1.4 for those with a MELD score of 40-44.
Study details: A retrospective analysis of 65,776 patients listed for a liver transplant from February 2002 to December 2012.
Disclosures: The study was supported in part by the Health Resources and Services Administration. The researchers reported having no relevant financial disclosures.
Source: Mitra K. Nadim, MD, et al. Inequity in organ allocation for patients awaiting liver transplantation: Rationale for uncapping the model for end-stage liver disease. J Hepatol. 2017;67(3):517-25. doi: 10.1016/j.jhep.2017.04.022.
Lack of lupus ‘gold standard’ definition hampers estimates of its incidence, prevalence
Two new studies representing the latest efforts to determine the incidence and prevalence of systemic lupus erythematosus in the United States have revealed the difficulty of ascertaining cases when definitions of the disease vary.
The two population-based registries on which the studies were based – the California Lupus Surveillance Project and the Manhattan Lupus Surveillance Program (MLSP) – confirmed that black women represent the highest risk group for systemic lupus erythematosus (SLE) and also reaffirmed the elevated risk observed in Hispanic and Asian women, compared with white women.
The MLSP researchers applied the updated 1997 American College of Rheumatology (ACR) classification criteria, the Systemic Lupus International Collaborating Clinics (SLICC) classification criteria, or a treating rheumatologist’s diagnosis to records from hospitals, rheumatologists, and administrative databases, and looked at both the prevalence of the disease in 2007 and the incidence from the period of 2007-2009. Using the ACR’s definition of SLE, they found an age-standardized prevalence of 62.2 and an incidence rate of 4.6 per 100,000 person-years (Arthritis Rheumatol. 2017 Sep 11. doi: 10.1002/art.40192).
The prevalence was significantly higher in women than in men (107.4 vs. 12.5 per 100,000 persons), and was highest overall in non-Hispanic black women (210.9), followed by Hispanic women (138.3), non-Hispanic Asian women (91.2), and non-Hispanic white women (64.3).
However, use of the SLICC classification criteria increased the age-standardized prevalence by 17%-19%, to a prevalence of 73.8 per 100,000 person-years and resulted in a 35% increase in incidence, to 6.2 per 100,000 person-years, compared with the ACR rates.
“The small number of cases that met the ACR but not the SLICC case definition is reassuring as it suggests that few cases met ACR criteria for SLE without the presence of autoantibodies,” wrote Peter M. Izmirly, MD, of New York (N.Y.) University, and his coauthors.
“However, given the descriptive nature of the MLSP and the absence of a gold standard test that would unambiguously identify SLE, this project cannot assess which set of classification criteria is more sensitive or specific.”
Meanwhile, the California Lupus Surveillance Project, a registry of people with lupus living in San Francisco County between 2007 and 2009, used the ACR definition to record an age-standardized annual incidence rate of 4.6 per 100,000 person-years, and an average annual prevalence of 84.8 per 100,000 persons (Arthritis Rheumatol. 2017 Sep 11. doi: 10.1002/art.40191).
As with the MLSP, the prevalence was highest in black women (458.1), followed by Hispanic women (177.9), Asian women (149.7) and white women (109.8). The incidence was 30.5 per 100,000 person-years in black women, 8.9 in Hispanic women, 7.2 in Asian women, and 5.3 in white women.
Looking at the clinical manifestations of disease, researchers found hematologic was the most common, affecting 84% of patients, while neurologic disorder affected only 8% of the population. Immunologic manifestations were present in 80%, arthritis in 57%, renal disorders in 45%, pleuritis or pericarditis in 41%, and malar rash in 33%.
There were racial variations in manifestations, with renal manifestations being more common in black, Asian/Pacific Islander, and Hispanic patients, compared with whites. Discoid rash was most common among black patients, while it was not evident at all in Hispanic patients.
Maria Dall’Era, MD, of the Russell/Engleman Research Center at the University of California, San Francisco, and her coauthors said that given the changing demographic of the diverse San Francisco County, a reliable estimate of the burden of lupus in different racial and ethnic groups was essential for health care planning.
“Up until the recent completion of the Georgia and Michigan surveillance projects, most previous epidemiologic studies were limited by small geographic areas, homogeneous populations, varying case definitions, and incomplete case ascertainment that relied on administrative codes or patient self-reported diagnosis,” they wrote.
To overcome the previous lack of data in Asian and Hispanic populations, the authors worked with physicians serving these populations and performed extensive case-finding in hospitals and health care clinics.
“Our approach of partnering with the community and engaging culturally and linguistically concordant community members led to successful case ascertainment of these traditionally understudied populations,” they wrote. “Had we not taken these extra steps, we would have missed SLE cases in the Asian and Hispanic populations.”
Both studies noted that racial and ethnic data were determined from medical records, and may not have accurately reflected the patient’s race or ethnicity.
The Manhattan study was supported by the Centers for Disease Control and Prevention and the New York City Department of Health and Mental Hygiene. The San Francisco study was supported by the Centers for Disease Control and Prevention and the Russell/Engleman Rheumatology Research Center at UCSF. No conflict of interest disclosures were available.
Together, the five national lupus registries funded by the Centers for Disease Control and Prevention provide important information about lupus in populations totaling over 6.5 million from four states and three selected Indian Health Service regions, including mixed urban and rural areas. Studies of this magnitude hold great value because case definitions and case ascertainment methodologies have been standardized, and they incorporate capture-recapture analyses to estimate the completeness of case finding.

Susan Manzi, MD, is with the department of medicine at the Allegheny Health Network, Pittsburgh, and Joan Merrill, MD, is with the department of arthritis and clinical immunology at the Oklahoma Medical Research Foundation, Oklahoma City. These comments are taken from an accompanying editorial (Arthritis Rheumatol. 2017 Sep 11. doi: 10.1002/art.40190). No conflicts of interest were available.
Together, the five national lupus registries funded by the Centers for Disease Control and Prevention provide important information about lupus in populations totaling over 6.5 million from four states and three selected Indian Health Service regions, including mixed urban and rural areas. Studies of this magnitude hold great value because case definitions and case ascertainment methodologies have been standardized, and they incorporate capture-recapture analyses to estimate the completeness of case finding.
Susan Manzi, MD, is with the department of medicine at the Allegheny Health Network, Pittsburgh, and Joan Merrill, MD, is with the department of arthritis and clinical immunology at the Oklahoma Medical Research Foundation, Oklahoma City. These comments are taken from an accompanying editorial (Arthritis Rheumatol. 2017 Sep 11. doi: 10.1002/art.40190). No conflicts of interest were available.
Two new studies representing the latest efforts to determine the incidence and prevalence of systemic lupus erythematosus in the United States have revealed the difficulty of ascertaining cases when definitions of the disease vary.
The two population-based registries on which the studies were based – the California Lupus Surveillance Project and the Manhattan Lupus Surveillance Program (MLSP) – confirmed that black women represent the highest risk group for systemic lupus erythematosus (SLE) and also reaffirmed the elevated risk observed in Hispanic and Asian women, compared with white women.
The MLSP researchers applied the updated 1997 American College of Rheumatology (ACR) classification criteria, the Systemic Lupus International Collaborating Clinics (SLICC) classification criteria, or a treating rheumatologist’s diagnosis to records from hospitals, rheumatologists, and administrative databases, and looked at both the prevalence of the disease in 2007 and the incidence from the period of 2007-2009. Using the ACR’s definition of SLE, they found an age-standardized prevalence of 62.2 and an incidence rate of 4.6 per 100,000 person-years (Arthritis Rheumatol. 2017 Sep 11. doi: 10.1002/art.40192).
The prevalence was significantly higher in women than in men (107.4 vs. 12.5 per 100,000 persons), and was highest overall in non-Hispanic black women (210.9), followed by Hispanic women (138.3), non-Hispanic Asian women (91.2), and non-Hispanic white women (64.3).
However, use of the SLICC classification criteria increased the age-standardized prevalence by 17%-19%, to a prevalence of 73.8 per 100,000 person-years and resulted in a 35% increase in incidence, to 6.2 per 100,000 person-years, compared with the ACR rates.
“The small number of cases that met the ACR but not the SLICC case definition is reassuring as it suggests that few cases met ACR criteria for SLE without the presence of autoantibodies,” wrote Peter M. Izmirly, MD, of New York (N.Y.) University, and his coauthors.
“However, given the descriptive nature of the MLSP and the absence of a gold standard test that would unambiguously identify SLE, this project cannot assess which set of classification criteria is more sensitive or specific.”
Meanwhile, the California Lupus Surveillance Project, a registry of people with lupus living in San Francisco County between 2007 and 2009, used the ACR definition to record an age-standardized annual incidence rate of 4.6 per 100,000 person-years, and an average annual prevalence of 84.8 per 100,000 persons (Arthritis Rheumatol. 2017 Sep 11. doi: 10.1002/art.40191).
As with the MLSP, the prevalence was highest in black women (458.1), followed by Hispanic women (177.9), Asian women (149.7) and white women (109.8). The incidence was 30.5 per 100,000 person-years in black women, 8.9 in Hispanic women, 7.2 in Asian women, and 5.3 in white women.
Looking at the clinical manifestations of disease, researchers found hematologic was the most common, affecting 84% of patients, while neurologic disorder affected only 8% of the population. Immunologic manifestations were present in 80%, arthritis in 57%, renal disorders in 45%, pleuritis or pericarditis in 41%, and malar rash in 33%.
There were racial variations in manifestations, with renal manifestations being more common in black, Asian/Pacific Islander, and Hispanic patients, compared with whites. Discoid rash was most common among black patients, while it was not evident at all in Hispanic patients.
Maria Dall’Era, MD, of the Russell/Engleman Research Center at the University of California, San Francisco, and her coauthors said that given the changing demographic of the diverse San Francisco County, a reliable estimate of the burden of lupus in different racial and ethnic groups was essential for health care planning.
“Up until the recent completion of the Georgia and Michigan surveillance projects, most previous epidemiologic studies were limited by small geographic areas, homogeneous populations, varying case definitions, and incomplete case ascertainment that relied on administrative codes or patient self-reported diagnosis,” they wrote.
To overcome the previous lack of data in Asian and Hispanic populations, the authors worked with physicians serving these populations and performed extensive case-finding in hospitals and health care clinics.
“Our approach of partnering with the community and engaging culturally and linguistically concordant community members led to successful case ascertainment of these traditionally understudied populations,” they wrote. “Had we not taken these extra steps, we would have missed SLE cases in the Asian and Hispanic populations.”
Both studies noted that racial and ethnic data were determined from medical records, and may not have accurately reflected the patient’s race or ethnicity.
The Manhattan study was supported by the Centers for Disease Control and Prevention and the New York City Department of Health and Mental Hygiene. The San Francisco study was supported by the Centers for Disease Control and Prevention and the Russell/Engleman Rheumatology Research Center at UCSF. No conflict of interest disclosures were available.
FROM ARTHRITIS & RHEUMATOLOGY
Key clinical point: Black women have the highest prevalence and incidence of systemic lupus erythematosus.
Major finding: Use of the SLICC classification criteria increased the age-standardized prevalence by 17%-19% and resulted in a 35% increase in incidence, compared with the ACR criteria rates.
Data source: The Manhattan and California Lupus Surveillance Projects population-based registries.
Disclosures: The Manhattan study was supported by the Centers for Disease Control and Prevention and the New York City Department of Health and Mental Hygiene. The San Francisco study was supported by the Centers for Disease Control and Prevention and the Russell/Engleman Rheumatology Research Center at UCSF. No conflict of interest disclosures were available.