User login
Uninsured rate falls to record low of 8.8%
Three years after the Affordable Care Act’s coverage expansion took effect, the number of Americans without health insurance fell to 28.1 million in 2016, down from 29 million in 2015, according to a federal report released Sept. 12.
The latest numbers from the U.S. Census Bureau showed the nation’s uninsured rate dropped to 8.8%. It had been 9.1% in 2015.
Both the overall number of uninsured and the percentage are record lows.
The latest figures from the Census Bureau effectively close the book on President Barack Obama’s record on lowering the number of uninsured. He made that a linchpin of his 2008 campaign, and his administration’s effort to overhaul the nation’s health system through the ACA focused on expanding coverage.
When Mr. Obama took office in 2009, during the worst economic recession since the Great Depression, more than 50 million Americans were uninsured, or nearly 17% of the population.
The number of uninsured has fallen from 42 million in 2013 – before the ACA in 2014 allowed states to expand Medicaid, the federal-state program that provides coverage to low-income people, and provided federal subsidies to help lower- and middle-income Americans buy coverage on the insurance marketplaces. The decline also reflected the improving economy, which has put more Americans in jobs that offer health coverage.
The dramatic drop in the uninsured over the past few years played a major role in the congressional debate over the summer about whether to replace the 2010 health law. Advocates pleaded with the Republican-controlled Congress not to take steps to reverse the gains in coverage.
The Census Bureau numbers are considered the gold standard for tracking who has insurance because the survey samples are so large.
The uninsured rate has fallen in all 50 states and the District of Columbia since 2013, although the rate has been lower among the 31 states that expanded Medicaid as part of the health law. The lowest uninsured rate last year was 2.5% in Massachusetts, and the highest was 16.6% in Texas, the Census Bureau reported. States that expanded Medicaid had an average uninsured rate of 6.5%, compared with an 11.7% average among states that did not expand.
More than half of Americans – 55.7% – get health insurance through their jobs. But government coverage is becoming more common. Medicaid now covers more than 19% of the population and Medicare, nearly 17%.
Kaiser Health News is a national health policy news service that is part of the nonpartisan Henry J. Kaiser Family Foundation.
BIMA’s benefits extend to high-risk CABG patients
COLORADO SPRINGS – The survival advantage of bilateral internal over left internal mammary artery grafts persists even among multivessel CABG patients perceived to be at high surgical risk, Nishant Saran, MD, reported at the annual meeting of the Western Thoracic Surgical Association.
Many surgeons hesitate to perform bilateral internal mammary artery (BIMA) grafting in high-risk patients on the presumption that BIMA might not benefit them. It’s a concern that appears to be without merit, however, based on a retrospective analysis of the 6,468 multivessel CABG procedures performed at the Mayo Clinic during 2000-2015, said Dr. Saran of the Mayo Clinic in Rochester, Minn.

The BIMA patients were as a whole significantly younger, primarily men, and less likely to have diabetes or to be obese than the LIMA patients. Also, LIMA patients were fourfold more likely to have baseline heart failure, twice as likely to have a history of stroke, and had a twofold greater prevalence of chronic lung disease.
“The unmatched comparison shows the clear treatment selection bias we have: BIMA goes to the healthier patients,” Dr. Saran observed.
But is that bias justified? To find out, he and his coinvestigators performed extensive propensity score matching using several dozen baseline variables in order to identify 1,011 closely matched patient pairs. In this propensity score-matched analysis, 5- and 10-year survival rates were significantly better in the BIMA group. The gap between the two survival curves widened after about 7 years and continued to expand steadily through year 10. Incision time averaged 298 minutes in the BIMA group and 254 minutes in the propensity-matched LIMA group.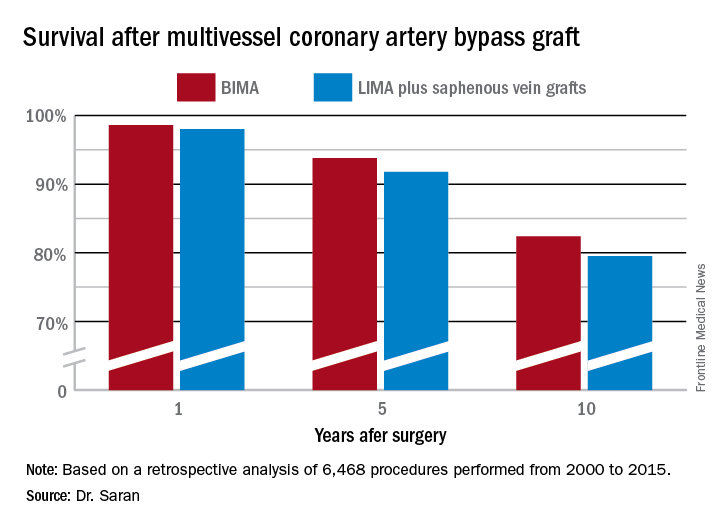
Discussant Eric J. Lehr, MD, a cardiac surgeon at Swedish Medical Center in Seattle, noted that the impressive survival benefit for BIMA in the retrospective Mayo Clinic study came at what he termed “a modest cost”: a doubled incidence of sternal site infections, from 1.4% in the LIMA group to 3% with BIMA. Importantly, though, there was no significant difference in the more serious deep sternal wound infections.
He agreed with Dr. Saran that BIMA is seriously underutilized, noting that only one cardiothoracic surgery program in the state of Washington uses BIMA more than 10% of the time in multivessel CABG.
Dr. Lehr then posed a provocative question: “Should BIMA grafting be considered a quality metric in coronary revascularization surgery, despite the small increase in sternal site infections, even though sternal wound infections have been declared a ‘never’ event and are tied to reimbursement?”
“I think BIMA should be a gold standard,” Dr. Saran replied. “The first thing that a cardiac surgeon should always think of when a patient is going to have CABG is ‘BIMA first,’ and only then look into reasons for not doing it. But I guess in current real-world practice, things are different.”
Howard K. Song, MD, commented, “I think a study like this doesn’t necessarily show that every surgeon should be using BIMA liberally, it shows that surgeons in your practice who do that have excellent outcomes.”
Dr. Song, professor of surgery and chief of the division of cardiothoracic surgery at Oregon Health and Science University, Portland, added that he believes extensive use of BIMA is actually a surrogate marker for a highly skilled subspecialist who would be expected to have very good outcomes as a matter of course.
“That may be one way of looking at it; however, I do think that even very skilled surgeons still have an inherent resistance to doing BIMA,” Dr. Saran responded.
“In the current era, the surgeon is pressured to achieve improved short-term outcomes and improved OR turnover times. An extra half hour for BIMA tends to push the surgeon away,” he added.
Dr. Saran reported having no financial conflicts of interest.
COLORADO SPRINGS – The survival advantage of bilateral internal over left internal mammary artery grafts persists even among multivessel CABG patients perceived to be at high surgical risk, Nishant Saran, MD, reported at the annual meeting of the Western Thoracic Surgical Association.
Many surgeons hesitate to perform bilateral internal mammary artery (BIMA) grafting in high-risk patients on the presumption that BIMA might not benefit them. It’s a concern that appears to be without merit, however, based on a retrospective analysis of the 6,468 multivessel CABG procedures performed at the Mayo Clinic during 2000-2015, said Dr. Saran of the Mayo Clinic in Rochester, Minn.
The BIMA patients were as a whole significantly younger, primarily men, and less likely to have diabetes or to be obese than the LIMA patients. Also, LIMA patients were fourfold more likely to have baseline heart failure, twice as likely to have a history of stroke, and had a twofold greater prevalence of chronic lung disease.
“The unmatched comparison shows the clear treatment selection bias we have: BIMA goes to the healthier patients,” Dr. Saran observed.
But is that bias justified? To find out, he and his coinvestigators performed extensive propensity score matching using several dozen baseline variables in order to identify 1,011 closely matched patient pairs. In this propensity score-matched analysis, 5- and 10-year survival rates were significantly better in the BIMA group. The gap between the two survival curves widened after about 7 years and continued to expand steadily through year 10. Incision time averaged 298 minutes in the BIMA group and 254 minutes in the propensity-matched LIMA group.
Discussant Eric J. Lehr, MD, a cardiac surgeon at Swedish Medical Center in Seattle, noted that the impressive survival benefit for BIMA in the retrospective Mayo Clinic study came at what he termed “a modest cost”: a doubled incidence of sternal site infections, from 1.4% in the LIMA group to 3% with BIMA. Importantly, though, there was no significant difference in the more serious deep sternal wound infections.
He agreed with Dr. Saran that BIMA is seriously underutilized, noting that only one cardiothoracic surgery program in the state of Washington uses BIMA more than 10% of the time in multivessel CABG.
Dr. Lehr then posed a provocative question: “Should BIMA grafting be considered a quality metric in coronary revascularization surgery, despite the small increase in sternal site infections, even though sternal wound infections have been declared a ‘never’ event and are tied to reimbursement?”
“I think BIMA should be a gold standard,” Dr. Saran replied. “The first thing that a cardiac surgeon should always think of when a patient is going to have CABG is ‘BIMA first,’ and only then look into reasons for not doing it. But I guess in current real-world practice, things are different.”
Howard K. Song, MD, commented, “I think a study like this doesn’t necessarily show that every surgeon should be using BIMA liberally, it shows that surgeons in your practice who do that have excellent outcomes.”
Dr. Song, professor of surgery and chief of the division of cardiothoracic surgery at Oregon Health and Science University, Portland, added that he believes extensive use of BIMA is actually a surrogate marker for a highly skilled subspecialist who would be expected to have very good outcomes as a matter of course.
“That may be one way of looking at it; however, I do think that even very skilled surgeons still have an inherent resistance to doing BIMA,” Dr. Saran responded.
“In the current era, the surgeon is pressured to achieve improved short-term outcomes and improved OR turnover times. An extra half hour for BIMA tends to push the surgeon away,” he added.
Dr. Saran reported having no financial conflicts of interest.
AT THE WTSA ANNUAL MEETING
Key clinical point:
Major finding: Ten-year survival following multivessel CABG using bilateral internal mammary artery grafting was 82.4%, significantly better than the 79.5% rate with left internal mammary artery grafting plus saphenous vein grafts.
Data source: This retrospective observational single-center included 6,468 patients who underwent multivessel CABG during 2000-2015.
Disclosures: Dr. Saran reported having no financial conflicts of interest.
Postpartum NSAIDs didn’t up hypertension risk in preeclampsia
Women with severe preeclampsia who received nonsteroidal anti-inflammatory drugs during the postpartum period had no greater risk of persistent postpartum hypertension than women who didn’t take them, a study showed.
Additionally, though the numbers of women affected were small, there was no increased risk of severe maternal morbidity. Rates of pulmonary hypertension, renal failure, eclampsia, or intensive care unit admission were similar between women who received NSAIDs during the postpartum period and women who did not.
The single-center retrospective cohort study examined the records of 399 women with severe preeclampsia, 324 of whom (81%) were still hypertensive 24 hours post delivery (Obstet Gynecol. 2017;130:830-5. doi: 10.1097/AOG.0000000000002247). Of this group, three-quarters (n = 243) received NSAIDs, while one-quarter (n = 81) did not.
After multivariable analysis, first author Oscar Viteri, MD, and his colleagues reported that 70% of patients who received NSAIDs had persistent postpartum hypertension, defined as a blood pressure of at least 150 mm Hg or a diastolic BP of at least 100 mm Hg obtained on two occasions at least 4 hours apart. This compared with a rate of 73% for the women who did not receive NSAIDs (adjusted odds ratio, 1.1; 95% confidence interval [CI], 0.6-2.0; P = .57).
Relatively small numbers of women in each group experienced severe morbidity, limiting statistical analysis of these secondary outcome measures. Just six women who received NSAIDs and eight who did not (3% and 10%) developed pulmonary edema (OR, 4.4; 95% CI, 1.5-13.1).
Renal dysfunction occurred in 5% of the NSAIDs users vs. 8% of the nonusers (OR, 1.7; 95% CI, 0.6-4.8), and eclampsia occurred in two patients who took NSAIDs and none of the nonusers. Of those who took NSAIDs, 3% had an intensive care unit admission, compared with 8% of those who did not take these drugs (OR 2.4; 95% CI, 0.8-7.1).
Dr. Viteri and his coauthors at the University of Texas Health Science Center, Houston, noted that a high proportion of women with severe preeclampsia received ibuprofen (40%), ketorolac (6%), or both (54%) during their postpartum hospital stay. This occurred despite a 2013 recommendation from the American College of Obstetricians and Gynecologists Task Force for Hypertension in Pregnancy urging clinicians to avoid NSAIDs in women with hypertension persisting for 24 hours post partum.
In nonpregnant women with hypertension who are taking beta-blockers or angiotensin-converting enzyme inhibitors, NSAIDs use has been associated with increased systolic and diastolic blood pressure, said Dr. Viteri and his colleagues. There are several plausible physiologic mechanisms for this effect, including increased renal sodium retention from inhibition of prostaglandin E2. This potential effect, in particular, may have implications for women in the puerperum, since 6-8 L of fluid are returned to the maternal intravascular space during the early postpartum period.
However, “evidence on the effects of NSAIDs in otherwise healthy puerperal women with preeclampsia before delivery remains conflicting,” the investigators wrote. This study helps to fill the knowledge gap, though there are some limitations, including the fact that the non-NSAIDs arm was small, leaving an unbalanced study that was underpowered to detect differences in “rare but clinically significant” severe maternal morbidity. Also, the study captured only the inpatient period; because the mean duration of hospital stay was 4.5 days, the study missed a portion of the window of fluid volume redistribution, which occurs mostly during postpartum days 3-6.
Still, the findings from this large retrospective study warrant an adequately powered clinical trial to settle the question of the safety of NSAIDs for women with preeclampsia, the investigators said.
Dr. Viteri and his colleagues reported having no relevant conflicts of interest.
FROM OBSTETRICS AND GYNECOLOGY
Key clinical point:
Major finding: In total, 70% of women with severe preeclampsia taking NSAIDs, and 73% of those who did not, had persistent postpartum hypertension.
Study details: A retrospective cohort study of 324 women with severe preeclampsia who remained hypertensive for more than 24 hours after delivery.
Disclosures: None of the study authors reported having relevant conflicts of interest.
PBC linked to increased risk of bone fracture
Patients with primary biliary cholangitis (PBC) may have an increase in the risk of developing bone fracture, according to Jian Zhao, MD, and associates.
In four cross-sectional studies, 515 patients were examined to assess the prevalence of fracture in a PBC population. Of those patients, the estimated prevalence of fracture was 15.2%. In four additional studies, 1,002 patients and 8,805 controls were examined to assess the relative risk of fracture among PBC patients. Those results found a significantly increased risk of fracture in PBC patients with the pooled odds ratio of 1.93.
It is noted that multiple factors underlie the osteopenic bone disease in PBC. In addition to cholestasis, risk factors include female sex, low body mass index, advanced age, and history of fragility fracture. Steroid use may also contribute to bone loss in PBC, especially in autoimmune hepatitis–primary biliary cholangitis overlap syndrome.
“The prevalence of bone fracture among PBC patients is relatively high and PBC increases the risk of fracture,” the researchers concluded. “Calcium and vitamin D supplementation or even bisphosphonate therapy should be recommended for PBC patients with bone loss to decrease the risk of fracture.”
Read the study in Clinics and Research in Hepatology and Gastroenterology (doi: 10.1016/j.clinre.2017.05.008).
FROM CLINICS AND RESEARCH IN HEPATOLOGY AND GASTROENTEROLOGY
Most type 2 diabetes patients skipping metformin as first-line therapy
Few patients who are initiated on second-line treatment for type 2 diabetes mellitus show evidence of recommended use of first-line treatment with metformin, according to research published online Sept. 13 in Diabetes Care.
A retrospective cross-sectional study examined Aetna member claims data from 52,544 individuals with type 2 diabetes. It showed that of the 22,956 individuals given second-line treatment, only 8.2% had claims evidence of recommended use of metformin in the previous 60 days.
Furthermore, 28% had no claims evidence at all of having taken metformin, and only a small number of these patients had evidence of contraindications to metformin, such as heart failure (2.9%), chronic obstructive pulmonary disease (3.1%), liver diseases (4.3%), or renal diseases (4.1%).
“Although gastrointestinal adverse effects related to metformin therapy might lead to guideline nonadherence and early second-line medication initiation, we did not find evidence for gastrointestinal upset in the claims data,” wrote Yi-Ju Tseng, PhD, of the Computational Health Informatics Program at Boston Children’s Hospital, and her coauthors.
Even at the top range of sensitivity, researchers argued that less than half of the patients on second-line treatment could have had prior recommended use of metformin as the first-line treatment, while at the lower end of sensitivity, that figure was less than 10% (Diabetes Care. 2017 Sep 13. doi: 10.2337/dc17-0213).
Around one-third of patients received some metformin before beginning a second-line treatment, but the duration of metformin treatment was less than the 2 months recommended by current guidelines. Of these patients, just over half were prescribed both metformin and the second-line medication on the same day.
“What may be taken as evidence of treatment failure by clinicians may instead represent failure of adherence to established treatment guidelines, which in turn may lead to the use of insulin or additional second-line medications,” the authors wrote. “Point-of-care decision support and population health–level approaches should focus on improving adherence to first-line therapy.”
The study also found that patients who were given a second-line treatment without evidence of recommended first-line use of metformin were significantly more likely to be given insulin or an additional second-line antihyperglycemic medication. They were also more likely to be male.
However, the authors acknowledged that retrospective claims-based analyses were limited by the exclusion of uninsured patients, and a lack of detailed clinical or behavioral information, or information on out-of-pocket medications.
The study was supported by the National Institute of General Medical Sciences, and one author was supported by grants from the Ministry of Science and Technology, Taiwan and Chang Gung Memorial Hospital, Linkou, Taiwan. No conflicts of interest were declared.
FROM DIABETES CARE
Key clinical point: Most patients with type 2 diabetes are not taking the recommended first-line metformin treatment or are skipping straight to second-line therapies altogether.
Major finding: Fewer than 1 in 10 patients with type 2 diabetes have evidence of recommended use of metformin as a first-line treatment for type 2 diabetes.
Data source: A retrospective cross-sectional study of member claims data from 52,544 individuals with type 2 diabetes.
Disclosures: The study was supported by the National Institute of General Medical Sciences, and one author was supported by grants from the Ministry of Science and Technology, Taiwan and Chang Gung Memorial Hospital. No conflicts of interest were declared.
Capillary leakage predicts hysterectomy in postpartum group A strep
PARK CITY, UTAH – Systemic capillary leakage – which involves acute respiratory distress, ascites, pleural effusion, and abdominal distention – significantly increases the risk of hysterectomy in women with postpartum group A Streptococcus infection, according to findings from a single-site study.
The investigators at the University of Utah in Salt Lake City analyzed 71 cases of culture-proven infection at the university since 1991. They compared the 33 women who had hysterectomies, ICU admissions, pressor support, or mechanical ventilation with the 38 women who did not.
The goal was to identify predictors of poor outcomes and clarify when hysterectomy is the appropriate clinical decision. “These are young women, and it might have been their first pregnancy. You don’t want to remove their uterus if they don’t need it, but we know if women get really sick, they need that source control within 6-12 hours of presentation,” said Jennifer Kaiser, MD, the study’s lead investigator and an ob.gyn. fellow at the University of Utah.
“Capillary leak is an important objective clinical parameter that should be evaluated and considered with due exigency. I think this has not been well recognized,” Dr. Kaiser said at the annual scientific meeting of the Infectious Diseases Society for Obstetrics and Gynecology. The finding “should prompt you to mobilize a team for hysterectomy, or if you are at a smaller hospital, to think about transporting the patient to a higher level hospital that can perform hysterectomy and offer ICU care,” she added.
The investigators also found that a traditional marker for severe infection – uterine and cervical motion tenderness – did not predict adverse outcomes among the 71 women. Many patients with severe disease don’t actually have tenderness, Dr. Kaiser said.
It also didn’t matter whether the organism was isolated from the uterus or the blood. It’s sometimes thought uterine positivity predicts “worse prognosis, but that didn’t pan out,” she said.
Capillary leakage was a concern in 27 (82%) of the 33 women who had adverse outcomes, compared with 7 (18%) of the women who fared better, and included acute respiratory distress (30% versus 0%); ascites (73% versus 3%); pleural effusion (58% versus 5%), and abdominal distention (61% versus 18%). In total, 21 of the 33 women with adverse outcomes (64%) had hysterectomies. There were no deaths in the group.
Postpartum group A Streptococcus infections are more common in Utah than in other parts of the country, and it’s not known why. The next step for the investigators is to look at genealogies and genetic factors that may predispose women to severe infections, Dr. Kaiser said.
There was no industry funding for the work and Dr. Kaiser reported having no relevant financial disclosures.
AT IDSOG
Key clinical point:
Major finding: Signs of capillary leakage were predictive of adverse outcomes (OR 19.93, 95% CI 5.96-66.57, P less than .0001), specifically hysterectomy (OR 51.43, 95% CI 6.29-420.41, P less than .002).
Data source: A review of 71 cases of culture-proven infection at the University of Utah.
Disclosures: There was no industry funding for the work and the lead investigator reported having no relevant financial disclosures.
KW-2478 examined as novel add-on therapy for myeloma
Bortezomib and KW-2478, a novel nonansamycin heat shock protein 90 (Hsp90) inhibitor, had modest activity and was well tolerated in an open-label phase 1/2 study of patients with relapsed or refractory multiple myeloma.
The objective response rate in 79 evaluable patients treated with the combination was 39.2%, and the clinical benefit rate was 51.9%. Median progression-free survival was 6.7 months, and median duration of response was 5.5 months, according to a report by Jamie Cavenagh, MD, of St. Bartholomew’s Hospital, West Smithfield, London, and colleagues. The results were published online in the British Journal of Cancer.
KW-2478 showed synergistic antitumor activity with bortezomib in preclinical in vitro and in vivo studies, and the recommended phase 2 intravenous dosage of 175 mg/m2, along with 1.3 mg/m2 of bortezomib on days 1, 4, 8, and 11 of each 21-day cycle (up to eight cycles) in the current study was determined by phase 1 dose escalation; the maximum tolerated dose was not reached.
Although the antimyeloma activity of this novel treatment combination was relatively modest, the tolerability and apparent lack of overlapping toxicity suggest it deserves further exploration, including with alternate dosing schedules and combinations, for the treatment of relapsed/refractory multiple myeloma, the investigators concluded, noting that KW-2478 should also be studied in combination with other antimyeloma agents.
Kyowa Kirin Pharmaceutical Development Inc. funded the study. Dr. Cavenagh reported having no disclosures. Several other authors reported employment by the sponsor or by Kyowa Hakko Kirin Co. Ltd. Another, K. Yong, MD, reported receiving support from the National Institute for Health Research.
FROM THE BRITISH JOURNAL OF CANCER
Key clinical point:
Major finding: The objective response rate was 39.2%, and the clinical benefit rate was 51.9%.
Data source: An open-label phase 1/2 study of 95 patients.
Disclosures: Kyowa Kirin Pharmaceutical Development Inc. funded the study. Dr. Cavenagh reported having no disclosures. Several other authors reported employment by the sponsor or by Kyowa Hakko Kirin Co. Ltd. Another, K. Yong, MD, reported receiving support from the National Institute for Health Research.
Patient and physician outreach boost CRC screening rates
Can outreach improve the globally low rates of adherence to colorectal cancer screening? Yes, according to two recent studies in JAMA; the studies found that both patient-focused and physician-focused outreach approaches can result in significantly better patient participation in colorectal cancer (CRC) screening.
The first study (JAMA. 2017;318[9]:806-15) compared a colonoscopy outreach program and a fecal immunochemical test (FIT) outreach program both with each other and with usual care. The results of the pragmatic, single-site, randomized, clinical trial showed that completed screenings were higher for both outreach groups, compared with the usual care group.
The primary outcome measure of the study was completion of the screening process, wrote Amit Singal, MD, and his coauthors. This was defined as any adherence to colonoscopy completion, the completion of annual testing for patients who had a normal FIT test, or treatment evaluation if CRC was detected during the screening process. Screenings were considered complete even if, for example, a patient in the colonoscopy arm eventually went on to have three consecutive annual FIT tests rather than a colonoscopy.
A total of 5,999 patients eligible for screening were initially randomized to one of the three study arms. Across all study arms, approximately half were lost to follow-up. These patients were excluded from the primary analysis but were included in an additional intention-to-screen analysis. A total of 2,400 patients received a colonoscopy outreach mailing; 2,400 received FIT outreach, including a letter, the home FIT testing kit and instructions; 1,199 received usual care. Patients in both intervention arms also received up to two phone calls if they didn’t respond to the initial mailing within 2 weeks. Mailings and phone calls were conducted in English or Spanish, according to the patients’ stated language preferences (those whose spoke neither language were excluded from the study).
Of the patients in the colonoscopy outreach group, 922 (38.4%) completed the screening process, compared with 671 (28.0%) in the FIT outreach group and 128 (10.7%) in the usual care group.
Compared with the group receiving usual care, completion of the screening process was 27.7% higher in the colonoscopy outreach group and 17.3% higher in the FIT outreach group. Screening process completion was 10.4% higher for the colonoscopy outreach group, compared with the FIT outreach group (P less than .001 for all).
Dr. Singal, who is with the department of internal medicine at UT Southwestern Medical Center, Dallas, and his colleagues also performed several post-hoc secondary analyses. In one, they used a less-stringent definition of screening process completion in which biennial FIT testing was considered satisfactory. When this definition was applied, the colonoscopy outreach group had 0.5% lower screening process completion than the FIT outreach group. The chances of a patient receiving any screening during the study period was highest in the FIT group (65%), with 51.7% of those in the colonoscopy outreach group and 39% of those in the usual care group receiving any screening.
“FIT has lower barriers to one-time participation but requires annual screening and diagnostic evaluation of abnormal results,” wrote Dr. Singal and his colleagues.
Strengths of the study, said Dr. Singal and his colleagues, included the fact that the study took place at a “safety net” institution with a racially and socioeconomically diverse population. Also, the study design avoided volunteer bias, and offered a pragmatic head-to-head comparison of colonoscopy and FIT.
The second study took place in western France, and targeted outreach to physicians rather than patients (JAMA. 2017;318[9];816-84). When physicians were given a list of their own patients who were not up to date on CRC screening, investigators saw a small, but significant, uptick in patient participation in FIT screening.
One year after the reminders went out, FIT screening had been initiated in 24.8% of patients whose physicians had received the list, compared with 21.7% of patients of physicians who had received a more generic notice and 20.6% of patients whose physicians received no notification, according to first author Cedric Rat, MD, and his colleagues.
The study examined which notification approach was most effective in increasing FIT screening among the physicians’ patient panels: sending general practitioners (GPs) letters that included a list of their own patients who had not undergone CRC screening, or sending them generic letters describing CRC screening adherence rates specific to their region. A usual care group of practices received no notifications in this 3-group randomized cluster design.
Patients in the patient-specific reminders group had an odds ratio of 1.27 for participation in FIT screening (P less than .001) compared to the usual care group. The odds ratio for the generic reminders group was 1.09, a nonsignificant difference.
Between-group comparison showed statistical significance for both the 3.1% difference between the patient-specific and generic reminders groups, and for the 4.2% difference between the patient-specific and usual care groups (P less than .001 for both). There was no significant difference between the generic reminders group and the usual care group.
Dr. Rat, professor of medicine at the Faculty of Medicine, Nantes, France, and his colleagues enrolled GPs in a total of 801 practices that included patients aged 50participating GPs caring for 33,044 patients who met study criteria.
Physician characteristics that were associated with higher FIT participation included younger age and an initially smaller number of unscreened patients. Patients with low socioeconomic status and those with a higher chronic disease burden were less likely to participate in FIT screening.
Also, Dr. Rat and his colleagues noted that the busiest practices actually had higher CRC screening rates. The investigators hypothesized that a recent physician pay-for-performance grant for CRC completion might be more appealing for some busy physicians.
This was the largest study of CRC screening participation to date, according to Dr. Rat and his coauthors, and showed the small but detectable efficacy of an inexpensive intervention that, given complete patient records, is relatively easy to effect. Though the effect size was smaller than the 12% difference the investigators had anticipated seeing for the patient-specific reminders group, the study still showed that targeting physicians can be an effective public health intervention to increase CRC screening rates, said Dr. Rat and his colleagues.
None of the investigators in either study reported conflicts of interest.
Both studies, though they used different outreach interventions, highlight the same problem: the need to identify and execute effective colorectal cancer (CRC) screening programs. Effective screening has great lifesaving potential; if screening rates were elevated to greater than 80% in the United States, an estimated 200,000 deaths would be prevented within the next 2 decades.
The nature of CRC screening options means that a home fecal sample collection is inexpensive, and will result in an initial higher screening rate; however, complete screening via fecal occult blood testing requires annual repeats of negative tests, and patients with positive fecal occult blood tests still need colonoscopy.
Colonoscopy, although it’s burdensome for patients and perhaps cost prohibitive for those without health insurance, offers a one-time test that, if negative, provides patients with a 10-year window of screening coverage.
Any effective programs to increase CRC screening rates will need to use a systems change approach, with creative interventions that take patient education, and even delivery of preventive health services, out of the context of the already too-full office visit.
Staff supports, such as the follow-up telephone calls used in the patient-targeted intervention, are key to effective interventions, especially for vulnerable populations. Additionally, institutions must ensure that they have adequate physical and staff resources to support the increased screening they are seeking to achieve.
Dr. Michael Pignone is a professor of medicine at the University of Texas at Austin. Dr. David Miller is a professor of internal medicine, Wake Forest University, Winston-Salem, N.C. Dr. Pignone is a medical director for Healthwise; Dr. Miller reported no relevant conflicts of interest These remarks were drawn from an editorial accompanying the two clinical trials.
Can outreach improve the globally low rates of adherence to colorectal cancer screening? Yes, according to two recent studies in JAMA; the studies found that both patient-focused and physician-focused outreach approaches can result in significantly better patient participation in colorectal cancer (CRC) screening.
The first study (JAMA. 2017;318[9]:806-15) compared a colonoscopy outreach program and a fecal immunochemical test (FIT) outreach program both with each other and with usual care. The results of the pragmatic, single-site, randomized, clinical trial showed that completed screenings were higher for both outreach groups, compared with the usual care group.
The primary outcome measure of the study was completion of the screening process, wrote Amit Singal, MD, and his coauthors. This was defined as any adherence to colonoscopy completion, the completion of annual testing for patients who had a normal FIT test, or treatment evaluation if CRC was detected during the screening process. Screenings were considered complete even if, for example, a patient in the colonoscopy arm eventually went on to have three consecutive annual FIT tests rather than a colonoscopy.
A total of 5,999 patients eligible for screening were initially randomized to one of the three study arms. Across all study arms, approximately half were lost to follow-up. These patients were excluded from the primary analysis but were included in an additional intention-to-screen analysis. A total of 2,400 patients received a colonoscopy outreach mailing; 2,400 received FIT outreach, including a letter, the home FIT testing kit and instructions; 1,199 received usual care. Patients in both intervention arms also received up to two phone calls if they didn’t respond to the initial mailing within 2 weeks. Mailings and phone calls were conducted in English or Spanish, according to the patients’ stated language preferences (those whose spoke neither language were excluded from the study).
Of the patients in the colonoscopy outreach group, 922 (38.4%) completed the screening process, compared with 671 (28.0%) in the FIT outreach group and 128 (10.7%) in the usual care group.
Compared with the group receiving usual care, completion of the screening process was 27.7% higher in the colonoscopy outreach group and 17.3% higher in the FIT outreach group. Screening process completion was 10.4% higher for the colonoscopy outreach group, compared with the FIT outreach group (P less than .001 for all).
Dr. Singal, who is with the department of internal medicine at UT Southwestern Medical Center, Dallas, and his colleagues also performed several post-hoc secondary analyses. In one, they used a less-stringent definition of screening process completion in which biennial FIT testing was considered satisfactory. When this definition was applied, the colonoscopy outreach group had 0.5% lower screening process completion than the FIT outreach group. The chances of a patient receiving any screening during the study period was highest in the FIT group (65%), with 51.7% of those in the colonoscopy outreach group and 39% of those in the usual care group receiving any screening.
“FIT has lower barriers to one-time participation but requires annual screening and diagnostic evaluation of abnormal results,” wrote Dr. Singal and his colleagues.
Strengths of the study, said Dr. Singal and his colleagues, included the fact that the study took place at a “safety net” institution with a racially and socioeconomically diverse population. Also, the study design avoided volunteer bias, and offered a pragmatic head-to-head comparison of colonoscopy and FIT.
The second study took place in western France, and targeted outreach to physicians rather than patients (JAMA. 2017;318[9];816-84). When physicians were given a list of their own patients who were not up to date on CRC screening, investigators saw a small, but significant, uptick in patient participation in FIT screening.
One year after the reminders went out, FIT screening had been initiated in 24.8% of patients whose physicians had received the list, compared with 21.7% of patients of physicians who had received a more generic notice and 20.6% of patients whose physicians received no notification, according to first author Cedric Rat, MD, and his colleagues.
The study examined which notification approach was most effective in increasing FIT screening among the physicians’ patient panels: sending general practitioners (GPs) letters that included a list of their own patients who had not undergone CRC screening, or sending them generic letters describing CRC screening adherence rates specific to their region. A usual care group of practices received no notifications in this 3-group randomized cluster design.
Patients in the patient-specific reminders group had an odds ratio of 1.27 for participation in FIT screening (P less than .001) compared to the usual care group. The odds ratio for the generic reminders group was 1.09, a nonsignificant difference.
Between-group comparison showed statistical significance for both the 3.1% difference between the patient-specific and generic reminders groups, and for the 4.2% difference between the patient-specific and usual care groups (P less than .001 for both). There was no significant difference between the generic reminders group and the usual care group.
Dr. Rat, professor of medicine at the Faculty of Medicine, Nantes, France, and his colleagues enrolled GPs in a total of 801 practices that included patients aged 50participating GPs caring for 33,044 patients who met study criteria.
Physician characteristics that were associated with higher FIT participation included younger age and an initially smaller number of unscreened patients. Patients with low socioeconomic status and those with a higher chronic disease burden were less likely to participate in FIT screening.
Also, Dr. Rat and his colleagues noted that the busiest practices actually had higher CRC screening rates. The investigators hypothesized that a recent physician pay-for-performance grant for CRC completion might be more appealing for some busy physicians.
This was the largest study of CRC screening participation to date, according to Dr. Rat and his coauthors, and showed the small but detectable efficacy of an inexpensive intervention that, given complete patient records, is relatively easy to effect. Though the effect size was smaller than the 12% difference the investigators had anticipated seeing for the patient-specific reminders group, the study still showed that targeting physicians can be an effective public health intervention to increase CRC screening rates, said Dr. Rat and his colleagues.
None of the investigators in either study reported conflicts of interest.
FROM JAMA
Key clinical point: Both a physician-directed outreach effort and one that targeted patients increased CRC screening rates.
Major finding: The patient-directed effort increased CRC screening completion by 17%-28%, compared with usual care; a single physician-directed outreach intervention increased screening by 4.2% compared to usual care.
Study details: A single-center pragmatic study of 5,999 patients eligible for CRC screening, and a three-group randomized cluster study of 1,446 general practitioners caring for 33,044 patients eligible for CRC screening.
Disclosures: No study authors reported conflicts of interest.
Keeping Up-to-Date on Health Disparity Data
The DATA2020 HealthyPeople.gov data search function just got more user friendly. The Office of Disease Prevention and Health Promotion, National Center for Health Statistics, and Office of Minority Health, partners in DATA2020, have released a shareable widget that gives users easy access to regularly updated information.
The health disparities tool at DATA2020 lets users sort and view health disparities by demographic groups, including race/ethnicity, age, disability status, and geographic location. Users also can easily navigate and visualize data and changes in disparities over time; compare data points for each population group; and see all rates, rate ratios, confidence intervals and other technical details about data collection.
The new widget is an easy way (by simply copying the provided code) to share health disparities information on individual websites. Users can browse by disparity type or by Leading Health Indicator. The widget needs no maintenance; content updates automatically.
R&D costs for cancer drugs may be lower than previously thought

New research has provided an updated estimate of the spending needed to bring a cancer drug to the US market.
In analyzing data from 10 companies bringing a cancer drug to market, researchers found that sales revenue from these drugs was roughly 7 times higher than the research and development (R&D) costs.
The total sales revenue for the drugs—during a median follow-up of 4 years—was $67.0 billion, and the total R&D spending was $9.1 billion (including 7% opportunity costs).
Researchers reported these figures in JAMA Internal Medicine.
“[T]he price of cancer drugs is currently rising higher and higher each year,” said study author Vinay Prasad, MD, of Oregon Health and Science University in Portland.
“The cost of 1 drug for 1 year of treatment is now routinely in excess of $100,000 . . . . One of the often-cited reasons why cancer drugs cost so much—one of the justifications for the high price—is that the outlay by the biopharmaceutical industry to bring these drugs to market is sizable, and there have been a wide range of estimates for what that R&D outlay is.”
“The most-cited estimate is one that comes out of the Tufts Medical Group1 that puts the cost to bring a cancer drug to market, when adjusted for 2017 dollars, at $2.7 billion. Another estimate is from the group Public Citizen.2 And that is a much lower estimate, finding the cost to bring a drug to market of $320 million.”
“Both of these estimates have limitations in the methods for how they estimated the cost to bring a drug to market. Notably, the Tufts group is rather non-transparent. Because of confidentiality agreements, we don’t know what drugs and what companies they’re looking at, and we can’t independently verify their analysis.”
“The Public Citizen group, in contrast, is comparing expenditures over a period of time against the number of drugs in a different period of time to make an estimate of the cost to bring a drug to market, but this isn’t exactly the cost of bringing those particular drugs to market.”
These issues prompted Dr Prasad and Sham Mailankody, MBBS, of the Memorial Sloan Kettering Cancer Center in New York, to conduct the current study.
Analysis
The researchers analyzed US Securities and Exchange Commission filings for 10 drug companies that received approval from the US Food and Drug Administration for a cancer drug from 2006 through 2015.
Prior to this, none of the companies had any drugs approved for use in the US. However, the companies had a median of 3.5 (range, 2-11) drugs in development during the study period.
The researchers said the fact that these companies had no prior drug approvals eliminated biases that may be present when analyzing larger drug companies, such as redundancies in R&D development and tax incentives for listing different endeavors as R&D spending.
In addition, the fact that the 10 companies were developing other drugs during the study period means this study takes into account the cost of failure in bringing a drug to market.
Results
For the 10 companies and drugs analyzed, the median duration of drug development was 7.3 years (range, 5.8 to 15.2 years).
The median cost of drug development (in 2017 US dollars) was $648.0 million (range, $157.3 to $1950.8 million). For a 7% per annum cost of capital (or opportunity costs), the median cost was $757.4 million (range, $203.6 to $2601.7 million).
The median time from approval to analysis in December 2016 (or until the company sold or licensed the compound to another company) was 4.0 years (range, 0.8 years to 8.8 years).
The total revenue from sales of the 10 drugs during this time was $67.0 billion.
The total R&D spending was $7.2 billion, or $9.1 billion when including 7% opportunity costs.
The following table includes data broken down by drug.
| Drug and company | Approval date | Indication | Total R&D costs | Revenue since approval |
|---|---|---|---|---|
| Eculizumab (Soliris)
Alexion Pharmaceuticals |
2007 | Paroxysmal nocturnal hemoglobinuria | $817.6 million | $12,987.8 million |
| Pralatrexate (Folotyn)*
Allos Therapeutics |
2009 | Relapsed/refractory peripheral T-cell lymphoma | $178.2 million | $304.8 million |
| Brentuximab vedotin (Adcetris)*
Seattle Genetics |
2011 | Certain patients with Hodgkin lymphoma and systemic anaplastic large cell lymphoma | $899.2 million | $1034.3 million |
| Ruxolitinib (Jakafi)
Incyte Corporation |
2011 | Intermediate- and high-risk myelofibrosis | $1097.8 million | $2251.5 million |
| Enzalutamide (Xtandi)**
Medivation |
2012 | Metastatic castration-resistant prostate cancer | $473.3 million | $21,068.3 million |
| Vincristine liposome (Marqibo)*
Talon Therapeutics |
2012 | Ph- acute lymphoblastic leukemia | $157.3 million | $204.1 million |
| Cabozantinib (Cometriq)
Exelixis |
2012 | Metastatic medullary thyroid cancer | $1950.8 million | $341.9 million |
| Ponatinib (Iclusig)*
Ariad Pharmaceuticals |
2012 | Chronic myeloid leukemia and Ph+ acute lymphoblastic leukemia
|
$480.1 million | $5457.98 million |
| Ibrutinib (Imbruvica)*
Pharmacyclics |
2013 | Previously treated mantle cell lymphoma | $328.1 million | $22,275.0 million |
| Irinotecan liposome (Onivyde)
Merrimack Pharmaceuticals |
2015 | Advanced pancreatic cancer previously treated with gemcitabine-based chemotherapy | $815.8 million | $1065.2 million |
*Received accelerated approval. (The other 5 drugs received regular approval.)
**Did not receive orphan designation. (Nine of the 10 drugs received orphan designation.)
“So I think what we’re showing is . . . a transparent analysis of cancer drugs and companies, looking at the cost to bring a drug to market,” Dr Mailankody said. “And our estimate of $648 million is substantially lower than the often-cited number of $2.7 billion.”
“We’re also showing that, for these 10 drugs, revenue since approval is quite a bit higher than the R&D spending, almost 7-fold higher, and some of these companies have already had revenue of 10-fold or higher, compared to the R&D expenses.”
The researchers acknowledged that this study is limited by a small data set and the fact that the findings cannot be extrapolated to other types of drugs. ![]()
1. DiMasi JA et al. Innovation in the pharmaceutical industry: new estimates of R&D costs. J Health Econ. 2016;47:20-33.
2. Young B et al. Rx R&D Myths: The Case Against the Drug Industry’s R&D “Scare Card.” Washington, DC: Public Citizen’s Congress Watch; 2001. https://www.citizen.org/sites/default/files/rdmyths.pdf.