User login
Colchicine Effective for First Episode of Acute Pericarditis
Clinical question
Does the addition of colchicine improve outcomes in the treatment of an initial episode of acute pericarditis?
Bottom line
When used in addition to conventional anti-inflammatory therapy, colchicine decreases the rate of incessant or recurrent pericarditis. You would need to treat 4 patients with colchicine to prevent one such episode. (LOE = 1b)
Reference
Imazio M, Brucato A, Cemin R, et al, for the ICAP Investigators. A randomized trial of colchicine for acute pericarditis. N Engl J Med 2013;369(16):1522-1528.
Study design
Randomized controlled trial (double-blinded)
Funding source
Government
Concealed
Setting
Inpatient (any location) with outpatient follow-up
Synopsis
Colchicine has been previously shown effective in the prevention of recurrent pericarditis (Daily POEM 12-16-2011). In this study, patients with a first episode of acute pericarditis were randomized to receive either colchicine (0.5 mg - 1 mg daily for 3 months; n = 120) or matching placebo (n = 120). All patients also received conventional treatment for acute pericarditis, either aspirin 800 mg or ibuprofen 600 mg every 8 hours for 7 to 10 days, followed by a taper, or (for those with contraindications to aspirin or ibuprofen) glucorticoid therapy for 2 weeks, followed by a taper. Baseline characteristics in the 2 groups were similar: mean age was 52 years, 60% were male, and the most common cause of pericarditis was idiopathic. The majority of patients received aspirin rather than ibuprofen or glucocorticoids as concomitant therapy. Adherence to the study drug was higher than 95% and did not differ between the 2 groups. Patients were followed up for a mean of 22 months and none were lost to follow-up. Analysis was by intention to treat. The primary outcome of incessant or recurrent pericarditis was decreased in the colchicine group as compared with the placebo group (16.7% vs 37.5%; relative risk = 0.56; 95% CI, 0.30-0.72; P < .001). In addition, the colchicine group had significantly better outcomes with regard to the number of patients with persistent symptoms at 72 hours (19% vs 40%), rate of remission within 1 week (85% vs 58%), time to first recurrence (25 weeks vs 18 weeks), and rate of percarditis-related hospitalizations (5% vs 14%). There was no difference in either overall side effects or gastrointestinal side effects between the 2 groups.
Dr. Kulkarni is an assistant professor of hospital medicine at Northwestern University in Chicago.
The danger of measles
First the good news: According to a study commissioned by the Centers for Disease Control and Prevention and published in JAMA Pediatrics on Dec. 5, measles was officially eliminated in the United States in 2000, and that elimination persisted until 2011. This shows that the vaccine, first approved in 1963, has been effective at "eliminating" the disease, defined as the absence of endemic disease transmission.
This is no small feat. Measles is highly contagious, and prior to 1963, resulted in about 500 deaths per year in the United States, and tens of thousands of hospitalizations. Because it’s so highly contagious, vaccinating a large chunk of susceptible patients was the only way to effectively combat the disease. The "elimination" of the disease marks the success of vaccination strategies. Globally, there are now 500,000 fewer deaths per year from measles than there were a decade ago. If we continue with vaccination programs as we do, there is a chance we can eradicate the disease (JAMA Pediatrics 2013 [doi:10.1001/jamapediatrics.2013.4342]).
Now the bad news: This year, according to a statement that the CDC put out on Dec. 5, there have been 175 cases of measles. This is three times the annual median number of about 60. These cases have been concentrated in communities that are against vaccination, usually brought in from other places where antivaccination sentiments are also high, like Europe, or where vaccination strategies are lagging, like the developing world.
In a well-publicized outbreak in Texas in August, 21 unvaccinated people belonging to the Eagle Mountain International Church contracted the disease when an unvaccinated man travelled to Indonesia and came back ill. The pastor, Terri Copeland Pearsons, daughter of a televangelist Kenneth Copeland, clarifies that she is not against vaccinations but she has reservations about them. "The concerns we have had are primarily with very young children who have family history of autism and with bundling too many immunizations at one time."
Ms. Pearsons further says: "the facts are the facts, but then we know the truth. That always overcomes facts." When did fact become the enemy? How does faith trump science? Why do people treat science with such skepticism, and yet take anecdotes as gospel truth? How is it that despite the best efforts of infectious disease and pediatric societies to dispel such mistaken notions, these ideas survive?
In studies exploring the psychology of vaccine refusal, the factors that parents take into consideration include, but are not limited to, the perceptions of vulnerability of the children, severity of the disease, and safety of the vaccine.
People have forgotten just how severe measles can be. In addition, the unfounded belief that the vaccine can cause autism has just taken on a life of its own, given credibility by celebrities.
I understand that for some people anecdotes often tell a more powerful story than data does. So here’s one anecdote from the personal anecdote library of a doctor from a developing country.
I knew Albert through mutual friends. He played bass in a rock band, belonged to a fraternity in medical school, was involved in intramural basketball, and was in a loving relationship. By the time we graduated from medical school, he was the proud father of a baby girl.
But then things seemed to fall out of place. He failed the medical boards. He uncharacteristically sank into a deep depression that was so severe that he required inpatient treatment, and even then the treatments were not working. Still the assumption was that he had depression from his life’s circumstances.
And then he had a seizure.
That was when the diagnosis of subacute sclerosing panencephalitis, or SSPE, was made. It explained the personality change, intellectual difficulty, and seizures. He had contracted measles 10 years earlier, and this is a known complication of measles, one that hospitals in the Philippines are unfortunately all too familiar with. He died within a few weeks of diagnosis.
Society has forgotten how severe measles can be. We have an effective vaccine and effective global vaccination programs. We therefore have a chance to eradicate this disease altogether, like we did with smallpox and like we’re trying to do with polio. One parent’s strongly held but erroneous beliefs can cause trouble for large segments of the population. Ignoring the antivaccination rhetoric won’t make it go away.
Dr. Chan practices rheumatology in Pawtucket, R.I.
Psychiatric medications and lactation: Informing clinical decisions
Over the last 2 decades, abundant data on the reproductive safety of medications used to treat psychiatric disorders have become available, filling in many gaps with respect to our knowledge about the safety of commonly used psychiatric medications during pregnancy. But the availability of such safety data with respect to the use of these agents during breastfeeding is less complete.
Because of fears of potential adverse effects on infants associated with psychotropic drug use during lactation, many women with a psychiatric disorder who are treated with a range of psychiatric medications are advised not to breastfeed; or if they choose to breastfeed, they are counseled to avoid taking the essential medication that has made them well. This has been a somewhat intuitive, cautious approach. However, in my 25 years of clinical experience taking care of pregnant and postpartum women with a range of psychiatric disorders, one sad scenario I have frequently witnessed is the woman who decides to defer pharmacologic treatment for severe postpartum psychiatric illness after being counseled to defer treatment given a wish to breastfeed. Those women often have been psychiatrically ill for months while breastfeeding after having decided to defer their own treatment because they do not want to expose the baby to even scant amounts of medication secreted into breast milk associated with use of a needed medicine during lactation.
In a recently published clinical report from the American Academy of Pediatrics committee on drugs, authors suggest that advice not to breastfeed or to uniformly avoid medications while nursing because of possible adverse effects in the infant is often not evidence based and may not be necessary in many cases. The committee states that most drugs do not pose a risk to the mother or infant who is nursing, and that "the benefits of breastfeeding outweigh the risks of exposure to most therapeutic agents via human breast milk" (Pediatrics 2013;132:e796-e809).
The report points out that for certain drugs, a careful risk-benefit analysis is needed, especially for drugs that are concentrated in human milk, those with unproven benefits, and those with long half-lives. Importantly, the report notes say that decisions about the use of medications during lactation have to be made on a case-by-case basis. A concrete example would be exercising appropriate vigilance about the use of these medicines in premature infants with immature metabolism.
The report, published on-line in Pediatrics in August 2013, includes a section on antidepressants, anxiolytics, and antipsychotics. As a resource for clinicians, the report highlights LactMed, part of the National Library of Medicine’s toxicology data network (TOXNET), which provides real-time updated scientific information on the excretion of drugs into breast milk.
The report makes the important distinction regarding the range of clinical decisions that get made in the context of different clinical situations. For example, at our center, patients frequently present with questions about whether to use psychiatric medications while breastfeeding when these women have already been taking the medication during pregnancy for treatment of underlying psychiatric disorder. Others make queries about introduction of pharmacologic therapy in the early postpartum period in the context, for example, of new-onset postpartum depression. Specifically, a woman with a history of psychiatric disorder who is treated with antidepressant during pregnancy may continue that medication across the postpartum period to attenuate risk for postpartum depression, particularly if she has a history of recurrent disease, or depressive relapse when medication has been discontinued. That is clinical scenario differs from that of a woman who develops new onset of depression during the postpartum period.
One part of the AAP report addresses use of certain psychiatric medications in the context of available information from the literature regarding extent of excretion of these medications into breast milk. This section states that many antianxiety drugs, antidepressants, and mood stabilizers are excreted in low concentrations into human milk, with the estimated infant doses under 2% of the weight-adjusted maternal dose. However, the authors also cite small series or case reports where infant plasma levels of some drugs were reported to exceed 10% of maternal plasma concentrations. They list 13 such drugs, which include selective serotonin reuptake inhibitors (SSRIs), antipsychotics, anxiolytics, and mood stabilizers. It is important to keep in mind that the number of these cases is small and represent a very small proportion of cases, when the total denominator of reports in the literature of psychotropic drug use during lactation is considered. For example, olanzapine, a second generation antipsychotic is highlighted as an agent of concern based on one case report (J. Psychopharmacol. 2010;24:121-3).
The take-home message for the clinician is that all psychotropics are excreted into breast milk, even if quantification of the agents in breast milk or infant plasma reveals relatively scant concentration (J. Clin. Psychiatry 2003;64:73-80). If mom takes the medicine coincident with lactation, baby is exposed. At our center, we are usually reluctant to discontinue a medication such as an atypical antipsychotic to treat bipolar disorder in the postpartum period even if the mom chooses to breastfeed considering the extent to which women with bipolar disorder are at a high risk for relapse during the puerperium.
Ironically, we probably have more information regarding the excretion of antidepressants and drugs such as lamotrigine, used as a mood stabilizer, into breast milk than most medicines women take during the postpartum period, with data over the past 15 years suggesting that these medications, like other medications, are excreted into breast milk and are present in infant plasma in extremely sparse concentrations. It is noteworthy that cases of frank newborn toxicity directly associated with mothers who breastfeed on psychiatric medications are extremely few and far between, and are anecdotal at best. For some context, the literature on the effects of SSRI use during pregnancy is vast and prevalence of use of these medications during pregnancy and the postpartum period is substantial; that being said, reports of adverse effects reported in the babies of women who breastfeed while taking an SSRI are scant and thus at least somewhat reassuring.
And yet, consistently, I have witnessed that psychiatric medications are highlighted in the literature as particular agents of concern when it comes to lactation, compared with other medicines, for which only sparse data are available. Whether this reflects a bias about the necessity of treating psychiatric disorders during the postpartum period is unknown. Certainly, the long-term implications for the infant of exposure to low concentrations of psychiatric and nonpsychiatric medications in the context of breastfeeding exposure have yet to be clarified.
Whether a woman treated with a psychiatric medication during the post partum should breastfeed is a prime example of a clinical scenario in which there is no perfect decision, and we need to make the best decision possible, taking into account the available data, and the mother’s psychiatric disorder and her wishes. Some women may be extremely committed to breastfeeding and may choose to breastfeed, acknowledging some of the unknowns regarding these medications during lactation, while other women consider some of the ambiguity associated with the long-term effects of exposure while lactating and may choose not to breastfeed.
It is noteworthy that the AAP committee on drugs concluded the benefits of breastfeeding outweigh the risk of exposure to most therapeutic agents via human milk. And those at our center would certainly suggest that this is the case for psychiatric medications, particularly those used to sustain postpartum maternal psychiatric well-being, which is so critical. As is the case with any clinical decision, and certainly with respect to the use of psychiatric medications during pregnancy and lactation, the decision to treat is contingent on a careful risk-benefit analysis, where the risks of exposure to a medicine is weighed against the risk of untreated psychiatric illness. Even with the well-documented benefits of breastfeeding, nothing should trump the treatment of postpartum psychiatric illness, even if the cost is deferring breastfeeding. Treatment cannot be deferred because of the impact of untreated maternal psychiatric illness on maternal morbidity and on the development of children.
Dr. Cohen is the director of the Center for Women’s Mental Health at Massachusetts General Hospital in Boston, which provides information about reproductive mental health at www.womensmentalhealth.org. To comment, e-mail him at obnews@frontlinemedcom.com. Dr. Cohen has been a consultant to manufacturers of antidepressants and antipsychotic medications.

Measuring the MEWS and the Rothman Index
Bedside calculation of early warning system (EWS) scores is standard practice in many hospitals to predict clinical deterioration. These systems were designed for periodic hand‐scoring, typically using a half‐dozen variables dominated by vital signs. Most derive from the Modified Early Warning Score (MEWS).[1, 2] Despite years of modification, EWSs have had only modest impact on outcomes.[3, 4] Major improvement is possible only by adding more information than is contained in vital signs. Thus, the next generation of EWSs must analyze electronic medical records (EMRs). Analysis would be performed by computer, displayed automatically, and updated whenever new data are entered into the EMR. Such systems could deliver timely, accurate, longitudinally trended acuity information that could aid in earlier detection of declining patient condition as well as improving sensitivity and specificity of EWS alarms.
Advancing this endeavor along with others,[5, 6] we previously published a patient acuity metric, the Rothman Index (RI), which automatically updates when asynchronous vital signs, laboratory test results, Braden Scale,[7] cardiac rhythm, and nursing assessments are entered into the EMR.[8] Our goal was to enable clinicians to visualize changes in acuity by simple line graphs personalized to each patient at any point in time across the trajectory of care. In our model validation studies,[8] we made no attempt to identify generalizable thresholds, though others[9] have defined decision cut points for RI in a nonemergent context. To examine decision support feasibility in an emergent context, and to compare RI with a general EWS standard, we compare the accuracy of the RI with the MEWS in predicting hospital death within 24 hours.
METHODS
Site Description and Ethics
The institutional review board of Abington Memorial Hospital (Abington, PA) approved collection of retrospective data obtained from their 665‐bed, regional referral center and teaching hospital. Handling of patient information complied with the Health Insurance Portability and Accountability Act of 1996 regulations.
Patient Inclusion
The analysis included all patients, aged 18 years or older, admitted from July 2009 through June 2010, when there were sufficient data in the EMR to compute the RI. Obstetric and psychiatric patients were excluded because nursing documentation is insufficient in this dataset.
Data Collection/Data Sources
Clinical variables were extracted from the EMR (AllScripts Sunrise Clinical Manager, Chicago, IL) by SQL query and placed into a database. RI[8] and MEWS[1] were computed according to published methods. Table 1 shows definitions of standards for each nursing assessment,[8] and Table 2 identifies all clinical variables employed for each system. Briefly, RI utilizes 26 variables related to clinical care and routinely available in the EMR. These include vital signs, laboratory results, cardiac rhythms, and nursing assessments. Excess risk associated with any value of a variable is defined as percent absolute increase in 1‐year mortality relative to minimum 1‐year mortality identified for that variable. Excess risk is summed on a linear scale to reflect cumulative risk for individual patients at any given time. RI was computed at every new observation during a patient visit, when input values were available. Laboratory results are included when measured, but after 24 hours their weighting is reduced by 50%, and after 48 hours they are excluded. Data input intervals were a function of institutional patient care protocols and physician orders. All observations during a patient's stay were included in the analysis, per the method of Prytherch et al.[4] Because data did not contain the simplified alert/voice/pain/unresponsive (A/V/P/U) score, computation of MEWS used appropriate mapping of the Glasgow Coma Scale.[10] A corresponding MEWS was calculated for each RI. The relationship between RI and MEWS is inverse. RI ranges from 91 to 100, with lower scores indicating increasing acuity. MEWS ranges from 0 to 14, with higher scores indicating increasing acuity.
| |
| Cardiac | Pulse regular, rate 60100 bpm, skin warm and dry. Blood pressure <140/90 and no symptoms of hypotension. |
| Food/nutrition | No difficulty with chewing, swallowing, or manual dexterity. Patient consuming >50% of daily diet ordered as observed or stated. |
| Gastrointestinal | Abdomen soft and nontender. Bowel sounds present. No nausea or vomiting. Continent. Bowel pattern normal as observed or stated. |
| Genitourinary | Voids without difficulty. Continent. Urine clear, yellow to amber as observed or stated. Urinary catheter patent if present. |
| Musculoskeletal | Independently able to move all extremities and perform functional activities as observed or stated (includes assistive devices). |
| Neurological | Alert and oriented to person, place, time, situation. Speech is coherent. |
| Peripheral‐vascular | Extremities are normal or pink and warm. Peripheral pulses palpable. Capillary refill <3 seconds. No edema, numbness or tingling. |
| Psychosocial | Behavior appropriate to situation. Expressed concerns and fears being addressed. Adequate support system. |
| Respiratory | Respiration 1224/minute at rest, quiet and regular. Bilateral breath sounds clear. Nail beds and mucous membranes pink. Sputum clear, if present. |
| Safety/fall risk | Safety/fall risk factors not present. Not a risk to self or others. |
| Skin/tissue | Skin clean, dry, and intact with no reddened areas. Patient is alert, cooperative and able to reposition self independently. Braden Scale >15. |
| Input Variable | A: Alive in 24 Hours, Mean (SD) | B: Dead Within 24 Hours, Mean (SD) | P Value |
|---|---|---|---|
| |||
| Diastolic blood pressure, mm Hg | 66.8 (13.5) | 56.6 (16.8) | <0.0001 |
| Systolic blood pressure, mm Hga | 127.3 (23.8) | 105.2 (29.4) | <0.0001 |
| Temperature, Fa | 98.2 (1.1) | 98.2 (2.0) | 0.1165 |
| Respiration, breaths per minutea | 20.1 (4.7) | 23.6 (9.1) | <0.0001 |
| Heart rate, bpma | 81.1 (16.5) | 96.9 (22.2) | <0.0001 |
| Pulse oximetry, % O2 saturation | 96.3 (3.3) | 93.8 (10.1) | <0.0001 |
| Creatinine, mg/dL | 1.2 (1.2) | 1.8 (1.5) | <0.0001 |
| Blood urea nitrogen, mg/dL | 23.9 (17.9) | 42.1 (26.4) | <0.0001 |
| Serum chloride, mmol/L | 104.3 (5.4) | 106.9 (9.7) | <0.0001 |
| Serum potassium, mmol/L | 4.2 (0.5) | 4.4 (0.8) | <0.0001 |
| Serum sodium, mmol/L | 139.0 (4.1) | 140.7 (8.5) | <0.0001 |
| Hemoglobin, gm/dL | 11.2 (2.1) | 10.6 (2.1) | <0.0001 |
| White blood cell count, 103 cell/L | 9.9 (6.3) | 15.0 (10.9) | <0.0001 |
| Braden Scale, total points | 17.7 (3.4) | 12.2 (3.1) | <0.0001 |
| NURSING ASSESSMENTS | A: Alive in 24 Hours and Failed Standard | B: Dead Within 24 Hours and Failed Standard | P Value |
| Neurological | 38.7% | 91.4% | <0.0001 |
| Genitourinary | 46.6% | 90.0% | <0.0001 |
| Respiratory | 55.6% | 89.0% | <0.0001 |
| Peripheral vascular | 54.1% | 86.9% | <0.0001 |
| Food | 28.3% | 80.6% | <0.0001 |
| Skin | 56.3% | 75.0% | <0.0001 |
| Gastrointestinal | 49.3% | 75.0% | <0.0001 |
| Musculoskeletal | 50.3% | 72.4% | <0.0001 |
| Cardiac | 30.4% | 59.8% | <0.0001 |
| Psychosocial | 24.6% | 40.9% | <0.0001 |
| Safety | 25.5% | 29.0% | <0.0001 |
| A/V/P/U scorea | 96.3/2.1/1.4/0.2% | 88.6/21.6/4.6/5.3% | <0.0001 |
| Sinus rhythm (absent)b | 34.9% | 53.3% | <0.0001 |
Outcome Ascertainment
In‐hospital death was determined by merging the date and time of discharge with clinical inputs from the hospital's EMR. Data points were judged to be within 24 hours of death if the timestamp of the data point collection was within 24 hours of the discharge time with expired as the discharge disposition.
Statistical Methods
Demographics and input variables from the 2 groups of observations, those who were within 24 hours of death and those who were not, were compared using a t test with a Cochran and Cox[11] approximation of the probability level of the approximate t statistic for unequal variances. Mean, standard deviation, and P values are reported. Discrimination of RI and MEWS to predict 24‐hour mortality was estimated using area under the receiver operating characteristic (ROC) curve (AUC), and null hypothesis was tested using 2. Sensitivity, specificity, positive predictive value (PPV), negative predictive value (NPV), positive and negative likelihood ratios (LR+, LR) were computed. Analyses were performed with SAS 9.3 (procedures ttest, freq, logistic, nlmixed; SAS Institute, Cary, NC). Typically MEWS=4 triggers a protocol to increase level of assessment and/or care, often a transfer to the intensive care unit (ICU). We denoted the point on ROC curve where MEWS=4 and identified an RI point of similar LR and sensitivity to compare false alarm rate. Then we identified an RI point of similar LR+ for comparison of LR and sensitivity.
RESULTS
A total of 1,794,910 observations during 32,472 patient visits were included; 617 patients died (1.9%). Physiological characteristics for all input variables used by RI or MEWS are shown in Table 2, comparing observations taken within 24 hours of death to all other observations.
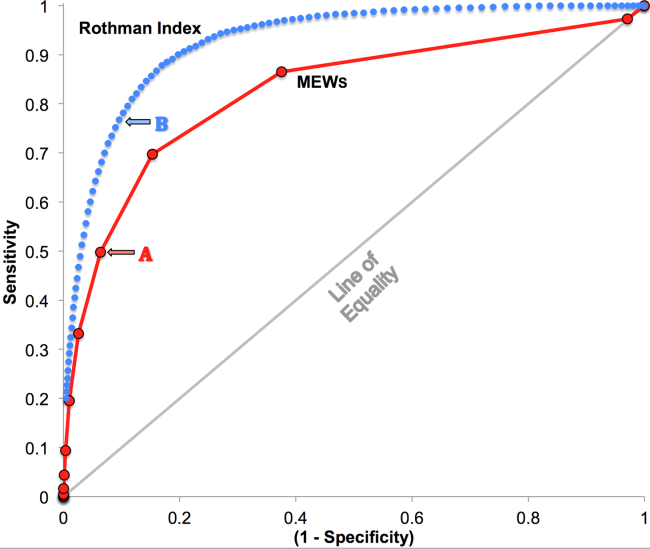
RI versus MEWS demonstrated superior discrimination of 24‐hour mortality (AUC was 0.93 [95% confidence interval {CI}: 0.92‐0.93] vs 0.82 [95% CI: 0.82‐0.83]; difference, 0.11 [95% CI: 0.10‐0.11]; P<0.0001). ROC curves for RI and MEWS are shown in Figure 1; the MEWS is subsumed by RI across the entire range. Further, paired comparisons at points of clinical importance are presented in Table 3 for LR+, LR, sensitivity, specificity, PPV, and NPV. In the first pair of columns, MEWS=4 (typical trigger point for alarms) is matched to RI using sensitivity or LR; the corresponding point is RI=16, which generates twice the LR+ and reduces false alarms by 53%. In the second pair of columns, MEWS=4 is matched to RI using PPV or LR+; the corresponding point is RI=30, which captures 54% more of those patients who will die within 24 hours.
| Cut Points | MEWS=4 | RI=16a | MEWS=4 | RI=30b |
|---|---|---|---|---|
| ||||
| Likelihood ratio, positive | 7.8 | 16.9 | 7.8c | 7.9c |
| Likelihood ratio, negative | 0.54c | 0.53c | 0.54 | 0.26 |
| Sensitivity | 49.8% | 48.9% | 49.8% | 76.8% |
| Specificity | 93.6% | 97.1% | 93.6% | 90.4% |
| Positive predictive value | 5.2% | 10.6% | 5.2% | 5.3% |
| Negative predictive value | 99.6% | 99.6% | 99.6% | 99.8% |
DISCUSSION
We have shown that a general acuity metric (RI) computed using data routinely entered into an EMR outperforms MEWS in identifying hospitalized patients likely to die within 24 hours. At similar sensitivity, RI yields an LR+ more than 2‐fold greater, at a value often considered conclusive. MEWS is derived using 4 vital signs and a neurologic assessment. Such a focus on vital signs may limit responsiveness to changes in acuity, especially during early clinical deterioration. Indeed, threshold breach tools may inadvertently induce a false sense of an individual patient's condition and safety.[12] The present findings suggest the performance of RI over MEWS may be due to inclusion of nursing assessments, laboratory test results, and heart rhythm. Relative contributions of each category are: vital signs (35%), nursing assessments (34%), and laboratory test results (31%). We found in previous work that failed nursing assessments strongly correlate with mortality,[13] as illustrated in Table 2 by sharp differences between patients dying within 24 hours and those who did not.
Sensitivity to detect early deterioration, especially when not evidenced by compromised vital signs, is crucial for acuity vigilance and preemptive interventions. Others[14] have demonstrated that our approach to longitudinal modeling of the acuity continuum is well positioned to investigate clinical pathophysiology preceding adverse events and to identify actionable trends in patients at high risk of complications and sepsis after colorectal operations. Future research may reveal both clinical and administrative advantages to having this real‐time acuity measure available for all patients during the entire hospital visit, with efficacy in applications beyond use as a trigger for EWS alarms.
Study limitations include retrospective design, single‐center cohort, no exclusion of expected hospital deaths, and EMR requirement. For MEWS, the Glasgow Coma Scale was mapped to A/V/P/U, which does not appear to affect results, as our c‐statistic is identical to the literature.[4] Any hospital with an EMR collects the data necessary for computation of RI values. The RI algorithms are available in software compatible with systems from numerous EMR manufacturers (eg, Epic, Cerner, McKesson, Siemens, AllScripts, Phillips).
The advent of the EMR in hospitals marries well with an EWS that leverages from additional data more information than is contained in vital signs, permitting complex numeric computations of acuity scores, a process simply not possible with paper systems. Further, the automatic recalculation of the score reduces the burden on clinicians, and broadens potential use over a wide range, from minute‐by‐minute recalculations when attached to sensors in the ICU, to comparative metrics of hospital performance, to nonclinical financial resource applications. This new information technology is guiding methods to achieve a significant performance increment over current EWS and may assist earlier detection of deterioration, providing a chance to avoid medical crises.[15]
Acknowledgements
The authors express their appreciation to Abington Memorial Hospital. Particular thanks are extended to Steven I. Rothman, MSEM, for extensive discussions and technical support. The authors thank Alan Solinger, PhD, for his assistance in reviewing the manuscript.
Disclosures: One author (RAS) declares no conflict of interest. Two authors (GDF, MJR) are employees and shareholders in PeraHealth, Inc. of Charlotte, North Carolina, a health information technology company that offers products utilizing the Rothman Index. All of the original research defining the Rothman Index was performed prior to the formation of the company and is now published in peer‐reviewed journals. The index is freely available to all qualified researchers and is currently installed at several major medical research centers and hospital systems. This present work is under the auspices and partly funded by an independent foundation, F.A.R. Institute of Sarasota, Florida. Early research defining the Rothman Index was funded by grants from Sarasota Memorial Healthcare Foundation and the Goldsmith Fund of Greenfield Foundation. Continuing research has been funded by the F.A.R. Institute.
- , , , . Validation of a modified Early Warning Score in medical admissions. QJM Mon J Assoc Physicians. 2001;94:521–526.
- , , . Monitoring vital signs using early warning scoring systems: a review of the literature. J Nurs Manag. 2011;19:311–330.
- , , , et al. A clinical deterioration prediction tool for internal medicine patients. Am J Med Qual. 2013;28:135–142.
- , , , . ViEWS—towards a national early warning score for detecting adult inpatient deterioration. Resuscitation. 2010;81:932–937.
- , , , , , . Early detection of impending physiologic deterioration among patients who are not in intensive care: development of predictive models using data from an automated electronic medical record. J Hosp Med. 2012;7:388–395.
- , , , et al. Predicting out of intensive care unit cardiopulmonary arrest or death using electronic medical record data. BMC Med Inform Decis Mak. 2013;13:28.
- , , , The Braden Scale for predicting pressure sore risk. Nurs Res. 1987;36:205–210.
- , , . Development and validation of a continuous measure of patient condition using the electronic medical record. J Biomed Inform. 2013;46:837–848.
- , , , , . Identifying patients at increased risk for unplanned readmission. Med Care. 2013;51:761–766.
- , , . Comparison of consciousness level assessment in the poisoned patient using the alert/verbal/painful/unresponsive scale and the Glasgow Coma Scale. Ann Emerg Med. 2004;44:108–113.
- , . Experimental Design. New York, NY: John Wiley 1950.
- , . Patterns of unexpected in‐hospital deaths: a root cause analysis. Patient Saf Surg. 2011;5:3.
- , , , . Clinical implications and validity of nursing assessments: a longitudinal measure of patient condition from analysis of the Electronic Medical Record. BMJ Open. 2012;2(4):pii: e000646.
- , , , . Automated analysis of electronic medical record data reflects the pathophysiology of operative complications. Surgery. 2013;154:918–926.
- , , Not getting better means getting worse—trends in Early Warning Scores suggest that there might only be a short time span to rescue those threatening to fall off a “physiological” cliff? Resuscitation. 2013;84:409–410.
Bedside calculation of early warning system (EWS) scores is standard practice in many hospitals to predict clinical deterioration. These systems were designed for periodic hand‐scoring, typically using a half‐dozen variables dominated by vital signs. Most derive from the Modified Early Warning Score (MEWS).[1, 2] Despite years of modification, EWSs have had only modest impact on outcomes.[3, 4] Major improvement is possible only by adding more information than is contained in vital signs. Thus, the next generation of EWSs must analyze electronic medical records (EMRs). Analysis would be performed by computer, displayed automatically, and updated whenever new data are entered into the EMR. Such systems could deliver timely, accurate, longitudinally trended acuity information that could aid in earlier detection of declining patient condition as well as improving sensitivity and specificity of EWS alarms.
Advancing this endeavor along with others,[5, 6] we previously published a patient acuity metric, the Rothman Index (RI), which automatically updates when asynchronous vital signs, laboratory test results, Braden Scale,[7] cardiac rhythm, and nursing assessments are entered into the EMR.[8] Our goal was to enable clinicians to visualize changes in acuity by simple line graphs personalized to each patient at any point in time across the trajectory of care. In our model validation studies,[8] we made no attempt to identify generalizable thresholds, though others[9] have defined decision cut points for RI in a nonemergent context. To examine decision support feasibility in an emergent context, and to compare RI with a general EWS standard, we compare the accuracy of the RI with the MEWS in predicting hospital death within 24 hours.
METHODS
Site Description and Ethics
The institutional review board of Abington Memorial Hospital (Abington, PA) approved collection of retrospective data obtained from their 665‐bed, regional referral center and teaching hospital. Handling of patient information complied with the Health Insurance Portability and Accountability Act of 1996 regulations.
Patient Inclusion
The analysis included all patients, aged 18 years or older, admitted from July 2009 through June 2010, when there were sufficient data in the EMR to compute the RI. Obstetric and psychiatric patients were excluded because nursing documentation is insufficient in this dataset.
Data Collection/Data Sources
Clinical variables were extracted from the EMR (AllScripts Sunrise Clinical Manager, Chicago, IL) by SQL query and placed into a database. RI[8] and MEWS[1] were computed according to published methods. Table 1 shows definitions of standards for each nursing assessment,[8] and Table 2 identifies all clinical variables employed for each system. Briefly, RI utilizes 26 variables related to clinical care and routinely available in the EMR. These include vital signs, laboratory results, cardiac rhythms, and nursing assessments. Excess risk associated with any value of a variable is defined as percent absolute increase in 1‐year mortality relative to minimum 1‐year mortality identified for that variable. Excess risk is summed on a linear scale to reflect cumulative risk for individual patients at any given time. RI was computed at every new observation during a patient visit, when input values were available. Laboratory results are included when measured, but after 24 hours their weighting is reduced by 50%, and after 48 hours they are excluded. Data input intervals were a function of institutional patient care protocols and physician orders. All observations during a patient's stay were included in the analysis, per the method of Prytherch et al.[4] Because data did not contain the simplified alert/voice/pain/unresponsive (A/V/P/U) score, computation of MEWS used appropriate mapping of the Glasgow Coma Scale.[10] A corresponding MEWS was calculated for each RI. The relationship between RI and MEWS is inverse. RI ranges from 91 to 100, with lower scores indicating increasing acuity. MEWS ranges from 0 to 14, with higher scores indicating increasing acuity.
| |
| Cardiac | Pulse regular, rate 60100 bpm, skin warm and dry. Blood pressure <140/90 and no symptoms of hypotension. |
| Food/nutrition | No difficulty with chewing, swallowing, or manual dexterity. Patient consuming >50% of daily diet ordered as observed or stated. |
| Gastrointestinal | Abdomen soft and nontender. Bowel sounds present. No nausea or vomiting. Continent. Bowel pattern normal as observed or stated. |
| Genitourinary | Voids without difficulty. Continent. Urine clear, yellow to amber as observed or stated. Urinary catheter patent if present. |
| Musculoskeletal | Independently able to move all extremities and perform functional activities as observed or stated (includes assistive devices). |
| Neurological | Alert and oriented to person, place, time, situation. Speech is coherent. |
| Peripheral‐vascular | Extremities are normal or pink and warm. Peripheral pulses palpable. Capillary refill <3 seconds. No edema, numbness or tingling. |
| Psychosocial | Behavior appropriate to situation. Expressed concerns and fears being addressed. Adequate support system. |
| Respiratory | Respiration 1224/minute at rest, quiet and regular. Bilateral breath sounds clear. Nail beds and mucous membranes pink. Sputum clear, if present. |
| Safety/fall risk | Safety/fall risk factors not present. Not a risk to self or others. |
| Skin/tissue | Skin clean, dry, and intact with no reddened areas. Patient is alert, cooperative and able to reposition self independently. Braden Scale >15. |
| Input Variable | A: Alive in 24 Hours, Mean (SD) | B: Dead Within 24 Hours, Mean (SD) | P Value |
|---|---|---|---|
| |||
| Diastolic blood pressure, mm Hg | 66.8 (13.5) | 56.6 (16.8) | <0.0001 |
| Systolic blood pressure, mm Hga | 127.3 (23.8) | 105.2 (29.4) | <0.0001 |
| Temperature, Fa | 98.2 (1.1) | 98.2 (2.0) | 0.1165 |
| Respiration, breaths per minutea | 20.1 (4.7) | 23.6 (9.1) | <0.0001 |
| Heart rate, bpma | 81.1 (16.5) | 96.9 (22.2) | <0.0001 |
| Pulse oximetry, % O2 saturation | 96.3 (3.3) | 93.8 (10.1) | <0.0001 |
| Creatinine, mg/dL | 1.2 (1.2) | 1.8 (1.5) | <0.0001 |
| Blood urea nitrogen, mg/dL | 23.9 (17.9) | 42.1 (26.4) | <0.0001 |
| Serum chloride, mmol/L | 104.3 (5.4) | 106.9 (9.7) | <0.0001 |
| Serum potassium, mmol/L | 4.2 (0.5) | 4.4 (0.8) | <0.0001 |
| Serum sodium, mmol/L | 139.0 (4.1) | 140.7 (8.5) | <0.0001 |
| Hemoglobin, gm/dL | 11.2 (2.1) | 10.6 (2.1) | <0.0001 |
| White blood cell count, 103 cell/L | 9.9 (6.3) | 15.0 (10.9) | <0.0001 |
| Braden Scale, total points | 17.7 (3.4) | 12.2 (3.1) | <0.0001 |
| NURSING ASSESSMENTS | A: Alive in 24 Hours and Failed Standard | B: Dead Within 24 Hours and Failed Standard | P Value |
| Neurological | 38.7% | 91.4% | <0.0001 |
| Genitourinary | 46.6% | 90.0% | <0.0001 |
| Respiratory | 55.6% | 89.0% | <0.0001 |
| Peripheral vascular | 54.1% | 86.9% | <0.0001 |
| Food | 28.3% | 80.6% | <0.0001 |
| Skin | 56.3% | 75.0% | <0.0001 |
| Gastrointestinal | 49.3% | 75.0% | <0.0001 |
| Musculoskeletal | 50.3% | 72.4% | <0.0001 |
| Cardiac | 30.4% | 59.8% | <0.0001 |
| Psychosocial | 24.6% | 40.9% | <0.0001 |
| Safety | 25.5% | 29.0% | <0.0001 |
| A/V/P/U scorea | 96.3/2.1/1.4/0.2% | 88.6/21.6/4.6/5.3% | <0.0001 |
| Sinus rhythm (absent)b | 34.9% | 53.3% | <0.0001 |
Outcome Ascertainment
In‐hospital death was determined by merging the date and time of discharge with clinical inputs from the hospital's EMR. Data points were judged to be within 24 hours of death if the timestamp of the data point collection was within 24 hours of the discharge time with expired as the discharge disposition.
Statistical Methods
Demographics and input variables from the 2 groups of observations, those who were within 24 hours of death and those who were not, were compared using a t test with a Cochran and Cox[11] approximation of the probability level of the approximate t statistic for unequal variances. Mean, standard deviation, and P values are reported. Discrimination of RI and MEWS to predict 24‐hour mortality was estimated using area under the receiver operating characteristic (ROC) curve (AUC), and null hypothesis was tested using 2. Sensitivity, specificity, positive predictive value (PPV), negative predictive value (NPV), positive and negative likelihood ratios (LR+, LR) were computed. Analyses were performed with SAS 9.3 (procedures ttest, freq, logistic, nlmixed; SAS Institute, Cary, NC). Typically MEWS=4 triggers a protocol to increase level of assessment and/or care, often a transfer to the intensive care unit (ICU). We denoted the point on ROC curve where MEWS=4 and identified an RI point of similar LR and sensitivity to compare false alarm rate. Then we identified an RI point of similar LR+ for comparison of LR and sensitivity.
RESULTS
A total of 1,794,910 observations during 32,472 patient visits were included; 617 patients died (1.9%). Physiological characteristics for all input variables used by RI or MEWS are shown in Table 2, comparing observations taken within 24 hours of death to all other observations.
RI versus MEWS demonstrated superior discrimination of 24‐hour mortality (AUC was 0.93 [95% confidence interval {CI}: 0.92‐0.93] vs 0.82 [95% CI: 0.82‐0.83]; difference, 0.11 [95% CI: 0.10‐0.11]; P<0.0001). ROC curves for RI and MEWS are shown in Figure 1; the MEWS is subsumed by RI across the entire range. Further, paired comparisons at points of clinical importance are presented in Table 3 for LR+, LR, sensitivity, specificity, PPV, and NPV. In the first pair of columns, MEWS=4 (typical trigger point for alarms) is matched to RI using sensitivity or LR; the corresponding point is RI=16, which generates twice the LR+ and reduces false alarms by 53%. In the second pair of columns, MEWS=4 is matched to RI using PPV or LR+; the corresponding point is RI=30, which captures 54% more of those patients who will die within 24 hours.
| Cut Points | MEWS=4 | RI=16a | MEWS=4 | RI=30b |
|---|---|---|---|---|
| ||||
| Likelihood ratio, positive | 7.8 | 16.9 | 7.8c | 7.9c |
| Likelihood ratio, negative | 0.54c | 0.53c | 0.54 | 0.26 |
| Sensitivity | 49.8% | 48.9% | 49.8% | 76.8% |
| Specificity | 93.6% | 97.1% | 93.6% | 90.4% |
| Positive predictive value | 5.2% | 10.6% | 5.2% | 5.3% |
| Negative predictive value | 99.6% | 99.6% | 99.6% | 99.8% |
DISCUSSION
We have shown that a general acuity metric (RI) computed using data routinely entered into an EMR outperforms MEWS in identifying hospitalized patients likely to die within 24 hours. At similar sensitivity, RI yields an LR+ more than 2‐fold greater, at a value often considered conclusive. MEWS is derived using 4 vital signs and a neurologic assessment. Such a focus on vital signs may limit responsiveness to changes in acuity, especially during early clinical deterioration. Indeed, threshold breach tools may inadvertently induce a false sense of an individual patient's condition and safety.[12] The present findings suggest the performance of RI over MEWS may be due to inclusion of nursing assessments, laboratory test results, and heart rhythm. Relative contributions of each category are: vital signs (35%), nursing assessments (34%), and laboratory test results (31%). We found in previous work that failed nursing assessments strongly correlate with mortality,[13] as illustrated in Table 2 by sharp differences between patients dying within 24 hours and those who did not.
Sensitivity to detect early deterioration, especially when not evidenced by compromised vital signs, is crucial for acuity vigilance and preemptive interventions. Others[14] have demonstrated that our approach to longitudinal modeling of the acuity continuum is well positioned to investigate clinical pathophysiology preceding adverse events and to identify actionable trends in patients at high risk of complications and sepsis after colorectal operations. Future research may reveal both clinical and administrative advantages to having this real‐time acuity measure available for all patients during the entire hospital visit, with efficacy in applications beyond use as a trigger for EWS alarms.
Study limitations include retrospective design, single‐center cohort, no exclusion of expected hospital deaths, and EMR requirement. For MEWS, the Glasgow Coma Scale was mapped to A/V/P/U, which does not appear to affect results, as our c‐statistic is identical to the literature.[4] Any hospital with an EMR collects the data necessary for computation of RI values. The RI algorithms are available in software compatible with systems from numerous EMR manufacturers (eg, Epic, Cerner, McKesson, Siemens, AllScripts, Phillips).
The advent of the EMR in hospitals marries well with an EWS that leverages from additional data more information than is contained in vital signs, permitting complex numeric computations of acuity scores, a process simply not possible with paper systems. Further, the automatic recalculation of the score reduces the burden on clinicians, and broadens potential use over a wide range, from minute‐by‐minute recalculations when attached to sensors in the ICU, to comparative metrics of hospital performance, to nonclinical financial resource applications. This new information technology is guiding methods to achieve a significant performance increment over current EWS and may assist earlier detection of deterioration, providing a chance to avoid medical crises.[15]
Acknowledgements
The authors express their appreciation to Abington Memorial Hospital. Particular thanks are extended to Steven I. Rothman, MSEM, for extensive discussions and technical support. The authors thank Alan Solinger, PhD, for his assistance in reviewing the manuscript.
Disclosures: One author (RAS) declares no conflict of interest. Two authors (GDF, MJR) are employees and shareholders in PeraHealth, Inc. of Charlotte, North Carolina, a health information technology company that offers products utilizing the Rothman Index. All of the original research defining the Rothman Index was performed prior to the formation of the company and is now published in peer‐reviewed journals. The index is freely available to all qualified researchers and is currently installed at several major medical research centers and hospital systems. This present work is under the auspices and partly funded by an independent foundation, F.A.R. Institute of Sarasota, Florida. Early research defining the Rothman Index was funded by grants from Sarasota Memorial Healthcare Foundation and the Goldsmith Fund of Greenfield Foundation. Continuing research has been funded by the F.A.R. Institute.
- , , , . Validation of a modified Early Warning Score in medical admissions. QJM Mon J Assoc Physicians. 2001;94:521–526.
- , , . Monitoring vital signs using early warning scoring systems: a review of the literature. J Nurs Manag. 2011;19:311–330.
- , , , et al. A clinical deterioration prediction tool for internal medicine patients. Am J Med Qual. 2013;28:135–142.
- , , , . ViEWS—towards a national early warning score for detecting adult inpatient deterioration. Resuscitation. 2010;81:932–937.
- , , , , , . Early detection of impending physiologic deterioration among patients who are not in intensive care: development of predictive models using data from an automated electronic medical record. J Hosp Med. 2012;7:388–395.
- , , , et al. Predicting out of intensive care unit cardiopulmonary arrest or death using electronic medical record data. BMC Med Inform Decis Mak. 2013;13:28.
- , , , The Braden Scale for predicting pressure sore risk. Nurs Res. 1987;36:205–210.
- , , . Development and validation of a continuous measure of patient condition using the electronic medical record. J Biomed Inform. 2013;46:837–848.
- , , , , . Identifying patients at increased risk for unplanned readmission. Med Care. 2013;51:761–766.
- , , . Comparison of consciousness level assessment in the poisoned patient using the alert/verbal/painful/unresponsive scale and the Glasgow Coma Scale. Ann Emerg Med. 2004;44:108–113.
- , . Experimental Design. New York, NY: John Wiley 1950.
- , . Patterns of unexpected in‐hospital deaths: a root cause analysis. Patient Saf Surg. 2011;5:3.
- , , , . Clinical implications and validity of nursing assessments: a longitudinal measure of patient condition from analysis of the Electronic Medical Record. BMJ Open. 2012;2(4):pii: e000646.
- , , , . Automated analysis of electronic medical record data reflects the pathophysiology of operative complications. Surgery. 2013;154:918–926.
- , , Not getting better means getting worse—trends in Early Warning Scores suggest that there might only be a short time span to rescue those threatening to fall off a “physiological” cliff? Resuscitation. 2013;84:409–410.

Centers for Medicare & Medicaid Services (CMS) Allowing Specialty Society Registries To Submit Quality Data to PQRS
Hospitalists shouldn't get too excited over the recent decision by the Centers for Medicare & Medicaid Services (CMS) that allows specialty society-run clinical data registries to submit their own quality metrics under the Physician Quality Reporting System (PQRS).
CMS earlier this month agreed to let specialist medical societies draw up their own quality measures, but to qualify, societies must have a certified clinical data registry. SHM’s Public Policy Committee (PPC) and Performance Measurement and Reporting Committee (PMRC) consistently provide feedback to CMS on the current PQRS quality measures and is reviewing the potential value of a clinical data registry for SHM members in the future.
PPC and Team Hospitalist member Joshua Lenchus, DO, RPh, FACP, SFHM, says he and other hospitalist leaders will discuss CMS' decision, but he wonders whether the reporting system's average payment adjustment for foreseeable program years and hospitalist interest is high enough to make establishing a data registry worthwhile. “The question begs,” Dr. Lenchus says, “is the benefit worth the effort?”
The 2014 Medicare physician fee schedule [PDF] reported that 26,515 medical practices with 266,521 eligible professionals participated in PQRS in 2011—or about 27% of eligible providers. SHM has encouraged its members to participate since the system's inception in 2007 to both take advantage of incentive payments that were available and to prepare for upcoming penalties for failure to report. Starting in 2015 and based on 2013 performance, there will be a penalty for not reporting PQRS quality measures.
Dr. Lenchus says PPC members will continue to monitor and advocate for quality metrics that are more in line with daily hospitalist duties. Similarly, SHM's Performance Measurement and Reporting Committee (PMRC) has been working to identify and ensure measures applicable to HM are included in PQRS.
"The committee is deeply concerned about the limited number of PQRS measures broadly applicable to hospitalists, and we are working to change this disparity," wrote Greg Seymann, MD, SFHM, chief of the division of hospital medicine at the University of California at San Diego and chair of SHM’s PMRC, and Josh Boswell, SHM’s senior manager of government relations in The Hospitalist last month.
Dr. Lenchus adds that while SHM and other societies can weigh in on the measures, CMS remains the final arbiter.
"Groups will submit whatever metrics they would like to be assessed against and those metrics will not be taken carte blanche, but rather will require CMS approval," he says.
Visit our website for more information about PQRS.
Infection Prevention Campaign Solicits Patient Participation
How would hospitalists feel if patients or families asked them to wash their hands when they entered the hospital room? A new campaign called "Infection Prevention and You," engages patients to help hospitals overcome one of the most persistent barriers to preventing hospital-acquired infections (HAIs)—healthcare professionals failing to practice proper hand hygiene.
Launched by the Association for Professionals in Infection Control and Epidemiology (APIC), the organization"s executives contend that everyone plays a role in infection prevention.
"We know that washing hands is important, and so many things have been tried," says Carol McLay, DrPH, MPH, RN, CIC, infection prevention consultant and chair of APIC's Communications Committee. "Patient empowerment is one of the newer approaches. Studies have shown that patients really like the idea, but often are afraid to speak up."
Dr. McLay says hand-washing advocacy is one piece of a larger campaign for preventing HAIs across settings of care.
"I would hope that physicians, including hospitalists, would view it as an opportunity to do the right thing, to serve as effective role models, and to say to their patients, 'Your health is important to me,'" she says.
"The aspiration of having anyone and everyone speak up and ask providers to apply hand hygiene is laudable," says hospitalist Ethan Cumbler, MD, FACP, who has spearheaded a multidisciplinary hand hygiene initiative at University of Colorado Hospital in Aurora. But he says it is naive to expect all providers to respond positively to being corrected in this way. "At first, we may bristle at being challenged on hand hygiene, but when we consider what kind of physicians we want to be, and what kind of culture we want to work in, I believe it is a challenge we will come to appreciate," Dr. Cumbler says.
Visit our website for more information about hospitalists and infection prevention.
‘JNC 8’ relaxes elderly systolic target below 150 mm Hg
The group of experts who had constituted the JNC 8 panel, a team assembled in 2008 by the National Heart, Lung, and Blood Institute to update official U.S. hypertension management guidelines, set the target blood pressure for the general population aged 60 years or older to less than 150/90 mm Hg, a major break from long-standing practice to treat such patients to a target systolic pressure of less than 140 mm Hg.
This decision, which the panel contends was driven by lack of clear evidence for extra benefit from the below–140 mm Hg target, will surely prove controversial, along with the panel’s relaxing of target blood pressures for patients with diabetes or chronic kidney disease to less than 140/90 mm Hg (increased from 130/80 mm Hg in the prior, JNC 7 guidelines). That controversy would be a fitting final curtain for the Eighth Report of the Joint National Committee on Prevention, Detection, Evaluation, and Treatment of High Blood Pressure (JNC 8), a project that courted controversy by running years longer than anticipated and then generating several plot twists during the final months leading up to Dec. 18, when the former JNC 8 panel published its hypertension-management guideline (JAMA 2013 Dec. 18 [doi:10.1001/jama.2013.284427]).

The new target of a systolic pressure of less than 150 mm Hg for hypertensive patients aged 60 or older without diabetes or chronic kidney disease "is definitely controversial," said Dr. Paul A. James, cochairman of the panel and professor of family medicine at the University of Iowa in Iowa City. "There is A-level evidence that getting blood pressure below 150 mm Hg results in improved outcomes that really matter, but we have no evidence at this time to support going lower," to less than 140 mm Hg. "The good news is that the panel is comfortable that we don’t do harm," by treating patients to less than 140 mm Hg. "But why put patients at increased risk for medication adverse events when we don’t have strong evidence of benefit?" he said in an interview.
He stressed that his group released their conclusions and guideline on their own, identifying themselves as "the panel members appointed to the Eighth Joint National Committee (JNC 8)." Leaders from the National Heart, Lung, and Blood Institute announced last June that the agency was pulling out of the business of issuing cardiovascular-disease management guidelines, and would instead fund evidence reviews and partner with other organizations to issue guidelines. The NHLBI arranged for its cholesterol, obesity, and lifestyle guidelines to be released through the American Heart Association and American College of Cardiology, but no similar arrangement worked out for the JNC 8 panel, which became the former panel when the NHLBI officially dissolved it by late summer.
The former JNC 8 panel applied "a very narrow interpretation" of the clinical evidence where the evidence is very incomplete, commented Dr. Michael A. Weber, professor of medicine at State University of New York, Brooklyn. "The purpose of guidelines is for a group of experts to be guided as far as they can by the evidence, and then use their judgment and experience to make recommendations that in the best interests of patients." He cited findings from the ACCOMPLISH, INVEST, and VALUE trials that show benefits from treating patients older than 60 years to a systolic pressure of less than 140 mm Hg, though he admitted that in each of these studies the findings did not come from primary, prespecified analyses.

Dr. Weber led a panel organized by the American Society of Hypertension and International Society of Hypertension that released its own set of hypertension diagnosis and management guidelines a day earlier, on Dec. 17 (J. Clin. Hypertension 2013 [doi:10.1111/ch.1223]). Where they overlap, the guidelines from ASH/ISH and from the former JNC 8 panel are mostly the same, with the systolic target for the general population aged 60-79 years being the main area of contention, Dr. Weber said. The ASH/ISH guideline set a systolic target of less than 150 mm Hg for the general hypertensive population aged 80 years or older.
The former-JNC 8 panel also qualified their 150 mm Hg–target by adding that if general population patients aged 60 years or older are on stable, well-tolerated antihypertensive treatment and have a systolic pressure of less than 140 mm Hg, changing treatment and aiming for a higher systolic pressure is not recommended.
The target of less than 150 mm Hg for these patients also had defenders. "They made a reasonable recommendation for the elderly based on the evidence," said Dr. John M. Flack, professor and chief of medicine at Wayne State University in Detroit. But he took the JNC 8 panel to task for relaxing the systolic and diastolic pressure targets for patients with either diabetes or chronic kidney disease from the prior target of less than 130/80 mm Hg to new targets of less than 140/90 mm Hg. "Relaxing blood pressure targets in high-risk groups when so much progress has been made over the last decade is going to be very controversial," he said in an interview. The new ASH-ISH hypertension guideline also set a blood pressure target of less than 140/90 mm Hg for patients with diabetes or chronic kidney disease.
The guideline from the former JNC 8 panel "will produce a lot of discussion, and the main target will be whether the 150 mm Hg target is right or not," commented Dr. Eric D. Peterson, professor of medicine at Duke University in Durham, N.C. In an editorial that accompanied the published guideline, Dr. Peterson and his associates also noted that the hypertension goals specified in authoritative guidelines had a magnified importance these days because they often are incorporated into "performance measures" to which physicians can be often held rigidly accountable.(JAMA 2013 Dec. 18 [doi:10.1001/jama.2013.284430]).
"I chair the ACC/AHA Task Force on Performance Measures, and we will be in a bind because the current performance measures call for a blood pressure target of less than 140/90 mm Hg," he said in an interview. The ACC/AHA task force is one of the main contributors of performance measures for cardiovascular disease to the U.S. clearing house for performance measures, the National Quality Forum. "The Task Force will need to respond to this guideline in some way," he said, but the Task Force takes into account the range of current guidelines that exist and their backup evidence, so how it will decide on this issue remains uncertain.
"My concern is not so much with the number they came up with as with how it will be used by physicians in the community," Dr. Peterson said. On one hand, you don’t want physicians to get carried away and feel they need to treat all their patients to below some magical number." As he pointed out in his editorial, the counterbalancing problem is that there is always a gap between the hypertension treatment goals and what is often achieved in practice. If that relationship remains and the accepted goal for patients aged 60-79 years becomes less than 150 mm Hg, then many U.S. patients in this group may end up treated but with systolic pressures above 150 mm Hg.
Dr. James and Dr. Peterson said that they had no disclosures. Dr. Weber said that he has been a consultant to Novartis, Takeda, and Forest. Dr. Flack said that he has been a consultant to Novartis, Medtronic, and Back Beat Hypertension and received funding from Novartis and Medtronic.
On Twitter @mitchelzoler
The group of experts who had constituted the JNC 8 panel, a team assembled in 2008 by the National Heart, Lung, and Blood Institute to update official U.S. hypertension management guidelines, set the target blood pressure for the general population aged 60 years or older to less than 150/90 mm Hg, a major break from long-standing practice to treat such patients to a target systolic pressure of less than 140 mm Hg.
This decision, which the panel contends was driven by lack of clear evidence for extra benefit from the below–140 mm Hg target, will surely prove controversial, along with the panel’s relaxing of target blood pressures for patients with diabetes or chronic kidney disease to less than 140/90 mm Hg (increased from 130/80 mm Hg in the prior, JNC 7 guidelines). That controversy would be a fitting final curtain for the Eighth Report of the Joint National Committee on Prevention, Detection, Evaluation, and Treatment of High Blood Pressure (JNC 8), a project that courted controversy by running years longer than anticipated and then generating several plot twists during the final months leading up to Dec. 18, when the former JNC 8 panel published its hypertension-management guideline (JAMA 2013 Dec. 18 [doi:10.1001/jama.2013.284427]).
The new target of a systolic pressure of less than 150 mm Hg for hypertensive patients aged 60 or older without diabetes or chronic kidney disease "is definitely controversial," said Dr. Paul A. James, cochairman of the panel and professor of family medicine at the University of Iowa in Iowa City. "There is A-level evidence that getting blood pressure below 150 mm Hg results in improved outcomes that really matter, but we have no evidence at this time to support going lower," to less than 140 mm Hg. "The good news is that the panel is comfortable that we don’t do harm," by treating patients to less than 140 mm Hg. "But why put patients at increased risk for medication adverse events when we don’t have strong evidence of benefit?" he said in an interview.
He stressed that his group released their conclusions and guideline on their own, identifying themselves as "the panel members appointed to the Eighth Joint National Committee (JNC 8)." Leaders from the National Heart, Lung, and Blood Institute announced last June that the agency was pulling out of the business of issuing cardiovascular-disease management guidelines, and would instead fund evidence reviews and partner with other organizations to issue guidelines. The NHLBI arranged for its cholesterol, obesity, and lifestyle guidelines to be released through the American Heart Association and American College of Cardiology, but no similar arrangement worked out for the JNC 8 panel, which became the former panel when the NHLBI officially dissolved it by late summer.
The former JNC 8 panel applied "a very narrow interpretation" of the clinical evidence where the evidence is very incomplete, commented Dr. Michael A. Weber, professor of medicine at State University of New York, Brooklyn. "The purpose of guidelines is for a group of experts to be guided as far as they can by the evidence, and then use their judgment and experience to make recommendations that in the best interests of patients." He cited findings from the ACCOMPLISH, INVEST, and VALUE trials that show benefits from treating patients older than 60 years to a systolic pressure of less than 140 mm Hg, though he admitted that in each of these studies the findings did not come from primary, prespecified analyses.
Dr. Weber led a panel organized by the American Society of Hypertension and International Society of Hypertension that released its own set of hypertension diagnosis and management guidelines a day earlier, on Dec. 17 (J. Clin. Hypertension 2013 [doi:10.1111/ch.1223]). Where they overlap, the guidelines from ASH/ISH and from the former JNC 8 panel are mostly the same, with the systolic target for the general population aged 60-79 years being the main area of contention, Dr. Weber said. The ASH/ISH guideline set a systolic target of less than 150 mm Hg for the general hypertensive population aged 80 years or older.
The former-JNC 8 panel also qualified their 150 mm Hg–target by adding that if general population patients aged 60 years or older are on stable, well-tolerated antihypertensive treatment and have a systolic pressure of less than 140 mm Hg, changing treatment and aiming for a higher systolic pressure is not recommended.
The target of less than 150 mm Hg for these patients also had defenders. "They made a reasonable recommendation for the elderly based on the evidence," said Dr. John M. Flack, professor and chief of medicine at Wayne State University in Detroit. But he took the JNC 8 panel to task for relaxing the systolic and diastolic pressure targets for patients with either diabetes or chronic kidney disease from the prior target of less than 130/80 mm Hg to new targets of less than 140/90 mm Hg. "Relaxing blood pressure targets in high-risk groups when so much progress has been made over the last decade is going to be very controversial," he said in an interview. The new ASH-ISH hypertension guideline also set a blood pressure target of less than 140/90 mm Hg for patients with diabetes or chronic kidney disease.
The guideline from the former JNC 8 panel "will produce a lot of discussion, and the main target will be whether the 150 mm Hg target is right or not," commented Dr. Eric D. Peterson, professor of medicine at Duke University in Durham, N.C. In an editorial that accompanied the published guideline, Dr. Peterson and his associates also noted that the hypertension goals specified in authoritative guidelines had a magnified importance these days because they often are incorporated into "performance measures" to which physicians can be often held rigidly accountable.(JAMA 2013 Dec. 18 [doi:10.1001/jama.2013.284430]).
"I chair the ACC/AHA Task Force on Performance Measures, and we will be in a bind because the current performance measures call for a blood pressure target of less than 140/90 mm Hg," he said in an interview. The ACC/AHA task force is one of the main contributors of performance measures for cardiovascular disease to the U.S. clearing house for performance measures, the National Quality Forum. "The Task Force will need to respond to this guideline in some way," he said, but the Task Force takes into account the range of current guidelines that exist and their backup evidence, so how it will decide on this issue remains uncertain.
"My concern is not so much with the number they came up with as with how it will be used by physicians in the community," Dr. Peterson said. On one hand, you don’t want physicians to get carried away and feel they need to treat all their patients to below some magical number." As he pointed out in his editorial, the counterbalancing problem is that there is always a gap between the hypertension treatment goals and what is often achieved in practice. If that relationship remains and the accepted goal for patients aged 60-79 years becomes less than 150 mm Hg, then many U.S. patients in this group may end up treated but with systolic pressures above 150 mm Hg.
Dr. James and Dr. Peterson said that they had no disclosures. Dr. Weber said that he has been a consultant to Novartis, Takeda, and Forest. Dr. Flack said that he has been a consultant to Novartis, Medtronic, and Back Beat Hypertension and received funding from Novartis and Medtronic.
On Twitter @mitchelzoler
FROM JAMA
Locked Knee Caused by Lateral Meniscal Capsular Disruption: Verification by Magnetic Resonance Imaging and Arthroscopy
Endovascular coiling aids pelvic congestion syndrome
CHICAGO – Endovascular coiling should be offered to women with pelvic congestion syndrome as an effective treatment.
"The technical success rate is high, pain scores were significantly improved, and most importantly, the patient satisfaction with resolution of their symptoms is very high," Dr. Axel Thors said at the annual meeting of the Midwestern Vascular Surgical Society.

He reported on a 4-year review involving 15 women with pelvic congestion syndrome (PCS) who underwent endovenous coil embolization (n = 14) or stenting of the iliac vein (n = 1).
The diagnosis of PCS was made clinically by the presence of chronic pelvic pain for 6 months or more, sensations of pelvic fullness, dyspareunia, or perineal varicosities. There was no evidence of nutcracker syndrome or perirenal varicosities. Other pathologies had been previously ruled out.
"By the time these women got to us, we were probably the last provider they had seen and they had all undergone extensive evaluation for their pelvic pain, all the way from their primary providers to the ob.gyns.," said Dr. Thors of Ohio State University, Columbus.
Their average age was 36 years. Fourteen patients had a previous pregnancy, with an average parity of two.
Twelve patients presented with symptomatic vulvar varices and three with imaging or laproscopic findings of tubo-ovarian varices. All had complaints of chronic pelvic pain.
"Lower extremity venous insufficiency was closely associated with the incidence [of PCS], as was chronic dyspareunia," Dr. Thors said.
Gonadal vein venograms were performed during normal breath and the Valsalva maneuver. Embolization was performed if there was gonadal vein incompetence, congestion of the ovarian venous plexus, uterine venous congestion, cross-pelvic congestion, or marked enlargement of gonadal veins (minimum 6 mm). The average venality size was 7.3 mm.
In all, 13 gonadal veins were embolized with an average of three coils, ranging in size from 6 mm to 12 mm, Dr. Thors said.
Four gonadal veins were occluded using an Amplatzer plug (range 12-18 mm). One iliac vein was stented with a 16 mm by 60 mm stent.
Lower-extremity venous insufficiency was treated with ablation and subsequently followed clinically, he said.
Pain scores on a 10-point visual analog scale declined significantly from baseline for eight evaluable patients for pelvic pain (9.3 vs. 1.8), dyspareunia (8.875 vs. 1.5), painful vulvar varices (9.2 vs. 1.2), and lower extremity venous insufficiency (7 vs. 1), he said.
Two patients had recurrence, and their baseline pain score of 1.2 increased to 4.0 after a mean of 21 months.
All eight patients reported that they were "satisfied" or "very satisfied" with their procedure.
"Patients with chronic pelvic pain, vulvar varices, multiparity, and lower extremity venous insufficiency should be offered endovascular evaluation and treatment," Dr. Thors concluded.
Audience members said that the study represents an important concept in the management of these patients. It is a validation of a very old treatment that sometimes is not offered because of a lack of knowledge or perceived lack of data. A 2012 Agency for Healthcare Research and Quality review estimated that outpatient management of chronic pelvic pain cost $1.2 billion annually. The AHRQ review of 36 studies concluded that there is insufficient evidence to demonstrate the effectiveness of surgical approaches for chronic pelvic pain.
Dr. Thors and his coauthors reported having no financial disclosures.
Pelvic venous congestion is misunderstood and frequently overlooked. Unfortunately pelvic pain is multifactorial. Even with significant reflux findings and encouraging results these patients, much like patients with other areas of venous insufficiency, frequently recur if followed longitudinally. Good markers to predict who will benefit from intervention and which interventions should be undertaken do not exist. This is an area that needs further study and development of standard outcome measures that can be followed sequentially.
Dr. Joann M. Lohr is associate program director, Good Samaritan Hospital Vascular Surgery Program She is also an associate medical editor for Vascular Specialist.
CHICAGO – Endovascular coiling should be offered to women with pelvic congestion syndrome as an effective treatment.
"The technical success rate is high, pain scores were significantly improved, and most importantly, the patient satisfaction with resolution of their symptoms is very high," Dr. Axel Thors said at the annual meeting of the Midwestern Vascular Surgical Society.
He reported on a 4-year review involving 15 women with pelvic congestion syndrome (PCS) who underwent endovenous coil embolization (n = 14) or stenting of the iliac vein (n = 1).
The diagnosis of PCS was made clinically by the presence of chronic pelvic pain for 6 months or more, sensations of pelvic fullness, dyspareunia, or perineal varicosities. There was no evidence of nutcracker syndrome or perirenal varicosities. Other pathologies had been previously ruled out.
"By the time these women got to us, we were probably the last provider they had seen and they had all undergone extensive evaluation for their pelvic pain, all the way from their primary providers to the ob.gyns.," said Dr. Thors of Ohio State University, Columbus.
Their average age was 36 years. Fourteen patients had a previous pregnancy, with an average parity of two.
Twelve patients presented with symptomatic vulvar varices and three with imaging or laproscopic findings of tubo-ovarian varices. All had complaints of chronic pelvic pain.
"Lower extremity venous insufficiency was closely associated with the incidence [of PCS], as was chronic dyspareunia," Dr. Thors said.
Gonadal vein venograms were performed during normal breath and the Valsalva maneuver. Embolization was performed if there was gonadal vein incompetence, congestion of the ovarian venous plexus, uterine venous congestion, cross-pelvic congestion, or marked enlargement of gonadal veins (minimum 6 mm). The average venality size was 7.3 mm.
In all, 13 gonadal veins were embolized with an average of three coils, ranging in size from 6 mm to 12 mm, Dr. Thors said.
Four gonadal veins were occluded using an Amplatzer plug (range 12-18 mm). One iliac vein was stented with a 16 mm by 60 mm stent.
Lower-extremity venous insufficiency was treated with ablation and subsequently followed clinically, he said.
Pain scores on a 10-point visual analog scale declined significantly from baseline for eight evaluable patients for pelvic pain (9.3 vs. 1.8), dyspareunia (8.875 vs. 1.5), painful vulvar varices (9.2 vs. 1.2), and lower extremity venous insufficiency (7 vs. 1), he said.
Two patients had recurrence, and their baseline pain score of 1.2 increased to 4.0 after a mean of 21 months.
All eight patients reported that they were "satisfied" or "very satisfied" with their procedure.
"Patients with chronic pelvic pain, vulvar varices, multiparity, and lower extremity venous insufficiency should be offered endovascular evaluation and treatment," Dr. Thors concluded.
Audience members said that the study represents an important concept in the management of these patients. It is a validation of a very old treatment that sometimes is not offered because of a lack of knowledge or perceived lack of data. A 2012 Agency for Healthcare Research and Quality review estimated that outpatient management of chronic pelvic pain cost $1.2 billion annually. The AHRQ review of 36 studies concluded that there is insufficient evidence to demonstrate the effectiveness of surgical approaches for chronic pelvic pain.
Dr. Thors and his coauthors reported having no financial disclosures.
AT MIDWESTERN VASCULAR 2013
Major finding: Key numerical finding (e.g., number needed to treat to prevent one death/event; number lived or died as result of intervention). Maximum 10 words/1 sentence.
Data source: Review of 15 women treated for pelvic congestion syndrome.
Disclosures: Dr. Thors and his coauthors reported having no financial disclosures.

Consider small-fiber neuropathies in systemic lupus erythematosus
Small-fiber neuropathy is one of the most common types of peripheral neuropathy affecting patients with systemic lupus erythematosus, but it isn’t even mentioned in the American College of Rheumatology neuropsychiatric case definitions of manifestations of the disorder, according to a retrospective analysis of cohort of 2,097 patients with SLE.
Other types of peripheral neuropathy, such as acute inflammatory demyelinating neuropathies (for example, Guillain-Barré syndrome), plexopathies, and mononeuritis multiplex, are well described in the ACR-NPSLE case definitions but occur much less frequently. This, combined with the fact that small-fiber neuropathies often present as "unorthodox" pain patterns, indicates that they are underdiagnosed, said Dr. Amin Oomatia of the University of Cambridge, England, and his coinvestigators at John Hopkins University, Baltimore.
Small-fiber neuropathies arise through mechanisms that are distinct from those of other neuropathies and require different diagnostic strategies to be properly identified. In particular, small-fiber neuropathies do not always conform to the "stocking-and-glove" pattern of pain that is typical of other neuropathies in SLE, so it is likely that many affected patients "may be regarded in routine clinical care as having a ‘nonorganic’ pain disorder.
"Our findings suggest that rheumatologists and other clinicians who confront SLE patients with seemingly improbable pain patterns should consider the diagnosis of a small-fiber neuropathy," the investigators wrote, especially since it may occur in the face of normal electrodiagnostic studies.
Dr. Oomatia and his colleagues based these conclusions on their retrospective study of one medical center’s 25-year experience treating 2,097 SLE patients – the Johns Hopkins Lupus Cohort. Using details in a database of patients’ electronic medical records, they identified 82 patients who had peripheral neuropathies related to SLE.
Only one patient had peripheral neuropathy attributable to Guillain-Barré syndrome, only one patient had a plexopathy, and only six patients had mononeuritis multiplex, demonstrating that these are very infrequent complications of SLE even though they are included in ACR case definitions.
In contrast, 14 patients (17% of those with peripheral neuropathy) had biopsy-proven small-fiber neuropathies, and most of them presented with "an entirely different and unorthodox pain distribution" characterized as patchy, asymmetric, or proximal.
In particular, nine patients had pain affecting the face, torso, and/or proximal extremities. Three had burning pain over their entire bodies, the investigators said (Arthritis Rheum. 2013 Dec. 10 [doi:10.1002/art.38302]).
In these cases, punch skin biopsy showed abnormalities that disproportionately affected the proximal thigh, "which is considered a surrogate indicator of proximal-most dorsal root ganglia neuronal cell loss," they wrote. In contrast, other patients who had the typical distal pattern of neuropathic pain showed decreased intraepidermal nerve-fiber densities in the distal leg, a surrogate indicator of distal-most axonal degeneration.
Another distinguishing feature of small-fiber neuropathy was its association with a history of herpes zoster virus, opportunistic infections, and osteoporotic fractures, all unrelated to corticosteroid dose, Dr. Oomatia and his associates said.
This study was supported in part by the National Institutes of Health and the National Center for Research Resources. No potential financial conflicts of interest were reported.
FROM ARTHRITIS AND RHEUMATISM
Major finding: A total of 14 patients, or 17% of 82 with peripheral neuropathies, had biopsy-proven small-fiber neuropathies and often presented with unorthodox patterns of pain.
Data source: A retrospective analysis of data regarding 2,097 consecutive patients with SLE registered in the Johns Hopkins Lupus Cohort during a 25-year period, including 82 who developed peripheral neuropathies related to the disease.
Disclosures: This study was supported in part by the National Institutes of Health and the National Center for Research Resources. No potential financial conflicts of interest were reported.