User login
Hemodialysis AV graft patency similar for forearm, upper arm
SAN FRANCISCO – Outcomes of forearm and upper arm hemodialysis arteriovenous grafts are similar despite the fact that large caliber outflow veins are often encountered in the upper arm, results from a large trial showed.
"To preserve a maximal number of access sites, forearm location should always be considered before resorting to an upper arm graft," Dr. Alik Farber said at the Society for Vascular Surgery Annual Meeting.
The incidence and prevalence of end-stage renal disease in the United States has grown exponentially in the past 25 years, said Dr. Farber, chief of vascular and endovascular surgery at Boston University Medical Center. "In fact, in 2010 almost 400,000 patients were undergoing hemodialysis," he said. "At the same time, there has been a steady increase in the percent of AV fistulas placed and an associated decline in the percent of AV grafts placed in the United States. In 2010, 20% of patients were undergoing hemodialysis through AV grafts."

Most grafts in the upper extremity are based on the brachial artery. Some are in the forearm while others are in the upper arm. "In the forearm most grafts are looped," Dr. Farber said. "In the upper arm some are looped and some are straight. As it turns out, the optimal graft configuration is unknown. The optimal venous outflow in the upper extremity is unknown. And the optimal location of the first-time AV graft is controversial."
He went on to note that the forearm AV graft "saves the upper arm for a future graft site and has a potential advantage of increasing the suitability of upper arm veins for future native fistula. On the other hand, there is some evidence in the literature that forearm grafts have lower patency rates. The upper arm graft may have higher patency rates because they are ‘sawn into’ large caliber veins. However, surgeons who preferentially place upper arm grafts tend to skip potential distal access sites."
Given the dearth of information on this topic, Dr. Farber and his associates set out to compare outcomes of forearm and upper arm grafts and to evaluate the association between upper extremity AV graft configuration, location, venous outflow, and patency in 649 patients from a multicenter trial conducted by the Dialysis Access Consortium (DAC). This was a randomized, controlled trial of dipyridamole versus placebo in patients with new AV grafts. It found that dipyridamole increased primary unassisted graft patency (N. Engl. J. Med. 2009;360:2191-201). "The important thing for us was that this is the largest randomized, controlled trial of AV grafts conducted to date," Dr. Farber said.
He presented results from 522 patients with AV grafts that were based on the brachial artery. Of the 522 patients, 269 had a forearm graft (fAVG) and 253 had an upper arm graft (uAVG). The primary outcome was loss of primary unassisted patency. "This was defined as a first occurrence of graft thrombosis, an access procedure to correct a greater than 50% stenosis, or other surgical graft modification," Dr. Farber explained. The secondary outcome was cumulative graft failure, "which was defined as the time from randomization to complete loss of access site for dialysis." Kaplan-Meier curves and Cox models were used to examine the effects of access location and configuration on study outcomes.
Compared with patients in the fAVG group, those in the uAVG group were more likely to be male (43% vs. 34%), to be African-American (78% vs. 62%), to have a lower body mass index (mean of 29 kg/m2 vs. a mean of 32 kg/m2), to have a lower baseline systolic blood pressure (139 mm Hg vs. 146 mm Hg), to have hemodialysis initiated before graft placement (80% vs. 64%), and to be on dialysis for a longer period of time (a mean of 2.59 years vs. a mean of 2.51 years).
Unadjusted analyses showed that there was no significant difference in the loss of primary unassisted graft patency or cumulative graft failure between the fAVG and uAVG groups.
Multivariate analyses of outcomes controlled for covariates revealed that the risk of loss of primary unassisted graft patency was not significantly higher in the uAVG group, compared with the fAVG group (hazard ratio of 1.24; P = .15). However, there was a suggestion of an association of increased risk of cumulative graft failure among upper arm grafts (HR 1.37; P = .09).
In a comparison of straight vs. looped grafts, straight configuration grafts "appeared to have a lower risk of primary and secondary failure, compared with looped figuration grafts, [but] this difference was not statistically significant," he said.
When compared to forearm looped grafts, which were used as a reference, there was no significant difference in the risk of primary and secondary failure among straight fAVGs, straight uAVGs, and looped uAVGs. There was a suggestion of increased risk of failure among upper arm looped grafts (HR 1.47; P = .06). There were also no significant differences between the two groups in adverse events and complications at 30 days.
Dr. Farber acknowledged certain limitations of the study. "Like any observational comparison of treatment groups, analysis was susceptible to uncontrolled confounding [variables]," he said. "We did a post hoc analysis of a randomized trial which did not answer the questions that we posed. Preoperative artery and vein diameters were not recorded and the reasons for graft selection are not known. Lastly, access interventions were followed for only 30 days beyond the occurrence of the primary endpoint, so we couldn’t really use access intervention to thoroughly evaluate the determinants of cumulative graft failure."
Dr. Farber said that he had no disclosures.
An aphorism in dialysis procedures is that one should start distal and move proximally only after all distal procedures have been exhausted. Occlusion of a proximal site may preclude a more distal site that might have originally been useable. However some surgeons have favored an upper arm graft because of perceived improved long term patency. This review shows that is not necessarily the case. However, most of us who do a significant amount of dialysis realize there are many variables that enter into the decision process as to where to place the graft. In the end it is probably more “art” than “science” that colors our decisions!
Dr. Russell Samson is the Medical Editor, Vascular Specialist.
SAN FRANCISCO – Outcomes of forearm and upper arm hemodialysis arteriovenous grafts are similar despite the fact that large caliber outflow veins are often encountered in the upper arm, results from a large trial showed.
"To preserve a maximal number of access sites, forearm location should always be considered before resorting to an upper arm graft," Dr. Alik Farber said at the Society for Vascular Surgery Annual Meeting.
The incidence and prevalence of end-stage renal disease in the United States has grown exponentially in the past 25 years, said Dr. Farber, chief of vascular and endovascular surgery at Boston University Medical Center. "In fact, in 2010 almost 400,000 patients were undergoing hemodialysis," he said. "At the same time, there has been a steady increase in the percent of AV fistulas placed and an associated decline in the percent of AV grafts placed in the United States. In 2010, 20% of patients were undergoing hemodialysis through AV grafts."
Most grafts in the upper extremity are based on the brachial artery. Some are in the forearm while others are in the upper arm. "In the forearm most grafts are looped," Dr. Farber said. "In the upper arm some are looped and some are straight. As it turns out, the optimal graft configuration is unknown. The optimal venous outflow in the upper extremity is unknown. And the optimal location of the first-time AV graft is controversial."
He went on to note that the forearm AV graft "saves the upper arm for a future graft site and has a potential advantage of increasing the suitability of upper arm veins for future native fistula. On the other hand, there is some evidence in the literature that forearm grafts have lower patency rates. The upper arm graft may have higher patency rates because they are ‘sawn into’ large caliber veins. However, surgeons who preferentially place upper arm grafts tend to skip potential distal access sites."
Given the dearth of information on this topic, Dr. Farber and his associates set out to compare outcomes of forearm and upper arm grafts and to evaluate the association between upper extremity AV graft configuration, location, venous outflow, and patency in 649 patients from a multicenter trial conducted by the Dialysis Access Consortium (DAC). This was a randomized, controlled trial of dipyridamole versus placebo in patients with new AV grafts. It found that dipyridamole increased primary unassisted graft patency (N. Engl. J. Med. 2009;360:2191-201). "The important thing for us was that this is the largest randomized, controlled trial of AV grafts conducted to date," Dr. Farber said.
He presented results from 522 patients with AV grafts that were based on the brachial artery. Of the 522 patients, 269 had a forearm graft (fAVG) and 253 had an upper arm graft (uAVG). The primary outcome was loss of primary unassisted patency. "This was defined as a first occurrence of graft thrombosis, an access procedure to correct a greater than 50% stenosis, or other surgical graft modification," Dr. Farber explained. The secondary outcome was cumulative graft failure, "which was defined as the time from randomization to complete loss of access site for dialysis." Kaplan-Meier curves and Cox models were used to examine the effects of access location and configuration on study outcomes.
Compared with patients in the fAVG group, those in the uAVG group were more likely to be male (43% vs. 34%), to be African-American (78% vs. 62%), to have a lower body mass index (mean of 29 kg/m2 vs. a mean of 32 kg/m2), to have a lower baseline systolic blood pressure (139 mm Hg vs. 146 mm Hg), to have hemodialysis initiated before graft placement (80% vs. 64%), and to be on dialysis for a longer period of time (a mean of 2.59 years vs. a mean of 2.51 years).
Unadjusted analyses showed that there was no significant difference in the loss of primary unassisted graft patency or cumulative graft failure between the fAVG and uAVG groups.
Multivariate analyses of outcomes controlled for covariates revealed that the risk of loss of primary unassisted graft patency was not significantly higher in the uAVG group, compared with the fAVG group (hazard ratio of 1.24; P = .15). However, there was a suggestion of an association of increased risk of cumulative graft failure among upper arm grafts (HR 1.37; P = .09).
In a comparison of straight vs. looped grafts, straight configuration grafts "appeared to have a lower risk of primary and secondary failure, compared with looped figuration grafts, [but] this difference was not statistically significant," he said.
When compared to forearm looped grafts, which were used as a reference, there was no significant difference in the risk of primary and secondary failure among straight fAVGs, straight uAVGs, and looped uAVGs. There was a suggestion of increased risk of failure among upper arm looped grafts (HR 1.47; P = .06). There were also no significant differences between the two groups in adverse events and complications at 30 days.
Dr. Farber acknowledged certain limitations of the study. "Like any observational comparison of treatment groups, analysis was susceptible to uncontrolled confounding [variables]," he said. "We did a post hoc analysis of a randomized trial which did not answer the questions that we posed. Preoperative artery and vein diameters were not recorded and the reasons for graft selection are not known. Lastly, access interventions were followed for only 30 days beyond the occurrence of the primary endpoint, so we couldn’t really use access intervention to thoroughly evaluate the determinants of cumulative graft failure."
Dr. Farber said that he had no disclosures.
AT THE SVS ANNUAL MEETING
Major finding: The risk of loss of primary unassisted graft patency was not significantly higher in patients who had an upper arm arteriovenous graft compared with those who had a forearm AV graft (hazard ratio of 1.24; P = .15). However, there was a suggestion of an association of increased risk of cumulative graft failure among upper arm grafts (HR 1.37; P = .09).
Data source: A study of 522 hemodialysis patients with AV grafts based on the brachial artery. Of these, 269 had a forearm graft and 253 had an upper arm graft.
Disclosures: Dr. Farber said that he had no disclosures.

New and Noteworthy Information—May 2013
Living in the stroke belt as an adolescent is significantly associated with a high risk of stroke, according to research published online ahead of print April 24 in Neurology. Researchers examined data for 24,544 stroke-free participants in the Reasons for Geographic and Racial Differences in Stroke study. Stroke belt exposure was calculated by combinations of stroke belt birthplace, current residence, and proportion of years in the stroke belt during discrete age categories. Risk of stroke was significantly associated with proportion of life in the stroke belt and with all other exposure periods except birth, ages 31 to 45, and current residence. After adjustment for risk factors, the risk of stroke remained significantly associated only with proportion of residence in the stroke belt during adolescence.
Increased levels of trimethylamine-N-oxide (TMAO), a proatherosclerotic metabolite, are associated with an increased risk of stroke, myocardial infarction, or death, according to research published in the April 25 New England Journal of Medicine. Investigators measured TMAO, choline, and betaine levels in patients who had eaten two hard-boiled eggs and deuterium [d9]-labeled phosphatidylcholine before and after suppressing intestinal microbiota with antibiotics. They also examined the relationship between fasting plasma levels of TMAO and major adverse cardiovascular events during three years of follow-up. Increased plasma levels of TMAO were associated with an increased risk of a major adverse cardiovascular event. An elevated TMAO level predicted an increased risk of major adverse cardiovascular events after adjustment for traditional risk factors, as well as in lower-risk subgroups.
A single-nucleotide polymorphism (SNP) in the ABCA7 gene was significantly linked with an increased risk of Alzheimer’s disease among African Americans, according to research published in the April 10 JAMA. African Americans with this mutation have nearly double the risk of Alzheimer’s disease, but the SNP is not associated with the disease among Europeans. The effect size for the SNP in ABCA7 was comparable with that of the APOE ε4–determining SNP rs429358. Investigators examined data for 5,896 African Americans (1,968 with Alzheimer’s disease and 3,928 controls) who were 60 or older. Data were collected between 1989 and 2011 at multiple sites. The team assessed the association of Alzheimer’s disease with genotyped and imputed SNPs in case–control and in family-based data sets.
The FDA has approved the Precision Spectra Spinal Cord Stimulator (SCS) System, which is designed to provide improved pain relief to patients with chronic pain. The system, manufactured by Boston Scientific (Natick, Massachusetts), includes Illumina 3D software intended to improve physicians’ control of the stimulation field. It is based on a proprietary computer model that takes into account 3-D anatomical structures, including the conductivity of the spinal cord and surrounding tissue. The physician can select a desired location on the spinal cord and prompt the programming software to create a customized stimulation field to mask the patient’s pain. Previous SCS systems included 16 contacts, but the Precision Spectra system includes 32 contacts and is designed to offer more coverage of the spinal cord.
Framingham risk scores may be better than a dementia risk score for assessing individuals’ risk of cognitive decline and targeting modifiable risk factors, according to research published in the April 2 Neurology. Researchers examined data for participants in the Whitehall II longitudinal cohort study. Subjects’ mean age at baseline was 55.6. The investigators compared the Framingham general cardiovascular disease risk score and the Framingham stroke risk score with the Cardiovascular Risk Factors, Aging, and Dementia risk score. Patients underwent cognitive tests of reasoning, memory, verbal fluency, vocabulary, and global cognition three times over 10 years. Compared with the dementia risk score, cardiovascular and stroke risk scores showed slightly stronger associations with 10-year cognitive decline. The differences were statistically significant for semantic fluency and global cognitive scores.
Children born to women who used valproate during pregnancy may have a significantly increased risk of autism spectrum disorder and childhood autism, according to research published in the April 24 JAMA. Investigators used national registers to identify Danish children exposed to valproate during pregnancy and diagnosed with autism spectrum disorders. The researchers analyzed the risks associated with all autism spectrum disorders, as well as childhood autism, and adjusted for potential confounders. The estimated absolute risk after 14 years of follow-up was 1.53% for autism spectrum disorder and 0.48% for childhood autism. The 508 children exposed to valproate had an absolute risk of 4.42% for autism spectrum disorder and an absolute risk of 2.50% for childhood autism. Results changed slightly after considering only the children born to women with epilepsy.
The antisense oligonucleotide ISIS 333611 is a safe treatment for amyotrophic lateral sclerosis (ALS), according to a trial published online ahead of print March 29 in Lancet Neurology. Investigators studied 32 patients with SOD1-positive ALS in a randomized, placebo-controlled, phase I trial. The researchers delivered the drug by intrathecal infusion using an external pump over 11.5 hours at increasing doses (0.15 mg, 0.50 mg, 1.50 mg, and 3.00 mg). Approximately 88% of patients in the placebo group had adverse events, compared with 83% in the active group. The most common events were post-lumbar puncture syndrome, back pain, and nausea. The investigators found no dose-limiting toxic effects or safety or tolerability concerns related to ISIS 333611. No serious adverse events occurred in patients given ISIS 333611.
Thalamic atrophy in patients with clinically isolated syndrome (CIS) is associated with the development of clinically definite multiple sclerosis (MS), according to a study published online ahead of print April 23 in Radiology. Using MRI, researchers assessed 216 patients with CIS at baseline, six months, one year, and two years. MRI measures of progression included new and enlarged T2 lesions and changes in whole-brain, tissue-specific global, and regional gray matter volumes. In mixed-effect model analysis, the lateral ventricle volume, accumulation of new total T2 and new enlarging T2 lesions increase, and thalamic and whole-brain volume decrease were associated with development of clinically definite MS. In multivariate regression analysis, decrease in thalamic volumes and increase in lateral ventricle volumes were associated with the development of clinically definite MS.
Functional MRI (fMRI) can identify pain caused by heat in healthy persons, according to research published in the April 11 New England Journal of Medicine. In four studies of 114 participants, investigators developed an fMRI-based measure that predicts pain intensity, tested its sensitivity and specificity to pain versus warmth, assessed its specificity relative to social pain, and assessed the responsiveness of the measure to the analgesic remifentanil. The neurologic signature distinguished painful heat from nonpainful warmth, pain anticipation, and pain recall with sensitivity and specificity of 94% or more. The signature discriminated between painful heat and nonpainful warmth with 93% sensitivity and specificity. It also distinguished between physical pain and social pain with 85% sensitivity and 73% specificity. The strength of the signature response was substantially reduced after remifentanil administration.
Family history of late-onset Alzheimer’s disease is associated with an increased prevalence of an abnormal cerebral beta-amyloid and tau protein phenotype in patients with mild cognitive impairment (MCI), according to a study published on April 17 in PLOS One. Investigators studied 257 participants (ages 55 to 89) in the Alzheimer’s Disease Neuroimaging Initiative. Subjects were categorized as cognitively normal, having MCI, or having Alzheimer’s disease. Among patients with MCI, CSF Ab42 was lower, t-tau was higher, and t-tau–Ab42 ratio was higher in patients with a family history of Alzheimer’s disease than in patients without. A significant residual effect of family history on pathologic markers in MCI remained after adjusting for APOE e4. The effect of family history was not significant in patients with Alzheimer’s disease.
Most potential migraine triggers are so variable that it may not be possible to identify them without formal experimentation, according to a study published in the April issue of Headache. Investigators examined the similarity of day-to-day weather conditions over four years, as well as the similarity of ovarian hormones and perceived stress over a median of 89 days in nine patients with headache and regular menstrual cycles. A threshold of 90% similarity using Gower’s index identified similar days for comparison. The day-to-day variability in the three headache triggers was substantial enough that finding two naturally similar days for which to contrast the effect of a fourth trigger (eg, drinking wine) occurred infrequently. Fluctuations in weather patterns resulted in a median of 2.3 similar days each year.
Elevated low-density lipoprotein (LDL) cholesterol and altered cholesterol homeostasis may promote neurodegeneration, atherosclerosis, and Alzheimer’s disease by disrupting chromosome segregation, according to research published on April 12 in PLOS One. In a study of mice, investigators observed that high dietary cholesterol induced aneuploidy. In a separate study, the accumulation of intracellular cholesterol was associated with the accumulation of aneuploid fibroblasts, neurons, and glia in patients with Niemann-Pick C1. The researchers also observed that oxidized LDL, LDL, and cholesterol, but not high-density lipoprotein (HDL), induced chromosome mis-segregation and aneuploidy in cultured cells, including neuronal precursors. LDL-induced aneuploidy required the LDL receptor, but not Ab. Cholesterol treatment disrupted the structure of the mitotic spindle, providing a cell biologic mechanism for its aneugenic activity, and ethanol or calcium chelation attenuated lipoprotein-induced chromosome mis-segregation.
The incidence of dementia in central Stockholm may have decreased from the late 1980s to the early 2000s, according to research published online ahead of print April 17 in Neurology. Investigators analyzed data from two cross-sectional surveys of people ages 75 or older. One study was conducted from 1987 to 1989 and included 1,700 participants; the other was conducted from 2001 to 2004 and included 1,575 subjects. The team inferred the incidence of dementia according to its relationship with prevalence and survival. The adjusted odds ratio of dementia in the later study versus the earlier study was 1.17. The multiadjusted hazard ratio of death in the later study versus the earlier study was 0.71 in subjects with dementia, 0.68 in those without dementia, and 0.66 in all participants.
—Erik Greb
Senior Associate Editor
Promoting Professionalism
Unprofessional behavior in the inpatient setting has the potential to impact care delivery and the quality of trainee's educational experience. These behaviors, from disparaging colleagues to blocking admissions, can negatively impact the learning environment. The learning environment or conditions created by the patient care team's actions play a critical role in the development of trainees.[1, 2] The rising presence of hospitalists in the inpatient setting raises the question of how their actions impact the learning environment. Professional behavior has been defined as a core competency for hospitalists by the Society of Hospital Medicine.[3] Professional behavior of all team members, from faculty to trainee, can impact the learning environment and patient safety.[4, 5] However, few educational materials exist to train faculty and housestaff on recognizing and ameliorating unprofessional behaviors.
A prior assessment regarding hospitalists' lapses in professionalism identified scenarios that demonstrated increased participation by hospitalists at 3 institutions.[6] Participants reported observation or participation in specific unprofessional behaviors and rated their perception of these behaviors. Additional work within those residency environments demonstrated that residents' perceptions of and participation in these behaviors increased throughout training, with environmental characteristics, specifically faculty behavior, influencing trainee professional development and acclimation of these behaviors.[7, 8]
Although overall participation in egregious behavior was low, resident participation in 3 categories of unprofessional behavior increased during internship. Those scenarios included disparaging the emergency room or primary care physician for missed findings or management decisions, blocking or not taking admissions appropriate for the service in question, and misrepresenting a test as urgent to expedite obtaining the test. We developed our intervention focused on these areas to address professionalism lapses that occur during internship. Our earlier work showed faculty role models influenced trainee behavior. For this reason, we provided education to both residents and hospitalists to maximize the impact of the intervention.
We present here a novel, interactive, video‐based workshop curriculum for faculty and trainees that aims to illustrate unprofessional behaviors and outlines the role faculty may play in promoting such behaviors. In addition, we review the result of postworkshop evaluation on intent to change behavior and satisfaction.
METHODS
A grant from the American Board of Internal Medicine Foundation supported this project. The working group that resulted, the Chicago Professional Practice Project and Outcomes, included faculty representation from 3 Chicago‐area hospitals: the University of Chicago, Northwestern University, and NorthShore University HealthSystem. Academic hospitalists at these sites were invited to participate. Each site also has an internal medicine residency program in which hospitalists were expected to attend the teaching service. Given this, resident trainees at all participating sites, and 1 community teaching affiliate program (Mercy Hospital and Medical Center) where academic hospitalists at the University of Chicago rotate, were recruited for participation. Faculty champions were identified for each site, and 1 internal and external faculty representative from the working group served to debrief and facilitate. Trainee workshops were administered by 1 internal and external collaborator, and for the community site, 2 external faculty members. Workshops were held during established educational conference times, and lunch was provided.
Scripts highlighting each of the behaviors identified in the prior survey were developed and peer reviewed for clarity and face validity across the 3 sites. Medical student and resident actors were trained utilizing the finalized scripts, and a performance artist affiliated with the Screen Actors Guild assisted in their preparation for filming. All videos were filmed at the University of Chicago Pritzker School of Medicine Clinical Performance Center. The final videos ranged in length from 4 to 7 minutes and included title, cast, and funding source. As an example, 1 video highlighted the unprofessional behavior of misrepresenting a test as urgent to prioritize one's patient in the queue. This video included a resident, intern, and attending on inpatient rounds during which the resident encouraged the intern to misrepresent the patient's status to expedite obtaining the study and facilitate the patient's discharge. The resident stressed that he would be in the clinic and had many patients to see, highlighting the impact of workload on unprofessional behavior, and aggressively persuaded the intern to sell her test to have it performed the same day. When this occurred, the attending applauded the intern for her strong work.
A moderator guide and debriefing tools were developed to facilitate discussion. The duration of each of the workshops was approximately 60 minutes. After welcoming remarks, participants were provided tools to utilize during the viewing of each video. These checklists noted the roles of those depicted in the video, asked to identify positive or negative behaviors displayed, and included questions regarding how behaviors could be detrimental and how the situation could have been prevented. After viewing the videos, participants divided into small groups to discuss the individual exhibiting the unprofessional behavior, their perceived motivation for said behavior, and its impact on the team culture and patient care. Following a small‐group discussion, large‐group debriefing was performed, addressing the barriers and facilitators to professional behavior. Two videos were shown at each workshop, and participants completed a postworkshop evaluation. Videos chosen for viewing were based upon preworkshop survey results that highlighted areas of concern at that specific site.
Postworkshop paper‐based evaluations assessed participants' perception of displayed behaviors on a Likert‐type scale (1=unprofessional to 5=professional) utilizing items validated in prior work,[6, 7, 8] their level of agreement regarding the impact of video‐based exercises, and intent to change behavior using a Likert‐type scale (1=strongly disagree to 5=strongly agree). A constructed‐response section for comments regarding their experience was included. Descriptive statistics and Wilcoxon rank sum analyses were performed.
RESULTS
Forty‐four academic hospitalist faculty members (44/83; 53%) and 244 resident trainees (244/356; 68%) participated. When queried regarding their perception of the displayed behaviors in the videos, nearly 100% of faculty and trainees felt disparaging the emergency department or primary care physician for missed findings or clinical decisions was somewhat unprofessional or unprofessional. Ninety percent of hospitalists and 93% of trainees rated celebrating a blocked admission as somewhat unprofessional or unprofessional (Table 1).
| Behavior | Faculty Rated as Unprofessional or Somewhat Unprofessional (n = 44) | Housestaff Rated as Unprofessional or Somewhat Unprofessional (n=244) |
|---|---|---|
| ||
| Disparaging the ED/PCP to colleagues for findings later discovered on the floor or patient care management decisions | 95.6% | 97.5% |
| Refusing an admission that could be considered appropriate for your service (eg, blocking) | 86.4% | 95.1% |
| Celebrating a blocked admission | 90.1% | 93.0% |
| Ordering a routine test as urgent to get it expedited | 77.2% | 80.3% |
The scenarios portrayed were well received, with more than 85% of faculty and trainees agreeing that the behaviors displayed were realistic. Those who perceived videos as very realistic were more likely to report intent to change behavior (93% vs 53%, P=0.01). Nearly two‐thirds of faculty and 67% of housestaff expressed agreement that they intended to change behavior based upon the experience (Table 2).
| Evaluation Item | Faculty Level of Agreement (StronglyAgree or Agree) (n=44) | Housestaff Level of Agreement (Strongly Agree or Agree) (n=244) |
|---|---|---|
| The scenarios portrayed in the videos were realistic | 86.4% | 86.9% |
| I will change my behavior as a result of this exercise | 65.9% | 67.2% |
| I feel that this was a useful and effective exercise | 65.9% | 77.1% |
Qualitative comments in the constructed‐response portion of the evaluation noted the effectiveness of the interactive materials. In addition, the need for focused faculty development was identified by 1 respondent who stated: If unprofessional behavior is the unwritten curriculum, there needs to be an explicit, written curriculum to address it. Finally, the aim of facilitating self‐reflection is echoed in this faculty respondent's comment: Always good to be reminded of our behaviors and the influence they have on others and from this resident physician It helps to re‐evaluate how you talk to people.
CONCLUSIONS
Faculty can be a large determinant of the learning environment and impact trainees' professional development.[9] Hospitalists should be encouraged to embrace faculty role‐modeling of effective professional behaviors, especially given their increased presence in the inpatient learning environment. In addition, resident trainees and their behaviors contribute to the learning environment and influence the further professional development of more junior trainees.[10] Targeting professionalism education toward previously identified and prevalent unprofessional behaviors in the inpatient care of patients may serve to affect the most change among providers who practice in this setting. Individualized assessment of the learning environment may aid in identifying common scenarios that may plague a specific learning culture, allowing for relevant and targeted discussion of factors that promote and perpetuate such behaviors.[11]
Interactive, video‐based modules provided an effective way to promote interactive reflection and robust discussion. This model of experiential learning is an effective form of professional development as it engages the learner and stimulates ongoing incorporation of the topics addressed.[12, 13] Creating a shared concrete experience among targeted learners, using the video‐based scenarios, stimulates reflective observation, and ultimately experimentation, or incorporation into practice.[14]
There are several limitations to our evaluation including that we focused solely on academic hospitalist programs, and our sample size for faculty and residents was small. Also, we only addressed a small, though representative, sample of unprofessional behaviors and have not yet linked intervention to actual behavior change. Finally, the script scenarios that we used in this study were not previously published as they were created specifically for this intervention. Validity evidence for these scenarios include that they were based upon the results of earlier work from our institutions and underwent thorough peer review for content and clarity. Further studies will be required to do this. However, we do believe that these are positive findings for utilizing this type of interactive curriculum for professionalism education to promote self‐reflection and behavior change.
Video‐based professionalism education is a feasible, interactive mechanism to encourage self‐reflection and intent to change behavior among faculty and resident physicians. Future study is underway to conduct longitudinal assessments of the learning environments at the participating institutions to assess culture change, perceptions of behaviors, and sustainability of this type of intervention.
Disclosures: The authors acknowledge funding from the American Board of Internal Medicine. The funders had no role in the design of the study; the collection, analysis, and interpretation of the data; or the decision to approve publication of the finished manuscript. Results from this work have been presented at the Midwest Society of General Internal Medicine Regional Meeting, Chicago, Illinois, September 2011; Midwest Society of Hospital Medicine Regional Meeting, Chicago, Illinois, October 2011, and Society of Hospital Medicine Annual Meeting, San Diego, California, April 2012. The authors declare that they do not have any conflicts of interest to disclose.
- Liaison Committee on Medical Education. Functions and structure of a medical school. Available at: http://www.lcme.org/functions.pdf. Accessed October 10, 2012.
- , , , , . Residents' perceptions of their own professionalism and the professionalism of their learning environment. J Grad Med Educ. 2009;1:208–215.
- Society of Hospital Medicine. The core competencies in hospital medicine. http://www.hospitalmedicine.org/Content/NavigationMenu/Education/CoreCurriculum/Core_Competencies.htm. Accessed October 10, 2012.
- The Joint Commission. Behaviors that undermine a culture of safety. Sentinel Event Alert. 2008;(40):1–3. http://www.jointcommission.org/assets/1/18/SEA_40.pdf. Accessed October 10, 2012.
- , . A survey of the impact of disruptive behaviors and communication defects on patient safety. Jt Comm J Qual Patient Saf. 2008;34:464–471.
- , , , et al. Participation in unprofessional behaviors among hospitalists: a multicenter study. J Hosp Med. 2012;7(7):543–550.
- , , et al. Participation in and perceptions of unprofessional behaviors among incoming internal medicine interns. JAMA. 2008;300:1132–1134.
- , , , et al., Changes in perception of and participation in unprofessional behaviors during internship. Acad Med. 2010;85:S76–S80.
- , , , et al. Perspective: beyond counting hours: the importance of supervision, professionalism, transitions of care, and workload in residency training. Acad Med. 2012;87(7):883–888.
- , . The role of the student‐teacher relationship in the formation of physicians: the hidden curriculum as process. J Gen Intern Med. 2006;21:S16–S20.
- , , , et al. Evidence for validity of a survey to measure the learning environment for professionalism. Med Teach. 2011;33(12):e683–e688.
- . Experiential Learning: Experience as the Source of Learning and Development. Englewood Cliffs, NJ: Prentice Hall; 1984.
- , . How can physicians' learning style drive educational planning? Acad Med. 2005;80:680–84.
- , . Twenty years of experience using trigger films as a teaching tool. Acad Med. 2001;76:656–658.
Unprofessional behavior in the inpatient setting has the potential to impact care delivery and the quality of trainee's educational experience. These behaviors, from disparaging colleagues to blocking admissions, can negatively impact the learning environment. The learning environment or conditions created by the patient care team's actions play a critical role in the development of trainees.[1, 2] The rising presence of hospitalists in the inpatient setting raises the question of how their actions impact the learning environment. Professional behavior has been defined as a core competency for hospitalists by the Society of Hospital Medicine.[3] Professional behavior of all team members, from faculty to trainee, can impact the learning environment and patient safety.[4, 5] However, few educational materials exist to train faculty and housestaff on recognizing and ameliorating unprofessional behaviors.
A prior assessment regarding hospitalists' lapses in professionalism identified scenarios that demonstrated increased participation by hospitalists at 3 institutions.[6] Participants reported observation or participation in specific unprofessional behaviors and rated their perception of these behaviors. Additional work within those residency environments demonstrated that residents' perceptions of and participation in these behaviors increased throughout training, with environmental characteristics, specifically faculty behavior, influencing trainee professional development and acclimation of these behaviors.[7, 8]
Although overall participation in egregious behavior was low, resident participation in 3 categories of unprofessional behavior increased during internship. Those scenarios included disparaging the emergency room or primary care physician for missed findings or management decisions, blocking or not taking admissions appropriate for the service in question, and misrepresenting a test as urgent to expedite obtaining the test. We developed our intervention focused on these areas to address professionalism lapses that occur during internship. Our earlier work showed faculty role models influenced trainee behavior. For this reason, we provided education to both residents and hospitalists to maximize the impact of the intervention.
We present here a novel, interactive, video‐based workshop curriculum for faculty and trainees that aims to illustrate unprofessional behaviors and outlines the role faculty may play in promoting such behaviors. In addition, we review the result of postworkshop evaluation on intent to change behavior and satisfaction.
METHODS
A grant from the American Board of Internal Medicine Foundation supported this project. The working group that resulted, the Chicago Professional Practice Project and Outcomes, included faculty representation from 3 Chicago‐area hospitals: the University of Chicago, Northwestern University, and NorthShore University HealthSystem. Academic hospitalists at these sites were invited to participate. Each site also has an internal medicine residency program in which hospitalists were expected to attend the teaching service. Given this, resident trainees at all participating sites, and 1 community teaching affiliate program (Mercy Hospital and Medical Center) where academic hospitalists at the University of Chicago rotate, were recruited for participation. Faculty champions were identified for each site, and 1 internal and external faculty representative from the working group served to debrief and facilitate. Trainee workshops were administered by 1 internal and external collaborator, and for the community site, 2 external faculty members. Workshops were held during established educational conference times, and lunch was provided.
Scripts highlighting each of the behaviors identified in the prior survey were developed and peer reviewed for clarity and face validity across the 3 sites. Medical student and resident actors were trained utilizing the finalized scripts, and a performance artist affiliated with the Screen Actors Guild assisted in their preparation for filming. All videos were filmed at the University of Chicago Pritzker School of Medicine Clinical Performance Center. The final videos ranged in length from 4 to 7 minutes and included title, cast, and funding source. As an example, 1 video highlighted the unprofessional behavior of misrepresenting a test as urgent to prioritize one's patient in the queue. This video included a resident, intern, and attending on inpatient rounds during which the resident encouraged the intern to misrepresent the patient's status to expedite obtaining the study and facilitate the patient's discharge. The resident stressed that he would be in the clinic and had many patients to see, highlighting the impact of workload on unprofessional behavior, and aggressively persuaded the intern to sell her test to have it performed the same day. When this occurred, the attending applauded the intern for her strong work.
A moderator guide and debriefing tools were developed to facilitate discussion. The duration of each of the workshops was approximately 60 minutes. After welcoming remarks, participants were provided tools to utilize during the viewing of each video. These checklists noted the roles of those depicted in the video, asked to identify positive or negative behaviors displayed, and included questions regarding how behaviors could be detrimental and how the situation could have been prevented. After viewing the videos, participants divided into small groups to discuss the individual exhibiting the unprofessional behavior, their perceived motivation for said behavior, and its impact on the team culture and patient care. Following a small‐group discussion, large‐group debriefing was performed, addressing the barriers and facilitators to professional behavior. Two videos were shown at each workshop, and participants completed a postworkshop evaluation. Videos chosen for viewing were based upon preworkshop survey results that highlighted areas of concern at that specific site.
Postworkshop paper‐based evaluations assessed participants' perception of displayed behaviors on a Likert‐type scale (1=unprofessional to 5=professional) utilizing items validated in prior work,[6, 7, 8] their level of agreement regarding the impact of video‐based exercises, and intent to change behavior using a Likert‐type scale (1=strongly disagree to 5=strongly agree). A constructed‐response section for comments regarding their experience was included. Descriptive statistics and Wilcoxon rank sum analyses were performed.
RESULTS
Forty‐four academic hospitalist faculty members (44/83; 53%) and 244 resident trainees (244/356; 68%) participated. When queried regarding their perception of the displayed behaviors in the videos, nearly 100% of faculty and trainees felt disparaging the emergency department or primary care physician for missed findings or clinical decisions was somewhat unprofessional or unprofessional. Ninety percent of hospitalists and 93% of trainees rated celebrating a blocked admission as somewhat unprofessional or unprofessional (Table 1).
| Behavior | Faculty Rated as Unprofessional or Somewhat Unprofessional (n = 44) | Housestaff Rated as Unprofessional or Somewhat Unprofessional (n=244) |
|---|---|---|
| ||
| Disparaging the ED/PCP to colleagues for findings later discovered on the floor or patient care management decisions | 95.6% | 97.5% |
| Refusing an admission that could be considered appropriate for your service (eg, blocking) | 86.4% | 95.1% |
| Celebrating a blocked admission | 90.1% | 93.0% |
| Ordering a routine test as urgent to get it expedited | 77.2% | 80.3% |
The scenarios portrayed were well received, with more than 85% of faculty and trainees agreeing that the behaviors displayed were realistic. Those who perceived videos as very realistic were more likely to report intent to change behavior (93% vs 53%, P=0.01). Nearly two‐thirds of faculty and 67% of housestaff expressed agreement that they intended to change behavior based upon the experience (Table 2).
| Evaluation Item | Faculty Level of Agreement (StronglyAgree or Agree) (n=44) | Housestaff Level of Agreement (Strongly Agree or Agree) (n=244) |
|---|---|---|
| The scenarios portrayed in the videos were realistic | 86.4% | 86.9% |
| I will change my behavior as a result of this exercise | 65.9% | 67.2% |
| I feel that this was a useful and effective exercise | 65.9% | 77.1% |
Qualitative comments in the constructed‐response portion of the evaluation noted the effectiveness of the interactive materials. In addition, the need for focused faculty development was identified by 1 respondent who stated: If unprofessional behavior is the unwritten curriculum, there needs to be an explicit, written curriculum to address it. Finally, the aim of facilitating self‐reflection is echoed in this faculty respondent's comment: Always good to be reminded of our behaviors and the influence they have on others and from this resident physician It helps to re‐evaluate how you talk to people.
CONCLUSIONS
Faculty can be a large determinant of the learning environment and impact trainees' professional development.[9] Hospitalists should be encouraged to embrace faculty role‐modeling of effective professional behaviors, especially given their increased presence in the inpatient learning environment. In addition, resident trainees and their behaviors contribute to the learning environment and influence the further professional development of more junior trainees.[10] Targeting professionalism education toward previously identified and prevalent unprofessional behaviors in the inpatient care of patients may serve to affect the most change among providers who practice in this setting. Individualized assessment of the learning environment may aid in identifying common scenarios that may plague a specific learning culture, allowing for relevant and targeted discussion of factors that promote and perpetuate such behaviors.[11]
Interactive, video‐based modules provided an effective way to promote interactive reflection and robust discussion. This model of experiential learning is an effective form of professional development as it engages the learner and stimulates ongoing incorporation of the topics addressed.[12, 13] Creating a shared concrete experience among targeted learners, using the video‐based scenarios, stimulates reflective observation, and ultimately experimentation, or incorporation into practice.[14]
There are several limitations to our evaluation including that we focused solely on academic hospitalist programs, and our sample size for faculty and residents was small. Also, we only addressed a small, though representative, sample of unprofessional behaviors and have not yet linked intervention to actual behavior change. Finally, the script scenarios that we used in this study were not previously published as they were created specifically for this intervention. Validity evidence for these scenarios include that they were based upon the results of earlier work from our institutions and underwent thorough peer review for content and clarity. Further studies will be required to do this. However, we do believe that these are positive findings for utilizing this type of interactive curriculum for professionalism education to promote self‐reflection and behavior change.
Video‐based professionalism education is a feasible, interactive mechanism to encourage self‐reflection and intent to change behavior among faculty and resident physicians. Future study is underway to conduct longitudinal assessments of the learning environments at the participating institutions to assess culture change, perceptions of behaviors, and sustainability of this type of intervention.
Disclosures: The authors acknowledge funding from the American Board of Internal Medicine. The funders had no role in the design of the study; the collection, analysis, and interpretation of the data; or the decision to approve publication of the finished manuscript. Results from this work have been presented at the Midwest Society of General Internal Medicine Regional Meeting, Chicago, Illinois, September 2011; Midwest Society of Hospital Medicine Regional Meeting, Chicago, Illinois, October 2011, and Society of Hospital Medicine Annual Meeting, San Diego, California, April 2012. The authors declare that they do not have any conflicts of interest to disclose.
- Liaison Committee on Medical Education. Functions and structure of a medical school. Available at: http://www.lcme.org/functions.pdf. Accessed October 10, 2012.
- , , , , . Residents' perceptions of their own professionalism and the professionalism of their learning environment. J Grad Med Educ. 2009;1:208–215.
- Society of Hospital Medicine. The core competencies in hospital medicine. http://www.hospitalmedicine.org/Content/NavigationMenu/Education/CoreCurriculum/Core_Competencies.htm. Accessed October 10, 2012.
- The Joint Commission. Behaviors that undermine a culture of safety. Sentinel Event Alert. 2008;(40):1–3. http://www.jointcommission.org/assets/1/18/SEA_40.pdf. Accessed October 10, 2012.
- , . A survey of the impact of disruptive behaviors and communication defects on patient safety. Jt Comm J Qual Patient Saf. 2008;34:464–471.
- , , , et al. Participation in unprofessional behaviors among hospitalists: a multicenter study. J Hosp Med. 2012;7(7):543–550.
- , , et al. Participation in and perceptions of unprofessional behaviors among incoming internal medicine interns. JAMA. 2008;300:1132–1134.
- , , , et al., Changes in perception of and participation in unprofessional behaviors during internship. Acad Med. 2010;85:S76–S80.
- , , , et al. Perspective: beyond counting hours: the importance of supervision, professionalism, transitions of care, and workload in residency training. Acad Med. 2012;87(7):883–888.
- , . The role of the student‐teacher relationship in the formation of physicians: the hidden curriculum as process. J Gen Intern Med. 2006;21:S16–S20.
- , , , et al. Evidence for validity of a survey to measure the learning environment for professionalism. Med Teach. 2011;33(12):e683–e688.
- . Experiential Learning: Experience as the Source of Learning and Development. Englewood Cliffs, NJ: Prentice Hall; 1984.
- , . How can physicians' learning style drive educational planning? Acad Med. 2005;80:680–84.
- , . Twenty years of experience using trigger films as a teaching tool. Acad Med. 2001;76:656–658.
Chest Tube Management
A pneumothorax is a collection of air in the space outside the lungs that is trapped within the thorax. This abnormality can occur spontaneously or as the result of trauma. Traumatic pneumothoraces include those resulting from medical interventions such as a transthoracic and transbronchial needle biopsy, central line placement, and positive‐pressure mechanical ventilation. This group is most accurately described as iatrogenic pneumothorax (IP).[1]
IP can be an expected complication of many routine thoracic procedures, but it can also occur accidentally during procedures near the lung or thoracic cavity. Some IPs may be asymptomatic and go undiagnosed, or their diagnosis may be delayed.[2] The majority of iatrogenic pneumothoraces will resolve without complications, and patients will not require medical attention. A small percentage can, however, expand and have the potential to develop into a tension pneumothorax causing severe respiratory distress and mediastinal shift.[3, 4]
The incidence of IP ranges from 0.11% with mechanical ventilation to 2.68% with thoracentesis, according to an analysis of 7.5 million uniform hospital discharge abstracts from 2000.5 A 2010 systematic review of 24 studies that included 6605 patients suggested a 6.0% incidence of pneumothorax following thoracentesis.[3] The highest risk of IP is seen with computed tomography (CT)‐guided lung biopsy, with 1 series of 1098 biopsies showing a 42% incidence; chest tube evacuation was required in 12% of these cases.[4] A Veterans Administration study of patient safety indicators from 2001 to 2004 found that risk‐adjusted rates of IP were increasing over time.[6] It is unclear whether this increase is due to increasing numbers of interventional procedures or to better rates of detection. IP poses a considerable cost to the medical system, with safety studies finding that patients with IP will stay in the hospital approximately 4 days longer and incur an additional $17,000 in charges.[7]
In addition to this financial burden, the lack of consistency in training and guidelines for management of pneumothorax is thought to add to chest tube‐related complications.[8] In 2001, the American College of Chest Physicians (ACCP) published guidelines for the management of spontaneous pneumothorax that do not specifically address IP.[9] In 2010, the British Thoracic Society (BTS) updated their guidelines and included a brief statement on IP that described a higher incidence for it than for spontaneous pneumothorax and noted its relative ease of management.[10] Despite the lack of specific guidelines dedicated to IPs, common clinical practice is to manage iatrogenic defects in a manner similar to that for spontaneous ones. However, studies have shown that the management of pneumothorax remains diverse and that the adherence to these published guidelines is suboptimal.[10, 11] The BTS guidelines favor needle aspiration as the first‐line treatment,[10] whereas the ACCP recommends drainage with catheters over aspiration.[9]
The possibility of this complication, along with the rising rate of invasive interventions being performed, has led to expanded surveillance criteria for IP. Surveillance imaging, clinical observation, or a combination of the 2 may be required, depending on the institution, the risk of the procedure, and the preference of the treating clinician. The algorithms presented here were designed in alignment with both major society guidelines and with the intention of simplifying the treatment regimen for the ease of adoption by hospitalists.
ETIOLOGY AND RISK FACTORS
The etiology and risk factors for IP are multiple, with the most common being interventional‐based procedures. In 535 Veterans Administration patients, the most common precursor procedures were transthoracic needle biopsy (24%), subclavian vein catheterization (22%), thoracentesis (20%), transbronchial biopsy (10%), pleural biopsy (8%), and positive pressure ventilation.[12] IP can also be a rare complication of pacemaker manipulations,[5] and less commonly, bronchoscopy.[13] Patient factors that increase the risk of pneumothorax in the setting of an intervention include age, chronic obstructive lung disease, primary lung cancer, malignant and parapneumonic pleural effusions, empyema, and chronic corticosteroid use.[4] As might be expected, patients with structural lung disease (eg, emphysema with bullae) and poor healing ability (eg, corticosteroid dependent), tend to have IPs more often and to require more complicated interventions for resolution.[14, 15] In some studies, operator experience seems to be inversely related to the rate of IP, and the use of ultrasound is correlated with lower rates of this complication.[1, 3]
PATIENT PRESENTATIONS AND DIAGNOSIS
Clinical signs and symptoms of a significant pneumothorax vary in severity but most often include dyspnea, tachypnea, chest pain, and pleurisy (see Box 1). Post procedure signs or symptoms require further evaluation with imaging, usually a plain chest radiograph. CT can be useful for further evaluation. Small anterior pneumothoraces may be difficult to detect without lateral radiographic imaging or computed tomogram. Ultrasound is being used more frequently at the bedside to make this diagnosis, and various studies of trauma patients have found that it has good sensitivity and specificity.[16, 17] These results have been validated by a recent meta‐analysis comparing ultrasound to chest radiographs for the detection of pneumothorax among trauma, critically ill, and postprocedural patients.[18] This study demonstrated superior sensitivity and similar specificity for ultrasound versus chest radiographs for detection of pneumothorax. More ominous signs, such as tachycardia or hypotension, can be indicative of tension pneumothorax, which requires emergent evacuation.
MANAGEMENT
Once the diagnosis of pneumothorax has been established, treatment options should be guided by defect size and clinical assessment following a defined treatment algorithm (Figure 1). As emphasized by the BTS and ACCP guidelines, we advocate considering the use of symptoms along with defect size to determine the best management course.

Observation
Defects that involve<20% of the hemithorax in a patient who is clinically asymptomatic and hemodynamically stable can be safely managed by oxygen supplementation and hospital observation. Repeat imaging can be obtained after 12 to 24 hours of defect detection or with symptom change. Patients who display resolution may be discharged home.
Patients who show persistence without progression but are asymptomatic may also be discharged safely, with follow‐up imaging and clinical evaluation 48 hours later.[9, 10] This was demonstrated by Kelly and colleagues,[19] who described the outcomes of 154 patients in a retrospective cohort study. Of the 91 patients treated with outpatient observation, 82 resolved without additional interventions. A recent review article by the same author cites conservative management of small pneumothoraces as being widely accepted.[20] If reimaging shows progression of defect or if the patient becomes more symptomatic, the pneumothorax should be evacuated by 1 of the methods described below.
Aspiration
Aspiration is defined by the ACCP Delphi consensus statement as the removal of pleural air via needle or cannula followed by immediate removal of needle or cannula.[9] This option mandates careful patient selection. It should be considered for small pneumothoraces that cause only mild dyspnea in patients who have no known parenchymal disease. These patients should be observed overnight in the hospital and reimaged 24 hours after aspiration of the pneumothorax. Several authors have reported success with aspiration alone. Yamagami et al.[21] noted the efficacy of manual aspiration immediately after CT‐guided biopsy, with a success rate exceeding 90%. They also noted that evacuated volumes >543 mL correlated with the need for further intervention with a chest tube. This technique is advocated for small pneumothoraces that are recognized shortly after the procedure.
Similarly, Delius and colleagues[22] managed 131 pneumothoraces with aspiration as an alternative to chest tube placement. Of these, 79 were iatrogenic. Aspiration achieved a 75% success rate for all IPs. Small defects defined as <20% of volume had an even higher resolution rate of 87%. Similar findings were demonstrated by Talbot‐Stern et al.[23] in their prospective study of 76 pneumothoraces. Among those that were iatrogenic, 82% resolved after simple aspiration. Faruqi et al.[24] also showed that aspiration is a viable option for IPs. Of the 57 patients with pneumothorax included in their study, 35 were treated with aspiration alone. Iatrogenesis was the culprit in 12 of the 35 manually aspirated cases. Aspiration achieved a success rate of 91.7% in IP. A recent Cochrane database systematic review compared simple aspiration with intercostal tube drainage for primary spontaneous pneumothorax.[25] The authors reported no difference between these methods in terms of success rate, early failure rate, duration of hospital stay, 1‐year success rate, or number of patients who required pleurodesis at 1‐year follow‐up.
Because the algorithms presented in this article were specifically designed for the use by hospitalists, we intentionally omitted aspiration from the decision trees. Most hospitalists would not be expected to evacuate IPs. However, knowledge regarding this option and appropriate follow‐up are valuable to internists, because many interventionalists admit patients to the hospital service for overnight observation. An asymptomatic postaspiration patient, who on subsequent imaging demonstrates resolution or persistence without progression of pneumothorax, may be discharged with 48‐hour follow‐up.
Placement of Catheter or Chest Tube Drainage
Most patients with a clinically significant pneumothorax will require evacuation of the air. Pneumothoraces larger than 20% or that produce symptoms warrant chest tube management and inpatient observation (Figure 1B). Traditionally, large tubes with 20 cm of water on continuous suction are used and have been studied the most widely. Several authors have shown that smaller tubes can effectively drain a pneumothorax.[26, 27, 28, 29] Small‐bore catheters (8F14F), which can be inserted percutaneously, have been shown to provide effective lung re‐expansion with minimal morbidity[8] and may be better tolerated by patients with uncomplicated pneumothoraces (Figure 2). Terzi and colleagues[30] have shown that smaller tubes cause less discomfort to patients at rest, with cough, and at the time of tube removal.
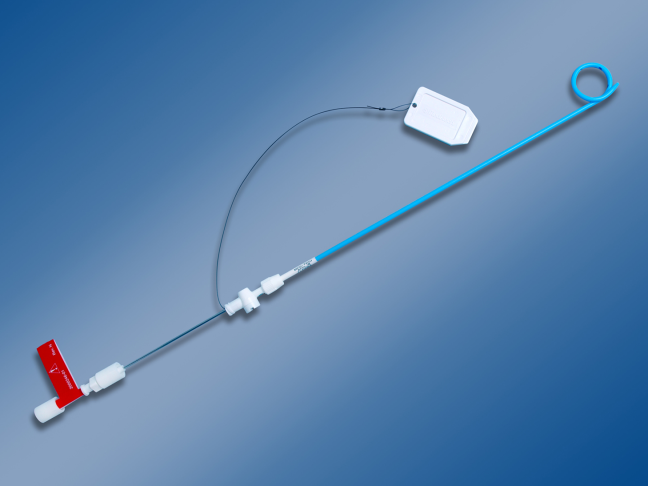
At most US institutions, catheters and chest tubes are connected to all‐purpose drainage systems. Although commercially available through a variety of manufacturers, they share similar design principles because they replicate the 3‐bottle system described in detail elsewhere in the literature.[31] We have limited our discussion to 3 pleural evacuation systems because it is our intention to familiarize hospitalists with the units that they are most likely to encounter. The first 2 systems have been studied and described by Baumann and colleagues[32] as being commonplace and reasonably reliable. These include the Oasis (Atrium Medical Corp., Hudson, NH) (Figure 3A) and the Pleur‐evac (Teleflex Inc., Limerick, PA). The third unit is the Thopaz digital thoracic drainage system (Medela Inc., McHenry, IL) (Figure 3B). The Thopaz is unique in its inclusion of a suction source and digital capability. Although it utilizes the same principles of all pleural evacuation devices, its setup and information output require that one be familiar with its digital format.
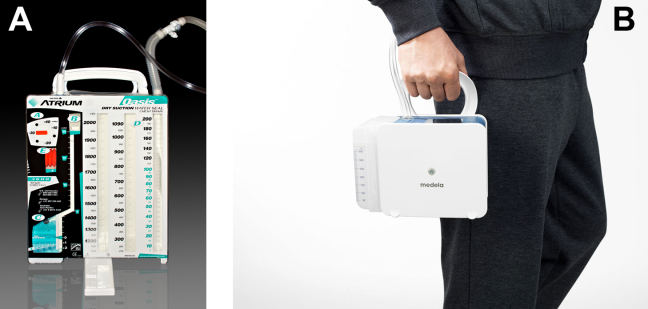
Suction Versus Water Seal
The chest tube should be placed initially to a suction pressure level of 20 cm of water for 24 hours to maximize lung expansion and evacuate all extrapulmonary air. Suction pressure is set on the Pleur‐evac and Atrium drainage systems by a manual dial that reads to a water pressure of 0 to 40 cm. The default setting from the manufacturer is 20 cm of water. This level of suction is present only when the drainage system is connected to a wall or a portable suction device. The only confirmation of suction presence in the Atrium system is the deployment of the orange bellows (located under the dial) to the level of the arrow tip (Figure 3A). The Pleur‐evac system has a red stripe along the circular edge of the dial that appears at the set level of suction when negative pressure is being applied. It is important to be aware that when patients are disconnected from the wall or the portable suction apparatus, they are on water seal or gravity. These terms are synonymous with no suction. On the Thopaz, a digital menu directs operation, and levels of suction can be selected from water seal (no suction) up to 40 cm of water. We recommend using suction to 20 cm of water given the scarce evidence supporting higher levels of negative pressure. Some clinicians prefer placing patients on water seal for some time before moving toward tube discontinuance, but this is a matter of preference, and no substantial evidence exists to show that any 1 method is superior.[8, 33]
Assessing for Air Leak
If there is improvement or resolution of the pneumothorax after 24 hours, the presence of an air leak should be assessed; if no leak is present, the chest tube can be safely removed. In the context of chest tubes, the term air leak refers to residual air between the lung and the chest wall. It is possible to see resolution of a pneumothorax on chest radiographs and still have an air leak. This situation is created by a perfect balance between the pleural air evacuation by the catheter and the flow of air exiting from the lung puncture. This would result in reaccumulation of the pneumothorax if the chest tube is removed prematurely. It should also be kept in mind that chest radiographs may miss a small pneumothorax given their relatively low sensitivity.[18] Therefore, the absence of an air leak needs to be documented before the chest tube is discontinued. Depending on the type of drainage system (Atrium, Pleur‐evac, or Thopaz), this assessment can be done in several ways. All systems can be assessed for air leak by clamping the actual chest tube for 2 to 4 hours and then repeating the chest radiograph. Clamping a chest tube simulates the condition of not having a chest tube. Chest tubes should never be clamped without supervision and only with the knowledge of nursing personnel. The onset of chest pain or dyspnea in a patient with a clamped tube mandates immediate removal of the clamp and a return to suction. A repeat chest radiograph showing reaccumulation or expansion of the pneumothorax after clamping indicates that the air leak has not resolved and the chest tube must remain in place and returned to suction. Simpler and more time‐efficient methods of detecting air leaks are available with both cardiothoracic drainage systems.
For the Atrium and Pleur‐evac models, there is a graded panel through which one can visualize air leaks being funneled through water (Figure 4A). Having the patient cough several times or perform a Valsalva maneuver should release any air trapped within the chest into this chamber, where bubbles can be visualized as they travel through the water. The presence of bubbles indicates the presence of residual air in the chest, pointing to a possible leak. In contrast, the Thopaz system offers a graphical display of the air flowing into the system that can be reviewed over the 24‐hour period. When the graph line reaches a 0 flatline graph, no airflow is being detected and no air leakage is suspected (Figure 4B). If no air leaks are detected, the chest tube may be discontinued. Those patients with a failed air leak test should have their chest tubes continued under suction for another 24 hours, with the above tests then repeated. The same holds true for those patients with persistent pneumothorax at 24 hours.
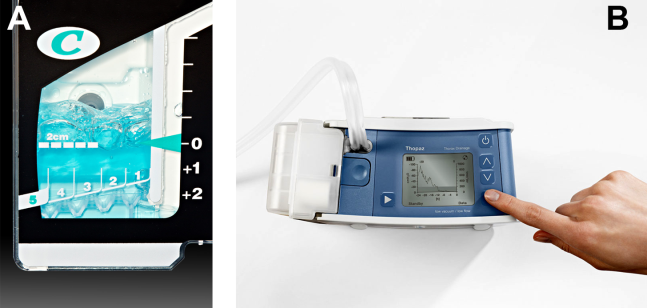
Removal of chest tubes is a simple process that requires the tube to be pulled out of the patient without allowing air to enter the site where the tube was present and where it entered the thorax. Most interventionalists will discontinue the tubes that they have placed. Some small catheters have an internal string that has to be released so the catheter will straighten and pull out easily. Knowledge of the type of catheter or tube that was placed is critical before removal to prevent complications and patient discomfort. Standard chest tubes are straight, smooth plastic and pull out easily but require rapid occlusion of the larger puncture site in the chest wall with an occlusive dressing that often includes petroleum or water‐soluble gel. Some physicians will leave a suture tie when placing the chest tube so that it can be tied down to occlude the site instead of using a dressing.
Consultation of the Cardiothoracic Surgeon or Interventional Pulmonologist
We recommend the involvement of cardiothoracic surgery or interventional pulmonology for patients with nonresolving pneumothorax lasting longer than 48 hours because additional procedures may be necessary. One of the rare but serious complications of a persistent pneumothorax is the formation of a bronchopleural fistula. This communication between the bronchial tree and the pleural space can lead to significant morbidity and mortality. The treatment of a bronchopleural fistula includes medical and surgical options that are beyond the scope of this article but require the expertise of a cardiothoracic surgeon or interventional pulmonologist.[34] Most patients who will not require additional procedures will heal within 48 hours.[11, 35] Decisions regarding more invasive treatment measures can then be made as necessary.[26]
PRACTICAL TIPS
Hospitalists caring for patients with chest tubes are often asked to troubleshoot at the bedside. Scenarios that may be encountered include nonfunctioning tubes, catheter migration, and tube discomfort. Ensuring patency of the tube entails visualizing the tube from the point of entry into the chest wall to the collection chamber and inspecting for kinks or debris clogging the tube. Smaller catheters can be easily kinked during patient positioning and can become clogged. Respiratory variation, which is the movement of the column of fluid in the collection chamber or in the tubing with inspiration and expiration, suggests that the chest tube is patent. This should be part of the daily examination in a patient with a chest tube, and it should also be the first step in assessing sudden dyspnea, hypoxia, pain, or hemodynamic instability. Clogged tubes should be referred to the interventionalists or other physicians who placed them. Chest tubes are typically sutured at the site of entry and securely bandaged to avoid migration but occasionally can be dislodged. This should prompt placement of another tube by an experienced operator. Last, chest tubes can be uncomfortable for patients who may require systemic analgesics. Additionally, tube positioning may ease some of the discomfort. Chest tubes are commonly placed along the midaxillary line and the posterior thorax, leading to discomfort in the recumbent position. Directing the tube anteriorly helps ease some of the discomfort. This can be done using all‐purpose sponges to build a barrier between the skin and the chest tube as it is directed anteriorly. Additional sponges are placed above the tube for extra protection. The gentle curve accomplished by padding the underside of the tube also keeps the tube patent by avoiding sharp kinks as the catheter exits the thorax.
FUTURE TRENDS
Future trends in the management of IP may include shorter duration of tube management (14 hours of suction with air leak evaluation and removal) and the use of even smaller catheters. Outpatient management of IP with small pigtail catheters or small‐caliber tubes in addition to 1‐way valves is also being investigated. The benefits of these practices may include greater patient comfort and lower cost. These approaches will need larger‐scale replication and careful patient selection before they become standard practice.[28, 36]
Ultrasound can be used to assess the presence and size of pneumothoraces that are difficult to visualize by standard chest radiographs. Several studies have established ultrasonography as an effective method of diagnosing pneumothorax and have shown it to have superior sensitivity compared with chest radiography.[1, 18] In the future, the use of ultrasound will likely be more widespread given its performance, portability, ease of use, and relatively low cost.
SUMMARY
IP is a known and costly complication of many medical procedures. The aforementioned algorithms help simplify the management of chest tubes for hospitalists caring for patients with this common complication. This stepwise approach may not only help curtail added expenses related to IPs by decreasing the length of inpatient stays but may also improve patient satisfaction.
Acknowledgments
Disclosure: Mayo does not endorse the products mentioned in this article. The authors report no conflicts of interest.
Box
Clinical Signs and Symptoms of Pneumothorax
Dyspnea
Pleuritic chest pain
Tachypnea
Hypoxia
Decreased breath sounds on affected side
Hyper‐resonant percussion on affected side
Subcutaneous emphysema
- , . Management of pneumothorax. Semin Respir Crit Care Med. 2010;31(6):769–780.
- , . Pneumothorax. Respirology. 2004;9(2):157–164.
- , , , . Pneumothorax following thoracentesis: a systematic review and meta‐analysis. Arch Intern Med. 2010;170(4):332–339.
- , , , et al. Incidence of and risk factors for pneumothorax and chest tube placement after CT fluoroscopy‐guided percutaneous lung biopsy: retrospective analysis of the procedures conducted over a 9‐year period. AJR Am J Roentgenol. 2010;194(3):809–814.
- , , . Accidental iatrogenic pneumothorax in hospitalized patients. Med Care. 2006;44(2):182–186.
- , , , et al. Tracking rates of patient safety indicators over time: lessons from the Veterans Administration. Med Care. 2006;44(9):850–861.
- , . Excess length of stay, charges, and mortality attributable to medical injuries during hospitalization. JAMA. 2003;290(14):1868–1874.
- , , , , . Preliminary report of a prospective, randomized trial of underwater seal for spontaneous and iatrogenic pneumothorax. J Am Coll Surg. 2007;204(1):84–90.
- , , , et al.; AACP Pneumothorax Consensus Group. Management of spontaneous pneumothorax: an American College of Chest Physicians Delphi consensus statement. Chest. 2001;119(2):590–602.
- , , ; BTS Pleural Disease Guideline Group. Management of spontaneous pneumothorax: British Thoracic Society Pleural Disease Guideline 2010. Thorax. 2010;65(suppl 2):ii18–ii31.
- , . The clinician's perspective on pneumothorax management. Chest. 1997;112(3):822–828.
- , , , . Iatrogenic pneumothorax: etiology and morbidity: results of a Department of Veterans Affairs Cooperative Study. Respiration. 1992;59(4):215–220.
- , , , , , . Severe complications of bronchoscopy. Respiration. 2008;76(4):429–433.
- , , , et al. Incidence and risk factors of delayed pneumothorax after transthoracic needle biopsy of the lung. Chest. 2004;126(5):1516–1521.
- , , , , , . Factors associated with pneumothorax and pneumothorax requiring treatment after percutaneous lung biopsy in 443 consecutive patients. J Vasc Interv Radiol. 2004;15(5):479–483.
- , . Ultrasound detection of pneumothorax compared with chest X‐ray and computed tomography scan. Am Surg. 2011;77(4):480–484.
- , . Sensitivity of bedside ultrasound and supine anteroposterior chest radiographs for the identification of pneumothorax after blunt trauma. Acad Emerg Med. 2010;17(1):11–17.
- , , , , . Diagnosis of pneumothorax by radiography and ultrasonography: a meta‐analysis. Chest. 2011;140(4):859–866.
- , , . Outcomes of emergency department patients treated for primary spontaneous pneumothorax. Chest. 2008;134(5):1033–1036.
- . Review of management of primary spontaneous pneumothorax: is the best evidence clearer 15 years on? Emerg Med Australas. 2007;19(4):303–308.
- , , , , , . Efficacy of manual aspiration immediately after complicated pneumothorax in CT‐guided lung biopsy. J Vasc Interv Radiol. 2005;16(4):477–483.
- , , , , , . Catheter aspiration for simple pneumothorax: experience with 114 patients. Arch Surg. 1998;124(7):833–836.
- , , , , . Catheter aspiration for simple pneumothorax. J Emerg Med. 1986;4(6):437–442.
- , , , . Role of simple needle aspiration in the management of pneumothorax. Indian J Chest Dis Allied Sci. 2004;46(3):183–190.
- , , . Simple aspiration versus intercostal tube drainage for primary spontaneous pneumothorax in adults. Cochrane Database Syst Rev. 2007;(1):CD004479.
- , , , . Evaluation of conventional chest tube therapy for iatrogenic pneumothorax. Chest. 1993;104(6):1770–1772.
- , , , . Outpatient treatment of iatrogenic pneumothorax after needle biopsy. Radiology. 1997;205(1):249–252.
- , , , , , . Outpatient management of postbiopsy pneumothorax with small‐caliber chest tubes: factors affecting the need for prolonged drainage and additional interventions. Cardiovasc Intervent Radiol. 2008;31(2):342–348.
- , . Management of primary and secondary pneumothorax using a small‐bore thoracic catheter. Interact Cardiovasc Thorac Surg. 2010;11(2):146–149.
- , , , et al. The use of flexible spiral drains after non‐cardiac thoracic surgery: a clinical study. Eur J Cardiothorac Surg. 2005;27(1):134–137.
- . Pleural Diseases. 5th ed. Philadelphia: PA: Lippincott Williams 2007.
- , , , . Comparison of function of commercially available pleural drainage units and catheters. Chest. 2003;123(6):1878–1886.
- , . Catheter drainage of spontaneous pneumothorax: suction or no suction, early or late removal? Thorax. 1982;37(1):46–48.
- , . Bronchopleural fistulas: an overview of the problem with special focus on endoscopic management. Chest. 2005;128(6):3955–3965.
- , , , . Timing of invasive procedures in therapy for primary and secondary spontaneous pneumothorax. Arch Surg. 1991;126(6):764–766.
- , , , , . A treatment algorithm for pneumothoraces complicating central venous catheter insertion. Am J Surg. 2000;180(6):523–526.
A pneumothorax is a collection of air in the space outside the lungs that is trapped within the thorax. This abnormality can occur spontaneously or as the result of trauma. Traumatic pneumothoraces include those resulting from medical interventions such as a transthoracic and transbronchial needle biopsy, central line placement, and positive‐pressure mechanical ventilation. This group is most accurately described as iatrogenic pneumothorax (IP).[1]
IP can be an expected complication of many routine thoracic procedures, but it can also occur accidentally during procedures near the lung or thoracic cavity. Some IPs may be asymptomatic and go undiagnosed, or their diagnosis may be delayed.[2] The majority of iatrogenic pneumothoraces will resolve without complications, and patients will not require medical attention. A small percentage can, however, expand and have the potential to develop into a tension pneumothorax causing severe respiratory distress and mediastinal shift.[3, 4]
The incidence of IP ranges from 0.11% with mechanical ventilation to 2.68% with thoracentesis, according to an analysis of 7.5 million uniform hospital discharge abstracts from 2000.5 A 2010 systematic review of 24 studies that included 6605 patients suggested a 6.0% incidence of pneumothorax following thoracentesis.[3] The highest risk of IP is seen with computed tomography (CT)‐guided lung biopsy, with 1 series of 1098 biopsies showing a 42% incidence; chest tube evacuation was required in 12% of these cases.[4] A Veterans Administration study of patient safety indicators from 2001 to 2004 found that risk‐adjusted rates of IP were increasing over time.[6] It is unclear whether this increase is due to increasing numbers of interventional procedures or to better rates of detection. IP poses a considerable cost to the medical system, with safety studies finding that patients with IP will stay in the hospital approximately 4 days longer and incur an additional $17,000 in charges.[7]
In addition to this financial burden, the lack of consistency in training and guidelines for management of pneumothorax is thought to add to chest tube‐related complications.[8] In 2001, the American College of Chest Physicians (ACCP) published guidelines for the management of spontaneous pneumothorax that do not specifically address IP.[9] In 2010, the British Thoracic Society (BTS) updated their guidelines and included a brief statement on IP that described a higher incidence for it than for spontaneous pneumothorax and noted its relative ease of management.[10] Despite the lack of specific guidelines dedicated to IPs, common clinical practice is to manage iatrogenic defects in a manner similar to that for spontaneous ones. However, studies have shown that the management of pneumothorax remains diverse and that the adherence to these published guidelines is suboptimal.[10, 11] The BTS guidelines favor needle aspiration as the first‐line treatment,[10] whereas the ACCP recommends drainage with catheters over aspiration.[9]
The possibility of this complication, along with the rising rate of invasive interventions being performed, has led to expanded surveillance criteria for IP. Surveillance imaging, clinical observation, or a combination of the 2 may be required, depending on the institution, the risk of the procedure, and the preference of the treating clinician. The algorithms presented here were designed in alignment with both major society guidelines and with the intention of simplifying the treatment regimen for the ease of adoption by hospitalists.
ETIOLOGY AND RISK FACTORS
The etiology and risk factors for IP are multiple, with the most common being interventional‐based procedures. In 535 Veterans Administration patients, the most common precursor procedures were transthoracic needle biopsy (24%), subclavian vein catheterization (22%), thoracentesis (20%), transbronchial biopsy (10%), pleural biopsy (8%), and positive pressure ventilation.[12] IP can also be a rare complication of pacemaker manipulations,[5] and less commonly, bronchoscopy.[13] Patient factors that increase the risk of pneumothorax in the setting of an intervention include age, chronic obstructive lung disease, primary lung cancer, malignant and parapneumonic pleural effusions, empyema, and chronic corticosteroid use.[4] As might be expected, patients with structural lung disease (eg, emphysema with bullae) and poor healing ability (eg, corticosteroid dependent), tend to have IPs more often and to require more complicated interventions for resolution.[14, 15] In some studies, operator experience seems to be inversely related to the rate of IP, and the use of ultrasound is correlated with lower rates of this complication.[1, 3]
PATIENT PRESENTATIONS AND DIAGNOSIS
Clinical signs and symptoms of a significant pneumothorax vary in severity but most often include dyspnea, tachypnea, chest pain, and pleurisy (see Box 1). Post procedure signs or symptoms require further evaluation with imaging, usually a plain chest radiograph. CT can be useful for further evaluation. Small anterior pneumothoraces may be difficult to detect without lateral radiographic imaging or computed tomogram. Ultrasound is being used more frequently at the bedside to make this diagnosis, and various studies of trauma patients have found that it has good sensitivity and specificity.[16, 17] These results have been validated by a recent meta‐analysis comparing ultrasound to chest radiographs for the detection of pneumothorax among trauma, critically ill, and postprocedural patients.[18] This study demonstrated superior sensitivity and similar specificity for ultrasound versus chest radiographs for detection of pneumothorax. More ominous signs, such as tachycardia or hypotension, can be indicative of tension pneumothorax, which requires emergent evacuation.
MANAGEMENT
Once the diagnosis of pneumothorax has been established, treatment options should be guided by defect size and clinical assessment following a defined treatment algorithm (Figure 1). As emphasized by the BTS and ACCP guidelines, we advocate considering the use of symptoms along with defect size to determine the best management course.
Observation
Defects that involve<20% of the hemithorax in a patient who is clinically asymptomatic and hemodynamically stable can be safely managed by oxygen supplementation and hospital observation. Repeat imaging can be obtained after 12 to 24 hours of defect detection or with symptom change. Patients who display resolution may be discharged home.
Patients who show persistence without progression but are asymptomatic may also be discharged safely, with follow‐up imaging and clinical evaluation 48 hours later.[9, 10] This was demonstrated by Kelly and colleagues,[19] who described the outcomes of 154 patients in a retrospective cohort study. Of the 91 patients treated with outpatient observation, 82 resolved without additional interventions. A recent review article by the same author cites conservative management of small pneumothoraces as being widely accepted.[20] If reimaging shows progression of defect or if the patient becomes more symptomatic, the pneumothorax should be evacuated by 1 of the methods described below.
Aspiration
Aspiration is defined by the ACCP Delphi consensus statement as the removal of pleural air via needle or cannula followed by immediate removal of needle or cannula.[9] This option mandates careful patient selection. It should be considered for small pneumothoraces that cause only mild dyspnea in patients who have no known parenchymal disease. These patients should be observed overnight in the hospital and reimaged 24 hours after aspiration of the pneumothorax. Several authors have reported success with aspiration alone. Yamagami et al.[21] noted the efficacy of manual aspiration immediately after CT‐guided biopsy, with a success rate exceeding 90%. They also noted that evacuated volumes >543 mL correlated with the need for further intervention with a chest tube. This technique is advocated for small pneumothoraces that are recognized shortly after the procedure.
Similarly, Delius and colleagues[22] managed 131 pneumothoraces with aspiration as an alternative to chest tube placement. Of these, 79 were iatrogenic. Aspiration achieved a 75% success rate for all IPs. Small defects defined as <20% of volume had an even higher resolution rate of 87%. Similar findings were demonstrated by Talbot‐Stern et al.[23] in their prospective study of 76 pneumothoraces. Among those that were iatrogenic, 82% resolved after simple aspiration. Faruqi et al.[24] also showed that aspiration is a viable option for IPs. Of the 57 patients with pneumothorax included in their study, 35 were treated with aspiration alone. Iatrogenesis was the culprit in 12 of the 35 manually aspirated cases. Aspiration achieved a success rate of 91.7% in IP. A recent Cochrane database systematic review compared simple aspiration with intercostal tube drainage for primary spontaneous pneumothorax.[25] The authors reported no difference between these methods in terms of success rate, early failure rate, duration of hospital stay, 1‐year success rate, or number of patients who required pleurodesis at 1‐year follow‐up.
Because the algorithms presented in this article were specifically designed for the use by hospitalists, we intentionally omitted aspiration from the decision trees. Most hospitalists would not be expected to evacuate IPs. However, knowledge regarding this option and appropriate follow‐up are valuable to internists, because many interventionalists admit patients to the hospital service for overnight observation. An asymptomatic postaspiration patient, who on subsequent imaging demonstrates resolution or persistence without progression of pneumothorax, may be discharged with 48‐hour follow‐up.
Placement of Catheter or Chest Tube Drainage
Most patients with a clinically significant pneumothorax will require evacuation of the air. Pneumothoraces larger than 20% or that produce symptoms warrant chest tube management and inpatient observation (Figure 1B). Traditionally, large tubes with 20 cm of water on continuous suction are used and have been studied the most widely. Several authors have shown that smaller tubes can effectively drain a pneumothorax.[26, 27, 28, 29] Small‐bore catheters (8F14F), which can be inserted percutaneously, have been shown to provide effective lung re‐expansion with minimal morbidity[8] and may be better tolerated by patients with uncomplicated pneumothoraces (Figure 2). Terzi and colleagues[30] have shown that smaller tubes cause less discomfort to patients at rest, with cough, and at the time of tube removal.
At most US institutions, catheters and chest tubes are connected to all‐purpose drainage systems. Although commercially available through a variety of manufacturers, they share similar design principles because they replicate the 3‐bottle system described in detail elsewhere in the literature.[31] We have limited our discussion to 3 pleural evacuation systems because it is our intention to familiarize hospitalists with the units that they are most likely to encounter. The first 2 systems have been studied and described by Baumann and colleagues[32] as being commonplace and reasonably reliable. These include the Oasis (Atrium Medical Corp., Hudson, NH) (Figure 3A) and the Pleur‐evac (Teleflex Inc., Limerick, PA). The third unit is the Thopaz digital thoracic drainage system (Medela Inc., McHenry, IL) (Figure 3B). The Thopaz is unique in its inclusion of a suction source and digital capability. Although it utilizes the same principles of all pleural evacuation devices, its setup and information output require that one be familiar with its digital format.
Suction Versus Water Seal
The chest tube should be placed initially to a suction pressure level of 20 cm of water for 24 hours to maximize lung expansion and evacuate all extrapulmonary air. Suction pressure is set on the Pleur‐evac and Atrium drainage systems by a manual dial that reads to a water pressure of 0 to 40 cm. The default setting from the manufacturer is 20 cm of water. This level of suction is present only when the drainage system is connected to a wall or a portable suction device. The only confirmation of suction presence in the Atrium system is the deployment of the orange bellows (located under the dial) to the level of the arrow tip (Figure 3A). The Pleur‐evac system has a red stripe along the circular edge of the dial that appears at the set level of suction when negative pressure is being applied. It is important to be aware that when patients are disconnected from the wall or the portable suction apparatus, they are on water seal or gravity. These terms are synonymous with no suction. On the Thopaz, a digital menu directs operation, and levels of suction can be selected from water seal (no suction) up to 40 cm of water. We recommend using suction to 20 cm of water given the scarce evidence supporting higher levels of negative pressure. Some clinicians prefer placing patients on water seal for some time before moving toward tube discontinuance, but this is a matter of preference, and no substantial evidence exists to show that any 1 method is superior.[8, 33]
Assessing for Air Leak
If there is improvement or resolution of the pneumothorax after 24 hours, the presence of an air leak should be assessed; if no leak is present, the chest tube can be safely removed. In the context of chest tubes, the term air leak refers to residual air between the lung and the chest wall. It is possible to see resolution of a pneumothorax on chest radiographs and still have an air leak. This situation is created by a perfect balance between the pleural air evacuation by the catheter and the flow of air exiting from the lung puncture. This would result in reaccumulation of the pneumothorax if the chest tube is removed prematurely. It should also be kept in mind that chest radiographs may miss a small pneumothorax given their relatively low sensitivity.[18] Therefore, the absence of an air leak needs to be documented before the chest tube is discontinued. Depending on the type of drainage system (Atrium, Pleur‐evac, or Thopaz), this assessment can be done in several ways. All systems can be assessed for air leak by clamping the actual chest tube for 2 to 4 hours and then repeating the chest radiograph. Clamping a chest tube simulates the condition of not having a chest tube. Chest tubes should never be clamped without supervision and only with the knowledge of nursing personnel. The onset of chest pain or dyspnea in a patient with a clamped tube mandates immediate removal of the clamp and a return to suction. A repeat chest radiograph showing reaccumulation or expansion of the pneumothorax after clamping indicates that the air leak has not resolved and the chest tube must remain in place and returned to suction. Simpler and more time‐efficient methods of detecting air leaks are available with both cardiothoracic drainage systems.
For the Atrium and Pleur‐evac models, there is a graded panel through which one can visualize air leaks being funneled through water (Figure 4A). Having the patient cough several times or perform a Valsalva maneuver should release any air trapped within the chest into this chamber, where bubbles can be visualized as they travel through the water. The presence of bubbles indicates the presence of residual air in the chest, pointing to a possible leak. In contrast, the Thopaz system offers a graphical display of the air flowing into the system that can be reviewed over the 24‐hour period. When the graph line reaches a 0 flatline graph, no airflow is being detected and no air leakage is suspected (Figure 4B). If no air leaks are detected, the chest tube may be discontinued. Those patients with a failed air leak test should have their chest tubes continued under suction for another 24 hours, with the above tests then repeated. The same holds true for those patients with persistent pneumothorax at 24 hours.
Removal of chest tubes is a simple process that requires the tube to be pulled out of the patient without allowing air to enter the site where the tube was present and where it entered the thorax. Most interventionalists will discontinue the tubes that they have placed. Some small catheters have an internal string that has to be released so the catheter will straighten and pull out easily. Knowledge of the type of catheter or tube that was placed is critical before removal to prevent complications and patient discomfort. Standard chest tubes are straight, smooth plastic and pull out easily but require rapid occlusion of the larger puncture site in the chest wall with an occlusive dressing that often includes petroleum or water‐soluble gel. Some physicians will leave a suture tie when placing the chest tube so that it can be tied down to occlude the site instead of using a dressing.
Consultation of the Cardiothoracic Surgeon or Interventional Pulmonologist
We recommend the involvement of cardiothoracic surgery or interventional pulmonology for patients with nonresolving pneumothorax lasting longer than 48 hours because additional procedures may be necessary. One of the rare but serious complications of a persistent pneumothorax is the formation of a bronchopleural fistula. This communication between the bronchial tree and the pleural space can lead to significant morbidity and mortality. The treatment of a bronchopleural fistula includes medical and surgical options that are beyond the scope of this article but require the expertise of a cardiothoracic surgeon or interventional pulmonologist.[34] Most patients who will not require additional procedures will heal within 48 hours.[11, 35] Decisions regarding more invasive treatment measures can then be made as necessary.[26]
PRACTICAL TIPS
Hospitalists caring for patients with chest tubes are often asked to troubleshoot at the bedside. Scenarios that may be encountered include nonfunctioning tubes, catheter migration, and tube discomfort. Ensuring patency of the tube entails visualizing the tube from the point of entry into the chest wall to the collection chamber and inspecting for kinks or debris clogging the tube. Smaller catheters can be easily kinked during patient positioning and can become clogged. Respiratory variation, which is the movement of the column of fluid in the collection chamber or in the tubing with inspiration and expiration, suggests that the chest tube is patent. This should be part of the daily examination in a patient with a chest tube, and it should also be the first step in assessing sudden dyspnea, hypoxia, pain, or hemodynamic instability. Clogged tubes should be referred to the interventionalists or other physicians who placed them. Chest tubes are typically sutured at the site of entry and securely bandaged to avoid migration but occasionally can be dislodged. This should prompt placement of another tube by an experienced operator. Last, chest tubes can be uncomfortable for patients who may require systemic analgesics. Additionally, tube positioning may ease some of the discomfort. Chest tubes are commonly placed along the midaxillary line and the posterior thorax, leading to discomfort in the recumbent position. Directing the tube anteriorly helps ease some of the discomfort. This can be done using all‐purpose sponges to build a barrier between the skin and the chest tube as it is directed anteriorly. Additional sponges are placed above the tube for extra protection. The gentle curve accomplished by padding the underside of the tube also keeps the tube patent by avoiding sharp kinks as the catheter exits the thorax.
FUTURE TRENDS
Future trends in the management of IP may include shorter duration of tube management (14 hours of suction with air leak evaluation and removal) and the use of even smaller catheters. Outpatient management of IP with small pigtail catheters or small‐caliber tubes in addition to 1‐way valves is also being investigated. The benefits of these practices may include greater patient comfort and lower cost. These approaches will need larger‐scale replication and careful patient selection before they become standard practice.[28, 36]
Ultrasound can be used to assess the presence and size of pneumothoraces that are difficult to visualize by standard chest radiographs. Several studies have established ultrasonography as an effective method of diagnosing pneumothorax and have shown it to have superior sensitivity compared with chest radiography.[1, 18] In the future, the use of ultrasound will likely be more widespread given its performance, portability, ease of use, and relatively low cost.
SUMMARY
IP is a known and costly complication of many medical procedures. The aforementioned algorithms help simplify the management of chest tubes for hospitalists caring for patients with this common complication. This stepwise approach may not only help curtail added expenses related to IPs by decreasing the length of inpatient stays but may also improve patient satisfaction.
Acknowledgments
Disclosure: Mayo does not endorse the products mentioned in this article. The authors report no conflicts of interest.
Box
Clinical Signs and Symptoms of Pneumothorax
Dyspnea
Pleuritic chest pain
Tachypnea
Hypoxia
Decreased breath sounds on affected side
Hyper‐resonant percussion on affected side
Subcutaneous emphysema
- , . Management of pneumothorax. Semin Respir Crit Care Med. 2010;31(6):769–780.
- , . Pneumothorax. Respirology. 2004;9(2):157–164.
- , , , . Pneumothorax following thoracentesis: a systematic review and meta‐analysis. Arch Intern Med. 2010;170(4):332–339.
- , , , et al. Incidence of and risk factors for pneumothorax and chest tube placement after CT fluoroscopy‐guided percutaneous lung biopsy: retrospective analysis of the procedures conducted over a 9‐year period. AJR Am J Roentgenol. 2010;194(3):809–814.
- , , . Accidental iatrogenic pneumothorax in hospitalized patients. Med Care. 2006;44(2):182–186.
- , , , et al. Tracking rates of patient safety indicators over time: lessons from the Veterans Administration. Med Care. 2006;44(9):850–861.
- , . Excess length of stay, charges, and mortality attributable to medical injuries during hospitalization. JAMA. 2003;290(14):1868–1874.
- , , , , . Preliminary report of a prospective, randomized trial of underwater seal for spontaneous and iatrogenic pneumothorax. J Am Coll Surg. 2007;204(1):84–90.
- , , , et al.; AACP Pneumothorax Consensus Group. Management of spontaneous pneumothorax: an American College of Chest Physicians Delphi consensus statement. Chest. 2001;119(2):590–602.
- , , ; BTS Pleural Disease Guideline Group. Management of spontaneous pneumothorax: British Thoracic Society Pleural Disease Guideline 2010. Thorax. 2010;65(suppl 2):ii18–ii31.
- , . The clinician's perspective on pneumothorax management. Chest. 1997;112(3):822–828.
- , , , . Iatrogenic pneumothorax: etiology and morbidity: results of a Department of Veterans Affairs Cooperative Study. Respiration. 1992;59(4):215–220.
- , , , , , . Severe complications of bronchoscopy. Respiration. 2008;76(4):429–433.
- , , , et al. Incidence and risk factors of delayed pneumothorax after transthoracic needle biopsy of the lung. Chest. 2004;126(5):1516–1521.
- , , , , , . Factors associated with pneumothorax and pneumothorax requiring treatment after percutaneous lung biopsy in 443 consecutive patients. J Vasc Interv Radiol. 2004;15(5):479–483.
- , . Ultrasound detection of pneumothorax compared with chest X‐ray and computed tomography scan. Am Surg. 2011;77(4):480–484.
- , . Sensitivity of bedside ultrasound and supine anteroposterior chest radiographs for the identification of pneumothorax after blunt trauma. Acad Emerg Med. 2010;17(1):11–17.
- , , , , . Diagnosis of pneumothorax by radiography and ultrasonography: a meta‐analysis. Chest. 2011;140(4):859–866.
- , , . Outcomes of emergency department patients treated for primary spontaneous pneumothorax. Chest. 2008;134(5):1033–1036.
- . Review of management of primary spontaneous pneumothorax: is the best evidence clearer 15 years on? Emerg Med Australas. 2007;19(4):303–308.
- , , , , , . Efficacy of manual aspiration immediately after complicated pneumothorax in CT‐guided lung biopsy. J Vasc Interv Radiol. 2005;16(4):477–483.
- , , , , , . Catheter aspiration for simple pneumothorax: experience with 114 patients. Arch Surg. 1998;124(7):833–836.
- , , , , . Catheter aspiration for simple pneumothorax. J Emerg Med. 1986;4(6):437–442.
- , , , . Role of simple needle aspiration in the management of pneumothorax. Indian J Chest Dis Allied Sci. 2004;46(3):183–190.
- , , . Simple aspiration versus intercostal tube drainage for primary spontaneous pneumothorax in adults. Cochrane Database Syst Rev. 2007;(1):CD004479.
- , , , . Evaluation of conventional chest tube therapy for iatrogenic pneumothorax. Chest. 1993;104(6):1770–1772.
- , , , . Outpatient treatment of iatrogenic pneumothorax after needle biopsy. Radiology. 1997;205(1):249–252.
- , , , , , . Outpatient management of postbiopsy pneumothorax with small‐caliber chest tubes: factors affecting the need for prolonged drainage and additional interventions. Cardiovasc Intervent Radiol. 2008;31(2):342–348.
- , . Management of primary and secondary pneumothorax using a small‐bore thoracic catheter. Interact Cardiovasc Thorac Surg. 2010;11(2):146–149.
- , , , et al. The use of flexible spiral drains after non‐cardiac thoracic surgery: a clinical study. Eur J Cardiothorac Surg. 2005;27(1):134–137.
- . Pleural Diseases. 5th ed. Philadelphia: PA: Lippincott Williams 2007.
- , , , . Comparison of function of commercially available pleural drainage units and catheters. Chest. 2003;123(6):1878–1886.
- , . Catheter drainage of spontaneous pneumothorax: suction or no suction, early or late removal? Thorax. 1982;37(1):46–48.
- , . Bronchopleural fistulas: an overview of the problem with special focus on endoscopic management. Chest. 2005;128(6):3955–3965.
- , , , . Timing of invasive procedures in therapy for primary and secondary spontaneous pneumothorax. Arch Surg. 1991;126(6):764–766.
- , , , , . A treatment algorithm for pneumothoraces complicating central venous catheter insertion. Am J Surg. 2000;180(6):523–526.
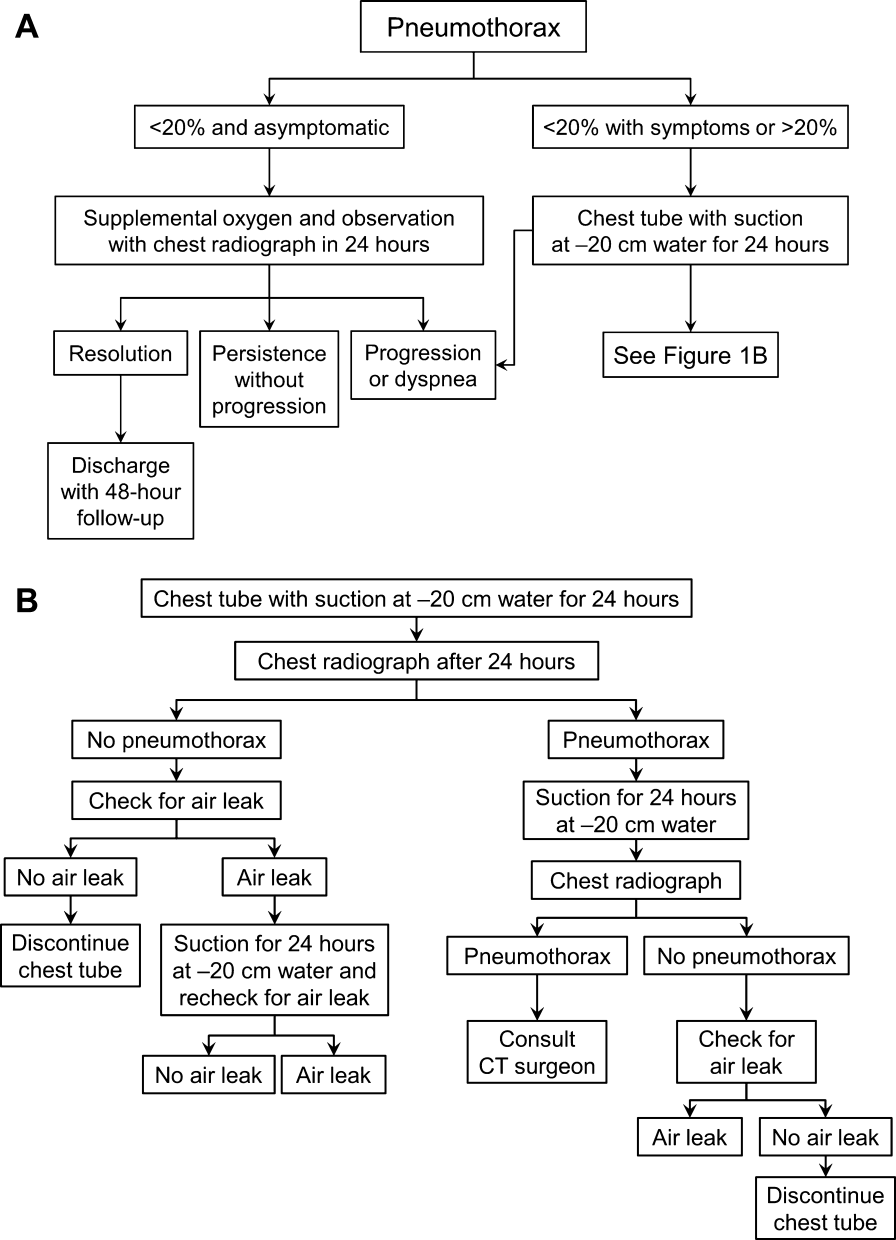
How to handle negative reviews
It happened. You got Yelped. An angry patient wrote a scathing, ranting comment about your 2-hour office wait, your abrupt manner, or your snarky receptionist. What should you do? Scream? No. Patients would hear you, and it would be fodder for more bad reviews. Pound your fist on your desk? Nope. You have a Mohs procedure later today. Write a reply to the patient putting him in his place and exonerating yourself? No, you should definitely not do that.
No matter how intelligent, devoted, and caring, we all have negative doctor reviews. Now, those reviews are posted online for the world to see. That’s why you need a strategy to deal with this problem.
First, how will you know when it happens? Do this: Set up a Google Alert. Google Alerts are e-mail updates that you receive based on your queries. Include your name and the name of your practice. That way, you’ll receive notice when you’re mentioned online.
If you receive a negative comment online, then follow this three-step strategy: Listen. Plan. Engage.
Listen to who has made the comments. Is he or she a popular "Yelper?" Does this person have thousands of followers, or just a few? In cases where the site is not popular or the commenter not well connected, the best option is to ignore the comment. Any action you take could draw a larger audience.
Plan a course of action. Is this a situation that you think can be resolved by calling or messaging the patient directly? Or should you respond to the comment online?
Engage the patient who left the comment. Patients who leave angry comments want to feel that they’ve been heard. Responding to them online will show that you heard them, that you care, and that you want to rectify the situation.
But before you take action online, remember that there are three things you should never do:
• Argue.
• Violate HIPAA.
• Go to bed, or to the Internet, angry.
What about simply deleting the comment? In many instances, this is not possible. If the comment is on your site, or on your Facebook page, be aware that deleting the remark can make the patient angrier, and incite him or her to leave comments on other sites where you can’t delete them. Unless the comment is abusive, vulgar, or violates your stated policy, then consider leaving it, and responding to it instead.
When you’re ready to reply to the patient online, take these tips from public relations professionals:
• Reach out neutral.
• Redact.
• Remediate.
Reach out neutral means that you reach out to the patient in a neutral, nonconfrontational manner. Despite your personal feelings, don’t blame or belittle the patient in any way. It will only hurt your reputation and show others on the site that you’re more concerned with being right than with helping your patients. You might write something like, "I’m sorry. Please call XXX-XXX-XXXX so I can help you. Sincerely, Dr. Your Name." If the comment was left anonymously, you might say something like, "I’m sorry this happened. I hope you contact us and let us know who you are so we can help you."
Contrary to popular belief, saying "I’m sorry," does not mean you’re admitting wrongdoing. You are sorry that the patient is upset, and you do want to help him.
Redacting a comment is extremely difficult. Think about it this way: If rating sites removed all negative, incendiary comments, then people wouldn’t have any need to read the reviews. Unless the comment is clearly libelous, then remedy the situation in other ways. If, however, you can prove that the patient has lied, then contact the review site and make your case. However, remember that we are still accountable to protect a patient’s privacy, even in these challenging circumstances.
Remediation is the last step, and it is crucial. In most cases, there is something to be learned from what the patient has said. Were you criticized for having a long wait time or for having insensitive staff? Then fix it. Otherwise, it will just be the first of many such reviews.
To prevent negative online comments, some physicians have issued gag orders to patients, making them promise not to discuss their appointment or treatment online. Gag orders are a terrible idea. They’re indefensible by law and can lead to your name being added to "'RateMd.coms wall of shame."
Finally, some physicians have felt that legal action is their only recourse after negative online comments. That decision is up to you and your attorney. But keep in mind that the legal precedent so far has favored patients and rating sites, not physicians, and that any litigation could go on for months.
The consumerization of health care means that patients will have more power than ever to help or harm your practice. So be sure that you are providing top-quality care, but be ready with a strategy to manage bad reviews when they happen.
Dr. Benabio is Physician Director of Innovation at Kaiser Permanente in San Diego. Visit his consumer health blog at thedermblog.com and his health care blog at benabio.com. Connect with him on Twitter @Dermdoc and on Facebook (DermDoc).

'Don't tell her the diagnosis': Nondisclosure and the surgeon
It goes without saying that good surgical care is based on honesty in informed consent. The ethical basis of telling patients about their conditions and what needs to be done is central to what surgeons do. In this context, a request not to tell a patient a diagnosis is always jarring to me. One of the ethical principles that medicine has most fully embraced in the last few decades has been respect for patient autonomy. This principle is very much in opposition with the previous practice of paternalism in the prior era of medical care in which "the doctor knows best" and doctors made decisions for their patients. As a practicing surgeon today, I feel that there is very little that I know that I cannot disclose to my patient. However, occasionally cases challenge our underlying assumptions.
A few years ago, I saw an 11-year-old girl with a recent diagnosis of papillary thyroid cancer. Before I even saw her, the parents had called my office to be sure that I did not tell her the diagnosis of cancer. I found this request to be troubling. How could I discuss the operation with this child without telling her that she had cancer? Her parents assured me that she knew that she had a thyroid nodule and that on the basis of the biopsy, that she would need a thyroidectomy. The only thing that had not been explained to the child was the diagnosis of thyroid cancer.
Despite my initial concern with this request, in pediatrics, the parents are the decision makers for the child, so that there was no legal reason why the patient needed to be told that she had cancer. Nevertheless, the ethical imperative to include the diagnosis of cancer in the discussion about surgery weighed on me. Despite my initial opposition to being put in the position of not telling the patient of her diagnosis, I decided that I could do nothing more at that point. I hoped to convince the parents to let me share the diagnosis with their daughter at a later time.
When I met my patient, I found her to be a quiet and calm girl who seemed to me to be mature beyond her years. I proceeded to explain the risks of thyroidectomy to the patient and her parents. She seemed to take it all in and asked good questions about the operation and the recovery. She wanted to know how long before she could get back to school and sports. At the end of the consultation, the patient’s mother asked her to wait with her younger sister and her grandmother in the waiting room for a few minutes while the parents spoke to me alone.
Once she had left, the parents expressed their appreciation that I had not told her she had cancer. I told them how impressed I was with her poise and maturity and that although I did not agree with their decision not to tell her the diagnosis, I would certainly go along with it based on the assumption that they knew what would be in her best interests better than I. They seemed relieved that I was willing to go along with their decision. I realized at that point that the ethical arguments in favor of telling the patient of her diagnosis would likely be unconvincing for the parents, so I decided to focus instead on the practical problems with nondisclosure.
I asked the parents to consider that the operative schedule would include the diagnosis of thyroid cancer and that everyone seeing her in the hospital (doctors, nurses, etc.) would know her diagnosis. For all of these reasons, there would be a high likelihood that at some point during her hospital stay, someone would slip, and she would learn of the diagnosis in an uncontrolled manner from someone other than her parents or her doctor. In addition, I suggested that she would likely figure it out anyway even if no one told her. Finally, I asked them to consider the next few years. If they did not tell her the diagnosis of cancer now, at what point would they choose to do so? Certainly, at the point that she turned 18 years old, she would need to know the diagnosis, but would the parents want to hide it from her that long, even if they could?
The parents seemed to have not thought of all of these issues and answered that they fully wanted to tell her, but they were concerned about doing so when they, themselves, were still so upset by the diagnosis. They explained that they planned to tell her when they felt more in control of their own emotions.
Two weeks later, on the morning of surgery, the parents told me how they had explained the diagnosis to their daughter and that she had then explained it to her younger sister. It was clear to me that the assurance that the parents had given to the patient had allowed her to be calm and positive when talking with her younger sister. It is unknown how things might have worked out had the parents not told the patient of her diagnosis when they did, but it was clear to me that the fact that the parents had been able to control some aspects of how the patient learned of her diagnosis had helped them to feel better about a difficult situation. In addition, the patient seemed to be reassured by having explained things to her sister. Although I continue to assume that disclosure is always the best approach, there may be cases, such as this one, in which the timing of the disclosure might allow for a good outcome.
Dr. Angelos is an ACS Fellow, the Linda Kohler Anderson Professor of Surgery and Surgical Ethics; chief, endocrine surgery, and associate director of the MacLean Center for Clinical Medical Ethics at the University of Chicago.

Blackberry
Endemic to Europe and North America, the blackberry (Rubus fruticosus) is naturally laden with an abundance of polyphenolic compounds, including ellagic acid, tannins, ellagitannins, quercetin, gallic acid, anthocyanins, and cyanidins, which have been associated with antioxidant and anticarcinogenic activity (J. Med. Food 2007;10:258-65; J. Agric. Food. Chem. 2002;50:3495-500; J. Agric. Food Chem. 2008;56:661-9). Indeed, the health benefits of consuming plants rich in anthocyanins have been known at least since the 1500s (Nat. Prod. Commun. 2011;6:149-56).
It is not surprising, then, that blackberries have long been part of traditional medicine. Rubus extracts have been used in traditional medicine for antimicrobial, anticonvulsant, and muscle relaxant indications, as well as for their ability to detect and inhibit free radicals (Int. J. Antimicrob. Agents. 2009;34:50-9). Rubus has been reported in traditional medicine on Sardinia for hemorrhoids, bleeding gums, and ulcers (J. Ethnobiol. Ethnomed. 2009;5:6). Phytotherapeutic uses have also been noted in Central Italy (Fitoterapia. 2005;76:1-25). Dermatologic applications of blackberry in southern Italy include use of the leaves to treat dog bites, and use of the roots in a hair-wash preparation (J. Ethnobiol. Ethnomed. 2008;4:5).
Data from other studies suggest additional potential uses for blackberry. For example, polyphenols and leaf extract of Rubus ulmifolius exhibited antibacterial activity against two strains of Helicobacter pylori (Int. J. Antimicrob. Agents. 2009;34:50-9). The antimicrobial activity of berries and other anthocyanin-containing fruits, which are typically more effective against Gram-positive than Gram-negative bacteria, is believed to result from various mechanisms and interactions associated with anthocyanins, weak organic acids, phenolic acids, and their mixtures of varying chemical composition (Nat. Prod. Commun. 2011;6:149-56; J. Ethnopharmacol. 2002;79:165-8).
Anti-inflammatory activity
In 2006, Pergola et al. examined whether the pharmacological activity of the anthocyanin fraction of a blackberry extract (cyanidin-3-O-glucoside, approximately 88% of the total anthocyanin content) could be attributed to the inhibition of nitric oxide production. The researchers found that the increased synthesis of nitrites spurred by the treatment of J774 cells with lipopolysaccharide over 24 hours was inhibited by anthocyanin, in a concentration-dependent manner. They concluded that the anti-inflammatory activity associated with blackberry extract can be partially ascribed to the blocking of nitric oxide synthesis by cyanidin-3-O-glucoside, the primary anthocyanin found in the extract (Nitric Oxide 2006;15:30-9).
In another study involving in vivo data and a mouse ear model, investigators assessed the antioxidant and topical anti-inflammatory activity of low- and high-molecular-weight phenolic fractions from three blackberry cultivars (i.e., Navaho, Kiowa, and Ouachita) bred for the warm and humid conditions of the southeastern United States. They found that all three formulations significantly mitigated TPA-induced inflammation. In addition, the researchers investigated mouse ear myeloperoxidase activity, an indicator of polymorphonuclear leukocyte infiltration, and noted that it was substantially diminished after topical application of both blackberry preparations as well as indomethacin (J. Agric. Food. Chem. 2010;58:6102-9).
Antioxidant activity
Blackberries consistently rank highly in oxygen radical absorbance capacity (ORAC), and they showed the strongest antioxidant activity among 1,000 antioxidant foods eaten in the United States in a study by Halvorsen et al. (Am. J. Clin. Nutr. 2006;84:95-135).
Investigators recently evaluated and compared the effect of extraction time (5 and 15 minutes) and hydrolysis on the qualitative and quantitative content of phenolic compounds and antioxidant capacity of six traditional medicinal plants, including blackberry (Rubus fruticosus), lemon balm (Melissa officinalis), thyme (Thymus serpyllum), lavender (Lavandula officinalis), stinging nettle (Urtica dioica), and olive (Olea europea). The distribution of phenolic compounds identified varied widely among the botanicals selected, and the extraction efficiency and antioxidant capacity of the extracts were influenced by prolonged extraction and hydrolysis. The hydrolyzed extract of blackberry leaves, obtained after 15 minutes of extraction, demonstrated the highest phenolic content and antioxidant capacity (Phytochem. Anal. 2011;22:172-80).
In 2007, Dai et al. obtained Hull blackberries grown in Kentucky and analyzed total anthocyanin and phenolic content, polymeric color, as well as anthocyanin composition and antioxidant capacity. Their in vitro cell culture work indicated that the blackberry extract suppressed HT-29 colon tumor cell growth by up to 66% after 72 hours, in a concentration-dependent manner. High-dose and low-dose lipid A-induced interleukin-12 release was also concentration-dependently inhibited from mouse bone marrow–derived dendritic cells by total anthocyanin concentrations (0-40 mcg/mL). The investigators concluded that the blackberry extract exhibits strong antioxidant, antiproliferative, and anti-inflammatory activities, and products based on the extract might be considered for the treatment or prevention of inflammatory conditions as well as cancer (J. Med. Food 2007;10:258-65).
Anticarcinogenic activity
In 2004, Feng et al. studied the effects of fresh blackberry extracts on cancer cell proliferation and neoplastic transformation induced by TPA. They confirmed, using electron spin resonance, that the extract effectively scavenges hydroxyl and superoxide free radicals. They also determined that pretreatment of the human cancer cell line A549 with blackberry extract suppressed cell proliferation and inhibited 8-hydroxy-2\'-deoxyguanosine (8-OHdG) formation induced by UVB. In addition, pretreatment with the extract reduced neoplastic transformation of JB6 P+ cells induced by TPA and blocked UVB- and TPA-induced AP-1 transactivation. The investigators concluded that fresh blackberry extract appears to have anticarcinogenic properties, and that associated activity may be derived from its antioxidant characteristics (Nutr. Cancer 2004;50:80-9).
In 2006, Ding et al. examined the chemopreventive and chemotherapeutic activity of cyanidin-3-glucoside (C3G), a key active ingredient in blackberry. C3G was shown to scavenge UVB-induced hydroxyl and superoxide radicals in cultured JB6 cells. The investigators observed reductions in the number of nonmalignant and malignant skin tumors per mouse induced by TPA in 7,12-dimethylbenz[a]anthracene-initiated mouse skin. In addition, UVB- and TPA-induced transactivation of NF-kappaB and AP-1 and expression of cyclooxygenase-2 and tumor necrosis factor–alpha were suppressed by the pretreatment with C3G of JB6 cells. The researchers suggested that the inhibition of MAPK activity may be important in mediating such effects. TPA-induced neoplastic transformation in JB6 cells was also hindered via C3G pretreatment. Further, C3G suppressed proliferation of the human lung carcinoma cell line A549, diminished the size of A549 tumor xenograft growth, and significantly limited metastasis in nude mice. The investigators concluded that C3G, an important constituent of blackberry, displays significant anticancer activity by dint of its capacity to scavenge free radicals. As such, they suggested that this blackberry derivative, which exhibits scant cytotoxicity to healthy tissue, warrants additional study as a preventive and therapeutic agent in human cancers (J. Biol. Chem. 2006;281:17359-68).
Conclusion
The most recent evidence suggests that blackberry warrants attention for medical applications, including dermatology. In fact, in a small (n = 33) single-center, open-label study led by the author, significant improvement in most metrics of photoaged skin was observed after the use of a day and night regimen containing blackberry leaf extract, dill extract, and Zn-Cu(II) bi-mineral complex in patients with mild to moderate photodamage. (Baumann LS, Figueras KA, Bell M, Flitter CJ. Assessing the efficacy and tolerance of a day and night regimen containing blackberry leaf extract, dill extract, and Cu-Zinc bi-mineral complex in subjects with mild to moderate photoaged skin. Unpublished results.) It remains to be seen if and when blackberry extract alone may be harnessed for dermatologic indications, but present data are promising, and justify continued study.
Dr. Baumann is in private practice in Miami Beach. She did not disclose any conflicts of interest. To respond to this column, or to suggest topics for future columns, write to her at sknews@frontlinemedcom.com.
Hospitalist Teaching Rounds for FUTURE
The implementation of resident duty hour restrictions has created a clinical learning environment on the wards quite different from any previous era. The Accreditation Council for Graduate Medical Education issued its first set of regulations limiting consecutive hours worked for residents in 2003, and further restricted hours in 2011.[1] These restrictions have had many implications across several aspects of patient care, education, and clinical training, particularly for hospitalists who spend the majority of their time in this setting and are heavily involved in undergraduate and graduate clinical education in academic medical centers.[2, 3]
As learning environments have been shifting, so has the composition of learners. The Millennial Generation (or Generation Y), defined as those born approximately between 1980 and 2000, represents those young clinicians currently filling the halls of medical schools and ranks of residency and fellowship programs.[4] Interestingly, the current system of restricted work hours is the only system under which the Millennial Generation has ever trained.
As this new generation represents the bulk of current trainees, hospitalist faculty must consider how their teaching styles can be adapted to accommodate these learners. For teaching hospitalists, an approach that considers the learning environment as affected by duty hours, as well as the preferences of Millennial learners, is necessary to educate the next generation of trainees. This article aimed to introduce potential strategies for hospitalists to better align teaching on the wards with the preferences of Millennial learners under the constraints of residency duty hours.
THE NEWEST GENERATION OF LEARNERS
The Millennial Generation has been well described.[4, 5, 6, 7, 8, 9, 10] Broadly speaking, this generation is thought to have been raised by attentive and involved parents, influencing relationships with educators and mentors; they respect authority but do not hesitate to question the relevance of assignments or decisions. Millennials prefer structured learning environments that focus heavily on interaction and experiential learning, and they value design and appearance in how material is presented.[7] Millennials also seek clear expectations and immediate feedback on their performance, and though they have sometimes been criticized for a strong sense of entitlement, they have a strong desire for collaboration and group‐based activity.[5, 6]
One of the most notable and defining characteristics of the Millennial Generation is an affinity for technology and innovation.[7, 8, 9] Web‐based learning tools that are interactive and engaging, such as blogs, podcasts, or streaming videos are familiar and favored methods of learning. Millennials are skilled at finding information and providing answers and data, but may need help with synthesis and application.[5] They take pride in their ability to multitask, but can be prone to doing so inappropriately, particularly with technology that is readily available.[11]
Few studies have explored characteristics of the Millennial Generation specific to medical trainees. One study examined personality characteristics of Millennial medical students compared to Generation X students (those born from 19651980) at a single institution. Millennial students scored higher on warmth, reasoning, emotional stability, rule consciousness, social boldness, sensitivity, apprehension, openness to change, and perfectionism compared to Generation X students. They scored lower on measures for self‐reliance.[12] Additionally, when motives for behavior were studied, Millennial medical students scored higher on needs for affiliation and achievement, and lower on needs for power.[13]
DUTY HOURS: A GENERATION APART
As noted previously, the Millennial Generation is the first to train exclusively in the era of duty hours restrictions. The oldest members of this generation, those born in 1981, were entering medical school at the time of the first duty hours restrictions in 2003, and thus have always been educated, trained, and practiced in an environment in which work hours were an essential part of residency training.
Though duty hours have been an omnipresent part of training for the Millennial Generation, the clinical learning environment that they have known continues to evolve and change. Time for teaching, in particular, has been especially strained by work hour limits, and this has been noted by both attending physicians and trainees with each iteration of work hours limits. Attendings in one study estimated that time spent teaching on general medicine wards was reduced by about 20% following the 2003 limits, and over 40% of residents in a national survey reported that the 2011 limits had worsened the quality of education.[14, 15]
GENERATIONAL STRATEGIES FOR SUCCESS FOR HOSPITALIST TEACHING ATTENDINGS
The time limitations imposed by duty hours restrictions have compelled teaching rounds to become more patient‐care centered and often less learner‐centered, as providing patient care becomes the prime obligation for this limited time period. Millennial learners are accustomed to being the center of attention in educational environments, and changing the focus from education to patient care in the wards setting may be an abrupt transition for some learners.[6] However, hospitalists can help restructure teaching opportunities on the clinical wards by using teaching methods of the highest value to Millennial learners to promote learning under the conditions of duty hours limitations.
An approach using these methods was developed by reviewing recent literature as well as educational innovations that have been presented at scholarly meetings (eg, Sal Khan's presentation at the 2012 Association of American Medical Colleges meeting).[16] The authors discussed potential teaching techniques that were thought to be feasible to implement in the context of the current learning environment, with consideration of learning theories that would be most effective for the target group of learners (eg, adult learning theory).[17] A mnemonic was created to consolidate strategies thought to best represent these techniques. FUTURE is a group of teaching strategies that can be used by hospitalists to improve teaching rounds by Flipping the Wards, Using Documentation to Teach, Technology‐Enabled Teaching, Using Guerilla Teaching Tactics, Rainy Day Teaching, and Embedding Teaching Moments into Rounds.
Flipping the Wards
Millennial learners prefer novel methods of delivery that are interactive and technology based.[7, 8, 9] Lectures and slide‐based presentations frequently do not feature the degree of interactive engagement that they seek, and methods such as case‐based presentations and simulation may be more suitable. The Khan Academy is a not‐for‐profit organization that has been proposed as a model for future directions for medical education.[18] The academy's global classroom houses over 4000 videos and interactive modules to allow students to progress through topics on their own time.[19] Teaching rounds can be similarly flipped such that discussion and group work take place during rounds, whereas lectures, modules, and reading are reserved for individual study.[18]
As time pressures shift the focus of rounds exclusively toward discussion of patient‐care tasks, finding time for teaching outside of rounds can be emphasized to inspire self‐directed learning. When residents need time to tend to immediate patient‐care issues, hospitalist attendings could take the time to search for articles to send to team members. Rather than distributing paper copies that may be lost, cloud‐based data management systems such as Dropbox (Dropbox, San Francisco, CA) or Google Drive (Google Inc., Mountain View, CA) can be used to disseminate articles, which can be pulled up in real time on mobile devices during rounds and later deposited in shared folders accessible to all team members.[20, 21] The advantage of this approach is that it does not require all learners to be present on rounds, which may not be possible with duty hours.
Using Documentation to Teach
Trainees report that one of the most desirable attributes of clinical teachers is when they delineate their clinical reasoning and thought process.[22] Similarly, Millennial learners specifically desire to understand the rationale behind their teachers' actions.[6] Documentation in the medical chart or electronic health record (EHR) can be used to enhance teaching and role‐model clinical reasoning in a transparent and readily available fashion.
Billing requirements necessitate daily attending documentation in the form of an attestation. Hospitalist attendings can use attestations to model thought process and clinical synthesis in the daily assessment of a patient. For example, an attestation one‐liner can be used to concisely summarize the patient's course or highlight the most pressing issue of the day, rather than simply serve as a placeholder for billing or agree with above in reference to housestaff documentation. This practice can demonstrate to residents how to write a short snapshot of a patient's care in addition to improving communication.
Additionally, the EHR can be a useful platform to guide feedback for residents on their clinical performance. Millennial learners prefer specific, immediate feedback, and trainee documentation can serve as a template to show examples of good documentation and clinical reasoning as well as areas needing improvement.[5] These tangible examples of clinical performance are specific and understandable for trainees to guide their self‐learning and improvement.
Technology‐Enabled Teaching
Using technology wisely on the wards can improve efficiency while also taking advantage of teaching methods familiar to Millennial learners. Technology can be used in a positive manner to keep the focus on the patient and enhance teaching when time is limited on rounds. Smartphones and tablets have become an omnipresent part of the clinical environment.[23] Rather than distracting from rounds, these tools can be used to answer clinical questions in real time, thus directly linking the question to the patient's care.
The EHR is a powerful technological resource that is readily available to enhance teaching during a busy ward schedule. Clinical information is electronically accessible at all hours for both trainees and attendings, rather than only at prespecified times on daily rounds, and the Millennial Generation is accustomed to receiving and sharing information in this fashion.[24] Technology platforms that enable simultaneous sharing of information among multiple members of a team can also be used to assist in sharing clinical information in this manner. Health Insurance Portability and Accountability Act‐compliant group text‐messaging applications for smartphones and tablets such as GroupMD (GroupMD, San Francisco, CA) allow members of a team to connect through 1 portal.[25] These discussions can foster communication, inspire clinical questions, and model the practice of timely response to new information.
Using Guerilla Teaching Tactics
Though time may be limited by work hours, there are opportunities embedded into clinical practice to create teaching moments. The principle of guerilla marketing uses unconventional marketing tactics in everyday locales to aggressively promote a product.[26] Similarly, guerilla teaching might be employed on rounds to make teaching points about common patient care issues that occur at nearly every room, such as Foley catheters after seeing one at the beside or hand hygiene after leaving a room. These types of topics are familiar to trainees as well as hospitalist attendings and fulfill the relevance that Millennial learners seek by easily applying them to the patient at hand.
Memory triggers or checklists are another way to systematically introduce guerilla teaching on commonplace topics. The IBCD checklist, for example, has been successfully implemented at our institution to promote adherence to 4 quality measures.[27] IBCD, which stands for immunizations, bedsores, catheters, and deep vein thrombosis prophylaxis, is easily and quickly tacked on as a checklist item at the end of the problem list during a presentation. Similar checklists can serve as teaching points on quality and safety in inpatient care, as well as reminders to consider these issues for every patient.
Rainy Day Teaching
Hospitalist teaching attendings recognize that duty hours have shifted the preferred time for teaching away from busy admission periods such as postcall rounds.[28] The limited time spent reviewing new admissions is now often focused on patient care issues, with much of the discussion eliminated. However, hospitalist attendings can be proactive and save certain teaching moments for rainy day teaching, anticipating topics to introduce during lower census times. Additionally, attending access to the EHRs allows attendings to preview cases the residents have admitted during a call period and may facilitate planning teaching topics for future opportunities.[23]
Though teaching is an essential part of the hospitalist teaching attending role, the Millennial Generation's affinity for teamwork makes it possible to utilize additional team members as teachers for the group. This type of distribution of responsibility, or outsourcing of teaching, can be done in the form of a teaching or float resident. These individuals can be directed to search the literature to answer clinical questions the team may have during rounds and report back, which may influence decision making and patient care as well as provide education.[29]
Embedding Teaching Moments Into Rounds
Dr. Francis W. Peabody may have been addressing students many generations removed from Millennial learners when he implored them to remember that the secret of the care of the patient is in caring for the patient, but his maxim still rings true today.[30] This advice provides an important insight on how the focus can be kept on the patient by emphasizing physical examination and history‐taking skills, which engages learners in hands‐on activity and grounds that education in a patient‐based experience.[31] The Stanford 25 represents a successful project that refocuses the doctorpatient encounter on the bedside.[32] Using a Web‐based platform, this initiative instructs on 25 physical examination maneuvers, utilizing teaching methods that are familiar to Millennial learners and are patient focused.
In addition to emphasizing bedside teaching, smaller moments can be used during rounds to establish an expectation for learning. Hospitalist attendings can create a routine with daily teaching moments, such as an electrocardiogram or a daily Medical Knowledge Self‐Assessment Program question, a source of internal medicine board preparation material published by the American College of Physicians.[33] These are opportunities to inject a quick educational moment that is easily relatable to the patients on the team's service. Using teaching moments that are routine, accessible, and relevant to patient care can help shape Millennial learners' expectations that teaching be a daily occurrence interwoven within clinical care provided during rounds.
There are several limitations to our work. These strategies do not represent a systematic review, and there is little evidence to support that our approach is more effective than conventional teaching methods. Though we address hospitalists specifically, these strategies are likely suitable for all inpatient educators as they have not been well studied in specific groups. With the paucity of literature regarding learning preferences of Millennial medical trainees, it is difficult to know what methods may truly be most desirable in the wards setting, as many of the needs and learning styles considered in our approach are borrowed from other more traditional learning environments. It is unclear how adoptable our strategies may be for educators from other generations; these faculty may have different approaches to teaching. Further research is necessary to identify areas for faculty development in learning new techniques as well as compare the efficacy of our approach to conventional methods with respect to standardized educational outcomes such as In‐Training Exam performance, as well as patient outcomes.
ACCEPTING THE CHALLENGE
The landscape of clinical teaching has shifted considerably in recent years, in both the makeup of learners for whom educators are responsible for teaching as well as the challenges in teaching under the duty hours restrictions. Though rounds are more focused on patient care than in the past, it is possible to work within the current structure to promote successful learning with an approach that considers the preferences of today's learners.
A hospitalist's natural habitat, the busy inpatient wards, is a clinical learning environment with rich potential for innovation and excellence in teaching. The challenges in practicing hospital medicine closely parallel the challenges in teaching under the constraints of duty hours restrictions; both require a creative approach to problem solving and an affinity for teamwork. The hospitalist community is well suited to not only meet these challenges but become leaders in embracing how to teach effectively on today's wards. Maximizing interaction, embracing technology, and encouraging group‐based learning may represent the keys to a successful approach to teaching the Millennial Generation in a post‐duty hours world.
- , , ; ACGME Duty Hour Task Force. The new recommendations on duty hours from the ACGME Task Force. N Engl J Med. 2010;363(2):e3.
- , . The emerging role of “hospitalists” in the American health care system. N Engl J Med. 1996;335(7):514–517.
- , , , et al. Hospital medicine in the internal medicine clerkship: results from a national survey. J Hosp Med. 2012;7(7):557–561.
- , . Millennials Rising: The Next Great Generation. New York, NY: Random House/Vintage Books; 2000.
- Eckleberry‐Hunt J, Tucciarone J. The challenges and opportunities of teaching “Generation Y.” J Grad Med Educ.2011;3(4):458–461.
- . Generational changes and their impact in the classroom: teaching Generation Me. Med Educ. 2009;43(5):398–405.
- , , . Twelve tips for facilitating Millennials' learning. Med Teach. 2012;34(4):274–278.
- Pew Research Center. Millennials: a portrait of generation next. Available at: http://pewsocialtrends.org/files/2010/10/millennials‐confident‐connected‐open‐to‐change.pdf. Accessed February 28, 2013.
- , , , et al. Generational influences in academic emergency medicine: teaching and learning, mentoring, and technology (part I). Acad Emerg Med. 2011;18(2):190–199.
- , , , et al. Generational influences in academic emergency medicine: structure, function, and culture (part II). Acad Emerg Med. 2011;18(2):200–207.
- , , , . Smartphone use during inpatient attending rounds: prevalence, patterns, and potential for distraction. J Hosp Med. 2012;8:595–599.
- , , , et al. Comparing millennial and generation X medical students at one medical school. Acad Med. 2006;81(6):571–576.
- , , , . Differences in motives between Millennial and Generation X students. Med Educ. 2010;44(6):570–576.
- , . Effect of ACGME duty hours on attending physician teaching and satisfaction. Arch Intern Med. 2008;168(11):1226–1227.
- , , . Residents' response to duty‐hours regulations—a follow‐up national survey. N Engl J Med. 2012; 366(24):e35.
- . Innovation arc: new approaches. Presented at: Association of American Colleges of Medicine National Meeting; November 2012; San Francisco, CA.
- , . Learner‐centered approaches in medical education. BMJ. 1999;318:1280–1283.
- , . Lecture halls without lectures—a proposal for medical education. N Engl J Med. 2012;366(18):1657–1659.
- The Khan Academy. Available at: https://www.khanacademy.org/. Accessed March 4, 2013.
- Dropbox. Dropbox Inc. Available at: https://www.dropbox.com/. Accessed April 19, 2013.
- Google Drive. Google Inc. Available at: https://drive.google.com/. Accessed April 19, 2013.
- , , , et al. What makes a good clinical teacher in medicine? A review of the literature. Acad Med. 2008;83(5):452–466.
- . Smartphones in clinical practice, medical education, and research. Arch Intern Med. 2011;171(14):1294–1296.
- , , , et al. Attending use of the electronic health record (EHR) and implications for housestaff supervision. Presented at: Midwest Society of General Internal Medicine Regional Meeting; September 2012; Chicago, IL.
- GroupMD. GroupMD Inc. Available at http://group.md. Accessed April 19, 2013.
- . Guerilla Marketing: Secrets for Making Big Profits From Your Small Business. Boston, MA: Houghton Mifflin; 1984.
- , , , et al. IBCD: development and testing of a checklist to improve quality of care for hospitalized general medical patients. Jt Comm J Qual Patient Saf. 2013;39(4):147–156.
- , . Ice cream rounds. Acad Med. 2013;88(1):66.
- , , , et al. The impact of evidence on physicians' inpatient treatment decisions. J Gen Intern Med. 2004; 19(5 pt 1):402–409.
- . Landmark article March 19, 1927: the care of the patient. By Francis W. Peabody. JAMA. 1984;252(6):813–818.
- , , , et al. The art of bedside rounds: a multi‐center qualitative study of strategies used by experienced bedside teachers. J Gen Intern Med. 2013;28(3):412–420.
- Stanford University School of Medicine. Stanford Medicine 25. Available at: http://stanfordmedicine25.stanford.edu/. Accessed February 28, 2013.
- Medical Knowledge Self‐Assessment Program 16. The American College of Physicians. Available at: https://mksap.acponline.org. Accessed April 19, 2013.
The implementation of resident duty hour restrictions has created a clinical learning environment on the wards quite different from any previous era. The Accreditation Council for Graduate Medical Education issued its first set of regulations limiting consecutive hours worked for residents in 2003, and further restricted hours in 2011.[1] These restrictions have had many implications across several aspects of patient care, education, and clinical training, particularly for hospitalists who spend the majority of their time in this setting and are heavily involved in undergraduate and graduate clinical education in academic medical centers.[2, 3]
As learning environments have been shifting, so has the composition of learners. The Millennial Generation (or Generation Y), defined as those born approximately between 1980 and 2000, represents those young clinicians currently filling the halls of medical schools and ranks of residency and fellowship programs.[4] Interestingly, the current system of restricted work hours is the only system under which the Millennial Generation has ever trained.
As this new generation represents the bulk of current trainees, hospitalist faculty must consider how their teaching styles can be adapted to accommodate these learners. For teaching hospitalists, an approach that considers the learning environment as affected by duty hours, as well as the preferences of Millennial learners, is necessary to educate the next generation of trainees. This article aimed to introduce potential strategies for hospitalists to better align teaching on the wards with the preferences of Millennial learners under the constraints of residency duty hours.
THE NEWEST GENERATION OF LEARNERS
The Millennial Generation has been well described.[4, 5, 6, 7, 8, 9, 10] Broadly speaking, this generation is thought to have been raised by attentive and involved parents, influencing relationships with educators and mentors; they respect authority but do not hesitate to question the relevance of assignments or decisions. Millennials prefer structured learning environments that focus heavily on interaction and experiential learning, and they value design and appearance in how material is presented.[7] Millennials also seek clear expectations and immediate feedback on their performance, and though they have sometimes been criticized for a strong sense of entitlement, they have a strong desire for collaboration and group‐based activity.[5, 6]
One of the most notable and defining characteristics of the Millennial Generation is an affinity for technology and innovation.[7, 8, 9] Web‐based learning tools that are interactive and engaging, such as blogs, podcasts, or streaming videos are familiar and favored methods of learning. Millennials are skilled at finding information and providing answers and data, but may need help with synthesis and application.[5] They take pride in their ability to multitask, but can be prone to doing so inappropriately, particularly with technology that is readily available.[11]
Few studies have explored characteristics of the Millennial Generation specific to medical trainees. One study examined personality characteristics of Millennial medical students compared to Generation X students (those born from 19651980) at a single institution. Millennial students scored higher on warmth, reasoning, emotional stability, rule consciousness, social boldness, sensitivity, apprehension, openness to change, and perfectionism compared to Generation X students. They scored lower on measures for self‐reliance.[12] Additionally, when motives for behavior were studied, Millennial medical students scored higher on needs for affiliation and achievement, and lower on needs for power.[13]
DUTY HOURS: A GENERATION APART
As noted previously, the Millennial Generation is the first to train exclusively in the era of duty hours restrictions. The oldest members of this generation, those born in 1981, were entering medical school at the time of the first duty hours restrictions in 2003, and thus have always been educated, trained, and practiced in an environment in which work hours were an essential part of residency training.
Though duty hours have been an omnipresent part of training for the Millennial Generation, the clinical learning environment that they have known continues to evolve and change. Time for teaching, in particular, has been especially strained by work hour limits, and this has been noted by both attending physicians and trainees with each iteration of work hours limits. Attendings in one study estimated that time spent teaching on general medicine wards was reduced by about 20% following the 2003 limits, and over 40% of residents in a national survey reported that the 2011 limits had worsened the quality of education.[14, 15]
GENERATIONAL STRATEGIES FOR SUCCESS FOR HOSPITALIST TEACHING ATTENDINGS
The time limitations imposed by duty hours restrictions have compelled teaching rounds to become more patient‐care centered and often less learner‐centered, as providing patient care becomes the prime obligation for this limited time period. Millennial learners are accustomed to being the center of attention in educational environments, and changing the focus from education to patient care in the wards setting may be an abrupt transition for some learners.[6] However, hospitalists can help restructure teaching opportunities on the clinical wards by using teaching methods of the highest value to Millennial learners to promote learning under the conditions of duty hours limitations.
An approach using these methods was developed by reviewing recent literature as well as educational innovations that have been presented at scholarly meetings (eg, Sal Khan's presentation at the 2012 Association of American Medical Colleges meeting).[16] The authors discussed potential teaching techniques that were thought to be feasible to implement in the context of the current learning environment, with consideration of learning theories that would be most effective for the target group of learners (eg, adult learning theory).[17] A mnemonic was created to consolidate strategies thought to best represent these techniques. FUTURE is a group of teaching strategies that can be used by hospitalists to improve teaching rounds by Flipping the Wards, Using Documentation to Teach, Technology‐Enabled Teaching, Using Guerilla Teaching Tactics, Rainy Day Teaching, and Embedding Teaching Moments into Rounds.
Flipping the Wards
Millennial learners prefer novel methods of delivery that are interactive and technology based.[7, 8, 9] Lectures and slide‐based presentations frequently do not feature the degree of interactive engagement that they seek, and methods such as case‐based presentations and simulation may be more suitable. The Khan Academy is a not‐for‐profit organization that has been proposed as a model for future directions for medical education.[18] The academy's global classroom houses over 4000 videos and interactive modules to allow students to progress through topics on their own time.[19] Teaching rounds can be similarly flipped such that discussion and group work take place during rounds, whereas lectures, modules, and reading are reserved for individual study.[18]
As time pressures shift the focus of rounds exclusively toward discussion of patient‐care tasks, finding time for teaching outside of rounds can be emphasized to inspire self‐directed learning. When residents need time to tend to immediate patient‐care issues, hospitalist attendings could take the time to search for articles to send to team members. Rather than distributing paper copies that may be lost, cloud‐based data management systems such as Dropbox (Dropbox, San Francisco, CA) or Google Drive (Google Inc., Mountain View, CA) can be used to disseminate articles, which can be pulled up in real time on mobile devices during rounds and later deposited in shared folders accessible to all team members.[20, 21] The advantage of this approach is that it does not require all learners to be present on rounds, which may not be possible with duty hours.
Using Documentation to Teach
Trainees report that one of the most desirable attributes of clinical teachers is when they delineate their clinical reasoning and thought process.[22] Similarly, Millennial learners specifically desire to understand the rationale behind their teachers' actions.[6] Documentation in the medical chart or electronic health record (EHR) can be used to enhance teaching and role‐model clinical reasoning in a transparent and readily available fashion.
Billing requirements necessitate daily attending documentation in the form of an attestation. Hospitalist attendings can use attestations to model thought process and clinical synthesis in the daily assessment of a patient. For example, an attestation one‐liner can be used to concisely summarize the patient's course or highlight the most pressing issue of the day, rather than simply serve as a placeholder for billing or agree with above in reference to housestaff documentation. This practice can demonstrate to residents how to write a short snapshot of a patient's care in addition to improving communication.
Additionally, the EHR can be a useful platform to guide feedback for residents on their clinical performance. Millennial learners prefer specific, immediate feedback, and trainee documentation can serve as a template to show examples of good documentation and clinical reasoning as well as areas needing improvement.[5] These tangible examples of clinical performance are specific and understandable for trainees to guide their self‐learning and improvement.
Technology‐Enabled Teaching
Using technology wisely on the wards can improve efficiency while also taking advantage of teaching methods familiar to Millennial learners. Technology can be used in a positive manner to keep the focus on the patient and enhance teaching when time is limited on rounds. Smartphones and tablets have become an omnipresent part of the clinical environment.[23] Rather than distracting from rounds, these tools can be used to answer clinical questions in real time, thus directly linking the question to the patient's care.
The EHR is a powerful technological resource that is readily available to enhance teaching during a busy ward schedule. Clinical information is electronically accessible at all hours for both trainees and attendings, rather than only at prespecified times on daily rounds, and the Millennial Generation is accustomed to receiving and sharing information in this fashion.[24] Technology platforms that enable simultaneous sharing of information among multiple members of a team can also be used to assist in sharing clinical information in this manner. Health Insurance Portability and Accountability Act‐compliant group text‐messaging applications for smartphones and tablets such as GroupMD (GroupMD, San Francisco, CA) allow members of a team to connect through 1 portal.[25] These discussions can foster communication, inspire clinical questions, and model the practice of timely response to new information.
Using Guerilla Teaching Tactics
Though time may be limited by work hours, there are opportunities embedded into clinical practice to create teaching moments. The principle of guerilla marketing uses unconventional marketing tactics in everyday locales to aggressively promote a product.[26] Similarly, guerilla teaching might be employed on rounds to make teaching points about common patient care issues that occur at nearly every room, such as Foley catheters after seeing one at the beside or hand hygiene after leaving a room. These types of topics are familiar to trainees as well as hospitalist attendings and fulfill the relevance that Millennial learners seek by easily applying them to the patient at hand.
Memory triggers or checklists are another way to systematically introduce guerilla teaching on commonplace topics. The IBCD checklist, for example, has been successfully implemented at our institution to promote adherence to 4 quality measures.[27] IBCD, which stands for immunizations, bedsores, catheters, and deep vein thrombosis prophylaxis, is easily and quickly tacked on as a checklist item at the end of the problem list during a presentation. Similar checklists can serve as teaching points on quality and safety in inpatient care, as well as reminders to consider these issues for every patient.
Rainy Day Teaching
Hospitalist teaching attendings recognize that duty hours have shifted the preferred time for teaching away from busy admission periods such as postcall rounds.[28] The limited time spent reviewing new admissions is now often focused on patient care issues, with much of the discussion eliminated. However, hospitalist attendings can be proactive and save certain teaching moments for rainy day teaching, anticipating topics to introduce during lower census times. Additionally, attending access to the EHRs allows attendings to preview cases the residents have admitted during a call period and may facilitate planning teaching topics for future opportunities.[23]
Though teaching is an essential part of the hospitalist teaching attending role, the Millennial Generation's affinity for teamwork makes it possible to utilize additional team members as teachers for the group. This type of distribution of responsibility, or outsourcing of teaching, can be done in the form of a teaching or float resident. These individuals can be directed to search the literature to answer clinical questions the team may have during rounds and report back, which may influence decision making and patient care as well as provide education.[29]
Embedding Teaching Moments Into Rounds
Dr. Francis W. Peabody may have been addressing students many generations removed from Millennial learners when he implored them to remember that the secret of the care of the patient is in caring for the patient, but his maxim still rings true today.[30] This advice provides an important insight on how the focus can be kept on the patient by emphasizing physical examination and history‐taking skills, which engages learners in hands‐on activity and grounds that education in a patient‐based experience.[31] The Stanford 25 represents a successful project that refocuses the doctorpatient encounter on the bedside.[32] Using a Web‐based platform, this initiative instructs on 25 physical examination maneuvers, utilizing teaching methods that are familiar to Millennial learners and are patient focused.
In addition to emphasizing bedside teaching, smaller moments can be used during rounds to establish an expectation for learning. Hospitalist attendings can create a routine with daily teaching moments, such as an electrocardiogram or a daily Medical Knowledge Self‐Assessment Program question, a source of internal medicine board preparation material published by the American College of Physicians.[33] These are opportunities to inject a quick educational moment that is easily relatable to the patients on the team's service. Using teaching moments that are routine, accessible, and relevant to patient care can help shape Millennial learners' expectations that teaching be a daily occurrence interwoven within clinical care provided during rounds.
There are several limitations to our work. These strategies do not represent a systematic review, and there is little evidence to support that our approach is more effective than conventional teaching methods. Though we address hospitalists specifically, these strategies are likely suitable for all inpatient educators as they have not been well studied in specific groups. With the paucity of literature regarding learning preferences of Millennial medical trainees, it is difficult to know what methods may truly be most desirable in the wards setting, as many of the needs and learning styles considered in our approach are borrowed from other more traditional learning environments. It is unclear how adoptable our strategies may be for educators from other generations; these faculty may have different approaches to teaching. Further research is necessary to identify areas for faculty development in learning new techniques as well as compare the efficacy of our approach to conventional methods with respect to standardized educational outcomes such as In‐Training Exam performance, as well as patient outcomes.
ACCEPTING THE CHALLENGE
The landscape of clinical teaching has shifted considerably in recent years, in both the makeup of learners for whom educators are responsible for teaching as well as the challenges in teaching under the duty hours restrictions. Though rounds are more focused on patient care than in the past, it is possible to work within the current structure to promote successful learning with an approach that considers the preferences of today's learners.
A hospitalist's natural habitat, the busy inpatient wards, is a clinical learning environment with rich potential for innovation and excellence in teaching. The challenges in practicing hospital medicine closely parallel the challenges in teaching under the constraints of duty hours restrictions; both require a creative approach to problem solving and an affinity for teamwork. The hospitalist community is well suited to not only meet these challenges but become leaders in embracing how to teach effectively on today's wards. Maximizing interaction, embracing technology, and encouraging group‐based learning may represent the keys to a successful approach to teaching the Millennial Generation in a post‐duty hours world.
- , , ; ACGME Duty Hour Task Force. The new recommendations on duty hours from the ACGME Task Force. N Engl J Med. 2010;363(2):e3.
- , . The emerging role of “hospitalists” in the American health care system. N Engl J Med. 1996;335(7):514–517.
- , , , et al. Hospital medicine in the internal medicine clerkship: results from a national survey. J Hosp Med. 2012;7(7):557–561.
- , . Millennials Rising: The Next Great Generation. New York, NY: Random House/Vintage Books; 2000.
- Eckleberry‐Hunt J, Tucciarone J. The challenges and opportunities of teaching “Generation Y.” J Grad Med Educ.2011;3(4):458–461.
- . Generational changes and their impact in the classroom: teaching Generation Me. Med Educ. 2009;43(5):398–405.
- , , . Twelve tips for facilitating Millennials' learning. Med Teach. 2012;34(4):274–278.
- Pew Research Center. Millennials: a portrait of generation next. Available at: http://pewsocialtrends.org/files/2010/10/millennials‐confident‐connected‐open‐to‐change.pdf. Accessed February 28, 2013.
- , , , et al. Generational influences in academic emergency medicine: teaching and learning, mentoring, and technology (part I). Acad Emerg Med. 2011;18(2):190–199.
- , , , et al. Generational influences in academic emergency medicine: structure, function, and culture (part II). Acad Emerg Med. 2011;18(2):200–207.
- , , , . Smartphone use during inpatient attending rounds: prevalence, patterns, and potential for distraction. J Hosp Med. 2012;8:595–599.
- , , , et al. Comparing millennial and generation X medical students at one medical school. Acad Med. 2006;81(6):571–576.
- , , , . Differences in motives between Millennial and Generation X students. Med Educ. 2010;44(6):570–576.
- , . Effect of ACGME duty hours on attending physician teaching and satisfaction. Arch Intern Med. 2008;168(11):1226–1227.
- , , . Residents' response to duty‐hours regulations—a follow‐up national survey. N Engl J Med. 2012; 366(24):e35.
- . Innovation arc: new approaches. Presented at: Association of American Colleges of Medicine National Meeting; November 2012; San Francisco, CA.
- , . Learner‐centered approaches in medical education. BMJ. 1999;318:1280–1283.
- , . Lecture halls without lectures—a proposal for medical education. N Engl J Med. 2012;366(18):1657–1659.
- The Khan Academy. Available at: https://www.khanacademy.org/. Accessed March 4, 2013.
- Dropbox. Dropbox Inc. Available at: https://www.dropbox.com/. Accessed April 19, 2013.
- Google Drive. Google Inc. Available at: https://drive.google.com/. Accessed April 19, 2013.
- , , , et al. What makes a good clinical teacher in medicine? A review of the literature. Acad Med. 2008;83(5):452–466.
- . Smartphones in clinical practice, medical education, and research. Arch Intern Med. 2011;171(14):1294–1296.
- , , , et al. Attending use of the electronic health record (EHR) and implications for housestaff supervision. Presented at: Midwest Society of General Internal Medicine Regional Meeting; September 2012; Chicago, IL.
- GroupMD. GroupMD Inc. Available at http://group.md. Accessed April 19, 2013.
- . Guerilla Marketing: Secrets for Making Big Profits From Your Small Business. Boston, MA: Houghton Mifflin; 1984.
- , , , et al. IBCD: development and testing of a checklist to improve quality of care for hospitalized general medical patients. Jt Comm J Qual Patient Saf. 2013;39(4):147–156.
- , . Ice cream rounds. Acad Med. 2013;88(1):66.
- , , , et al. The impact of evidence on physicians' inpatient treatment decisions. J Gen Intern Med. 2004; 19(5 pt 1):402–409.
- . Landmark article March 19, 1927: the care of the patient. By Francis W. Peabody. JAMA. 1984;252(6):813–818.
- , , , et al. The art of bedside rounds: a multi‐center qualitative study of strategies used by experienced bedside teachers. J Gen Intern Med. 2013;28(3):412–420.
- Stanford University School of Medicine. Stanford Medicine 25. Available at: http://stanfordmedicine25.stanford.edu/. Accessed February 28, 2013.
- Medical Knowledge Self‐Assessment Program 16. The American College of Physicians. Available at: https://mksap.acponline.org. Accessed April 19, 2013.
Quantifying Treatment Intensity
Healthcare spending exceeded $2.5 trillion in 2007, and payments to hospitals represented the largest portion of this spending (more than 30%), equaling the combined cost of physician services and prescription drugs.[1, 2] Researchers and policymakers have emphasized the need to improve the value of hospital care in the United States, but this has been challenging, in part because of the difficulty in identifying hospitals that have high resource utilization relative to their peers.[3, 4, 5, 6, 7, 8, 9, 10, 11]
Most hospitals calculate their costs using internal accounting systems that determine resource utilization via relative value units (RVUs).[7, 8] RVU‐derived costs, also known as hospital reported costs, have proven to be an excellent method for quantifying what it costs a given hospital to provide a treatment, test, or procedure. However, RVU‐based costs are less useful for comparing resource utilization across hospitals because the cost to provide a treatment or service varies widely across hospitals. The cost of an item calculated using RVUs includes not just the item itself, but also a portion of the fixed costs of the hospital (overhead, labor, and infrastructure investments such as electronic records, new buildings, or expensive radiological or surgical equipment).[12] These costs vary by institution, patient population, region of the country, teaching status, and many other variables, making it difficult to identify resource utilization across hospitals.[13, 14]
Recently, a few claims‐based multi‐institutional datasets have begun incorporating item‐level RVU‐based costs derived directly from the cost accounting systems of participating institutions.[15] Such datasets allow researchers to compare reported costs of care from hospital to hospital, but because of the limitations we described above, they still cannot be used to answer the question: Which hospitals with higher costs of care are actually providing more treatments and services to patients?
To better facilitate the comparison of resource utilization patterns across hospitals, we standardized the unit costs of all treatments and services across hospitals by applying a single cost to every item across hospitals. This standardized cost allowed to compare utilization of that item (and the 15,000 other items in the database) across hospitals. We then compared estimates of resource utilization as measured by the 2 approaches: standardized and RVU‐based costs.
METHODS
Ethics Statement
All data were deidentified, by Premier, Inc., at both the hospital and patient level in accordance with the Health Insurance Portability and Accountability Act. The Yale University Human Investigation Committee reviewed the protocol for this study and determined that it is not considered to be human subjects research as defined by the Office of Human Research Protections.
Data Source
We conducted a cross‐sectional study using data from hospitals that participated in the database maintained by Premier Healthcare Informatics (Charlotte, NC) in the years 2009 to 2010. The Premier database is a voluntary, fee‐supported database created to measure quality and healthcare utilization.[3, 16, 17, 18] In 2010, it included detailed billing data from 500 hospitals in the United States, with more than 130 million cumulative hospital discharges. The detailed billing data includes all elements found in hospital claims derived from the uniform billing‐04 form, as well as an itemized, date‐stamped log of all items and services charged to the patient or insurer, such as medications, laboratory tests, and diagnostic and therapeutic services. The database includes approximately 15% of all US hospitalizations. Participating hospitals are similar to the composition of acute care hospitals nationwide. They represent all regions of the United States, and represent predominantly small‐ to mid‐sized nonteaching facilities that serve a largely urban population. The database also contains hospital reported costs at the item level as well as the total cost of the hospitalization. Approximately 75% of hospitals that participate submit RVU‐based costs taken from internal cost accounting systems. Because of our focus on comparing standardized costs to reported costs, we included only data from hospitals that use RVU‐based costs in this study.
Study Subjects
We included adult patients with a hospitalization recorded in the Premier database between January 1, 2009 and December 31, 2010, and a principal discharge diagnosis of heart failure (HF) (International Classification of Diseases, Ninth Revision, Clinical Modification codes: 402.01, 402.11, 402.91, 404.01, 404.03, 404.11, 404.13, 404.91, 404.93, 428.xx). We excluded transfers, patients assigned a pediatrician as the attending of record, and those who received a heart transplant or ventricular assist device during their stay. Because cost data are prone to extreme outliers, we excluded hospitalizations that were in the top 0.1% of length of stay, number of billing records, quantity of items billed, or total standardized cost. We also excluded hospitals that admitted fewer than 25 HF patients during the study period to reduce the possibility that a single high‐cost patient affected the hospital's cost profile.
Hospital Information
For each hospital included in the study, we recorded number of beds, teaching status, geographic region, and whether it served an urban or rural population.
Assignment of Standardized Costs
We defined reported cost as the RVU‐based cost per item in the database. We then calculated the median across hospitals for each item in the database and set this as the standardized unit cost of that item at every hospital (Figure 1). Once standardized costs were assigned at the item level, we summed the costs of all items assigned to each patient and calculated the standardized cost of a hospitalization per patient at each hospital.

Examination of Cost Variation
We compared the standardized and reported costs of hospitalizations using medians, interquartile ranges, and interquartile ratios (Q75/Q25). To examine whether standardized costs can reduce the noise due to differences in overhead and other fixed costs, we calculated, for each hospital, the coefficients of variation (CV) for per‐day reported and standardized costs and per‐hospitalization reported and standardized costs. We used the Fligner‐Killeen test to determine whether the variance of CVs was different for reported and standardized costs.[19]
Creation of Basket of Goods
Because there can be differences in the costs of items, the number and types of items administered during hospitalizations, 2 hospitals with similar reported costs for a hospitalization might deliver different quantities and combinations of treatments (Figure 1). We wished to demonstrate that there is variation in reported costs of items when the quantity and type of item is held constant, so we created a basket of items. We chose items that are commonly administered to patients with heart failure, but could have chosen any combination of items. The basket included a day of medical room and board, a day of intensive care unit (ICU) room and board, a single dose of ‐blocker, a single dose of angiotensin‐converting enzyme inhibitor, complete blood count, a B‐natriuretic peptide level, a chest radiograph, a chest computed tomography, and an echocardiogram. We then examined the range of hospitals' reported costs for this basket of goods using percentiles, medians, and interquartile ranges.
Reported to Standardized Cost Ratio
Next, we calculated standardized costs of hospitalizations for included hospitals and examined the relationship between hospitals' mean reported costs and mean standardized costs. This ratio could help diagnose the mechanism of high reported costs for a hospital, because high reported costs with low utilization would indicate high fixed costs, while high reported costs with high utilization would indicate greater use of tests and treatments. We assigned hospitals to strata based on reported costs greater than standardized costs by more than 25%, reported costs within 25% of standardized costs, and reported costs less than standardized costs by more than 25%. We examined the association between hospital characteristics and strata using a 2 test. All analyses were carried out using SAS version 9.3 (SAS Institute Inc., Cary, NC).
RESULTS
The 234 hospitals included in the analysis contributed a total of 165,647 hospitalizations, with the number of hospitalizations ranging from 33 to 2,772 hospitalizations per hospital (see Supporting Table 1 in the online version of this article). Most were located in urban areas (84%), and many were in the southern United States (42%). The median hospital reported cost per hospitalization was $6,535, with an interquartile range of $5,541 to $7,454. The median standardized cost per hospitalization was $6,602, with a range of $5,866 to $7,386. The interquartile ratio (Q75/Q25) of the reported costs of a hospitalization was 1.35. After costs were standardized, the interquartile ratio fell to 1.26, indicating that variation decreased. We found that the median hospital reported cost per day was $1,651, with an IQR of $1,400 to $1,933 (ratio 1.38), whereas the median standardized cost per day was $1,640, with an IQR of $1,511 to $1,812 (ratio 1.20).
There were more than 15,000 items (eg, treatments, tests, and supplies) that received a standardized charge code in our cohort. These were divided into 11 summary departments and 40 standard departments (see Supporting Table 2 in the online version of this article). We observed a high level of variation in the reported costs of individual items: the reported costs of a day of room and board in an ICU ranged from $773 at hospitals at the 10th percentile to $2,471 at the 90th percentile (Table 1.). The standardized cost of a day of ICU room and board was $1,577. We also observed variation in the reported costs of items across item categories. Although a day of medical room and board showed a 3‐fold difference between the 10th and 90th percentile, we observed a more than 10‐fold difference in the reported cost of an echocardiogram, from $31 at the 10th percentile to $356 at the 90th percentile. After examining the hospital‐level cost for a basket of goods, we found variation in the reported costs for these items across hospitals, with a 10th percentile cost of $1,552 and a 90th percentile cost of $3,967.
| Reported Costs | 10th Percentile | 25th Percentile | 75th Percentile | 90th Percentile | Median (Standardized Cost) |
|---|---|---|---|---|---|
| |||||
| Item | |||||
| Day of medical | 490.03 | 586.41 | 889.95 | 1121.20 | 722.59 |
| Day of ICU | 773.01 | 1275.84 | 1994.81 | 2471.75 | 1577.93 |
| Complete blood count | 6.87 | 9.34 | 18.34 | 23.46 | 13.07 |
| B‐natriuretic peptide | 12.13 | 19.22 | 44.19 | 60.56 | 28.23 |
| Metoprolol | 0.20 | 0.68 | 2.67 | 3.74 | 1.66 |
| Lisinopril | 0.28 | 1.02 | 2.79 | 4.06 | 1.72 |
| Spironolactone | 0.22 | 0.53 | 2.68 | 3.83 | 1.63 |
| Furosemide | 1.27 | 2.45 | 5.73 | 8.12 | 3.82 |
| Chest x‐ray | 43.88 | 51.54 | 89.96 | 117.16 | 67.45 |
| Echocardiogram | 31.53 | 98.63 | 244.63 | 356.50 | 159.07 |
| Chest CT (w & w/o contrast) | 65.17 | 83.99 | 157.23 | 239.27 | 110.76 |
| Noninvasive positive pressure ventilation | 126.23 | 127.25 | 370.44 | 514.67 | 177.24 |
| Electrocardiogram | 12.08 | 18.77 | 42.74 | 64.94 | 29.78 |
| Total basket | 1552.50 | 2157.85 | 3417.34 | 3967.78 | 2710.49 |
We found that 46 (20%) hospitals had reported costs of hospitalizations that were 25% greater than standardized costs (Figure 2). This group of hospitals had overestimated reported costs of utilization; 146 (62%) had reported costs within 25% of standardized costs, and 42 (17%) had reported costs that were 25% less than standardized costs (indicating that reported costs underestimated utilization). We examined the relationship between hospital characteristics and strata and found no significant association between the reported to standardized cost ratio and number of beds, teaching status, or urban location (Table 2). Hospitals in the Midwest and South were more likely to have a lower reported cost of hospitalizations, whereas hospitals in the West were more likely to have higher reported costs (P<0.001). When using the CV to compare reported costs to standardized costs, we found that per‐day standardized costs showed reduced variance (P=0.0238), but there was no significant difference in variance of the reported and standardized costs when examining the entire hospitalization (P=0.1423). At the level of the hospitalization, the Spearman correlation coefficient between reported and standardized cost was 0.89.
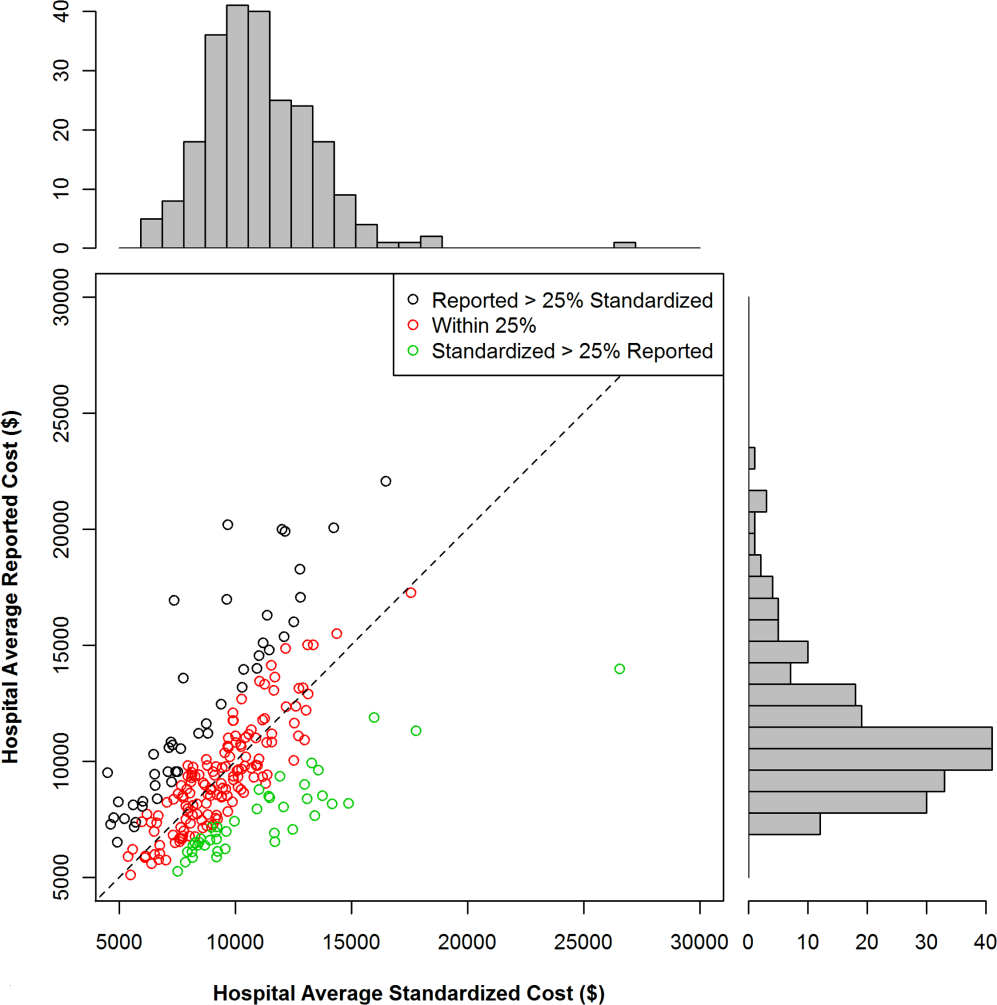
| Reported Greater Than Standardized by >25%, n (%) | Reported Within 25% (2‐tailed) of Standardized, n (%) | Reported Less Than Standardized by >25%, n (%) | P for 2 Test | |
|---|---|---|---|---|
| Total | 46 (19.7) | 146 (62.4) | 42 (17.0) | |
| No. of beds | 0.2313 | |||
| <200 | 19 (41.3) | 40 (27.4) | 12 (28.6) | |
| 200400 | 14 (30.4) | 67 (45.9) | 15 (35.7) | |
| >400 | 13 (28.3) | 39 (26.7) | 15 (35.7) | |
| Teaching | 0.8278 | |||
| Yes | 13 (28.3) | 45 (30.8) | 11 (26.2) | |
| No | 33 (71.7) | 101 (69.2) | 31 (73.8) | |
| Region | <0.0001 | |||
| Midwest | 7 (15.2) | 43 (29.5) | 19 (45.2) | |
| Northeast | 6 (13.0) | 18 (12.3) | 3 (7.1) | |
| South | 14 (30.4) | 64 (43.8) | 20 (47.6) | |
| West | 19 (41.3) | 21 (14.4) | 0 (0) | |
| Urban vs rural | 36 (78.3) | 128 (87.7) | 33 (78.6) | 0.1703 |
To better understand how hospitals can achieve high reported costs through different mechanisms, we more closely examined 3 hospitals with similar reported costs (Figure 3). These hospitals represented low, average, and high utilization according to their standardized costs, but had similar average per‐hospitalization reported costs: $11,643, $11,787, and $11,892, respectively. The corresponding standardized costs were $8,757, $11,169, and $15,978. The hospital with high utilization ($15,978 in standardized costs) was accounted for by increased use of supplies and other services. In contrast, the low‐ and average‐utilization hospitals had proportionally lower standardized costs across categories, with the greatest percentage of spending going toward room and board (includes nursing).
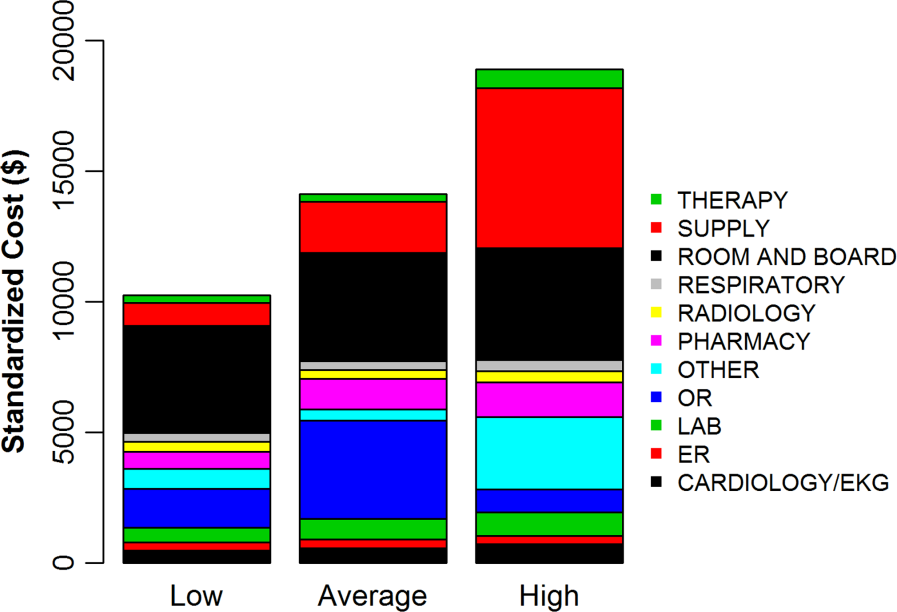
DISCUSSION
In a large national sample of hospitals, we observed variation in the reported costs for a uniform basket of goods, with a more than 2‐fold difference in cost between the 10th and 90th percentile hospitals. These findings suggest that reported costs have limited ability to reliably describe differences in utilization across hospitals. In contrast, when we applied standardized costs, the variance of per‐day costs decreased significantly, and the interquartile ratio of per‐day and hospitalization costs decreased as well, suggesting less variation in utilization across hospitals than would have been inferred from a comparison of reported costs. Applying a single, standard cost to all items can facilitate comparisons of utilization between hospitals (Figure 1). Standardized costs will give hospitals the potential to compare their utilization to their competitors and will facilitate research that examines the comparative effectiveness of high and low utilization in the management of medical and surgical conditions.
The reported to standardized cost ratio is another useful tool. It indicates whether the hospital's reported costs exaggerate its utilization relative to other hospitals. In this study, we found that a significant proportion of hospitals (20%) had reported costs that exceeded standardized costs by more than 25%. These hospitals have higher infrastructure, labor, or acquisition costs relative to their peers. To the extent that these hospitals might wish to lower the cost of care at their institution, they could focus on renegotiating purchasing or labor contracts, identifying areas where they may be overstaffed, or holding off on future infrastructure investments (Table 3).[14] In contrast, 17% of hospitals had reported costs that were 25% less than standardized costs. High‐cost hospitals in this group are therefore providing more treatments and testing to patients relative to their peers and could focus cost‐control efforts on reducing unnecessary utilization and duplicative testing.[20] Our examination of the hospital with high reported costs and very high utilization revealed a high percentage of supplies and other items, which is a category used primarily for nursing expenditures (Figure 3). Because the use of nursing services is directly related to days spent in the hospital, this hospital may wish to more closely examine specific strategies for reducing length of stay.
| High Reported Costs/High Standardized Costs | High Reported Costs/Low Standardized Costs | Low Reported Costs/High Standardized Costs | Low Reported Costs/Low Standardized Costs | |
|---|---|---|---|---|
| Utilization | High | Low | High | Low |
| Severity of illness | Likely to be higher | Likely to be lower | Likely to be higher | Likely to be lower |
| Practice style | Likely to be more intense | Likely to be less intense | Likely to be more intense | Likely to be less intense |
| Fixed costs | High or average | High | Low | Low |
| Infrastructure costs | Likely to be higher | Likely to be higher | Likely to be lower | Likely to be lower |
| Labor costs | Likely to be higher | Likely to be higher | Likely to be lower | Likely to be lower |
| Reported‐to‐standardized cost ratio | Close to 1 | >1 | <1 | Close to 1 |
| Causes of high costs | High utilization, high fixed costs, or both | High acquisition costs, high labor costs, or expensive infrastructure | High utilization | |
| Interventions to reduce costs | Work with clinicians to alter practice style, consider renegotiating cost of acquisitions, hold off on new infrastructure investments | Consider renegotiating cost of acquisitions, hold off on new infrastructure investments, consider reducing size of labor force | Work with clinicians to alter practice style | |
| Usefulness of reported‐ to‐standardized cost ratio | Less useful | More useful | More useful | Less useful |
We did not find a consistent association between the reported to standardized cost ratio and hospital characteristics. This is an important finding that contradicts prior work examining associations between hospital characteristics and costs for heart failure patients,[21] further indicating the complexity of the relationship between fixed costs and variable costs and the difficulty in adjusting reported costs to calculate utilization. For example, small hospitals may have higher acquisition costs and more supply chain difficulties, but they may also have less technology, lower overhead costs, and fewer specialists to order tests and procedures. Hospital characteristics, such as urban location and teaching status, are commonly used as adjustors in cost studies because hospitals in urban areas with teaching missions (which often provide care to low‐income populations) are assumed to have higher fixed costs,[3, 4, 5, 6] but the lack of a consistent relationship between these characteristics and the standardized cost ratio may indicate that using these factors as adjustors for cost may not be effective and could even obscure differences in utilization between hospitals. Notably, we did find an association between hospital region and the reported to standardized cost ratio, but we hesitate to draw conclusions from this finding because the Premier database is imbalanced in terms of regional representation, with fewer hospitals in the Midwest and West and the bulk of the hospitals in the South.
Although standardized costs have great potential, this method has limitations as well. Standardized costs can only be applied when detailed billing data with item‐level costs are available. This is because calculation of standardized costs requires taking the median of item costs and applying the median cost across the database, maintaining the integrity of the relative cost of items to one another. The relative cost of items is preserved (ie, magnetic resonance imaging still costs more than an aspirin), which maintains the general scheme of RVU‐based costs while removing the noise of varying RVU‐based costs across hospitals.[7] Application of an arbitrary item cost would result in the loss of this relative cost difference. Because item costs are not available in traditional administrative datasets, these datasets would not be amenable to this method. However, highly detailed billing data are now being shared by hundreds of hospitals in the Premier network and the University Health System Consortium. These data are widely available to investigators, meaning that the generalizability of this method will only improve over time. It was also a limitation of the study that we chose a limited basket of items common to patients with heart failure to describe the range of reported costs and to provide a standardized snapshot by which to compare hospitals. Because we only included a few items, we may have overestimated or underestimated the range of reported costs for such a basket.
Standardized costs are a novel method for comparing utilization across hospitals. Used properly, they will help identify high‐ and low‐intensity providers of hospital care.
- Health care costs–a primer. Kaiser Family Foundation Web site. Available at: http://www.kff.org/insurance/7670.cfm. Accessed July 20, 2012.
- . Explaining high health care spending in the United States: an international comparison of supply, utilization, prices, and quality. The Commonwealth Fund. 2012. Available at: http://www.commonwealthfund.org/Publications/Issue‐Briefs/2012/May/High‐Health‐Care‐Spending. aspx. Accessed on July 20, 2012.
- , , , , , . The relationship between hospital spending and mortality in patients with sepsis. Arch Intern Med. 2011;171(4):292–299.
- , , , . The elusive connection between health care spending and quality. Health Aff (Millwood). 2009;28(1):w119–w123.
- , , , . Hospital quality and intensity of spending: is there an association? Health Aff (Millwood). 2009;28(4):w566–w572.
- , , , , . Measuring efficiency: the association of hospital costs and quality of care. Health Aff (Millwood). 2009;28(3):897–906.
- , . Assigning resources to health care use for health services research: options and consequences. Med Care. 2009;47(7 suppl 1):S70–S75.
- , , , , . Health care costing: data, methods, current applications. Med Care. 2009;47(7 suppl 1):S1–S6.
- . Determination of VA health care costs. Med Care Res Rev. 2003;60(3 suppl):124S–141S.
- . An improved set of standards for finding cost for cost‐effectiveness analysis. Med Care. 2009;47(7 suppl 1):S82–S88.
- , , , et al. Comparison of approaches for estimating prevalence costs of care for cancer patients: what is the impact of data source? Med Care. 2009;47(7 suppl 1):S64–S69.
- . Principles involved in costing. Med J Aust. 1990;153Suppl:S10–S12.
- . Spending more through “cost control:” our obsessive quest to gut the hospital. Health Aff (Millwood). 1996;15(2):145–154.
- , , , et al. Distribution of variable vs. fixed costs of hospital care. JAMA. 1999;281(7):644–649.
- . Administrative and claims records as sources of health care cost data. Med Care. 2009;47(7 suppl 1):S51–S55.
- , , , , , . Perioperative beta‐blocker therapy and mortality after major noncardiac surgery. N Engl J Med. 2005;353(4):349–361.
- , , , et al. Public reporting and pay for performance in hospital quality improvement. N Engl J Med. 2007;356(5):486–496.
- , , , et al. Procedure intensity and the cost of care. Circ Cardiovasc Qual Outcomes. 2012;5(3):308–313.
- , , . A comparative study of tests for homogeneity of variances, with applications to the outer continental shelf bidding data. Technometrics. 1981;23:351–361.
- , , . Beyond the efficiency index: finding a better way to reduce overuse and increase efficiency in physician care. Health Aff (Millwood). 2008;27(4):w250–w259.
- , , . The association between hospital volume and processes, outcomes, and costs of care for congestive heart failure. Ann Intern Med. 2011;154(2):94–102.
Healthcare spending exceeded $2.5 trillion in 2007, and payments to hospitals represented the largest portion of this spending (more than 30%), equaling the combined cost of physician services and prescription drugs.[1, 2] Researchers and policymakers have emphasized the need to improve the value of hospital care in the United States, but this has been challenging, in part because of the difficulty in identifying hospitals that have high resource utilization relative to their peers.[3, 4, 5, 6, 7, 8, 9, 10, 11]
Most hospitals calculate their costs using internal accounting systems that determine resource utilization via relative value units (RVUs).[7, 8] RVU‐derived costs, also known as hospital reported costs, have proven to be an excellent method for quantifying what it costs a given hospital to provide a treatment, test, or procedure. However, RVU‐based costs are less useful for comparing resource utilization across hospitals because the cost to provide a treatment or service varies widely across hospitals. The cost of an item calculated using RVUs includes not just the item itself, but also a portion of the fixed costs of the hospital (overhead, labor, and infrastructure investments such as electronic records, new buildings, or expensive radiological or surgical equipment).[12] These costs vary by institution, patient population, region of the country, teaching status, and many other variables, making it difficult to identify resource utilization across hospitals.[13, 14]
Recently, a few claims‐based multi‐institutional datasets have begun incorporating item‐level RVU‐based costs derived directly from the cost accounting systems of participating institutions.[15] Such datasets allow researchers to compare reported costs of care from hospital to hospital, but because of the limitations we described above, they still cannot be used to answer the question: Which hospitals with higher costs of care are actually providing more treatments and services to patients?
To better facilitate the comparison of resource utilization patterns across hospitals, we standardized the unit costs of all treatments and services across hospitals by applying a single cost to every item across hospitals. This standardized cost allowed to compare utilization of that item (and the 15,000 other items in the database) across hospitals. We then compared estimates of resource utilization as measured by the 2 approaches: standardized and RVU‐based costs.
METHODS
Ethics Statement
All data were deidentified, by Premier, Inc., at both the hospital and patient level in accordance with the Health Insurance Portability and Accountability Act. The Yale University Human Investigation Committee reviewed the protocol for this study and determined that it is not considered to be human subjects research as defined by the Office of Human Research Protections.
Data Source
We conducted a cross‐sectional study using data from hospitals that participated in the database maintained by Premier Healthcare Informatics (Charlotte, NC) in the years 2009 to 2010. The Premier database is a voluntary, fee‐supported database created to measure quality and healthcare utilization.[3, 16, 17, 18] In 2010, it included detailed billing data from 500 hospitals in the United States, with more than 130 million cumulative hospital discharges. The detailed billing data includes all elements found in hospital claims derived from the uniform billing‐04 form, as well as an itemized, date‐stamped log of all items and services charged to the patient or insurer, such as medications, laboratory tests, and diagnostic and therapeutic services. The database includes approximately 15% of all US hospitalizations. Participating hospitals are similar to the composition of acute care hospitals nationwide. They represent all regions of the United States, and represent predominantly small‐ to mid‐sized nonteaching facilities that serve a largely urban population. The database also contains hospital reported costs at the item level as well as the total cost of the hospitalization. Approximately 75% of hospitals that participate submit RVU‐based costs taken from internal cost accounting systems. Because of our focus on comparing standardized costs to reported costs, we included only data from hospitals that use RVU‐based costs in this study.
Study Subjects
We included adult patients with a hospitalization recorded in the Premier database between January 1, 2009 and December 31, 2010, and a principal discharge diagnosis of heart failure (HF) (International Classification of Diseases, Ninth Revision, Clinical Modification codes: 402.01, 402.11, 402.91, 404.01, 404.03, 404.11, 404.13, 404.91, 404.93, 428.xx). We excluded transfers, patients assigned a pediatrician as the attending of record, and those who received a heart transplant or ventricular assist device during their stay. Because cost data are prone to extreme outliers, we excluded hospitalizations that were in the top 0.1% of length of stay, number of billing records, quantity of items billed, or total standardized cost. We also excluded hospitals that admitted fewer than 25 HF patients during the study period to reduce the possibility that a single high‐cost patient affected the hospital's cost profile.
Hospital Information
For each hospital included in the study, we recorded number of beds, teaching status, geographic region, and whether it served an urban or rural population.
Assignment of Standardized Costs
We defined reported cost as the RVU‐based cost per item in the database. We then calculated the median across hospitals for each item in the database and set this as the standardized unit cost of that item at every hospital (Figure 1). Once standardized costs were assigned at the item level, we summed the costs of all items assigned to each patient and calculated the standardized cost of a hospitalization per patient at each hospital.
Examination of Cost Variation
We compared the standardized and reported costs of hospitalizations using medians, interquartile ranges, and interquartile ratios (Q75/Q25). To examine whether standardized costs can reduce the noise due to differences in overhead and other fixed costs, we calculated, for each hospital, the coefficients of variation (CV) for per‐day reported and standardized costs and per‐hospitalization reported and standardized costs. We used the Fligner‐Killeen test to determine whether the variance of CVs was different for reported and standardized costs.[19]
Creation of Basket of Goods
Because there can be differences in the costs of items, the number and types of items administered during hospitalizations, 2 hospitals with similar reported costs for a hospitalization might deliver different quantities and combinations of treatments (Figure 1). We wished to demonstrate that there is variation in reported costs of items when the quantity and type of item is held constant, so we created a basket of items. We chose items that are commonly administered to patients with heart failure, but could have chosen any combination of items. The basket included a day of medical room and board, a day of intensive care unit (ICU) room and board, a single dose of ‐blocker, a single dose of angiotensin‐converting enzyme inhibitor, complete blood count, a B‐natriuretic peptide level, a chest radiograph, a chest computed tomography, and an echocardiogram. We then examined the range of hospitals' reported costs for this basket of goods using percentiles, medians, and interquartile ranges.
Reported to Standardized Cost Ratio
Next, we calculated standardized costs of hospitalizations for included hospitals and examined the relationship between hospitals' mean reported costs and mean standardized costs. This ratio could help diagnose the mechanism of high reported costs for a hospital, because high reported costs with low utilization would indicate high fixed costs, while high reported costs with high utilization would indicate greater use of tests and treatments. We assigned hospitals to strata based on reported costs greater than standardized costs by more than 25%, reported costs within 25% of standardized costs, and reported costs less than standardized costs by more than 25%. We examined the association between hospital characteristics and strata using a 2 test. All analyses were carried out using SAS version 9.3 (SAS Institute Inc., Cary, NC).
RESULTS
The 234 hospitals included in the analysis contributed a total of 165,647 hospitalizations, with the number of hospitalizations ranging from 33 to 2,772 hospitalizations per hospital (see Supporting Table 1 in the online version of this article). Most were located in urban areas (84%), and many were in the southern United States (42%). The median hospital reported cost per hospitalization was $6,535, with an interquartile range of $5,541 to $7,454. The median standardized cost per hospitalization was $6,602, with a range of $5,866 to $7,386. The interquartile ratio (Q75/Q25) of the reported costs of a hospitalization was 1.35. After costs were standardized, the interquartile ratio fell to 1.26, indicating that variation decreased. We found that the median hospital reported cost per day was $1,651, with an IQR of $1,400 to $1,933 (ratio 1.38), whereas the median standardized cost per day was $1,640, with an IQR of $1,511 to $1,812 (ratio 1.20).
There were more than 15,000 items (eg, treatments, tests, and supplies) that received a standardized charge code in our cohort. These were divided into 11 summary departments and 40 standard departments (see Supporting Table 2 in the online version of this article). We observed a high level of variation in the reported costs of individual items: the reported costs of a day of room and board in an ICU ranged from $773 at hospitals at the 10th percentile to $2,471 at the 90th percentile (Table 1.). The standardized cost of a day of ICU room and board was $1,577. We also observed variation in the reported costs of items across item categories. Although a day of medical room and board showed a 3‐fold difference between the 10th and 90th percentile, we observed a more than 10‐fold difference in the reported cost of an echocardiogram, from $31 at the 10th percentile to $356 at the 90th percentile. After examining the hospital‐level cost for a basket of goods, we found variation in the reported costs for these items across hospitals, with a 10th percentile cost of $1,552 and a 90th percentile cost of $3,967.
| Reported Costs | 10th Percentile | 25th Percentile | 75th Percentile | 90th Percentile | Median (Standardized Cost) |
|---|---|---|---|---|---|
| |||||
| Item | |||||
| Day of medical | 490.03 | 586.41 | 889.95 | 1121.20 | 722.59 |
| Day of ICU | 773.01 | 1275.84 | 1994.81 | 2471.75 | 1577.93 |
| Complete blood count | 6.87 | 9.34 | 18.34 | 23.46 | 13.07 |
| B‐natriuretic peptide | 12.13 | 19.22 | 44.19 | 60.56 | 28.23 |
| Metoprolol | 0.20 | 0.68 | 2.67 | 3.74 | 1.66 |
| Lisinopril | 0.28 | 1.02 | 2.79 | 4.06 | 1.72 |
| Spironolactone | 0.22 | 0.53 | 2.68 | 3.83 | 1.63 |
| Furosemide | 1.27 | 2.45 | 5.73 | 8.12 | 3.82 |
| Chest x‐ray | 43.88 | 51.54 | 89.96 | 117.16 | 67.45 |
| Echocardiogram | 31.53 | 98.63 | 244.63 | 356.50 | 159.07 |
| Chest CT (w & w/o contrast) | 65.17 | 83.99 | 157.23 | 239.27 | 110.76 |
| Noninvasive positive pressure ventilation | 126.23 | 127.25 | 370.44 | 514.67 | 177.24 |
| Electrocardiogram | 12.08 | 18.77 | 42.74 | 64.94 | 29.78 |
| Total basket | 1552.50 | 2157.85 | 3417.34 | 3967.78 | 2710.49 |
We found that 46 (20%) hospitals had reported costs of hospitalizations that were 25% greater than standardized costs (Figure 2). This group of hospitals had overestimated reported costs of utilization; 146 (62%) had reported costs within 25% of standardized costs, and 42 (17%) had reported costs that were 25% less than standardized costs (indicating that reported costs underestimated utilization). We examined the relationship between hospital characteristics and strata and found no significant association between the reported to standardized cost ratio and number of beds, teaching status, or urban location (Table 2). Hospitals in the Midwest and South were more likely to have a lower reported cost of hospitalizations, whereas hospitals in the West were more likely to have higher reported costs (P<0.001). When using the CV to compare reported costs to standardized costs, we found that per‐day standardized costs showed reduced variance (P=0.0238), but there was no significant difference in variance of the reported and standardized costs when examining the entire hospitalization (P=0.1423). At the level of the hospitalization, the Spearman correlation coefficient between reported and standardized cost was 0.89.
| Reported Greater Than Standardized by >25%, n (%) | Reported Within 25% (2‐tailed) of Standardized, n (%) | Reported Less Than Standardized by >25%, n (%) | P for 2 Test | |
|---|---|---|---|---|
| Total | 46 (19.7) | 146 (62.4) | 42 (17.0) | |
| No. of beds | 0.2313 | |||
| <200 | 19 (41.3) | 40 (27.4) | 12 (28.6) | |
| 200400 | 14 (30.4) | 67 (45.9) | 15 (35.7) | |
| >400 | 13 (28.3) | 39 (26.7) | 15 (35.7) | |
| Teaching | 0.8278 | |||
| Yes | 13 (28.3) | 45 (30.8) | 11 (26.2) | |
| No | 33 (71.7) | 101 (69.2) | 31 (73.8) | |
| Region | <0.0001 | |||
| Midwest | 7 (15.2) | 43 (29.5) | 19 (45.2) | |
| Northeast | 6 (13.0) | 18 (12.3) | 3 (7.1) | |
| South | 14 (30.4) | 64 (43.8) | 20 (47.6) | |
| West | 19 (41.3) | 21 (14.4) | 0 (0) | |
| Urban vs rural | 36 (78.3) | 128 (87.7) | 33 (78.6) | 0.1703 |
To better understand how hospitals can achieve high reported costs through different mechanisms, we more closely examined 3 hospitals with similar reported costs (Figure 3). These hospitals represented low, average, and high utilization according to their standardized costs, but had similar average per‐hospitalization reported costs: $11,643, $11,787, and $11,892, respectively. The corresponding standardized costs were $8,757, $11,169, and $15,978. The hospital with high utilization ($15,978 in standardized costs) was accounted for by increased use of supplies and other services. In contrast, the low‐ and average‐utilization hospitals had proportionally lower standardized costs across categories, with the greatest percentage of spending going toward room and board (includes nursing).
DISCUSSION
In a large national sample of hospitals, we observed variation in the reported costs for a uniform basket of goods, with a more than 2‐fold difference in cost between the 10th and 90th percentile hospitals. These findings suggest that reported costs have limited ability to reliably describe differences in utilization across hospitals. In contrast, when we applied standardized costs, the variance of per‐day costs decreased significantly, and the interquartile ratio of per‐day and hospitalization costs decreased as well, suggesting less variation in utilization across hospitals than would have been inferred from a comparison of reported costs. Applying a single, standard cost to all items can facilitate comparisons of utilization between hospitals (Figure 1). Standardized costs will give hospitals the potential to compare their utilization to their competitors and will facilitate research that examines the comparative effectiveness of high and low utilization in the management of medical and surgical conditions.
The reported to standardized cost ratio is another useful tool. It indicates whether the hospital's reported costs exaggerate its utilization relative to other hospitals. In this study, we found that a significant proportion of hospitals (20%) had reported costs that exceeded standardized costs by more than 25%. These hospitals have higher infrastructure, labor, or acquisition costs relative to their peers. To the extent that these hospitals might wish to lower the cost of care at their institution, they could focus on renegotiating purchasing or labor contracts, identifying areas where they may be overstaffed, or holding off on future infrastructure investments (Table 3).[14] In contrast, 17% of hospitals had reported costs that were 25% less than standardized costs. High‐cost hospitals in this group are therefore providing more treatments and testing to patients relative to their peers and could focus cost‐control efforts on reducing unnecessary utilization and duplicative testing.[20] Our examination of the hospital with high reported costs and very high utilization revealed a high percentage of supplies and other items, which is a category used primarily for nursing expenditures (Figure 3). Because the use of nursing services is directly related to days spent in the hospital, this hospital may wish to more closely examine specific strategies for reducing length of stay.
| High Reported Costs/High Standardized Costs | High Reported Costs/Low Standardized Costs | Low Reported Costs/High Standardized Costs | Low Reported Costs/Low Standardized Costs | |
|---|---|---|---|---|
| Utilization | High | Low | High | Low |
| Severity of illness | Likely to be higher | Likely to be lower | Likely to be higher | Likely to be lower |
| Practice style | Likely to be more intense | Likely to be less intense | Likely to be more intense | Likely to be less intense |
| Fixed costs | High or average | High | Low | Low |
| Infrastructure costs | Likely to be higher | Likely to be higher | Likely to be lower | Likely to be lower |
| Labor costs | Likely to be higher | Likely to be higher | Likely to be lower | Likely to be lower |
| Reported‐to‐standardized cost ratio | Close to 1 | >1 | <1 | Close to 1 |
| Causes of high costs | High utilization, high fixed costs, or both | High acquisition costs, high labor costs, or expensive infrastructure | High utilization | |
| Interventions to reduce costs | Work with clinicians to alter practice style, consider renegotiating cost of acquisitions, hold off on new infrastructure investments | Consider renegotiating cost of acquisitions, hold off on new infrastructure investments, consider reducing size of labor force | Work with clinicians to alter practice style | |
| Usefulness of reported‐ to‐standardized cost ratio | Less useful | More useful | More useful | Less useful |
We did not find a consistent association between the reported to standardized cost ratio and hospital characteristics. This is an important finding that contradicts prior work examining associations between hospital characteristics and costs for heart failure patients,[21] further indicating the complexity of the relationship between fixed costs and variable costs and the difficulty in adjusting reported costs to calculate utilization. For example, small hospitals may have higher acquisition costs and more supply chain difficulties, but they may also have less technology, lower overhead costs, and fewer specialists to order tests and procedures. Hospital characteristics, such as urban location and teaching status, are commonly used as adjustors in cost studies because hospitals in urban areas with teaching missions (which often provide care to low‐income populations) are assumed to have higher fixed costs,[3, 4, 5, 6] but the lack of a consistent relationship between these characteristics and the standardized cost ratio may indicate that using these factors as adjustors for cost may not be effective and could even obscure differences in utilization between hospitals. Notably, we did find an association between hospital region and the reported to standardized cost ratio, but we hesitate to draw conclusions from this finding because the Premier database is imbalanced in terms of regional representation, with fewer hospitals in the Midwest and West and the bulk of the hospitals in the South.
Although standardized costs have great potential, this method has limitations as well. Standardized costs can only be applied when detailed billing data with item‐level costs are available. This is because calculation of standardized costs requires taking the median of item costs and applying the median cost across the database, maintaining the integrity of the relative cost of items to one another. The relative cost of items is preserved (ie, magnetic resonance imaging still costs more than an aspirin), which maintains the general scheme of RVU‐based costs while removing the noise of varying RVU‐based costs across hospitals.[7] Application of an arbitrary item cost would result in the loss of this relative cost difference. Because item costs are not available in traditional administrative datasets, these datasets would not be amenable to this method. However, highly detailed billing data are now being shared by hundreds of hospitals in the Premier network and the University Health System Consortium. These data are widely available to investigators, meaning that the generalizability of this method will only improve over time. It was also a limitation of the study that we chose a limited basket of items common to patients with heart failure to describe the range of reported costs and to provide a standardized snapshot by which to compare hospitals. Because we only included a few items, we may have overestimated or underestimated the range of reported costs for such a basket.
Standardized costs are a novel method for comparing utilization across hospitals. Used properly, they will help identify high‐ and low‐intensity providers of hospital care.
- Health care costs–a primer. Kaiser Family Foundation Web site. Available at: http://www.kff.org/insurance/7670.cfm. Accessed July 20, 2012.
- . Explaining high health care spending in the United States: an international comparison of supply, utilization, prices, and quality. The Commonwealth Fund. 2012. Available at: http://www.commonwealthfund.org/Publications/Issue‐Briefs/2012/May/High‐Health‐Care‐Spending. aspx. Accessed on July 20, 2012.
- , , , , , . The relationship between hospital spending and mortality in patients with sepsis. Arch Intern Med. 2011;171(4):292–299.
- , , , . The elusive connection between health care spending and quality. Health Aff (Millwood). 2009;28(1):w119–w123.
- , , , . Hospital quality and intensity of spending: is there an association? Health Aff (Millwood). 2009;28(4):w566–w572.
- , , , , . Measuring efficiency: the association of hospital costs and quality of care. Health Aff (Millwood). 2009;28(3):897–906.
- , . Assigning resources to health care use for health services research: options and consequences. Med Care. 2009;47(7 suppl 1):S70–S75.
- , , , , . Health care costing: data, methods, current applications. Med Care. 2009;47(7 suppl 1):S1–S6.
- . Determination of VA health care costs. Med Care Res Rev. 2003;60(3 suppl):124S–141S.
- . An improved set of standards for finding cost for cost‐effectiveness analysis. Med Care. 2009;47(7 suppl 1):S82–S88.
- , , , et al. Comparison of approaches for estimating prevalence costs of care for cancer patients: what is the impact of data source? Med Care. 2009;47(7 suppl 1):S64–S69.
- . Principles involved in costing. Med J Aust. 1990;153Suppl:S10–S12.
- . Spending more through “cost control:” our obsessive quest to gut the hospital. Health Aff (Millwood). 1996;15(2):145–154.
- , , , et al. Distribution of variable vs. fixed costs of hospital care. JAMA. 1999;281(7):644–649.
- . Administrative and claims records as sources of health care cost data. Med Care. 2009;47(7 suppl 1):S51–S55.
- , , , , , . Perioperative beta‐blocker therapy and mortality after major noncardiac surgery. N Engl J Med. 2005;353(4):349–361.
- , , , et al. Public reporting and pay for performance in hospital quality improvement. N Engl J Med. 2007;356(5):486–496.
- , , , et al. Procedure intensity and the cost of care. Circ Cardiovasc Qual Outcomes. 2012;5(3):308–313.
- , , . A comparative study of tests for homogeneity of variances, with applications to the outer continental shelf bidding data. Technometrics. 1981;23:351–361.
- , , . Beyond the efficiency index: finding a better way to reduce overuse and increase efficiency in physician care. Health Aff (Millwood). 2008;27(4):w250–w259.
- , , . The association between hospital volume and processes, outcomes, and costs of care for congestive heart failure. Ann Intern Med. 2011;154(2):94–102.
© 2013 Society of Hospital Medicine
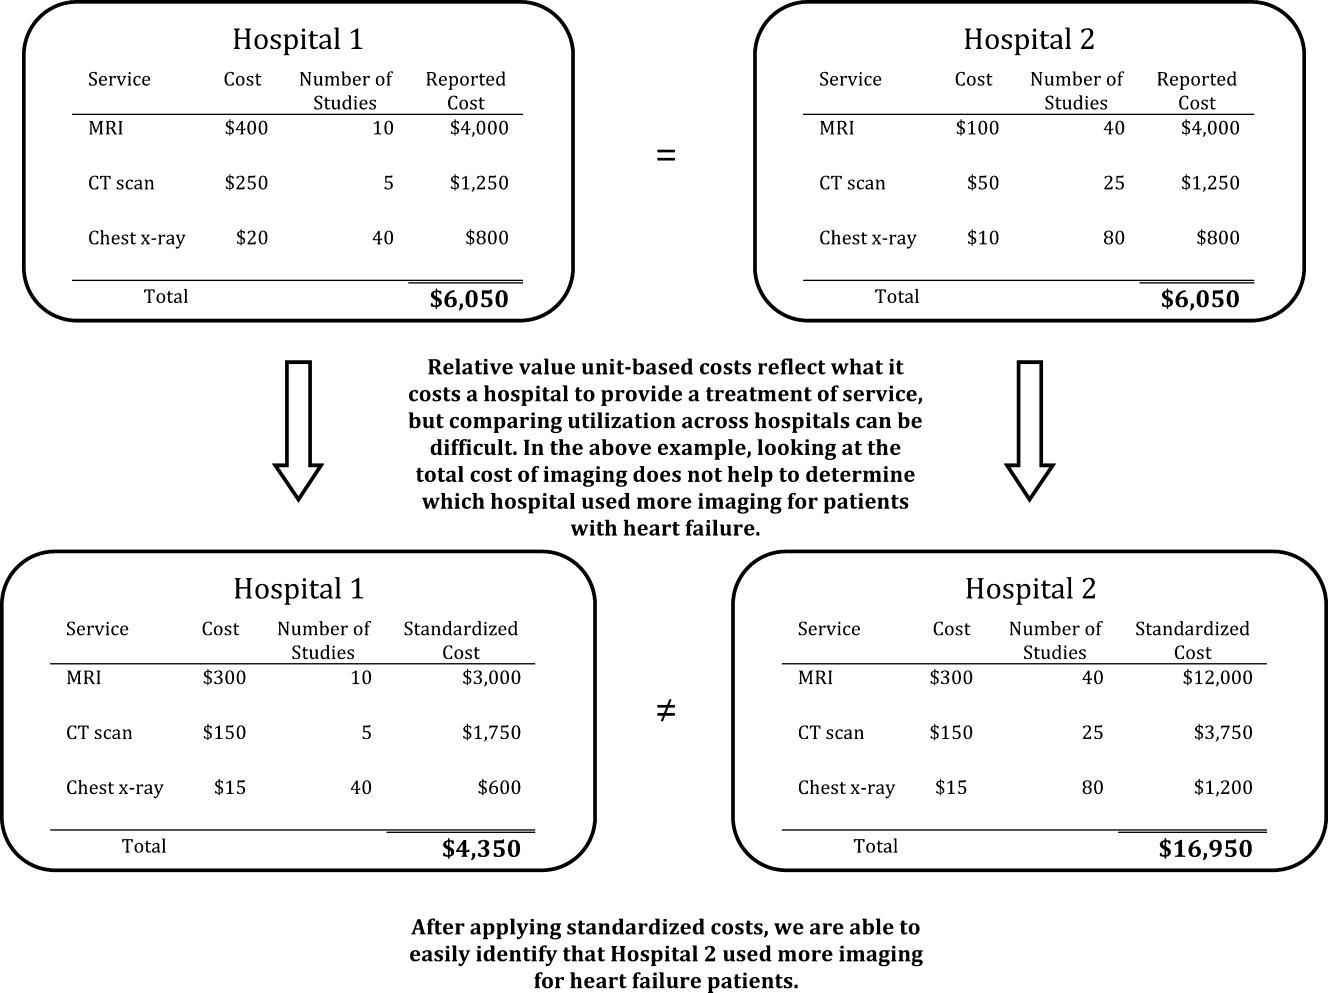
Review of VTE Prophylaxis Strategies
Venous thromboembolism (VTE), including deep venous thrombosis (DVT) and pulmonary embolism (PE), is estimated to affect 900,000 Americans each year and is a cause of significant morbidity and mortality with associated high healthcare costs.[1] Accordingly, the comparative effectiveness and safety of interventions for the prevention and treatment of VTE are among the national priorities for comparative effectiveness research.[2] Whereas we have evidence‐based guidelines for the prophylaxis of VTE in the general population, there are no guidelines informing the care of select patient populations. Select populations are those patients in whom there is decisional uncertainty about the optimal choice, timing, and dose of VTE prophylaxis. Not only do these patients have an increased risk of DVT and PE, but most are also at high risk of bleeding, the most important complication of VTE prophylaxis.[3, 4, 5, 6]
The objectives of this systematic review were to define the comparative effectiveness and safety of pharmacologic and mechanical strategies for VTE prevention in some of these select medical populations including obese patients, patients on concomitant antiplatelet therapy, patients with renal insufficiency, patients who are underweight, and patients with coagulopathy due to liver disease.
METHODS
The methods for this comparative effectiveness review (CER) follow the guidelines suggested in the Agency for Healthcare Research and Quality (AHRQ) Methods Guide for Effectiveness and Comparative Effectiveness Reviews.[7] The protocol was publically posted.[8]
Search Strategy
We searched MEDLINE, EMBASE, and SCOPUS through August 2011, CINAHL, International Pharmaceutical Abstracts,
Study Selection
We reviewed titles followed by abstracts to identify randomized controlled trials (RCTs) or observational studies with comparison groups reporting on the effectiveness or safety of VTE prevention in our populations. Two investigators independently reviewed abstracts, and we excluded the abstracts if both investigators agreed that the article met 1 or more of the exclusion criteria. We included only English‐language articles that evaluated the effectiveness of pharmacological or mechanical interventions that have been approved for clinical use in the United States. To be eligible, the studies must have addressed relevant key questions in the population of our interest. We resolved disagreements by consensus. We used DistillerSR (Evidence Partners Inc., Ottawa, Ontario, Canada), a Web‐based database management program to manage the review process. Two investigators assessed the risk of bias in each study independently, using the Downs and Black instrument for observational studies and trials.[10]
Data Synthesis
For each select population, we created detailed evidence tables containing the information abstracted from the eligible studies. After synthesizing the evidence, we graded the quantity, quality, and consistency of the best available evidence for each select population by adapting an evidence‐grading scheme recommended in the Methods Guide for Conducting Comparative Effectiveness Reviews.[7]
RESULTS
We identified 30,902 unique citations and included 9 studies (Figure 1). There were 5 RCTs with relevant subgroups and 4 observational studies (Table 1). Two studies reported on the risk of bleeding in patients given pharmacologic prophylaxis while they are concomitantly taking nonsteroidal anti‐inflammatory drugs (NSAIDS) or antiplatelet agents/aspirin, 1 RCT and 1 prospective observational study reported on obese patients, and 5 studies described outcomes of patients with renal insufficiency (see Supporting Information, Table 1, in the online version of this article). No study tested prophylaxis in underweight patients or those with liver disease.
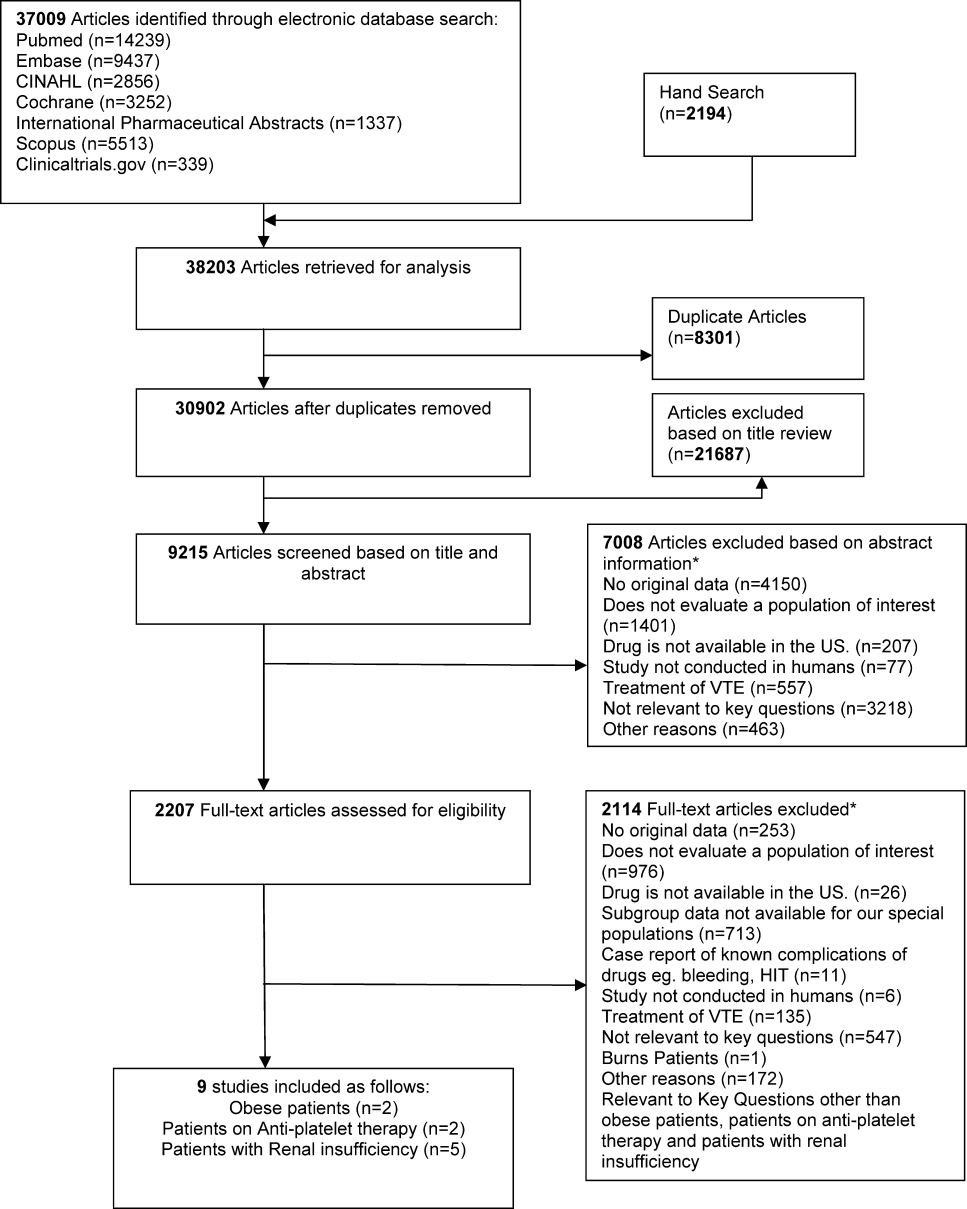
| Study | Arm, n | Total VTE (DVT and PE) | Bleeding | Other Outcomes | |
|---|---|---|---|---|---|
| |||||
| Obese patients | |||||
| Kucher et al., 2005[11] | Arm 1 (dalteparin), 558 | 2.8% (95% CI: 1.34.3) | 0% | Mortality at 21 days: 4.6% | |
| Arm 2 (placebo), 560 | 4.3% (95% CI: 2.56.2) | 0.7% | Mortality at 21 days: 2.7% | ||
| Freeman et al., [12] | Arm 1 (fixed‐dose enoxaparin), 11 | NR | NR | Peak anti‐factor Xa level 19 % | |
| Arm 2 (lower‐dose enoxaparin), 9 | NR | NR | Peak anti‐factor Xa level 32 % | ||
| Arm 3 (higher‐dose enoxaparin), 11 | NR | NR | Peak anti‐factor Xa level 86 % | ||
| Patients on antiplatelet agents | |||||
| Eriksson et al., 2012[14] | Arm 1 (rivaroxaban), 563 | NR | 20 (3.6%), rate ratio for use vs nonuse: 1.32 (95% CI: 0.85‐2.05) | NR | |
| Arm 2 (enoxaparin/placebo), 526 | NR | 17 (3.2%), rate ratio for use vs nonuse: 1.40 (95% CI: 0.87‐2.25) | NR | ||
| Friedman et al., 2012[15] | Arm 2 (150 mg dabigatran, no ASA), 1149 | NR | 11 (1.0%)a | NR | |
| Arm 5 (150 mg dabigatran+ASA), 128 | NR | 2 (1.6%)a | NR | ||
| Arm 3 (enoxaparin, no ASA), 1167 | NR | 14 (1.2%)a | NR | ||
| Arm 6 (enoxaparin+ASA), 132 | NR | 4 (3.0%) | NR | ||
| 150 mg dabigatran compared with enoxaparinNo concomitant ASA therapy | NR | RR: 0.82 (95% CI: 0.37‐1.84) | NR | ||
| 150 mg dabigatran compared with enoxaparinWith concomitant ASA therapy | NR | RR: 0.55 (95% CI: 0.11‐2.78) | NR | ||
| Patients with renal insufficiency | |||||
| Bauersachs et al., 2011[16] | Arm 2 (GFR <30), 92 | Total DVT: 11.11%; Total PE: 0% | Major bleeding: 4/92 (4.35%), minor bleeding: 9/92 (9.78%) | Mortality: 5.81% | |
| Mah et al., 2007[17] | Arm 2 (tinzaparin), 27 | NR | Major bleeding: 2/27 (7.4%), minor bleeding: 3/27 (11.1%) | Factor Xa level: AF: CmaxD8/Cmax D1=1.05 | |
| Arm 3 (enoxaparin), 28 | NR | Major bleeding: 1/28 (3.6%), minor bleeding: 3/28 (10.7%) | Factor Xa level: AF: CmaxD8/Cmax D1=1.22 | ||
| Dahl et al., 2012[18] | Arm 1 (enoxaparin), 332 | Major VTE: 8 (9.0%) | Major bleeding: 6 (4.7%) | Infections and infestations: 25 (7.5%), Wound infection: 4 (1.2%) | |
| Arm 2 (dabigatran), 300 | Major VTE: 3 (4.3%) | Major bleeding: 0 (0%) | Infections and infestations: 21 (7.0%), Wound Infection: 3 (1.0%) | ||
| Shorr et al., 2012[19] | Arm 1 (enoxaparin, CrCL 60 mL/min), 353 | Total VTE: 17/275 (6.2%) | Major bleeding: 0/351 (0%) | NR | |
| Arm 2 (desirudin, CrCL 60 mL/min), 353 | Total VTE: 13/284 (4.3%) | Major bleeding: 2/349 (0.27%) | NR | ||
| Arm 3 (enoxaparin, CrCL 4559 mL/min), 369 | Total VTE: 18/282 (6.2%) | Major bleeding: 1/365 (0.27%) | NR | ||
| Arm 4 (desirudin, CrCL 4559 mL/min), 395 | Total VTE: 17/303 (5.6%) | Major bleeding: 1/393 (0.25%) | NR | ||
| Arm 5 (enoxaparin, CrCL <45 mL/min), 298 | Total VTE: 24/216 (11.1%) | Major bleeding: 1/294 (0.34%) | NR | ||
| Arm 6 (desirudin, CrCL <45 mL/min), 279 | Total VTE: 7/205 (3.4%) | Major bleeding: 5/275 (1.82%) | NR | ||
| Elsaid et al., 2012[20] | Arm 1 (enoxaparin, CrCL 60 mL/min), 17 | NR | Major bleeding: 2 (11.8%) | NR | |
| Arm 2 (enoxaparin, CrCL 3059 mL/min), 86 | NR | Major bleeding: 9 (10.5%) | NR | ||
| Arm 3 (enoxaparin, CrCL 30 mL/min), 53 | NR | Major bleeding: 10 (18.9%) | NR | ||
| Arm 4 (UFH, CrCL 60 mL/min), 19 | NR | Major bleeding: 2 (10.5%) | NR | ||
| Arm 5 (UFH, CrCL 3059 mL/min), 99 | NR | Major bleeding: 3 (3%) | NR | ||
| Arm 6 (UFH, CrCL 30 mL/min), 49 | NR | Major bleeding: 2 (4.1%) | NR | ||
Obese Patients
We found 1 subgroup analysis of an RCT (total 3706 patients, 2563 nonobese and 1118 obese patients) that reported on the comparative effectiveness and safety of fixed low‐dose dalteparin 5000 IU/day compared to placebo among 1118 hospitalized medically ill patients with body mass indices (BMI) greater than 30 kg/m2.11 Neither group received additional concurrent prophylactic therapies. The 3 most prevalent medical diagnoses prompting hospitalization were congestive heart failure, respiratory failure, and infectious diseases. Compression ultrasound was performed in all patients by day 21 of hospitalization. The primary end point was the composite of VTE, fatal PE, and sudden death, and secondary end points included DVT, bleeding, and thrombocytopenia by day 21 (Table 1). In obese patients, the primary end point occurred in 2.8% (95% confidence interval [CI]: 1.34.3) of the dalteparin group and in 4.3% (95% CI: 2.56.2) of the placebo group (relative risk [RR]: 0.64; 95% CI: 0.32‐1.28). In nonobese patients, the primary end point occurred in 2.8% (95% CI: 1.8‐3.8) and 5.2% (95% CI: 3.9‐6.6) of the dalteparin and placebo groups, respectively (RR: 0.53; 95% CI: 0.34‐0.82). When weight was modeled as a continuous variable, no statistically significant interaction between weight and dalteparin efficacy was observed (P=0.97). The authors calculated the RR in predefined BMI subgroups and found that dalteparin was effective in reducing VTE in patients with BMIs up to 40, with RRs of <1.0 for all (approximate range, 0.20.8). However, a fixed dose of dalteparin 5000 IU/day was not better than placebo for individuals with BMI >40 kg/m2. There was no significant difference in mortality or major hemorrhage by day 21 between treatment and placebo groups.
Freeman and colleagues prospectively assigned 31 medically ill patients with extreme obesity (BMI >40 kg/m2) to 1 of 3 dosing regimens of enoxaparin: a fixed dose of 40 mg daily enoxaparin (control group, n=11), enoxaparin at 0.4 mg/kg (n=9), or enoxaparin at 0.5 mg/kg (n=11).[12] The average BMI of the entire cohort was 62.1 kg/m2 (range, 40.582.4). All patients had anti‐factor Xa levels drawn on the day of enrollment and daily for 3 days (Table 2). The relationship between anti‐factor Xa levels and clinical efficacy of low‐molecular weight heparin (LMWH) in VTE prophylaxis is still unclear; however, an anti‐factor Xa level of 0.2 to 0.5 IU/mL, measured 4 hours after the fourth dose of LMWH, is the target level recommended for VTE prophylaxis.[13] Patients who received weight‐based enoxaparin at 0.5mg/kg achieved target anti‐factor Xa level 86% of the time compared to 32% of the time in those receiving 0.4 mg/kg and 19% of the time for those in the fixed‐dose group (P<0.001). No clinical outcomes were reported in this study.
| Intervention | Outcome | Risk of Bias | Evidence Statement and Magnitude of Effect |
|---|---|---|---|
| |||
| Patients on antiplatelet agents | |||
| Rivaroxaban vs enoxaparin | Major bleeding | Low | Insufficient to support no difference in rates of major bleeding with prophylactic rivaroxaban or enoxaparin in patients concomitantly treated with antiplatelet agents; 3.6% vs 3.25% |
| Dabigatran vs enoxaparin | Major bleeding | Low | Insufficient to support no difference in rates of major bleeding with prophylactic dabigatran or enoxaparin in patients concomitantly treated with aspirin; 1.6% vs 3.0% |
| Obese patients | |||
| Dalteparin vs placebo | VTE | Moderate | Insufficient evidence for effectiveness of dalteparin vs placebo in reducing total VTE in obese patients; 2.8% vs 4.3%, RR: 0.64, 95% CI: 0.32‐1.28 |
| Dalteparin vs placebo | Mortality | Moderate | Insufficient evidence for effectiveness of dalteparin vs placebo in reducing mortality in obese patients; 9.9% vs 8.6%, P=0.36 |
| Dalteparin vs placebo | Major bleeding | Moderate | Insufficient evidence for safety of dalteparin vs placebo in reducing major bleeding in obese patients; 0% vs 0.7%, P>0.99 |
| Enoxaparin 40 mg daily vs 0.4 mg/kg | Percentage of patients achieving target anti‐factor Xa level | Moderate | Insufficient evidence for effectiveness of enoxaparin 40 mg daily versus 0.4 mg/kg in achieving peak anti‐factor Xa level in obese patients; 19% vs 32%, P=NR |
| Enoxaparin 40 mg daily vs 0.5 mg/kg | Percentage of patients achieving target anti‐factor Xa level | Moderate | Insufficient evidence for effectiveness of enoxaparin 40 mg daily versus 0.5 mg/kg in achieving peak anti‐factor Xa level in obese patients; 19% vs 86%, P<0.001 |
| Enoxaparin 0.4 mg/kg vs 0.5 mg/kg | Percentage of patients achieving target anti‐factor Xa level | Moderate | Insufficient evidence for effectiveness of enoxaparin 0.4 mg/kg versus 0.5 mg/kg in achieving peak anti‐factor Xa level in obese patients; 32% vs 86%, P=NR |
| Patients with renal insufficiency | |||
| Tinzaparin vs enoxaparin | VTE | High | Insufficient evidence about superiority of either drug for preventing VTE in patients with renal insufficiency, 0/27 vs 0/28* |
| Tinzaparin vs enoxaparin | Bleeding | High | Insufficient evidence about safety of either drug in patients with renal insufficiency; 5/27 vs 4/28, P=0.67 |
| Dabigatran vs enoxaparin | VTE | Moderate | Insufficient evidence for effectiveness of dabigatran in reducing VTE in severe renal compromise patients vs enoxaparin; 4.3% vs 9%, OR: 0.48, 95% CI: 0.13‐1.73, P=0.271 |
| Dabigatran vs enoxaparin | Bleeding | Moderate | Insufficient evidence for safety of dabigatran vs enoxaparin in patients with renal impairment; 0 vs 4.7%, P=0.039 |
| Desirudin vs enoxaparin | VTE | Moderate | Insufficient evidence for effectiveness of desirudin vs enoxaparin in reducing VTE in patients with renal impairment; 4.9% vs 7.6%, P=0.019 |
| Desirudin vs enoxaparin | Bleeding | Moderate | Insufficient evidence for safety of desirudin vs enoxaparin in patients with renal impairment; 0.8% vs 0.2%, P=0.109 |
| Enoxaparin vs UFH | Bleeding | High | Insufficient evidence for increased risk of bleeding with enoxaparin vs unfractionated heparin in patients with all levels of renal impairment, 13.5% vs 4.2%, RR: 3.2, 95% CI: 1.47.3; and for the subgroup of patients with creatinine clearance <30 mL/min; 18.9% vs 4.1%, RR: 4.68, 95% CI: 1.120.6 |
| UFH in severe renal compromise vs all other renal status (undifferentiated) | VTE | Moderate | Insufficient evidence regarding differential benefit of unfractionated heparin by renal function; 2.6% of patients had a VTE event |
| UFH in severe renal compromise vs all other renal status (undifferentiated) | Bleeding | Moderate | Insufficient evidence for differential harm from unfractionated heparin by renal function; 13 events in 92 patients |
Patients on Antiplatelet Drugs
We did not find studies that directly looked at the comparative effectiveness of VTE prophylaxis in patients who were on antiplatelet drugs including aspirin. However, there were 2 studies that looked at the risk of bleeding in patients who received VTE pharmacologic prophylaxis while concurrently taking antiplatelet agents including aspirin. Both studies used pooled data from large phase III trials.
The study by Eriksson et al. used data from the RECORD (Regulation of Coagulation in Orthopedic Surgery to Prevent Deep Venous Thrombosis and Pulmonary Embolism) trial where over 12,000 patients undergoing elective total knee or hip replacement were randomized to receive VTE prophylaxis with oral rivaroxaban or subcutaneous enoxaparin.[14] Nine percent of participants in each arm (563 in rivaroxaban and 526 in enoxaparin/placebo) were concomitantly using antiplatelet agents or aspirin at least once during the at risk period, defined as starting at day 1 of surgery up to 2 days after the last intake of the study drug. The only end point evaluated was bleeding, and the authors found no statistically significant bleeding difference among the 2 arms (Table 1). Any bleeding event in the rivaroxaban with antiplatelets or aspirin arm was found in 20 (3.6%) patients, whereas in those on enoxaparin/placebo with antiplatelets or aspirin arm it was 17 (3.2%). The relative rate of bleeding among users versus nonusers of antiplatelet drugs or aspirin was 1.32 (95% CI: 0.85‐2.05) in the rivaroxaban group and 1.40 (95% CI: 0.87‐2.25) in the enoxaparin arm (Table 1).
Friedman et al. used pooled data from the RE‐MODEL, RENOVATE, and REMOBILIZE trials, where patients who were undergoing hip or knee arthroplasty were randomized to 220 mg of dabigatran once daily, 150 mg of dabigatran once daily (we focused on this lower dosage as this is the only available dose used in the US), 40 mg of enoxaparin once daily, or 30 mg of enoxaparin twice a day.[15] Of the 8135 patients, 4.7% were on concomitant aspirin. The baseline characteristics of those on aspirin were similar to the other enrollees. The primary outcome was major bleeding events requiring transfusion, symptomatic internal bleeding, or bleeding requiring surgery. Among patients receiving 150 mg of dabigatran, bleeding events with and without concomitant aspirin occurred in 1.6% and 1.0%, respectively (odds ratio [OR]: 1.64; 95% CI: 0.36‐7.49; P=0.523). The percentages of participants with bleeding who received enoxaparin, with and without aspirin, were 3.0% and 1.2%, respectively (OR: 2.57; 95% CI: 0.83‐7.94; P=0.101). The RR of bleeding on dabigatran compared to enoxaparin with and without aspirin therapy was 0.55 (95% CI: 0.11‐2.78) and 0.82 (95% CI: 0.37‐1.84), respectively (Table 1).
Patients With Renal Insufficiency
We found 5 studies that evaluated the comparative effectiveness and safety of pharmacologic prophylaxis for prevention of VTE in patients with acute kidney injury, moderate renal insufficiency, severe renal insufficiency not undergoing dialysis, or patients receiving dialysis. Four studies were RCTs,[16, 17, 18, 19] and 1 used a cohort design assessing separate cohorts before and after a quality improvement intervention.[20] Bauersachs and colleagues conducted an RCT comparing unfractionated heparin at 5000 IU, 3 times daily to certoparin, which is not approved in the United States and is not further discussed here.[16] The rate of DVT among patients treated with unfractionated heparin in patients with a glomerular filtration rate >30 mL/min was marginally lower than those with severe renal dysfunction (10.3 vs 11.1%) (Table 1).
Patients with severe renal dysfunction who received 5000 IU of unfractionated heparin 3 times a day were at increased risk of all bleeds (RR: 3.4; 95% CI: 2.05.9), major bleeds (RR: 7.3; 95% CI: 3.316), and minor bleeds (RR: 2.6; 95% CI: 1.4‐4.9) compared to patients treated with unfractionated heparin without severe renal dysfunction.[16]
A randomized trial by Mah and colleagues compared drug accumulation and anti‐Xa activity in elderly patients with renal dysfunction (defined as a glomerular filtration rate of 20 to 50 mL/min) who received either tinzaparin at 4500 IU once daily or enoxaparin at 4000 IU once daily.[17] Enoxaparin accumulated to a greater extent from day 1 to day 8 than did tinzaparin; the ratio of maximum concentration on day 8 compared to day 1 was 1.22 for enoxaparin and 1.05 for tinzaparin (P=0.016). No VTE events were reported in patients who received tinzaparin or enoxaparin. There was no statistical difference in the incidence of bleeding events between patients receiving tinzaparin (5, including 2 major events) and enoxaparin (4, including 3 major events, P=0.67) (Table 1).
The trial by Dahl and colleagues randomly assigned patients who were over 75 years of age and/or who had moderate renal dysfunction (defined as creatinine clearance between 30 and 49 mL/min) to receive enoxaparin 40 mg daily or dabigatran 150 mg daily.[18] There was no significant difference in the rate of major VTE events between patients receiving dabigatran (4.3%) and enoxaparin (9%) (OR: 0.48; 95% CI: 0.13‐1.73; P=0.271) (Table 1). The rate of major bleeding was significantly higher among patients randomly assigned to receive enoxaparin (4.7%) versus dabigatran (0%) (P=0.039).[18]
Shorr and colleagues published a post hoc subgroup analysis of a multicenter trial in which orthopedic patients were randomly assigned to receive desirudin 15 mg twice daily or enoxaparin 40 mg once daily.[19] Evaluable patients (1565 of the 2079 patients randomized in the trial) receiving desirudin experienced a significantly lower rate of major VTE compared with patients receiving enoxaparin (4.9% vs 7.6%, P=0.019). This relationship was particularly pronounced for evaluable patients whose creatinine clearance was between 30 and 44 mL/min. In evaluable patients with this degree of renal dysfunction, 11% of patients taking enoxaparin compared to 3.4% of those taking desirudin had a major VTE (OR: 3.52; 95% CI: 1.48‐8.4; P=0.004). There was no significant difference in the rates of major bleeding among a subset of patients assessed for safety outcomes (2078 of the 2079 patients randomized in the trial) who received desirudin (0.8%) or enoxaparin (0.2%) (Table 1).
Elsaid and Collins assessed VTE and bleeding events associated with the use of unfractionated heparin 5000U either 2 or 3 times daily and enoxaparin 30 mg once or twice daily across patients stratified by renal function (creatinine clearance <30, 3059, and 60 mL/min). The investigators made assessments before and after a quality improvement intervention that was designed to eliminate the use of enoxaparin in patients whose creatinine clearance was <30 mL/min. No VTE events were reported. Patients receiving enoxaparin were significantly more likely to experience a major bleeding episode compared with patients receiving unfractionated heparin (overall rates for all levels of renal function: 13.5% vs 4. 2%; RR: 3.2; 95% CI: 1.47.3) (Table 2). This association was largely driven by the subgroup of patients with a creatinine clearance <30 mL/min. For this subgroup with severe renal insufficiency, patients receiving enoxaparin were significantly more likely to have a bleed compared with patients receiving unfractionated heparin (18.9% vs 4.1%; RR: 4.68; 95% CI: 1.120.6) (Tables 1 and 2). There was no difference in the bleeding rates for patients whose creatinine clearances were >60 mL/min.[20]
Strength of Evidence
Obese Patients
Overall, we found that the strength of evidence was insufficient regarding the composite end point of DVT, PE, and sudden death, and the outcomes of mortality and bleeding (Table 2). This was based on a paucity of available data, and a moderate risk of bias in the reviewed studies. Additionally, 92% of the enrolled patients in the studies were white, limiting the generalizability of the results to other ethnic groups.
Patients on Antiplatelets
The strength of evidence was insufficient in the studies reviewed here to conclude that there is no difference in rates of bleeding in patients who are concomitantly taking antiplatelet drugs while getting VTE prophylaxis with rivaroxaban, dabigatran, or enoxaparin. We based this rating because of the imprecision of results and unknown consistencies across multiple studies.
Patients With Renal Insufficiency
One RCT had a high risk of bias for our key question because data from only 1 study arm were useful for our review.[16] The other RCTs were judged to have a moderate risk of bias. The analyses led by Dahl and Shorr[18, 19] were based on post hoc (ie, not prespecified) analysis of data from RCTs. Additionally, outcomes in the Shorr et al. trial were reported for evaluable subpopulations of the cohort that was initially randomized in the clinical trial.
We rated the strength of evidence as insufficient to know the comparative effectiveness and safety of pharmacologic prophylaxis for prevention of VTE during hospitalization of patients with acute kidney injury, moderate renal insufficiency, severe renal insufficiency not undergoing dialysis, and patients receiving dialysis. We based this rating on the risk of bias associated with published studies and a lack of consistent evidence regarding associations that were reported. Similarly, we rated the strength of evidence as insufficient that 5000 U of unfractionated heparin 3 times daily increases the risk of major and minor bleeding events in patients with severely compromised renal function compared to this dose in patients without severely compromised renal function. We based this rating on a high risk of bias of included studies and inconsistent evidence. Likewise, we rated the strength of evidence as insufficient that enoxaparin significantly increases the risk of major bleeding compared with unfractionated heparin in patients with severe renal insufficiency. We based this rating on a high risk of bias and inconsistent published evidence.
We similarly found insufficient evidence to guide treatment decisions for patients with renal insufficiency. Our findings are consistent with other recent reviews. The American College of Chest Physicians (ACCP) practice guidelines[21] make dosing recommendations for the therapeutic use of enoxaparin. However, their assessment is that the data are insufficient to make direct recommendations about prophylaxis. Their assessment of the indirect evidence regarding bioaccumulation and increased anti‐factor Xa levels are consistent with ours. The ACCP guidelines also suggest that decreased clearance of enoxaparin has been associated with increased risk of bleeding events for patients with severe renal insufficiency. However, the cited study[20] compares patients with and without severe renal dysfunction who received the same therapy. Therefore, it is not possible to determine the additional risk conveyed by enoxaparin therapy, that is, above the baseline increased risk of bleeding among patients with renal insufficiency, particularly those receiving an alternate pharmacologic VTE prevention strategy, such as unfractionated heparin.
DISCUSSION
We found that the evidence was very limited about prevention of VTE in these select and yet prevalent patient populations. Despite the fact that there is an increasing number of obese patients and patients who are on antiplatelet therapies, most clinical practice guidelines do not address the care of these populations, which may be entirely appropriate given the state of the evidence.
The ACCP practice guidelines[21] suggest using a higher dose of enoxaparin for the prevention of VTE in obese patients. The subgroup analysis by Kucher et al.[11] showed effect attenuation of dalteparin when given at a fixed dose of 5000 IU/mL to patients with a BMI of >40 kg/m2. The Freeman study[12] showed that extremely obese patients (average BMI >62.1 kg/m2) who are given a fixed dose of enoxaparin achieved target anti‐factor Xa levels significantly less often than those who received a higher dose of enoxaparin. The 2 separate findings, although not conclusive, lend some credence to the current ACCP guidelines.[21]
The studies we reviewed on VTE prophylaxis in patients who are concomitantly on antiplatelets including aspirin reported no major increased risk of bleeding; however, in the Friedman et al. study,[15] 3.0% of patients who were put on enoxaparin while still on aspirin had a bleeding event compared to 1.2% of those on enoxaparin alone. This difference is not statistically significant but is a trend possibly worth noting, especially when one looks at the lower RR of bleeding at 0.55 compared to 0.82 when dabigatran is compared with enoxaparin with and without concomitant aspirin therapy, respectively (Table 1). The highest dose of aspirin used in either of the studies was 160 mg/day, and neither study addressed other potent antiplatelets such as clopidogrel or ticlopidine separately, which limits the generalizability of the finding to all antiplatelets. Current ACCP guidelines do not recommend aspirin as a sole option for the prevention of VTE in orthopedic surgery patients.[22] Concerns remain among clinicians that antiplatelets, including aspirin, on their own are unlikely to be fully effective to thwart venous thrombotic processes for most patients, and yet the risk of bleeding is not fully known when these agents are combined with other anticoagulants for VTE prophylaxis.
Our review has several limitations, including the possibility that we may have missed some observational studies, as the identification of relevant observational studies in electronic searches is more challenging than that of RCTs. The few studies made it impossible to quantitatively pool results. These results, however, have important implications, namely that additional research on the comparative effectiveness and safety of pharmacologic and mechanical strategies to prevent VTE is needed for the optimal care of these patient subgroups. This might be achieved with trials dedicated to enrolling these patients or prespecified subgroup analyses within larger trials. Observational data may be appropriate as long as attention is paid to confounding.
APPENDIX
MEDLINE Search Strategy
((pulmonary embolism[mh] OR PE[tiab] OR Pulmonary embolism[tiab] OR thromboembolism[mh] OR thromboembolism[tiab] OR thromboembolisms[tiab] OR Thrombosis[mh] OR thrombosis[tiab] OR DVT[tiab] OR VTE[tiab] OR clot[tiab]) AND (Anticoagulants[mh] OR Anticoagulants[tiab] OR Anticoagulant[tiab] OR thrombin inhibitors[tiab] OR Aspirin[mh] or aspirin[tiab] OR aspirins[tiab] or clopidogrel[nm] OR clopidogrel[tiab] OR Plavix[tiab] or ticlopidine[mh] or ticlopidine[tiab]OR ticlid[tiab] OR prasugrel[nm]Or prasugrel[tiab]OR effient[tiab]OR ticagrelor[NM] OR ticagrelor[tiab]OR Brilinta[tiab] OR cilostazol[NM] OR cilostazol[tiab]OR pletal[tiab] OR warfarin[mh]OR warfarin[tiab]OR coumadin[tiab] OR coumadine[tiab] OR Dipyridamole[mh]OR dipyridamole[tiab]OR persantine[tiab] OR dicoumarol[MH] OR dicoumarol[tiab] OR dicumarol[tiab] OR Dextran sulfate[mh] OR dextran sulfate[tiab] ORthrombin inhibitors[tiab] OR thrombin inhibitor[tiab] OR heparin[mh] OR Heparin[tiab] OR Heparins[tiab] OR LMWH[tiab] OR LDUH[tiab] OR Enoxaparin[mh] OR Enoxaparin[tiab] OR Lovenox[tiab] OR Dalteparin[tiab] OR Fragmin[tiab] OR Tinzaparin[tiab] OR innohep[tiab] OR Nadroparin[tiab] OR Fondaparinux[nm] OR Fondaparinux[tiab] OR Arixtra[tiab] OR Idraparinux[nm] OR Idraparinux[tiab] OR Rivaroxaban[nm] OR Rivaroxaban[tiab] OR novastan[tiab] OR Desirudin[nm] OR Desirudin[tiab] OR Iprivask[tiab]OR direct thrombin inhibitor[tiab] OR Argatroban[nm] OR Argatroban[tiab] OR Acova[tiab] OR Bivalirudin[nm] OR Bivalirudin[tiab] OR Angiomax[tiab] OR Lepirudin[nm] OR Lepirudin[tiab] OR Refludan[tiab] OR Dabigatran[nm] OR Dabigatran[tiab] OR Pradaxa[tiab] OR factor xa[mh] OR factor Xa[tiab] OR vena cava filters[mh] OR filters[tiab] OR filter[tiab] OR compression stockings[mh] OR intermittent pneumatic compression devices[mh] OR compression [tiab] OR Venous foot pump[tiab])) AND(prevent*[tiab] OR prophyla*[tiab] OR prevention and control[subheading]) NOT (animals[mh] NOT humans[mh]) NOT (editorial[pt] OR comment[pt]) NOT ((infant[mh] OR infant[tiab] OR child[mh] OR child[tiab] OR children[tiab] OR adolescent[mh] OR adolescent[tiab] OR teen‐age[tiab] OR pediatric[tiab] OR perinatal[tiab]) NOT (adult[tiab] OR adults[tiab] OR adult[mh])) NOT (mechanical valve[tiab] OR heart valve[tiab] OR atrial fibrillation[mh] OR atrial fibrillation[tiab] OR thrombophilia[mh] OR thrombophilia[tiab] OR pregnancy[mh])
- , , . Estimated annual number of incident and recurrent, non‐fatal and fatal venous thromboembolism (VTE) events in the US. Blood. 2005;106:910.
- Institute of Medicine. Institute of Medicine. Initial National Priorities for Comparative Effectiveness Research. Washington, DC: National Academies Press; 2009.
- Lovenox (enoxaparin sodium injection for subcutaneous and intravenous use: prescribing information). Bridgewater, NJ: SanofiAventis; 2011. Available at: http://products.sanofi.us/lovenox/lovenox.html. Accessed October 17, 2012.
- Innohep (tinzaparin sodium injection). Ballerup, Denmark: LEO Pharmaceutical Products; 2008. Available at: http://www.accessdata.fda.gov/drugsatfda_docs/label/2008/020484s011lbl.pdf. Accessed October 17, 2012.
- Leizorovicz A. Tinzaparin compared to unfractionated heparin for initial treatment of deep vein thrombosis in very elderly patients with renal insufficiency‐ the IRIS trial. [50th ASH Annual Meeting and Exposition abstract 434]. Blood. 2008;11:112.
- Fragmin (dalteparin sodium injection). New York, NY: Pfizer Inc.; 2007. Available at: http://www.pfizer.com/files/products/uspi_fragmin.pdf. Accessed October 17, 2012.
- Methods guide for effectiveness and comparative effectiveness reviews. Rockville, MD: Agency for Healthcare Research and Quality; August 2011. AHRQ publication No. 10 (11)‐EHC063‐EF. Available at: http://www.effectivehealthcare.ahrq.gov. Accessed October 17, 2012.
- Comparative effectiveness of pharmacologic and mechanical prophylaxis of venous thromboembolism among special populations. Available at: http://effectivehealthcare.ahrq.gov/ehc/products/341/928/VTE‐Special‐Populations_Protocol_20120112.pdf. Accessed April 17, 2012.
- , , , et al. Comparative effectiveness of pharmacologic and mechanical prophylaxis of venous thromboembolism among special populations. Evidence Report/Technology Assessment (AHRQ). Available at: http://effectivehealthcare.ahrq.gov/ehc/products/341/1501/venous‐thromboembolism‐special‐populations‐report‐130529.pdf. 2013.
- , . The feasibility of creating a checklist for the assessment of the methodological quality both of randomised and non‐randomised studies of health care interventions. J Epidemiol Community Health. 1998;52(6):377–384.
- , , , et al. Efficacy and safety of fixed low‐dose dalteparin in preventing venous thromboembolism among obese or elderly hospitalized patients: a subgroup analysis of the PREVENT trial. Arch Intern Med. 2005;165(3):341–345.
- , , , . Prospective comparison of three enoxaparin dosing regimens to achieve target anti‐factor Xa levels in hospitalized, medically ill patients with extreme obesity. Am J Hematol. 2012;87(7):740–743.
- , , . Effect of prophylactic dalteparin on anti‐factor xa levels in morbidly obese patients after bariatric surgery. Obes Surg. 2010;20(4):487–491.
- , , , , . Concomitant use of medication with antiplatelet effects in patients receiving either rivaroxaban or enoxaparin after total hip or knee arthroplasty. Thromb Res. 2012;130(2):147–151.
- , , , , , . Dabigatran etexilate and concomitant use of non‐steroidal anti‐inflammatory drugs or acetylsalicylic acid in patients undergoing total hip and total knee arthroplasty: No increased risk of bleeding. Thromb Haemost. 2012;108(1):183–190.
- , , , et al. CERTIFY: prophylaxis of venous thromboembolism in patients with severe renal insufficiency. Thromb Haemost. 2011;105(6):981–988.
- , , , et al. Tinzaparin and enoxaparin given at prophylactic dose for eight days in medical elderly patients with impaired renal function: a comparative pharmacokinetic study. Thromb Haemost. 2007;97(4):581–586.
- , , , , , . Thromboprophylaxis in patients older than 75 years or with moderate renal impairment undergoing knee or hip replacement surgery [published correction appears in Int Orthop. 2012;36(5):1113]. Int Orthop. 2012;36(4):741–748.
- , , , . Impact of stage 3B chronic kidney disease on thrombosis and bleeding outcomes after orthopedic surgery in patients treated with desirudin or enoxaparin: insights from a randomized trial. J Thromb Haemost. 2012;10(8):1515–1520.
- , . Initiative to improve thromboprophylactic enoxaparin exposure in hospitalized patients with renal impairment. Am J Health Syst Pharm. 2012;69(5):390–396.
- , , , , ; American College of Chest Physicians Antithrombotic Therapy and Prevention of Thrombosis Panel. Executive summary: antithrombotic therapy and prevention of thrombosis, 9th ed: American College of Chest Physicians evidence‐based clinical practice guidelines. Chest. 2012;141(2 suppl):7S–47S.
- , . Aspirin for the prophylaxis of venous thromboembolic events in orthopedic surgery patients: a comparison of the AAOS and ACCP guidelines with review of the evidence. Ann Pharmacother. 2013;47(1):63–74.
Venous thromboembolism (VTE), including deep venous thrombosis (DVT) and pulmonary embolism (PE), is estimated to affect 900,000 Americans each year and is a cause of significant morbidity and mortality with associated high healthcare costs.[1] Accordingly, the comparative effectiveness and safety of interventions for the prevention and treatment of VTE are among the national priorities for comparative effectiveness research.[2] Whereas we have evidence‐based guidelines for the prophylaxis of VTE in the general population, there are no guidelines informing the care of select patient populations. Select populations are those patients in whom there is decisional uncertainty about the optimal choice, timing, and dose of VTE prophylaxis. Not only do these patients have an increased risk of DVT and PE, but most are also at high risk of bleeding, the most important complication of VTE prophylaxis.[3, 4, 5, 6]
The objectives of this systematic review were to define the comparative effectiveness and safety of pharmacologic and mechanical strategies for VTE prevention in some of these select medical populations including obese patients, patients on concomitant antiplatelet therapy, patients with renal insufficiency, patients who are underweight, and patients with coagulopathy due to liver disease.
METHODS
The methods for this comparative effectiveness review (CER) follow the guidelines suggested in the Agency for Healthcare Research and Quality (AHRQ) Methods Guide for Effectiveness and Comparative Effectiveness Reviews.[7] The protocol was publically posted.[8]
Search Strategy
We searched MEDLINE, EMBASE, and SCOPUS through August 2011, CINAHL, International Pharmaceutical Abstracts,
Study Selection
We reviewed titles followed by abstracts to identify randomized controlled trials (RCTs) or observational studies with comparison groups reporting on the effectiveness or safety of VTE prevention in our populations. Two investigators independently reviewed abstracts, and we excluded the abstracts if both investigators agreed that the article met 1 or more of the exclusion criteria. We included only English‐language articles that evaluated the effectiveness of pharmacological or mechanical interventions that have been approved for clinical use in the United States. To be eligible, the studies must have addressed relevant key questions in the population of our interest. We resolved disagreements by consensus. We used DistillerSR (Evidence Partners Inc., Ottawa, Ontario, Canada), a Web‐based database management program to manage the review process. Two investigators assessed the risk of bias in each study independently, using the Downs and Black instrument for observational studies and trials.[10]
Data Synthesis
For each select population, we created detailed evidence tables containing the information abstracted from the eligible studies. After synthesizing the evidence, we graded the quantity, quality, and consistency of the best available evidence for each select population by adapting an evidence‐grading scheme recommended in the Methods Guide for Conducting Comparative Effectiveness Reviews.[7]
RESULTS
We identified 30,902 unique citations and included 9 studies (Figure 1). There were 5 RCTs with relevant subgroups and 4 observational studies (Table 1). Two studies reported on the risk of bleeding in patients given pharmacologic prophylaxis while they are concomitantly taking nonsteroidal anti‐inflammatory drugs (NSAIDS) or antiplatelet agents/aspirin, 1 RCT and 1 prospective observational study reported on obese patients, and 5 studies described outcomes of patients with renal insufficiency (see Supporting Information, Table 1, in the online version of this article). No study tested prophylaxis in underweight patients or those with liver disease.
| Study | Arm, n | Total VTE (DVT and PE) | Bleeding | Other Outcomes | |
|---|---|---|---|---|---|
| |||||
| Obese patients | |||||
| Kucher et al., 2005[11] | Arm 1 (dalteparin), 558 | 2.8% (95% CI: 1.34.3) | 0% | Mortality at 21 days: 4.6% | |
| Arm 2 (placebo), 560 | 4.3% (95% CI: 2.56.2) | 0.7% | Mortality at 21 days: 2.7% | ||
| Freeman et al., [12] | Arm 1 (fixed‐dose enoxaparin), 11 | NR | NR | Peak anti‐factor Xa level 19 % | |
| Arm 2 (lower‐dose enoxaparin), 9 | NR | NR | Peak anti‐factor Xa level 32 % | ||
| Arm 3 (higher‐dose enoxaparin), 11 | NR | NR | Peak anti‐factor Xa level 86 % | ||
| Patients on antiplatelet agents | |||||
| Eriksson et al., 2012[14] | Arm 1 (rivaroxaban), 563 | NR | 20 (3.6%), rate ratio for use vs nonuse: 1.32 (95% CI: 0.85‐2.05) | NR | |
| Arm 2 (enoxaparin/placebo), 526 | NR | 17 (3.2%), rate ratio for use vs nonuse: 1.40 (95% CI: 0.87‐2.25) | NR | ||
| Friedman et al., 2012[15] | Arm 2 (150 mg dabigatran, no ASA), 1149 | NR | 11 (1.0%)a | NR | |
| Arm 5 (150 mg dabigatran+ASA), 128 | NR | 2 (1.6%)a | NR | ||
| Arm 3 (enoxaparin, no ASA), 1167 | NR | 14 (1.2%)a | NR | ||
| Arm 6 (enoxaparin+ASA), 132 | NR | 4 (3.0%) | NR | ||
| 150 mg dabigatran compared with enoxaparinNo concomitant ASA therapy | NR | RR: 0.82 (95% CI: 0.37‐1.84) | NR | ||
| 150 mg dabigatran compared with enoxaparinWith concomitant ASA therapy | NR | RR: 0.55 (95% CI: 0.11‐2.78) | NR | ||
| Patients with renal insufficiency | |||||
| Bauersachs et al., 2011[16] | Arm 2 (GFR <30), 92 | Total DVT: 11.11%; Total PE: 0% | Major bleeding: 4/92 (4.35%), minor bleeding: 9/92 (9.78%) | Mortality: 5.81% | |
| Mah et al., 2007[17] | Arm 2 (tinzaparin), 27 | NR | Major bleeding: 2/27 (7.4%), minor bleeding: 3/27 (11.1%) | Factor Xa level: AF: CmaxD8/Cmax D1=1.05 | |
| Arm 3 (enoxaparin), 28 | NR | Major bleeding: 1/28 (3.6%), minor bleeding: 3/28 (10.7%) | Factor Xa level: AF: CmaxD8/Cmax D1=1.22 | ||
| Dahl et al., 2012[18] | Arm 1 (enoxaparin), 332 | Major VTE: 8 (9.0%) | Major bleeding: 6 (4.7%) | Infections and infestations: 25 (7.5%), Wound infection: 4 (1.2%) | |
| Arm 2 (dabigatran), 300 | Major VTE: 3 (4.3%) | Major bleeding: 0 (0%) | Infections and infestations: 21 (7.0%), Wound Infection: 3 (1.0%) | ||
| Shorr et al., 2012[19] | Arm 1 (enoxaparin, CrCL 60 mL/min), 353 | Total VTE: 17/275 (6.2%) | Major bleeding: 0/351 (0%) | NR | |
| Arm 2 (desirudin, CrCL 60 mL/min), 353 | Total VTE: 13/284 (4.3%) | Major bleeding: 2/349 (0.27%) | NR | ||
| Arm 3 (enoxaparin, CrCL 4559 mL/min), 369 | Total VTE: 18/282 (6.2%) | Major bleeding: 1/365 (0.27%) | NR | ||
| Arm 4 (desirudin, CrCL 4559 mL/min), 395 | Total VTE: 17/303 (5.6%) | Major bleeding: 1/393 (0.25%) | NR | ||
| Arm 5 (enoxaparin, CrCL <45 mL/min), 298 | Total VTE: 24/216 (11.1%) | Major bleeding: 1/294 (0.34%) | NR | ||
| Arm 6 (desirudin, CrCL <45 mL/min), 279 | Total VTE: 7/205 (3.4%) | Major bleeding: 5/275 (1.82%) | NR | ||
| Elsaid et al., 2012[20] | Arm 1 (enoxaparin, CrCL 60 mL/min), 17 | NR | Major bleeding: 2 (11.8%) | NR | |
| Arm 2 (enoxaparin, CrCL 3059 mL/min), 86 | NR | Major bleeding: 9 (10.5%) | NR | ||
| Arm 3 (enoxaparin, CrCL 30 mL/min), 53 | NR | Major bleeding: 10 (18.9%) | NR | ||
| Arm 4 (UFH, CrCL 60 mL/min), 19 | NR | Major bleeding: 2 (10.5%) | NR | ||
| Arm 5 (UFH, CrCL 3059 mL/min), 99 | NR | Major bleeding: 3 (3%) | NR | ||
| Arm 6 (UFH, CrCL 30 mL/min), 49 | NR | Major bleeding: 2 (4.1%) | NR | ||
Obese Patients
We found 1 subgroup analysis of an RCT (total 3706 patients, 2563 nonobese and 1118 obese patients) that reported on the comparative effectiveness and safety of fixed low‐dose dalteparin 5000 IU/day compared to placebo among 1118 hospitalized medically ill patients with body mass indices (BMI) greater than 30 kg/m2.11 Neither group received additional concurrent prophylactic therapies. The 3 most prevalent medical diagnoses prompting hospitalization were congestive heart failure, respiratory failure, and infectious diseases. Compression ultrasound was performed in all patients by day 21 of hospitalization. The primary end point was the composite of VTE, fatal PE, and sudden death, and secondary end points included DVT, bleeding, and thrombocytopenia by day 21 (Table 1). In obese patients, the primary end point occurred in 2.8% (95% confidence interval [CI]: 1.34.3) of the dalteparin group and in 4.3% (95% CI: 2.56.2) of the placebo group (relative risk [RR]: 0.64; 95% CI: 0.32‐1.28). In nonobese patients, the primary end point occurred in 2.8% (95% CI: 1.8‐3.8) and 5.2% (95% CI: 3.9‐6.6) of the dalteparin and placebo groups, respectively (RR: 0.53; 95% CI: 0.34‐0.82). When weight was modeled as a continuous variable, no statistically significant interaction between weight and dalteparin efficacy was observed (P=0.97). The authors calculated the RR in predefined BMI subgroups and found that dalteparin was effective in reducing VTE in patients with BMIs up to 40, with RRs of <1.0 for all (approximate range, 0.20.8). However, a fixed dose of dalteparin 5000 IU/day was not better than placebo for individuals with BMI >40 kg/m2. There was no significant difference in mortality or major hemorrhage by day 21 between treatment and placebo groups.
Freeman and colleagues prospectively assigned 31 medically ill patients with extreme obesity (BMI >40 kg/m2) to 1 of 3 dosing regimens of enoxaparin: a fixed dose of 40 mg daily enoxaparin (control group, n=11), enoxaparin at 0.4 mg/kg (n=9), or enoxaparin at 0.5 mg/kg (n=11).[12] The average BMI of the entire cohort was 62.1 kg/m2 (range, 40.582.4). All patients had anti‐factor Xa levels drawn on the day of enrollment and daily for 3 days (Table 2). The relationship between anti‐factor Xa levels and clinical efficacy of low‐molecular weight heparin (LMWH) in VTE prophylaxis is still unclear; however, an anti‐factor Xa level of 0.2 to 0.5 IU/mL, measured 4 hours after the fourth dose of LMWH, is the target level recommended for VTE prophylaxis.[13] Patients who received weight‐based enoxaparin at 0.5mg/kg achieved target anti‐factor Xa level 86% of the time compared to 32% of the time in those receiving 0.4 mg/kg and 19% of the time for those in the fixed‐dose group (P<0.001). No clinical outcomes were reported in this study.
| Intervention | Outcome | Risk of Bias | Evidence Statement and Magnitude of Effect |
|---|---|---|---|
| |||
| Patients on antiplatelet agents | |||
| Rivaroxaban vs enoxaparin | Major bleeding | Low | Insufficient to support no difference in rates of major bleeding with prophylactic rivaroxaban or enoxaparin in patients concomitantly treated with antiplatelet agents; 3.6% vs 3.25% |
| Dabigatran vs enoxaparin | Major bleeding | Low | Insufficient to support no difference in rates of major bleeding with prophylactic dabigatran or enoxaparin in patients concomitantly treated with aspirin; 1.6% vs 3.0% |
| Obese patients | |||
| Dalteparin vs placebo | VTE | Moderate | Insufficient evidence for effectiveness of dalteparin vs placebo in reducing total VTE in obese patients; 2.8% vs 4.3%, RR: 0.64, 95% CI: 0.32‐1.28 |
| Dalteparin vs placebo | Mortality | Moderate | Insufficient evidence for effectiveness of dalteparin vs placebo in reducing mortality in obese patients; 9.9% vs 8.6%, P=0.36 |
| Dalteparin vs placebo | Major bleeding | Moderate | Insufficient evidence for safety of dalteparin vs placebo in reducing major bleeding in obese patients; 0% vs 0.7%, P>0.99 |
| Enoxaparin 40 mg daily vs 0.4 mg/kg | Percentage of patients achieving target anti‐factor Xa level | Moderate | Insufficient evidence for effectiveness of enoxaparin 40 mg daily versus 0.4 mg/kg in achieving peak anti‐factor Xa level in obese patients; 19% vs 32%, P=NR |
| Enoxaparin 40 mg daily vs 0.5 mg/kg | Percentage of patients achieving target anti‐factor Xa level | Moderate | Insufficient evidence for effectiveness of enoxaparin 40 mg daily versus 0.5 mg/kg in achieving peak anti‐factor Xa level in obese patients; 19% vs 86%, P<0.001 |
| Enoxaparin 0.4 mg/kg vs 0.5 mg/kg | Percentage of patients achieving target anti‐factor Xa level | Moderate | Insufficient evidence for effectiveness of enoxaparin 0.4 mg/kg versus 0.5 mg/kg in achieving peak anti‐factor Xa level in obese patients; 32% vs 86%, P=NR |
| Patients with renal insufficiency | |||
| Tinzaparin vs enoxaparin | VTE | High | Insufficient evidence about superiority of either drug for preventing VTE in patients with renal insufficiency, 0/27 vs 0/28* |
| Tinzaparin vs enoxaparin | Bleeding | High | Insufficient evidence about safety of either drug in patients with renal insufficiency; 5/27 vs 4/28, P=0.67 |
| Dabigatran vs enoxaparin | VTE | Moderate | Insufficient evidence for effectiveness of dabigatran in reducing VTE in severe renal compromise patients vs enoxaparin; 4.3% vs 9%, OR: 0.48, 95% CI: 0.13‐1.73, P=0.271 |
| Dabigatran vs enoxaparin | Bleeding | Moderate | Insufficient evidence for safety of dabigatran vs enoxaparin in patients with renal impairment; 0 vs 4.7%, P=0.039 |
| Desirudin vs enoxaparin | VTE | Moderate | Insufficient evidence for effectiveness of desirudin vs enoxaparin in reducing VTE in patients with renal impairment; 4.9% vs 7.6%, P=0.019 |
| Desirudin vs enoxaparin | Bleeding | Moderate | Insufficient evidence for safety of desirudin vs enoxaparin in patients with renal impairment; 0.8% vs 0.2%, P=0.109 |
| Enoxaparin vs UFH | Bleeding | High | Insufficient evidence for increased risk of bleeding with enoxaparin vs unfractionated heparin in patients with all levels of renal impairment, 13.5% vs 4.2%, RR: 3.2, 95% CI: 1.47.3; and for the subgroup of patients with creatinine clearance <30 mL/min; 18.9% vs 4.1%, RR: 4.68, 95% CI: 1.120.6 |
| UFH in severe renal compromise vs all other renal status (undifferentiated) | VTE | Moderate | Insufficient evidence regarding differential benefit of unfractionated heparin by renal function; 2.6% of patients had a VTE event |
| UFH in severe renal compromise vs all other renal status (undifferentiated) | Bleeding | Moderate | Insufficient evidence for differential harm from unfractionated heparin by renal function; 13 events in 92 patients |
Patients on Antiplatelet Drugs
We did not find studies that directly looked at the comparative effectiveness of VTE prophylaxis in patients who were on antiplatelet drugs including aspirin. However, there were 2 studies that looked at the risk of bleeding in patients who received VTE pharmacologic prophylaxis while concurrently taking antiplatelet agents including aspirin. Both studies used pooled data from large phase III trials.
The study by Eriksson et al. used data from the RECORD (Regulation of Coagulation in Orthopedic Surgery to Prevent Deep Venous Thrombosis and Pulmonary Embolism) trial where over 12,000 patients undergoing elective total knee or hip replacement were randomized to receive VTE prophylaxis with oral rivaroxaban or subcutaneous enoxaparin.[14] Nine percent of participants in each arm (563 in rivaroxaban and 526 in enoxaparin/placebo) were concomitantly using antiplatelet agents or aspirin at least once during the at risk period, defined as starting at day 1 of surgery up to 2 days after the last intake of the study drug. The only end point evaluated was bleeding, and the authors found no statistically significant bleeding difference among the 2 arms (Table 1). Any bleeding event in the rivaroxaban with antiplatelets or aspirin arm was found in 20 (3.6%) patients, whereas in those on enoxaparin/placebo with antiplatelets or aspirin arm it was 17 (3.2%). The relative rate of bleeding among users versus nonusers of antiplatelet drugs or aspirin was 1.32 (95% CI: 0.85‐2.05) in the rivaroxaban group and 1.40 (95% CI: 0.87‐2.25) in the enoxaparin arm (Table 1).
Friedman et al. used pooled data from the RE‐MODEL, RENOVATE, and REMOBILIZE trials, where patients who were undergoing hip or knee arthroplasty were randomized to 220 mg of dabigatran once daily, 150 mg of dabigatran once daily (we focused on this lower dosage as this is the only available dose used in the US), 40 mg of enoxaparin once daily, or 30 mg of enoxaparin twice a day.[15] Of the 8135 patients, 4.7% were on concomitant aspirin. The baseline characteristics of those on aspirin were similar to the other enrollees. The primary outcome was major bleeding events requiring transfusion, symptomatic internal bleeding, or bleeding requiring surgery. Among patients receiving 150 mg of dabigatran, bleeding events with and without concomitant aspirin occurred in 1.6% and 1.0%, respectively (odds ratio [OR]: 1.64; 95% CI: 0.36‐7.49; P=0.523). The percentages of participants with bleeding who received enoxaparin, with and without aspirin, were 3.0% and 1.2%, respectively (OR: 2.57; 95% CI: 0.83‐7.94; P=0.101). The RR of bleeding on dabigatran compared to enoxaparin with and without aspirin therapy was 0.55 (95% CI: 0.11‐2.78) and 0.82 (95% CI: 0.37‐1.84), respectively (Table 1).
Patients With Renal Insufficiency
We found 5 studies that evaluated the comparative effectiveness and safety of pharmacologic prophylaxis for prevention of VTE in patients with acute kidney injury, moderate renal insufficiency, severe renal insufficiency not undergoing dialysis, or patients receiving dialysis. Four studies were RCTs,[16, 17, 18, 19] and 1 used a cohort design assessing separate cohorts before and after a quality improvement intervention.[20] Bauersachs and colleagues conducted an RCT comparing unfractionated heparin at 5000 IU, 3 times daily to certoparin, which is not approved in the United States and is not further discussed here.[16] The rate of DVT among patients treated with unfractionated heparin in patients with a glomerular filtration rate >30 mL/min was marginally lower than those with severe renal dysfunction (10.3 vs 11.1%) (Table 1).
Patients with severe renal dysfunction who received 5000 IU of unfractionated heparin 3 times a day were at increased risk of all bleeds (RR: 3.4; 95% CI: 2.05.9), major bleeds (RR: 7.3; 95% CI: 3.316), and minor bleeds (RR: 2.6; 95% CI: 1.4‐4.9) compared to patients treated with unfractionated heparin without severe renal dysfunction.[16]
A randomized trial by Mah and colleagues compared drug accumulation and anti‐Xa activity in elderly patients with renal dysfunction (defined as a glomerular filtration rate of 20 to 50 mL/min) who received either tinzaparin at 4500 IU once daily or enoxaparin at 4000 IU once daily.[17] Enoxaparin accumulated to a greater extent from day 1 to day 8 than did tinzaparin; the ratio of maximum concentration on day 8 compared to day 1 was 1.22 for enoxaparin and 1.05 for tinzaparin (P=0.016). No VTE events were reported in patients who received tinzaparin or enoxaparin. There was no statistical difference in the incidence of bleeding events between patients receiving tinzaparin (5, including 2 major events) and enoxaparin (4, including 3 major events, P=0.67) (Table 1).
The trial by Dahl and colleagues randomly assigned patients who were over 75 years of age and/or who had moderate renal dysfunction (defined as creatinine clearance between 30 and 49 mL/min) to receive enoxaparin 40 mg daily or dabigatran 150 mg daily.[18] There was no significant difference in the rate of major VTE events between patients receiving dabigatran (4.3%) and enoxaparin (9%) (OR: 0.48; 95% CI: 0.13‐1.73; P=0.271) (Table 1). The rate of major bleeding was significantly higher among patients randomly assigned to receive enoxaparin (4.7%) versus dabigatran (0%) (P=0.039).[18]
Shorr and colleagues published a post hoc subgroup analysis of a multicenter trial in which orthopedic patients were randomly assigned to receive desirudin 15 mg twice daily or enoxaparin 40 mg once daily.[19] Evaluable patients (1565 of the 2079 patients randomized in the trial) receiving desirudin experienced a significantly lower rate of major VTE compared with patients receiving enoxaparin (4.9% vs 7.6%, P=0.019). This relationship was particularly pronounced for evaluable patients whose creatinine clearance was between 30 and 44 mL/min. In evaluable patients with this degree of renal dysfunction, 11% of patients taking enoxaparin compared to 3.4% of those taking desirudin had a major VTE (OR: 3.52; 95% CI: 1.48‐8.4; P=0.004). There was no significant difference in the rates of major bleeding among a subset of patients assessed for safety outcomes (2078 of the 2079 patients randomized in the trial) who received desirudin (0.8%) or enoxaparin (0.2%) (Table 1).
Elsaid and Collins assessed VTE and bleeding events associated with the use of unfractionated heparin 5000U either 2 or 3 times daily and enoxaparin 30 mg once or twice daily across patients stratified by renal function (creatinine clearance <30, 3059, and 60 mL/min). The investigators made assessments before and after a quality improvement intervention that was designed to eliminate the use of enoxaparin in patients whose creatinine clearance was <30 mL/min. No VTE events were reported. Patients receiving enoxaparin were significantly more likely to experience a major bleeding episode compared with patients receiving unfractionated heparin (overall rates for all levels of renal function: 13.5% vs 4. 2%; RR: 3.2; 95% CI: 1.47.3) (Table 2). This association was largely driven by the subgroup of patients with a creatinine clearance <30 mL/min. For this subgroup with severe renal insufficiency, patients receiving enoxaparin were significantly more likely to have a bleed compared with patients receiving unfractionated heparin (18.9% vs 4.1%; RR: 4.68; 95% CI: 1.120.6) (Tables 1 and 2). There was no difference in the bleeding rates for patients whose creatinine clearances were >60 mL/min.[20]
Strength of Evidence
Obese Patients
Overall, we found that the strength of evidence was insufficient regarding the composite end point of DVT, PE, and sudden death, and the outcomes of mortality and bleeding (Table 2). This was based on a paucity of available data, and a moderate risk of bias in the reviewed studies. Additionally, 92% of the enrolled patients in the studies were white, limiting the generalizability of the results to other ethnic groups.
Patients on Antiplatelets
The strength of evidence was insufficient in the studies reviewed here to conclude that there is no difference in rates of bleeding in patients who are concomitantly taking antiplatelet drugs while getting VTE prophylaxis with rivaroxaban, dabigatran, or enoxaparin. We based this rating because of the imprecision of results and unknown consistencies across multiple studies.
Patients With Renal Insufficiency
One RCT had a high risk of bias for our key question because data from only 1 study arm were useful for our review.[16] The other RCTs were judged to have a moderate risk of bias. The analyses led by Dahl and Shorr[18, 19] were based on post hoc (ie, not prespecified) analysis of data from RCTs. Additionally, outcomes in the Shorr et al. trial were reported for evaluable subpopulations of the cohort that was initially randomized in the clinical trial.
We rated the strength of evidence as insufficient to know the comparative effectiveness and safety of pharmacologic prophylaxis for prevention of VTE during hospitalization of patients with acute kidney injury, moderate renal insufficiency, severe renal insufficiency not undergoing dialysis, and patients receiving dialysis. We based this rating on the risk of bias associated with published studies and a lack of consistent evidence regarding associations that were reported. Similarly, we rated the strength of evidence as insufficient that 5000 U of unfractionated heparin 3 times daily increases the risk of major and minor bleeding events in patients with severely compromised renal function compared to this dose in patients without severely compromised renal function. We based this rating on a high risk of bias of included studies and inconsistent evidence. Likewise, we rated the strength of evidence as insufficient that enoxaparin significantly increases the risk of major bleeding compared with unfractionated heparin in patients with severe renal insufficiency. We based this rating on a high risk of bias and inconsistent published evidence.
We similarly found insufficient evidence to guide treatment decisions for patients with renal insufficiency. Our findings are consistent with other recent reviews. The American College of Chest Physicians (ACCP) practice guidelines[21] make dosing recommendations for the therapeutic use of enoxaparin. However, their assessment is that the data are insufficient to make direct recommendations about prophylaxis. Their assessment of the indirect evidence regarding bioaccumulation and increased anti‐factor Xa levels are consistent with ours. The ACCP guidelines also suggest that decreased clearance of enoxaparin has been associated with increased risk of bleeding events for patients with severe renal insufficiency. However, the cited study[20] compares patients with and without severe renal dysfunction who received the same therapy. Therefore, it is not possible to determine the additional risk conveyed by enoxaparin therapy, that is, above the baseline increased risk of bleeding among patients with renal insufficiency, particularly those receiving an alternate pharmacologic VTE prevention strategy, such as unfractionated heparin.
DISCUSSION
We found that the evidence was very limited about prevention of VTE in these select and yet prevalent patient populations. Despite the fact that there is an increasing number of obese patients and patients who are on antiplatelet therapies, most clinical practice guidelines do not address the care of these populations, which may be entirely appropriate given the state of the evidence.
The ACCP practice guidelines[21] suggest using a higher dose of enoxaparin for the prevention of VTE in obese patients. The subgroup analysis by Kucher et al.[11] showed effect attenuation of dalteparin when given at a fixed dose of 5000 IU/mL to patients with a BMI of >40 kg/m2. The Freeman study[12] showed that extremely obese patients (average BMI >62.1 kg/m2) who are given a fixed dose of enoxaparin achieved target anti‐factor Xa levels significantly less often than those who received a higher dose of enoxaparin. The 2 separate findings, although not conclusive, lend some credence to the current ACCP guidelines.[21]
The studies we reviewed on VTE prophylaxis in patients who are concomitantly on antiplatelets including aspirin reported no major increased risk of bleeding; however, in the Friedman et al. study,[15] 3.0% of patients who were put on enoxaparin while still on aspirin had a bleeding event compared to 1.2% of those on enoxaparin alone. This difference is not statistically significant but is a trend possibly worth noting, especially when one looks at the lower RR of bleeding at 0.55 compared to 0.82 when dabigatran is compared with enoxaparin with and without concomitant aspirin therapy, respectively (Table 1). The highest dose of aspirin used in either of the studies was 160 mg/day, and neither study addressed other potent antiplatelets such as clopidogrel or ticlopidine separately, which limits the generalizability of the finding to all antiplatelets. Current ACCP guidelines do not recommend aspirin as a sole option for the prevention of VTE in orthopedic surgery patients.[22] Concerns remain among clinicians that antiplatelets, including aspirin, on their own are unlikely to be fully effective to thwart venous thrombotic processes for most patients, and yet the risk of bleeding is not fully known when these agents are combined with other anticoagulants for VTE prophylaxis.
Our review has several limitations, including the possibility that we may have missed some observational studies, as the identification of relevant observational studies in electronic searches is more challenging than that of RCTs. The few studies made it impossible to quantitatively pool results. These results, however, have important implications, namely that additional research on the comparative effectiveness and safety of pharmacologic and mechanical strategies to prevent VTE is needed for the optimal care of these patient subgroups. This might be achieved with trials dedicated to enrolling these patients or prespecified subgroup analyses within larger trials. Observational data may be appropriate as long as attention is paid to confounding.
APPENDIX
MEDLINE Search Strategy
((pulmonary embolism[mh] OR PE[tiab] OR Pulmonary embolism[tiab] OR thromboembolism[mh] OR thromboembolism[tiab] OR thromboembolisms[tiab] OR Thrombosis[mh] OR thrombosis[tiab] OR DVT[tiab] OR VTE[tiab] OR clot[tiab]) AND (Anticoagulants[mh] OR Anticoagulants[tiab] OR Anticoagulant[tiab] OR thrombin inhibitors[tiab] OR Aspirin[mh] or aspirin[tiab] OR aspirins[tiab] or clopidogrel[nm] OR clopidogrel[tiab] OR Plavix[tiab] or ticlopidine[mh] or ticlopidine[tiab]OR ticlid[tiab] OR prasugrel[nm]Or prasugrel[tiab]OR effient[tiab]OR ticagrelor[NM] OR ticagrelor[tiab]OR Brilinta[tiab] OR cilostazol[NM] OR cilostazol[tiab]OR pletal[tiab] OR warfarin[mh]OR warfarin[tiab]OR coumadin[tiab] OR coumadine[tiab] OR Dipyridamole[mh]OR dipyridamole[tiab]OR persantine[tiab] OR dicoumarol[MH] OR dicoumarol[tiab] OR dicumarol[tiab] OR Dextran sulfate[mh] OR dextran sulfate[tiab] ORthrombin inhibitors[tiab] OR thrombin inhibitor[tiab] OR heparin[mh] OR Heparin[tiab] OR Heparins[tiab] OR LMWH[tiab] OR LDUH[tiab] OR Enoxaparin[mh] OR Enoxaparin[tiab] OR Lovenox[tiab] OR Dalteparin[tiab] OR Fragmin[tiab] OR Tinzaparin[tiab] OR innohep[tiab] OR Nadroparin[tiab] OR Fondaparinux[nm] OR Fondaparinux[tiab] OR Arixtra[tiab] OR Idraparinux[nm] OR Idraparinux[tiab] OR Rivaroxaban[nm] OR Rivaroxaban[tiab] OR novastan[tiab] OR Desirudin[nm] OR Desirudin[tiab] OR Iprivask[tiab]OR direct thrombin inhibitor[tiab] OR Argatroban[nm] OR Argatroban[tiab] OR Acova[tiab] OR Bivalirudin[nm] OR Bivalirudin[tiab] OR Angiomax[tiab] OR Lepirudin[nm] OR Lepirudin[tiab] OR Refludan[tiab] OR Dabigatran[nm] OR Dabigatran[tiab] OR Pradaxa[tiab] OR factor xa[mh] OR factor Xa[tiab] OR vena cava filters[mh] OR filters[tiab] OR filter[tiab] OR compression stockings[mh] OR intermittent pneumatic compression devices[mh] OR compression [tiab] OR Venous foot pump[tiab])) AND(prevent*[tiab] OR prophyla*[tiab] OR prevention and control[subheading]) NOT (animals[mh] NOT humans[mh]) NOT (editorial[pt] OR comment[pt]) NOT ((infant[mh] OR infant[tiab] OR child[mh] OR child[tiab] OR children[tiab] OR adolescent[mh] OR adolescent[tiab] OR teen‐age[tiab] OR pediatric[tiab] OR perinatal[tiab]) NOT (adult[tiab] OR adults[tiab] OR adult[mh])) NOT (mechanical valve[tiab] OR heart valve[tiab] OR atrial fibrillation[mh] OR atrial fibrillation[tiab] OR thrombophilia[mh] OR thrombophilia[tiab] OR pregnancy[mh])
- , , . Estimated annual number of incident and recurrent, non‐fatal and fatal venous thromboembolism (VTE) events in the US. Blood. 2005;106:910.
- Institute of Medicine. Institute of Medicine. Initial National Priorities for Comparative Effectiveness Research. Washington, DC: National Academies Press; 2009.
- Lovenox (enoxaparin sodium injection for subcutaneous and intravenous use: prescribing information). Bridgewater, NJ: SanofiAventis; 2011. Available at: http://products.sanofi.us/lovenox/lovenox.html. Accessed October 17, 2012.
- Innohep (tinzaparin sodium injection). Ballerup, Denmark: LEO Pharmaceutical Products; 2008. Available at: http://www.accessdata.fda.gov/drugsatfda_docs/label/2008/020484s011lbl.pdf. Accessed October 17, 2012.
- Leizorovicz A. Tinzaparin compared to unfractionated heparin for initial treatment of deep vein thrombosis in very elderly patients with renal insufficiency‐ the IRIS trial. [50th ASH Annual Meeting and Exposition abstract 434]. Blood. 2008;11:112.
- Fragmin (dalteparin sodium injection). New York, NY: Pfizer Inc.; 2007. Available at: http://www.pfizer.com/files/products/uspi_fragmin.pdf. Accessed October 17, 2012.
- Methods guide for effectiveness and comparative effectiveness reviews. Rockville, MD: Agency for Healthcare Research and Quality; August 2011. AHRQ publication No. 10 (11)‐EHC063‐EF. Available at: http://www.effectivehealthcare.ahrq.gov. Accessed October 17, 2012.
- Comparative effectiveness of pharmacologic and mechanical prophylaxis of venous thromboembolism among special populations. Available at: http://effectivehealthcare.ahrq.gov/ehc/products/341/928/VTE‐Special‐Populations_Protocol_20120112.pdf. Accessed April 17, 2012.
- , , , et al. Comparative effectiveness of pharmacologic and mechanical prophylaxis of venous thromboembolism among special populations. Evidence Report/Technology Assessment (AHRQ). Available at: http://effectivehealthcare.ahrq.gov/ehc/products/341/1501/venous‐thromboembolism‐special‐populations‐report‐130529.pdf. 2013.
- , . The feasibility of creating a checklist for the assessment of the methodological quality both of randomised and non‐randomised studies of health care interventions. J Epidemiol Community Health. 1998;52(6):377–384.
- , , , et al. Efficacy and safety of fixed low‐dose dalteparin in preventing venous thromboembolism among obese or elderly hospitalized patients: a subgroup analysis of the PREVENT trial. Arch Intern Med. 2005;165(3):341–345.
- , , , . Prospective comparison of three enoxaparin dosing regimens to achieve target anti‐factor Xa levels in hospitalized, medically ill patients with extreme obesity. Am J Hematol. 2012;87(7):740–743.
- , , . Effect of prophylactic dalteparin on anti‐factor xa levels in morbidly obese patients after bariatric surgery. Obes Surg. 2010;20(4):487–491.
- , , , , . Concomitant use of medication with antiplatelet effects in patients receiving either rivaroxaban or enoxaparin after total hip or knee arthroplasty. Thromb Res. 2012;130(2):147–151.
- , , , , , . Dabigatran etexilate and concomitant use of non‐steroidal anti‐inflammatory drugs or acetylsalicylic acid in patients undergoing total hip and total knee arthroplasty: No increased risk of bleeding. Thromb Haemost. 2012;108(1):183–190.
- , , , et al. CERTIFY: prophylaxis of venous thromboembolism in patients with severe renal insufficiency. Thromb Haemost. 2011;105(6):981–988.
- , , , et al. Tinzaparin and enoxaparin given at prophylactic dose for eight days in medical elderly patients with impaired renal function: a comparative pharmacokinetic study. Thromb Haemost. 2007;97(4):581–586.
- , , , , , . Thromboprophylaxis in patients older than 75 years or with moderate renal impairment undergoing knee or hip replacement surgery [published correction appears in Int Orthop. 2012;36(5):1113]. Int Orthop. 2012;36(4):741–748.
- , , , . Impact of stage 3B chronic kidney disease on thrombosis and bleeding outcomes after orthopedic surgery in patients treated with desirudin or enoxaparin: insights from a randomized trial. J Thromb Haemost. 2012;10(8):1515–1520.
- , . Initiative to improve thromboprophylactic enoxaparin exposure in hospitalized patients with renal impairment. Am J Health Syst Pharm. 2012;69(5):390–396.
- , , , , ; American College of Chest Physicians Antithrombotic Therapy and Prevention of Thrombosis Panel. Executive summary: antithrombotic therapy and prevention of thrombosis, 9th ed: American College of Chest Physicians evidence‐based clinical practice guidelines. Chest. 2012;141(2 suppl):7S–47S.
- , . Aspirin for the prophylaxis of venous thromboembolic events in orthopedic surgery patients: a comparison of the AAOS and ACCP guidelines with review of the evidence. Ann Pharmacother. 2013;47(1):63–74.
