User login
Study of Antimicrobial Scrubs
Healthcare workers' (HCWs) attire becomes contaminated with bacterial pathogens during the course of the workday,[1, 2, 3, 4, 5, 6, 7, 8, 9, 10, 11, 12] and Munoz‐Price et al.[13] recently demonstrated that finding bacterial pathogens on HCWs' white coats correlated with finding the same pathogens on their hands. Because of concern for an association between attire colonization and nosocomial infection, governmental agencies in England and Scotland banned HCWs from wearing white coats or long‐sleeve garments,[14, 15] despite evidence that such an approach does not reduce contamination.[12]
Newly developed antimicrobial textiles have been incorporated into HCW scrubs,[16, 17, 18, 19, 20] and commercial Web sites and product inserts report that these products can reduce bacterial contamination by 80.9% at 8 hours to greater than 99% under laboratory conditions depending on the product and microbe studied.[16, 17, 19] Because there are limited clinical data pertaining to the effectiveness of antimicrobial scrubs, we performed a prospective study designed to determine whether wearing these products reduced bacterial contamination of HCWs' scrubs or skin at the end of an 8‐hour workday.
METHODS
Design
The study was a prospective, unblinded, randomized, controlled trial that was approved by the Colorado Multiple Institutional Review Board and conducted at Denver Health, a university‐affiliated public safety net hospital. No protocol changes occurred during the study.
Participants
Participants included hospitalist physicians, internal medicine residents, physician assistants, nurse practitioners, and nurses who directly cared for patients hospitalized on internal medicine units between March 12, 2012 and August 28, 2012. Participants known to be pregnant or those who refused to participate in the study were excluded.
Intervention
Standard scrubs issued by the hospital were tested along with 2 different antimicrobial scrubs (scrub A and scrub B). Scrub A was made with a polyester microfiber material embedded with a proprietary antimicrobial chemical. Scrub B was a polyestercotton blend scrub that included 2 proprietary antimicrobial chemicals and silver embedded into the fabric. The standard scrub was made of a polyestercotton blend with no antimicrobial properties. All scrubs consisted of pants and a short‐sleeved shirt, with either a pocket at the left breast or lower front surface, and all were tested new prior to any washing or wear. Preliminary cultures were done on 2 scrubs in each group to assess the extent of preuse contamination. All providers were instructed not to wear white coats at any time during the day that they were wearing the scrubs. Providers were not told the type of scrub they received, but the antimicrobial scrubs had a different appearance and texture than the standard scrubs, so blinding was not possible.
Outcomes
The primary end point was the total bacterial colony count of samples obtained from the breast or lower front pocket, the sleeve cuff of the dominant hand, and the pant leg at the midthigh of the dominant leg on all scrubs after an 8‐hour workday. Secondary outcomes were the bacterial colony counts of cultures obtained from the volar surface of the wrists of the HCWs' dominant arm, and the colony counts of methicillin‐resistant Staphylococcus aureus (MRSA), vancomycin‐resistant enterococci (VRE), and resistant Gram‐negative bacteria on the 3 scrub types, all obtained after the 8‐hour workday.
Cultures were collected using a standardized RODAC imprint method[21] with BBL RODAC plates containing blood agar (Becton Dickinson, Sparks, MD). Cultures were incubated in ambient air at 35 to 37C for 18 to 22 hours. After incubation, visible colonies were counted using a dissecting microscope to a maximum of 200 colonies as recommended by the manufacturer. Colonies morphologically consistent with Staphylococcus species were subsequently tested for coagulase using a BactiStaph rapid latex agglutination test (Remel, Lenexa, KS). If positive, these colonies were subcultured to sheep blood agar (Remel) and BBL MRSA CHROMagar (Becton Dickinson) and incubated for an additional 18 to 24 hours. Characteristic growth on blood agar that also produced mauve‐colored colonies on CHROMagar was taken to indicate MRSA. Colonies morphologically suspicious for being VRE were identified and confirmed as VRE using a positive identification and susceptibility panel (Microscan; Siemens, Deerfield, IL). A negative combination panel (Microscan, Siemens) was also used to identify and confirm resistant Gram‐negative rods.
Each participant completed a survey that included questions that identified their occupation, whether they had had contact with patients who were known to be colonized or infected with MRSA, VRE, or resistant Gram‐negative rods during the testing period, and whether they experienced any adverse events that might relate to wearing the uniform.
Sample Size
We assumed that cultures taken from the sleeve of the control scrubs would have a mean ( standard deviation) colony count of 69 (67) based on data from our previous study.[12] Although the companies making the antimicrobial scrubs indicated that their respective products provided between 80.9% at 8 hours and >99% reduction in bacterial colony counts in laboratory settings, we assumed that a 70% decrease in colony count compared with standard scrubs could be clinically important. After adjusting for multiple comparisons and accounting for using nonparametric analyses with an unknown distribution, we estimated a need to recruit 35 subjects in each of 3 groups.
Randomization
The principal investigator and coinvestigators enrolled and consented participants. After obtaining consent, block randomization, stratified by occupation, occurred 1 day prior to the study using a computer‐generated table of random numbers.
Statistics
Data were collected and managed using REDCap (Research Electronic Data Capture; Vanderbilt UniversityThe Institute for Medicine and Public Health, Nashville, TN) electronic data capture tools hosted at Denver Health. REDCap is a secure Web‐based application designed to support data collection for research studies, providing: (1) an intuitive interface for validated data entry, (2) audit trails for tracking data manipulation and export procedures, (3) automated export procedures for seamless data downloads to common statistical packages, and (4) procedures for importing data from external sources.[22]
Colony counts were compared using a Kruskal‐Wallis 1‐way analysis of variance by ranks. Bonferroni's correction for multiple comparisons resulted in a P<0.01 as indicating statistical significance. Proportions were compared using [2] analysis. All data are presented as medians with interquartile range (IQR) or proportions.
RESULTS
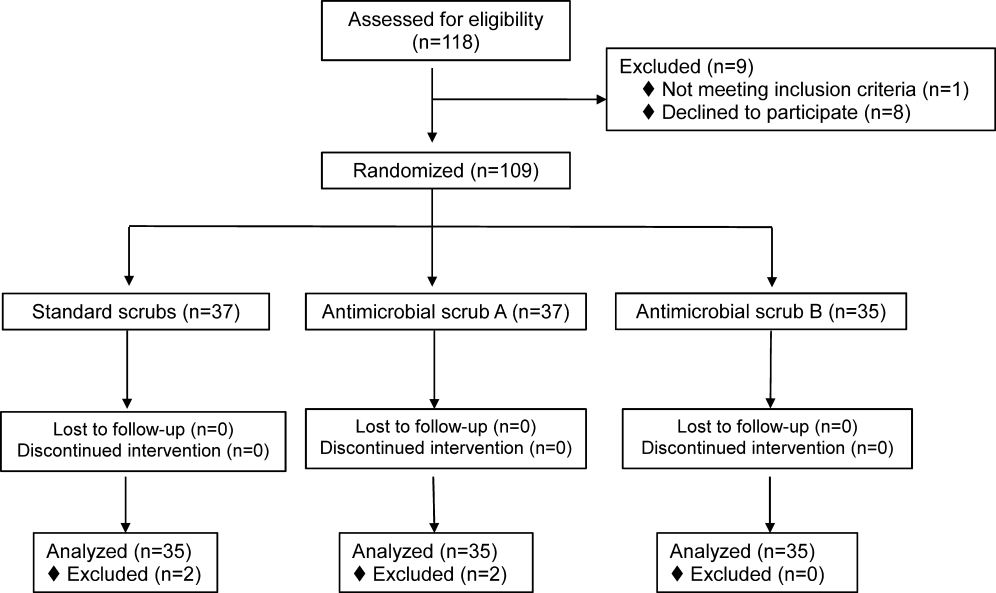
We screened 118 HCWs for participation and randomized 109, 37 in the control and antimicrobial scrub group A, and 35 in antimicrobial scrub group B (during the course of the study we neglected to culture the pockets of 2 participants in the standard scrub group and 2 in antimicrobial scrub group A). Because our primary end point was total colony count from cultures taken from 3 sites, data from these 4 subjects could not be used, and all the data from these 4 subjects were excluded from the primary analysis; 4 additional subjects were subsequently recruited allowing us to meet our block enrollment target (Figure 1). The first and last participants were studied on March 12, 2012 and August 28, 2012, respectively. The trial ended once the defined number of participants was enrolled. The occupations of the 105 participants are summarized in Table 1.

| All Subjects, N=105 | Standard Scrub, n=35 | Antimicrobial Scrub A, n=35 | Antimicrobial Scrub B, n=35 | |
|---|---|---|---|---|
| Healthcare worker type, n (%) | ||||
| Attending physician | 11 (10) | 5 (14) | 3 (9) | 3 (9) |
| Intern/resident | 51 (49) | 17 (49) | 16 (46) | 18 (51) |
| Midlevels | 6 (6) | 2 (6) | 2 (6) | 2 (6) |
| Nurse | 37 (35) | 11 (31) | 14 (40) | 12 (34) |
| Cared for colonized or infected patient with antibiotic resistant organism, n (%) | 55 (52) | 16 (46) | 20 (57) | 19 (54) |
| Number of colonized or infected patients cared for, n (%) | ||||
| 1 | 37 (67) | 10 (63) | 13 (65) | 14 (74) |
| 2 | 11 (20) | 4 (25) | 6 (30) | 1 (5) |
| 3 or more | 6 (11) | 2 (12) | 1 (5) | 3 (16) |
| Unknown | 1 (2) | 0 (0) | 0 (0) | 1 (5) |
Colony counts of all scrubs cultured prior to use never exceeded 10 colonies. The median (IQR) total colony counts from all sites on the scrubs was 99 (66182) for standard scrubs, 137 (84289) for antimicrobial scrub type A, and 138 (62274) for antimicrobial scrub type B (P=0.36). We found no significant differences between the colony counts cultured from any of the individual sites among the 3 groups, regardless of occupation (Table 2). No significant difference was observed with respect to colony counts cultured from the wrist among the 3 study groups (Table 2). Comparisons between groups were planned a priori if a difference across all groups was found. Given the nonsignificant P values across all scrub groups, no further comparisons were made.
| Total (From All Sites on Scrubs) | Sleeve Cuff | Thigh | Wrist | ||
|---|---|---|---|---|---|
| |||||
| All subjects, N=105 | |||||
| Standard scrub | 99 (66182) | 41 (2070) | 20 (944) | 32 (2161) | 16 (540) |
| Antimicrobial scrub A | 137 (84289) | 65 (35117) | 33 (16124) | 41 (1586) | 23 (442) |
| Antimicrobial scrub B | 138 (62274) | 41 (2299) | 21 (941) | 40 (18107) | 15 (654) |
| P value | 0.36 | 0.17 | 0.07 | 0.57 | 0.92 |
| Physicians and midlevels, n=68 | |||||
| Standard scrub | 115.5 (72.5173.5) | 44.5 (2270.5) | 27.5 (10.538.5) | 35 (2362.5) | 24.5 (755) |
| Antimicrobial scrub A | 210 (114289) | 86 (64120) | 39 (18129) | 49 (2486) | 24 (342) |
| Antimicrobial scrub B | 149 (68295) | 52 (26126) | 21 (1069) | 37 (18141) | 19 (872) |
| P value | 0.21 | 0.08 | 0.19 | 0.85 | 0.76 |
| Nurses, n=37 | |||||
| Standard scrub | 89 (31236) | 37 (1348) | 13 (552) | 28 (1342) | 9 (321) |
| Antimicrobial scrub A | 105 (43256) | 45.5 (2258) | 21.5 (1654) | 38.5 (1268) | 17 (643) |
| Antimicrobial scrub B | 91.5 (60174.5) | 27 (1340) | 16 (7.526) | 51 (2186.5) | 10 (3.543.5) |
| P value | 0.86 | 0.39 | 0.19 | 0.49 | 0.41 |
Fifty‐five participants (52%) reported caring for patients who were known to be colonized or infected with an antibiotic‐resistant organism, 16 (46%) randomized to wear standard scrubs, and 20 (57%) and 19 (54%) randomized to wear antimicrobial scrub A or B, respectively (P=0.61). Of these, however, antibiotic‐resistant organisms were only cultured from the scrubs of 2 providers (1 with 1 colony of MRSA from the breast pocket of antimicrobial scrub A, 1 with 1 colony of MRSA cultured from the pocket of antimicrobial scrub B [P=0.55]), and from the wrist of only 1 provider (a multiresistant Gram‐negative rod who wore antimicrobial scrub B).
Adverse Events
Six subjects (5.7%) reported adverse events, all of whom were wearing antimicrobial scrubs (P=0.18). For participants wearing antimicrobial scrub A, 1 (3%) reported itchiness and 2 (6%) reported heaviness or poor breathability. For participants wearing antimicrobial scrub B, 1 (3%) reported redness, 1 (3%) reported itchiness, and 1 (3%) reported heaviness or poor breathability.
DISCUSSION
The important findings of this study are that we found no evidence indicating that either of the 2 antimicrobial scrubs tested reduced bacterial contamination or antibiotic‐resistant contamination on HCWs' scrubs or wrists compared with standard scrubs at the end of an 8‐hour workday, and that despite many HCWs being exposed to patients who were colonized or infected with antibiotic‐resistant bacteria, these organisms were only rarely cultured from their uniforms.
We found that HCWs in all 3 arms of the study had bacterial contamination on their scrubs and skin, consistent with previous studies showing that HCWs' uniforms are frequently contaminated with bacteria, including MRSA, VRE, and other pathogens.[1, 2, 3, 4, 5, 6, 7, 8, 9, 10, 11, 12] We previously found that bacterial contamination of HCWs' uniforms occurs within hours of putting on newly laundered uniforms.[12]
Literature on the effectiveness of antimicrobial HCW uniforms when tested in clinical settings is limited. Bearman and colleagues[23] recently published the results of a study of 31 subjects who wore either standard or antimicrobial scrubs, crossing over every 4 weeks for 4 months, with random culturing done weekly at the beginning and end of a work shift. Scrubs were laundered an average of 1.5 times/week, but the timing of the laundering relative to when cultures were obtained was not reported. Very few isolates of MRSA, Gram‐negative rods, or VRE were found (only 3.9%, 0.4%, and 0.05% of the 2000 samples obtained, respectively), and no differences were observed with respect to the number of HCWs who had antibiotic‐resistant organisms cultured when they were wearing standard versus antimicrobial scrubs. Those who had MRSA cultured, however, had lower mean log colony counts when they were wearing the antimicrobial scrubs. The small number of samples with positive isolates, together with differences in the extent of before‐shift contamination among groups complicates interpreting these data. The authors concluded that a prospective trial was needed. We attempted to include the scrub studied by Bearman and colleagues[23] in our study, but the company had insufficient stock available at the time we tried to purchase the product.
Gross and colleagues[24] found no difference in the mean colony counts of cultures taken from silver‐impregnated versus standard scrubs in a pilot crossover study done with 10 HCWs (although there were trends toward higher colony counts when the subjects wore antimicrobial scrubs).
Antibiotic‐resistant bacteria were only cultured from 3 participants (2.9%) in our current study, compared to 16% of those randomized to wearing white coats in our previous study and 20% of those randomized to wearing standard scrubs.[12] This difference may be explained by several recent studies reporting that rates of MRSA infections in hospitals are decreasing.[25, 26] The rate of hospital‐acquired MRSA infection or colonization at our own institution decreased 80% from 2007 to 2012. At the times of our previous and current studies, providers were expected to wear gowns and gloves when caring for patients as per standard contact precautions. Rates of infection and colonization of VRE and resistant Gram‐negative rods have remained low at our hospital, and our data are consistent with the rates reported on HCWs' uniforms in other studies.[2, 5, 10]
Only 6 of our subjects reported adverse reactions, but all were wearing antimicrobial scrubs (P=0.18). Several of the participants described that the fabrics of the 2 antimicrobial scrubs were heavier and less breathable than the standard scrubs. We believe this difference is more likely to explain the adverse reactions reported than is any type of reaction to the specific chemicals in the fabrics.
Our study has several limitations. Because it was conducted on the general internal medicine units of a single university‐affiliated public hospital, the results may not generalize to other types of institutions or other inpatient services.
As we previously described,[12] the RODAC imprint method only samples a small area of HCWs' uniforms and thus does not represent total bacterial contamination.[21] We specifically cultured areas that are known to be highly contaminated (ie, sleeve cuffs and pockets). Although imprint methods have limitations (as do other methods for culturing clothing), they have been commonly utilized in studies assessing bacterial contamination of HCW clothing.[2, 3, 5]
Although some of the bacterial load we cultured could have come from the providers themselves, previous studies have shown that 80% to 90% of the resistant bacteria cultured from HCWs' attire come from other sources.[1, 2]
Because our sample size was calculated on the basis of being able to detect a difference of 70% in total bacterial colony count, our study was not large enough to exclude a lower level of effectiveness. However, we saw no trends suggesting the antimicrobial products might have a lower level of effectiveness.
We did not observe the hand‐washing practices of the participants, and accordingly, cannot confirm that these practices were the same in each of our 3 study groups. Intermittent, surreptitious monitoring of hand‐washing practices on our internal medicine units over the last several years has found compliance with hand hygiene recommendations varying from 70% to 90%.
Although the participants in our study were not explicitly told to which scrub they were randomized, the colors, appearances, and textures of the antimicrobial fabrics were different from the standard scrubs such that blinding was impossible. Participants wearing antimicrobial scrubs could have changed their hand hygiene practices (ie, less careful hand hygiene). Lack of blinding could also have led to over‐reporting of adverse events by the subjects randomized to wear the antimicrobial scrubs.
In an effort to treat all the scrubs in the same fashion, all were tested new, prior to being washed or previously worn. Studying the scrubs prior to washing or wearing could have increased the reports of adverse effects, as the fabrics could have been stiffer and more uncomfortable than they might have been at a later stage in their use.
Our study also has some strengths. Our participants included physicians, residents, nurses, nurse practitioners, and physician assistants. Accordingly, our results should be generalizable to most HCWs. We also confirmed that the scrubs that were tested were nearly sterile prior to use.
In conclusion, we found no evidence suggesting that either of 2 antimicrobial scrubs tested decreased bacterial contamination of HCWs' scrubs or skin after an 8‐hour workday compared to standard scrubs. We also found that, although HCWs are frequently exposed to patients harboring antibiotic‐resistant bacteria, these bacteria were only rarely cultured from HCWs' scrubs or skin.
- , , , . Contamination of nurses' uniforms with Staphylococcus aureus. Lancet. 1969;2:233–235.
- , , . Contamination of protective clothing and nurses' uniforms in an isolation ward. J Hosp Infect. 1983;4:149–157.
- , , . Microbial flora on doctors' white coats. BMJ. 1991;303:1602–1604.
- . Bacterial contamination of nurses' uniforms: a study. Nursing Stand. 1998;13:37–42.
- , , . Bacterial flora on the white coats of medical students. J Hosp Infect. 2000;45:65–68.
- , , . Bacterial contamination of uniforms. J Hosp Infect. 2001;48:238–241.
- , , , et al. Significance of methicillin‐resistant Staphylococcus aureus (MRSA) survey in a university teaching hospital. J Infect Chemother. 2003;9:172–177.
- . Environmental contamination makes an important contribution to hospital infection. J Hosp Infect. 2007;65(suppl 2):50–54.
- , , , et al. Detection of methicillin‐resistant Staphylococcus aureus and vancomycin‐resistant enterococci on the gowns and gloves of healthcare workers. Infect Control Hosp Epidemiol. 2008;29:583–589.
- , , , , , . Bacterial contamination of health care workers' white coats. Am J Infect Control. 2009;37:101–105.
- , , , , , . Nursing and physician attire as possible source of nosocomial infections. Am J Infect Control. 2011;39:555–559.
- , , , , , . Newly cleaned physician uniforms and infrequently washed white coats have similar rates of bacterial contamination after an 8‐hour workday: a randomized controlled trial. J Hosp Med. 2011;6:177–182.
- , , , et al. Associations between bacterial contamination of health care workers' hands and contamination of white coats and scrubs. Am J Infect Control. 2012;40:e245–e248.
- Department of Health. Uniforms and workwear: an evidence base for developing local policy. National Health Service, 17 September 2007. Available at: http://www.dh.gov.uk/en/Publicationsandstatistics/Publications/Publicationspolicyandguidance/DH_078433. Accessed January 29, 2010.
- Scottish Government Health Directorates. NHS Scotland dress code. Available at: http://www.sehd.scot.nhs.uk/mels/CEL2008_53.pdf. Accessed February 10, 2010.
- Bio Shield Tech Web site. Bio Gardz–unisex scrub top–antimicrobial treatment. Available at: http://www.bioshieldtech.com/Bio_Gardz_Unisex_Scrub_Top_Antimicrobial_Tre_p/sbt01‐r‐p.htm. Accessed January 9, 2013.
- Doc Froc Web site and informational packet. Available at: http://www.docfroc.com. Accessed July 22, 2011.
- Vestagen Web site and informational packet. Available at: http://www.vestagen.com. Accessed July 22, 2011.
- Under Scrub apparel Web site. Testing. Available at: http://underscrub.com/testing. Accessed March 21, 2013.
- MediThreads Web site. Microban FAQ's. Available at: http://medithreads.com/faq/microban‐faqs. Accessed March 21, 2013.
- , , , , . Comparison of the Rodac imprint method to selective enrichment broth for recovery of vancomycin‐resistant enterococci and drug‐resistant Enterobacteriaceae from environmental surfaces. J Clin Microbiol. 2000;38:4646–4648.
- , , , , , . Research electronic data capture (REDCap)—a metadata‐driven methodology and workflow process for providing translational research informatics support. J Biomed Inform. 2009;42:377–381.
- , , , et al. A crossover trial of antimicrobial scrubs to reduce methicillin‐resistant Staphylococcus aureus burden on healthcare worker apparel. Infect Control Hosp Epidemiol. 2012;33:268–275.
- , , , , . Pilot study on the microbial contamination of conventional vs. silver‐impregnated uniforms worn by ambulance personnel during one week of emergency medical service. GMS Krankenhhyg Interdiszip. 2010;5.pii: Doc09.
- , , , et al. Epidemiology of Staphylococcus aureus blood and skin and soft tissue infections in the US military health system, 2005–2010. JAMA. 2012;308:50–59.
- , , , et al. Health care‐associated invasive MRSA infections, 2005–2008. JAMA. 2010;304:641–648.
Healthcare workers' (HCWs) attire becomes contaminated with bacterial pathogens during the course of the workday,[1, 2, 3, 4, 5, 6, 7, 8, 9, 10, 11, 12] and Munoz‐Price et al.[13] recently demonstrated that finding bacterial pathogens on HCWs' white coats correlated with finding the same pathogens on their hands. Because of concern for an association between attire colonization and nosocomial infection, governmental agencies in England and Scotland banned HCWs from wearing white coats or long‐sleeve garments,[14, 15] despite evidence that such an approach does not reduce contamination.[12]
Newly developed antimicrobial textiles have been incorporated into HCW scrubs,[16, 17, 18, 19, 20] and commercial Web sites and product inserts report that these products can reduce bacterial contamination by 80.9% at 8 hours to greater than 99% under laboratory conditions depending on the product and microbe studied.[16, 17, 19] Because there are limited clinical data pertaining to the effectiveness of antimicrobial scrubs, we performed a prospective study designed to determine whether wearing these products reduced bacterial contamination of HCWs' scrubs or skin at the end of an 8‐hour workday.
METHODS
Design
The study was a prospective, unblinded, randomized, controlled trial that was approved by the Colorado Multiple Institutional Review Board and conducted at Denver Health, a university‐affiliated public safety net hospital. No protocol changes occurred during the study.
Participants
Participants included hospitalist physicians, internal medicine residents, physician assistants, nurse practitioners, and nurses who directly cared for patients hospitalized on internal medicine units between March 12, 2012 and August 28, 2012. Participants known to be pregnant or those who refused to participate in the study were excluded.
Intervention
Standard scrubs issued by the hospital were tested along with 2 different antimicrobial scrubs (scrub A and scrub B). Scrub A was made with a polyester microfiber material embedded with a proprietary antimicrobial chemical. Scrub B was a polyestercotton blend scrub that included 2 proprietary antimicrobial chemicals and silver embedded into the fabric. The standard scrub was made of a polyestercotton blend with no antimicrobial properties. All scrubs consisted of pants and a short‐sleeved shirt, with either a pocket at the left breast or lower front surface, and all were tested new prior to any washing or wear. Preliminary cultures were done on 2 scrubs in each group to assess the extent of preuse contamination. All providers were instructed not to wear white coats at any time during the day that they were wearing the scrubs. Providers were not told the type of scrub they received, but the antimicrobial scrubs had a different appearance and texture than the standard scrubs, so blinding was not possible.
Outcomes
The primary end point was the total bacterial colony count of samples obtained from the breast or lower front pocket, the sleeve cuff of the dominant hand, and the pant leg at the midthigh of the dominant leg on all scrubs after an 8‐hour workday. Secondary outcomes were the bacterial colony counts of cultures obtained from the volar surface of the wrists of the HCWs' dominant arm, and the colony counts of methicillin‐resistant Staphylococcus aureus (MRSA), vancomycin‐resistant enterococci (VRE), and resistant Gram‐negative bacteria on the 3 scrub types, all obtained after the 8‐hour workday.
Cultures were collected using a standardized RODAC imprint method[21] with BBL RODAC plates containing blood agar (Becton Dickinson, Sparks, MD). Cultures were incubated in ambient air at 35 to 37C for 18 to 22 hours. After incubation, visible colonies were counted using a dissecting microscope to a maximum of 200 colonies as recommended by the manufacturer. Colonies morphologically consistent with Staphylococcus species were subsequently tested for coagulase using a BactiStaph rapid latex agglutination test (Remel, Lenexa, KS). If positive, these colonies were subcultured to sheep blood agar (Remel) and BBL MRSA CHROMagar (Becton Dickinson) and incubated for an additional 18 to 24 hours. Characteristic growth on blood agar that also produced mauve‐colored colonies on CHROMagar was taken to indicate MRSA. Colonies morphologically suspicious for being VRE were identified and confirmed as VRE using a positive identification and susceptibility panel (Microscan; Siemens, Deerfield, IL). A negative combination panel (Microscan, Siemens) was also used to identify and confirm resistant Gram‐negative rods.
Each participant completed a survey that included questions that identified their occupation, whether they had had contact with patients who were known to be colonized or infected with MRSA, VRE, or resistant Gram‐negative rods during the testing period, and whether they experienced any adverse events that might relate to wearing the uniform.
Sample Size
We assumed that cultures taken from the sleeve of the control scrubs would have a mean ( standard deviation) colony count of 69 (67) based on data from our previous study.[12] Although the companies making the antimicrobial scrubs indicated that their respective products provided between 80.9% at 8 hours and >99% reduction in bacterial colony counts in laboratory settings, we assumed that a 70% decrease in colony count compared with standard scrubs could be clinically important. After adjusting for multiple comparisons and accounting for using nonparametric analyses with an unknown distribution, we estimated a need to recruit 35 subjects in each of 3 groups.
Randomization
The principal investigator and coinvestigators enrolled and consented participants. After obtaining consent, block randomization, stratified by occupation, occurred 1 day prior to the study using a computer‐generated table of random numbers.
Statistics
Data were collected and managed using REDCap (Research Electronic Data Capture; Vanderbilt UniversityThe Institute for Medicine and Public Health, Nashville, TN) electronic data capture tools hosted at Denver Health. REDCap is a secure Web‐based application designed to support data collection for research studies, providing: (1) an intuitive interface for validated data entry, (2) audit trails for tracking data manipulation and export procedures, (3) automated export procedures for seamless data downloads to common statistical packages, and (4) procedures for importing data from external sources.[22]
Colony counts were compared using a Kruskal‐Wallis 1‐way analysis of variance by ranks. Bonferroni's correction for multiple comparisons resulted in a P<0.01 as indicating statistical significance. Proportions were compared using [2] analysis. All data are presented as medians with interquartile range (IQR) or proportions.
RESULTS
We screened 118 HCWs for participation and randomized 109, 37 in the control and antimicrobial scrub group A, and 35 in antimicrobial scrub group B (during the course of the study we neglected to culture the pockets of 2 participants in the standard scrub group and 2 in antimicrobial scrub group A). Because our primary end point was total colony count from cultures taken from 3 sites, data from these 4 subjects could not be used, and all the data from these 4 subjects were excluded from the primary analysis; 4 additional subjects were subsequently recruited allowing us to meet our block enrollment target (Figure 1). The first and last participants were studied on March 12, 2012 and August 28, 2012, respectively. The trial ended once the defined number of participants was enrolled. The occupations of the 105 participants are summarized in Table 1.
| All Subjects, N=105 | Standard Scrub, n=35 | Antimicrobial Scrub A, n=35 | Antimicrobial Scrub B, n=35 | |
|---|---|---|---|---|
| Healthcare worker type, n (%) | ||||
| Attending physician | 11 (10) | 5 (14) | 3 (9) | 3 (9) |
| Intern/resident | 51 (49) | 17 (49) | 16 (46) | 18 (51) |
| Midlevels | 6 (6) | 2 (6) | 2 (6) | 2 (6) |
| Nurse | 37 (35) | 11 (31) | 14 (40) | 12 (34) |
| Cared for colonized or infected patient with antibiotic resistant organism, n (%) | 55 (52) | 16 (46) | 20 (57) | 19 (54) |
| Number of colonized or infected patients cared for, n (%) | ||||
| 1 | 37 (67) | 10 (63) | 13 (65) | 14 (74) |
| 2 | 11 (20) | 4 (25) | 6 (30) | 1 (5) |
| 3 or more | 6 (11) | 2 (12) | 1 (5) | 3 (16) |
| Unknown | 1 (2) | 0 (0) | 0 (0) | 1 (5) |
Colony counts of all scrubs cultured prior to use never exceeded 10 colonies. The median (IQR) total colony counts from all sites on the scrubs was 99 (66182) for standard scrubs, 137 (84289) for antimicrobial scrub type A, and 138 (62274) for antimicrobial scrub type B (P=0.36). We found no significant differences between the colony counts cultured from any of the individual sites among the 3 groups, regardless of occupation (Table 2). No significant difference was observed with respect to colony counts cultured from the wrist among the 3 study groups (Table 2). Comparisons between groups were planned a priori if a difference across all groups was found. Given the nonsignificant P values across all scrub groups, no further comparisons were made.
| Total (From All Sites on Scrubs) | Sleeve Cuff | Thigh | Wrist | ||
|---|---|---|---|---|---|
| |||||
| All subjects, N=105 | |||||
| Standard scrub | 99 (66182) | 41 (2070) | 20 (944) | 32 (2161) | 16 (540) |
| Antimicrobial scrub A | 137 (84289) | 65 (35117) | 33 (16124) | 41 (1586) | 23 (442) |
| Antimicrobial scrub B | 138 (62274) | 41 (2299) | 21 (941) | 40 (18107) | 15 (654) |
| P value | 0.36 | 0.17 | 0.07 | 0.57 | 0.92 |
| Physicians and midlevels, n=68 | |||||
| Standard scrub | 115.5 (72.5173.5) | 44.5 (2270.5) | 27.5 (10.538.5) | 35 (2362.5) | 24.5 (755) |
| Antimicrobial scrub A | 210 (114289) | 86 (64120) | 39 (18129) | 49 (2486) | 24 (342) |
| Antimicrobial scrub B | 149 (68295) | 52 (26126) | 21 (1069) | 37 (18141) | 19 (872) |
| P value | 0.21 | 0.08 | 0.19 | 0.85 | 0.76 |
| Nurses, n=37 | |||||
| Standard scrub | 89 (31236) | 37 (1348) | 13 (552) | 28 (1342) | 9 (321) |
| Antimicrobial scrub A | 105 (43256) | 45.5 (2258) | 21.5 (1654) | 38.5 (1268) | 17 (643) |
| Antimicrobial scrub B | 91.5 (60174.5) | 27 (1340) | 16 (7.526) | 51 (2186.5) | 10 (3.543.5) |
| P value | 0.86 | 0.39 | 0.19 | 0.49 | 0.41 |
Fifty‐five participants (52%) reported caring for patients who were known to be colonized or infected with an antibiotic‐resistant organism, 16 (46%) randomized to wear standard scrubs, and 20 (57%) and 19 (54%) randomized to wear antimicrobial scrub A or B, respectively (P=0.61). Of these, however, antibiotic‐resistant organisms were only cultured from the scrubs of 2 providers (1 with 1 colony of MRSA from the breast pocket of antimicrobial scrub A, 1 with 1 colony of MRSA cultured from the pocket of antimicrobial scrub B [P=0.55]), and from the wrist of only 1 provider (a multiresistant Gram‐negative rod who wore antimicrobial scrub B).
Adverse Events
Six subjects (5.7%) reported adverse events, all of whom were wearing antimicrobial scrubs (P=0.18). For participants wearing antimicrobial scrub A, 1 (3%) reported itchiness and 2 (6%) reported heaviness or poor breathability. For participants wearing antimicrobial scrub B, 1 (3%) reported redness, 1 (3%) reported itchiness, and 1 (3%) reported heaviness or poor breathability.
DISCUSSION
The important findings of this study are that we found no evidence indicating that either of the 2 antimicrobial scrubs tested reduced bacterial contamination or antibiotic‐resistant contamination on HCWs' scrubs or wrists compared with standard scrubs at the end of an 8‐hour workday, and that despite many HCWs being exposed to patients who were colonized or infected with antibiotic‐resistant bacteria, these organisms were only rarely cultured from their uniforms.
We found that HCWs in all 3 arms of the study had bacterial contamination on their scrubs and skin, consistent with previous studies showing that HCWs' uniforms are frequently contaminated with bacteria, including MRSA, VRE, and other pathogens.[1, 2, 3, 4, 5, 6, 7, 8, 9, 10, 11, 12] We previously found that bacterial contamination of HCWs' uniforms occurs within hours of putting on newly laundered uniforms.[12]
Literature on the effectiveness of antimicrobial HCW uniforms when tested in clinical settings is limited. Bearman and colleagues[23] recently published the results of a study of 31 subjects who wore either standard or antimicrobial scrubs, crossing over every 4 weeks for 4 months, with random culturing done weekly at the beginning and end of a work shift. Scrubs were laundered an average of 1.5 times/week, but the timing of the laundering relative to when cultures were obtained was not reported. Very few isolates of MRSA, Gram‐negative rods, or VRE were found (only 3.9%, 0.4%, and 0.05% of the 2000 samples obtained, respectively), and no differences were observed with respect to the number of HCWs who had antibiotic‐resistant organisms cultured when they were wearing standard versus antimicrobial scrubs. Those who had MRSA cultured, however, had lower mean log colony counts when they were wearing the antimicrobial scrubs. The small number of samples with positive isolates, together with differences in the extent of before‐shift contamination among groups complicates interpreting these data. The authors concluded that a prospective trial was needed. We attempted to include the scrub studied by Bearman and colleagues[23] in our study, but the company had insufficient stock available at the time we tried to purchase the product.
Gross and colleagues[24] found no difference in the mean colony counts of cultures taken from silver‐impregnated versus standard scrubs in a pilot crossover study done with 10 HCWs (although there were trends toward higher colony counts when the subjects wore antimicrobial scrubs).
Antibiotic‐resistant bacteria were only cultured from 3 participants (2.9%) in our current study, compared to 16% of those randomized to wearing white coats in our previous study and 20% of those randomized to wearing standard scrubs.[12] This difference may be explained by several recent studies reporting that rates of MRSA infections in hospitals are decreasing.[25, 26] The rate of hospital‐acquired MRSA infection or colonization at our own institution decreased 80% from 2007 to 2012. At the times of our previous and current studies, providers were expected to wear gowns and gloves when caring for patients as per standard contact precautions. Rates of infection and colonization of VRE and resistant Gram‐negative rods have remained low at our hospital, and our data are consistent with the rates reported on HCWs' uniforms in other studies.[2, 5, 10]
Only 6 of our subjects reported adverse reactions, but all were wearing antimicrobial scrubs (P=0.18). Several of the participants described that the fabrics of the 2 antimicrobial scrubs were heavier and less breathable than the standard scrubs. We believe this difference is more likely to explain the adverse reactions reported than is any type of reaction to the specific chemicals in the fabrics.
Our study has several limitations. Because it was conducted on the general internal medicine units of a single university‐affiliated public hospital, the results may not generalize to other types of institutions or other inpatient services.
As we previously described,[12] the RODAC imprint method only samples a small area of HCWs' uniforms and thus does not represent total bacterial contamination.[21] We specifically cultured areas that are known to be highly contaminated (ie, sleeve cuffs and pockets). Although imprint methods have limitations (as do other methods for culturing clothing), they have been commonly utilized in studies assessing bacterial contamination of HCW clothing.[2, 3, 5]
Although some of the bacterial load we cultured could have come from the providers themselves, previous studies have shown that 80% to 90% of the resistant bacteria cultured from HCWs' attire come from other sources.[1, 2]
Because our sample size was calculated on the basis of being able to detect a difference of 70% in total bacterial colony count, our study was not large enough to exclude a lower level of effectiveness. However, we saw no trends suggesting the antimicrobial products might have a lower level of effectiveness.
We did not observe the hand‐washing practices of the participants, and accordingly, cannot confirm that these practices were the same in each of our 3 study groups. Intermittent, surreptitious monitoring of hand‐washing practices on our internal medicine units over the last several years has found compliance with hand hygiene recommendations varying from 70% to 90%.
Although the participants in our study were not explicitly told to which scrub they were randomized, the colors, appearances, and textures of the antimicrobial fabrics were different from the standard scrubs such that blinding was impossible. Participants wearing antimicrobial scrubs could have changed their hand hygiene practices (ie, less careful hand hygiene). Lack of blinding could also have led to over‐reporting of adverse events by the subjects randomized to wear the antimicrobial scrubs.
In an effort to treat all the scrubs in the same fashion, all were tested new, prior to being washed or previously worn. Studying the scrubs prior to washing or wearing could have increased the reports of adverse effects, as the fabrics could have been stiffer and more uncomfortable than they might have been at a later stage in their use.
Our study also has some strengths. Our participants included physicians, residents, nurses, nurse practitioners, and physician assistants. Accordingly, our results should be generalizable to most HCWs. We also confirmed that the scrubs that were tested were nearly sterile prior to use.
In conclusion, we found no evidence suggesting that either of 2 antimicrobial scrubs tested decreased bacterial contamination of HCWs' scrubs or skin after an 8‐hour workday compared to standard scrubs. We also found that, although HCWs are frequently exposed to patients harboring antibiotic‐resistant bacteria, these bacteria were only rarely cultured from HCWs' scrubs or skin.
- , , , . Contamination of nurses' uniforms with Staphylococcus aureus. Lancet. 1969;2:233–235.
- , , . Contamination of protective clothing and nurses' uniforms in an isolation ward. J Hosp Infect. 1983;4:149–157.
- , , . Microbial flora on doctors' white coats. BMJ. 1991;303:1602–1604.
- . Bacterial contamination of nurses' uniforms: a study. Nursing Stand. 1998;13:37–42.
- , , . Bacterial flora on the white coats of medical students. J Hosp Infect. 2000;45:65–68.
- , , . Bacterial contamination of uniforms. J Hosp Infect. 2001;48:238–241.
- , , , et al. Significance of methicillin‐resistant Staphylococcus aureus (MRSA) survey in a university teaching hospital. J Infect Chemother. 2003;9:172–177.
- . Environmental contamination makes an important contribution to hospital infection. J Hosp Infect. 2007;65(suppl 2):50–54.
- , , , et al. Detection of methicillin‐resistant Staphylococcus aureus and vancomycin‐resistant enterococci on the gowns and gloves of healthcare workers. Infect Control Hosp Epidemiol. 2008;29:583–589.
- , , , , , . Bacterial contamination of health care workers' white coats. Am J Infect Control. 2009;37:101–105.
- , , , , , . Nursing and physician attire as possible source of nosocomial infections. Am J Infect Control. 2011;39:555–559.
- , , , , , . Newly cleaned physician uniforms and infrequently washed white coats have similar rates of bacterial contamination after an 8‐hour workday: a randomized controlled trial. J Hosp Med. 2011;6:177–182.
- , , , et al. Associations between bacterial contamination of health care workers' hands and contamination of white coats and scrubs. Am J Infect Control. 2012;40:e245–e248.
- Department of Health. Uniforms and workwear: an evidence base for developing local policy. National Health Service, 17 September 2007. Available at: http://www.dh.gov.uk/en/Publicationsandstatistics/Publications/Publicationspolicyandguidance/DH_078433. Accessed January 29, 2010.
- Scottish Government Health Directorates. NHS Scotland dress code. Available at: http://www.sehd.scot.nhs.uk/mels/CEL2008_53.pdf. Accessed February 10, 2010.
- Bio Shield Tech Web site. Bio Gardz–unisex scrub top–antimicrobial treatment. Available at: http://www.bioshieldtech.com/Bio_Gardz_Unisex_Scrub_Top_Antimicrobial_Tre_p/sbt01‐r‐p.htm. Accessed January 9, 2013.
- Doc Froc Web site and informational packet. Available at: http://www.docfroc.com. Accessed July 22, 2011.
- Vestagen Web site and informational packet. Available at: http://www.vestagen.com. Accessed July 22, 2011.
- Under Scrub apparel Web site. Testing. Available at: http://underscrub.com/testing. Accessed March 21, 2013.
- MediThreads Web site. Microban FAQ's. Available at: http://medithreads.com/faq/microban‐faqs. Accessed March 21, 2013.
- , , , , . Comparison of the Rodac imprint method to selective enrichment broth for recovery of vancomycin‐resistant enterococci and drug‐resistant Enterobacteriaceae from environmental surfaces. J Clin Microbiol. 2000;38:4646–4648.
- , , , , , . Research electronic data capture (REDCap)—a metadata‐driven methodology and workflow process for providing translational research informatics support. J Biomed Inform. 2009;42:377–381.
- , , , et al. A crossover trial of antimicrobial scrubs to reduce methicillin‐resistant Staphylococcus aureus burden on healthcare worker apparel. Infect Control Hosp Epidemiol. 2012;33:268–275.
- , , , , . Pilot study on the microbial contamination of conventional vs. silver‐impregnated uniforms worn by ambulance personnel during one week of emergency medical service. GMS Krankenhhyg Interdiszip. 2010;5.pii: Doc09.
- , , , et al. Epidemiology of Staphylococcus aureus blood and skin and soft tissue infections in the US military health system, 2005–2010. JAMA. 2012;308:50–59.
- , , , et al. Health care‐associated invasive MRSA infections, 2005–2008. JAMA. 2010;304:641–648.
© 2013 Society of Hospital Medicine
AUDIO EXCLUSIVE: Research, Innovation, and Clinical Vignette Competition Draws Rave Reviews
AUDIO EXCLUSIVE: Hospitalists Flock to HM13's Hands-On Medical Procedures Training
Click here to listen to Dr. Rosen.
Click here to listen to Dr. Rosen.
Click here to listen to Dr. Rosen.
New HIPAA requirements
I’m hearing a lot of concern about the impending changes in the Health Insurance Portability and Accountability Act (HIPAA) – which is understandable, since the Department of Health and Human Services has presented them as "the most sweeping ... since [the Act] was first implemented."
But after a careful perusal of the new rules – all 150 three-column pages of them – I can say with a modest degree of confidence that for most physicians, compliance will not be as challenging as some (such as those trying to sell you compliance-related materials) have warned.
However, you can’t simply ignore the new regulations; definitions will be more complex, security breaches more liberally defined, and potential penalties will be stiffer. Herewith the salient points:
• Business associates. The criteria for identifying "business associates" (BAs) remain the same: nonemployees, performing "functions or activities" on behalf of the "covered entity" (your practice), that involve "creating, receiving, maintaining, or transmitting" personal health information (PHI).
Typical BAs include answering and billing services, independent transcriptionists, hardware and software companies, and any other vendors involved in creating or maintaining your medical records. Practice management consultants, attorneys, companies that store or microfilm medical records, and record-shredding services are BAs if they must have direct access to PHI to do their jobs.
Mail carriers, package-delivery people, cleaning services, copier repairmen, bank employees, and the like are not considered BAs, even though they might conceivably come in contact with PHI on occasion. You are required to use "reasonable diligence" in limiting the PHI that these folks may encounter, but you do not need to enter into written BA agreements with them.
Independent contractors who work within your practice – aestheticians and physical therapists, for example – are not considered BAs either, and do not need to sign a BA agreement; just train them, as you do your employees. (I’ll have more on HIPAA and OSHA training in a future column.)
What is new is the additional onus placed on physicians for confidentiality breaches committed by their BAs. It’s not enough to simply have a BA contract. You are expected to use "reasonable diligence" in monitoring the work of your BAs. BAs and their subcontractors are directly responsible for their own actions, but the primary responsibility is ours. Let’s say that a contractor you hire to shred old medical records throws them into a trash bin instead; under the new rules, you must assume the worst-case scenario. Previously, you would only have to notify affected patients (and the government) if there was a "significant risk of financial or reputational harm," but now, any incident involving patient records is assumed to be a breach, and must be reported. Failure to do so could subject your practice, as well as the contractor, to significant fines – as high as $1 million in egregious cases.
• New patient rights. Patients will now be able to restrict the PHI shared with third-party insurers and health plans if they pay for the services themselves. They also have the right to request copies of their electronic health records, and you can bill the actual costs of responding to such a request. If you have EHR, now might be a good time to work out a system for doing this, because the response time has been decreased from 90 to 30 days – even less in some states.
• Marketing limitations. The new rule prohibits third-party-funded marketing to patients for products and services without their prior written authorization. You do not need prior authorization to market your own products and services, even when the communication is funded by a third party, but if there is any such funding, you will need to disclose it.
• Notice of privacy practices (NPP). You will need to revise your NPP to explain your relationships with BAs, and their status under the new rules. You will need to explain the breach notification process, too, as well as the new patient rights mentioned above. You must post your revised NPP in your office, and make copies available there, but you need not mail a copy to every patient.
• Get on it. The rules specify Sept. 23 as the effective date for the new regulations, although you have a year beyond that to revise your existing BA agreements. Extensions are possible, even likely.
Dr. Eastern practices dermatology and dermatologic surgery in Belleville, N.J.

Concussion recovery takes longer if children have had one before
Children and teenagers take longer to recover from a concussion if they’ve had one before, especially within the past year, Boston Children’s Hospital emergency department physicians found in a study of 280 of their concussed patients published June 10 in Pediatrics.
The median duration of symptoms, assessed by the serial Rivermead Post-Concussion Symptoms Questionnaire (RPSQ) over a period of 3 months, climbed from 12 days in patients who hadn’t been concussed before to 24 days in those who had. The median symptom duration was 28 days in patients with multiple previous concussions, and 35 days in those who’d been concussed within the previous year, "nearly three times the median duration [for] those who had no previous concussions," according to Dr. Matthew A. Eisenberg and his associates at the hospital (Pediatrics 2013 [doi:10.1542/peds.2013-0432]).
"Similarly, patients with two or more previous concussions had more than double the median symptom duration [of] patients with zero or one previous concussion," they found.
On multivariate analysis, previous concussion, maintaining consciousness, being 13 years or older, and an initial RPSQ of 18 or higher all predicted prolonged recovery. Among all comers, 77% had symptoms at 1 week, 32% at 4 weeks, and 15% at 3 months. The mean age in the trial was 14.3 years (range, 11-22 years).
The findings were statistically significant and have "direct implications on the management of athletes and other at-risk individuals who sustain concussions, supporting the concept that sufficient time to recover from a concussion may improve long-term outcomes," the investigators said.
"However, we did not find an association between physician-advised cognitive or physical rest and duration of symptoms, which may reflect the limitations of our observational study," they added. "A randomized [controlled] trial will likely be necessary to address the utility of this intervention."
Sixty-six percent of the subjects were enrolled the day they were injured; 24.7% were enrolled 1 day later, 7.2% 2 days later, and 1.7% 3 days later. The majority (63.8%) had been injured playing hockey, soccer, football, basketball or some other sport.
The investigators defined concussion broadly to include either altered mental status following blunt head trauma or, within 4 hours of it, any of the following symptoms that were not present before the injury: headache, nausea, vomiting, dizziness/balance problems, fatigue, drowsiness, blurred vision, memory difficulty, or trouble concentrating.
The most common symptoms in the study were headache (85.1%), fatigue (64.7%), and dizziness (63.0%); 4.3% of subjects had altered gait or balance, and 2.4% had altered mental status. There were no abnormalities in the 20.8% of kids who got neuroimaging.
On discharge, 65.9% were prescribed a period of cognitive rest and 92.4% were told to take time off from sports; 63.8% were also told to follow up with their primary care doctor, 45.5% with a sports concussion clinic, and 6.2% with a specialist.
In contrast to prior studies, loss of consciousness seemed to protect against a prolonged recovery (HR, 0.648; P = .02). Maybe the 22% of kids who got knocked out were more likely to follow their doctors’ advice to rest, "thus speeding recovery from their injury. We cannot, however, eliminate the possibility that there is a biological basis to this finding," the team noted.
Subjects who were 13 years or older might have taken longer to recover (HR, 1.404; P = .04) because games "between older children involve more contact and higher-force impacts," although neurobiologic differences between older and younger kids might have played a role, as well, the investigators said.
"Female patients" – about 43% of the study total – "had more severe symptoms at presentation in our study (mean initial RPSQ of 21.3 vs. 17.0 in male patients, P = .02). ... Whether this finding is indicative of the fact that female patients have more severe symptoms from concussion in general, as suggested in several previous studies, or is due to referral bias in which female individuals preferentially present to the ED when symptoms are more severe ... cannot be ascertained from our data," they noted.
Female gender fell out on multivariate analysis as a predictor of prolonged recovery (HR, 1.294; P= 0.11).
The investigators said they had no relevant financial disclosures.
This study is "incredibly interesting. It’s amazing to think that as recently as 5-7 years ago, people were still operating under the advice that 90% of concussion patients get better within a week. You can still find that online every now and then. But clearly, whether they’ve had multiple concussions or not, recovery time is longer for teens and preteens than anyone has expected in the past. This backs up what I see in the clinic," said Dr. Kevin Walter.
So, if kids come to the office a week or 2 after a concussion and say they’re all better, they are "going to be the exception to the rule." More likely, they are not being honest with themselves or are a bit too eager to get back into the game or classroom, he said.
"You don’t want to let the athlete make the decision on their own that they’re better. [Sometimes] ERs [still] send them out saying that ‘if you still feel bad in a week, then go get seen. Otherwise, get back into sport[s],’ " he said.
Follow-up is critical to prevent that from happening. "The gold standard is moving towards multidisciplinary care with physicians and neuropsychologists, with the input of a school athletic trainer. [In my clinic,] the luxury of having a neuropsychologist is wonderful; they’ve got the cognitive function testing" to uncover subtle problems, "and they’ve got more time [to work with patients] and expertise on how to deliver the tests appropriately," Dr. Walter said.
No matter how hard it is for young patients to power down for a bit, "we know without a doubt that kids need some degree of cognitive rest and physical rest from activity and sports" after a concussion. It’s troubling in the study "that only 92% of people who had a concussion were told to refrain from athletics. That should be 100%; that’s the goal we need to shoot for," he said.
For now, it’s unclear if there’s a gap between when kids feel better and when they are truly physiologically recovered, and if they are especially vulnerable to another concussion in between. Also, although it’s been recognized before that kid concussions are different than ones in adults, what exactly that means for treatment is uncertain at this point.
Even so, "for most kids, we need to move a little bit more slowly" than in the past, he said.
Dr. Walter is an associate professor in the departments of orthopedic surgery and pediatrics at the Medical College of Wisconsin in Milwaukee, cofounder of the college’s Sports Concussion Program, and a member of the Institute of Medicine’s Committee on Sports-Related Concussions in Youth. He was lead author of the American Academy of Pediatrics’ clinical report "Sport-Related Concussion in Children and Adolescents."
Children and teenagers take longer to recover from a concussion if they’ve had one before, especially within the past year, Boston Children’s Hospital emergency department physicians found in a study of 280 of their concussed patients published June 10 in Pediatrics.
The median duration of symptoms, assessed by the serial Rivermead Post-Concussion Symptoms Questionnaire (RPSQ) over a period of 3 months, climbed from 12 days in patients who hadn’t been concussed before to 24 days in those who had. The median symptom duration was 28 days in patients with multiple previous concussions, and 35 days in those who’d been concussed within the previous year, "nearly three times the median duration [for] those who had no previous concussions," according to Dr. Matthew A. Eisenberg and his associates at the hospital (Pediatrics 2013 [doi:10.1542/peds.2013-0432]).
"Similarly, patients with two or more previous concussions had more than double the median symptom duration [of] patients with zero or one previous concussion," they found.
On multivariate analysis, previous concussion, maintaining consciousness, being 13 years or older, and an initial RPSQ of 18 or higher all predicted prolonged recovery. Among all comers, 77% had symptoms at 1 week, 32% at 4 weeks, and 15% at 3 months. The mean age in the trial was 14.3 years (range, 11-22 years).
The findings were statistically significant and have "direct implications on the management of athletes and other at-risk individuals who sustain concussions, supporting the concept that sufficient time to recover from a concussion may improve long-term outcomes," the investigators said.
"However, we did not find an association between physician-advised cognitive or physical rest and duration of symptoms, which may reflect the limitations of our observational study," they added. "A randomized [controlled] trial will likely be necessary to address the utility of this intervention."
Sixty-six percent of the subjects were enrolled the day they were injured; 24.7% were enrolled 1 day later, 7.2% 2 days later, and 1.7% 3 days later. The majority (63.8%) had been injured playing hockey, soccer, football, basketball or some other sport.
The investigators defined concussion broadly to include either altered mental status following blunt head trauma or, within 4 hours of it, any of the following symptoms that were not present before the injury: headache, nausea, vomiting, dizziness/balance problems, fatigue, drowsiness, blurred vision, memory difficulty, or trouble concentrating.
The most common symptoms in the study were headache (85.1%), fatigue (64.7%), and dizziness (63.0%); 4.3% of subjects had altered gait or balance, and 2.4% had altered mental status. There were no abnormalities in the 20.8% of kids who got neuroimaging.
On discharge, 65.9% were prescribed a period of cognitive rest and 92.4% were told to take time off from sports; 63.8% were also told to follow up with their primary care doctor, 45.5% with a sports concussion clinic, and 6.2% with a specialist.
In contrast to prior studies, loss of consciousness seemed to protect against a prolonged recovery (HR, 0.648; P = .02). Maybe the 22% of kids who got knocked out were more likely to follow their doctors’ advice to rest, "thus speeding recovery from their injury. We cannot, however, eliminate the possibility that there is a biological basis to this finding," the team noted.
Subjects who were 13 years or older might have taken longer to recover (HR, 1.404; P = .04) because games "between older children involve more contact and higher-force impacts," although neurobiologic differences between older and younger kids might have played a role, as well, the investigators said.
"Female patients" – about 43% of the study total – "had more severe symptoms at presentation in our study (mean initial RPSQ of 21.3 vs. 17.0 in male patients, P = .02). ... Whether this finding is indicative of the fact that female patients have more severe symptoms from concussion in general, as suggested in several previous studies, or is due to referral bias in which female individuals preferentially present to the ED when symptoms are more severe ... cannot be ascertained from our data," they noted.
Female gender fell out on multivariate analysis as a predictor of prolonged recovery (HR, 1.294; P= 0.11).
The investigators said they had no relevant financial disclosures.
FROM PEDIATRICS
Major finding: The median duration of concussion symptoms was 12 days in children and teens who hadn’t been concussed before, 24 days in those who had, and 35 days in those who had been concussed within the previous year.
Data source: A prospective cohort study of 280 concussed patients aged 11-22 years.
Disclosures: The study was funded by Boston Children’s Hospital, where it was conducted. The investigators said they had no relevant financial disclosures.
Simeprevir keeps HCV at bay in treatment-naive and experienced patients
ORLANDO – The investigational protease inhibitor simeprevir was associated with high levels of sustained virologic response in patients with both treatment-naive and relapsed hepatitis C viral infections, reported investigators at the annual Digestive Disease Week.
In the QUEST-2 phase III trial, 81.3% of previously untreated patients with hepatitis C (HCV) genotype 1 infections randomized to simeprevir (TMC435) and pegylated interferon-alfa (pegIFN/RBV) had a sustained virologic response following 12 weeks of therapy (SVR12, the primary endpoint), compared with 50% of those assigned to pegIFN/RBV and placebo (P less than .001), reported Dr. Fred Poordad from the University of Texas Health Science Center in San Antonio.

In the phase III PROMISE trial, 79.2% of patients with HCV genotype 1 infections who had a relapse following prior therapy with an interferon-based regimen had an SVR12 when treated with simeprevir, compared with 36.8% of patients treated with pegIFN/RBV and placebo (P less than .001), said Dr. Eric Lawitz, also from the University of Texas in San Antonio.
"Safety and tolerability appear to be comparable to placebo, and patient-reported outcomes support both the efficacy and the safety profiles of simeprevir," Dr. Poordad said.
QUEST-2
Simeprevir is a once-daily oral inhibitor of the HCV NS3/4A protease with demonstrated antiviral activity against HCV genotypes 1, 2, 4, 5, and 6.
In QUEST-2, 391 patients were randomized on a 2:1 basis to receive either simeprevir 150 mg daily plus pegIFN/RBV or placebo plus pegIFN/RBV for 12 weeks, followed by an additional 12 or 36 weeks of pegIFN/RBV depending on response-guided therapy criteria. If patients had HCV RNA less than 25 IU/mL at week 4 and undetectable at week 12, they received an additional 12 weeks of pegIFN/RBV. Patients outside of the response-guided criteria received a total of 36 additional weeks of pegIFN/RBV. In both treatment arms, patients were followed for an additional 24 months, for a total of 72 months.
A total of 235 of the 257 patients assigned to simeprevir (91.4%) met the response-guided criteria by week 24, completed therapy, and were then followed until study end. Of this group, 86% (202 patients) achieved SVR12.
Simeprevir was statistically significantly superior to placebo regardless of IL28B polymorphism genotype or METAVIR (fibrosis and inflammation) scores.
On-treatment failures, defined as a confirmed detectable HCV RNA level at the actual end of treatment, occurred in 7% of patients on simeprevir and 32.1% of controls. Relapses, defined as detectable HCV RNA on one or more follow-up visits following undetectable end-of-treatment levels, occurred in 12.7% and 23.9%, respectively (P values not shown).
Of the simeprevir-treated patients who did not achieve an SVR, 97.6% had emerging mutations in the NS3 protease domain at the time of treatment failure, Dr. Poordad said.
PROMISE
In the PROMISE trial, 393 patients who had experienced a relapse following interferon-based therapy were randomized to response guided therapy as described in the QUEST-2 study.
As noted before, 79.2% of patients assigned to simeprevir/pegIFN/RBV met the primary endpoint of SVR12, compared with 36.8% of patients assigned to placebo/pegIFN/RBV (P less than .001).

In this trial, simeprevir was significantly better than placebo in patients with both HCV genotypes 1a and 1b, and as in QUEST-2 was superior to placebo regardless of IL28B genotype or METAVIR score.
On-treatment failures occurred in 3.1% of simeprevir-treated patients and 27.1% of those on placebo and pegIFN/RBV. The respective relapse rates were 18.5% and 48.4%. As in QUEST-2, the large majority (92.3%) of simeprevir-treated patients who did not have an SVR had emerging mutations in the NS3 protease domain.
Safety
In QUEST-2, patients on simeprevir had more cases of rash, 27% vs. 20%, and photosensitivity, 4% vs. 1%. Anemia occurred in 13.6% and 15.7%, respectively. The incidences of other adverse events were similar between the groups.
In PROMISE, the most common adverse events were fatigue, influenzalike illness, pruritus, and headache. Anemia occurred in 17% of patients on the active drug plus pegIFN/RBV, compared with 20% for those on placebo/pegIFN/RBV. Neutropenia occurred in 18% and 22%, respectively. Rates of pruritus and rash were comparable between simeprevir and placebo.
The Food and Drug Administration has granted priority review status to simeprevir for the treatment of chronic HCV genotype 1.
The studies were funded by Janssen. Dr. Poordad and Dr. Lawitz have received grants and/or research support from the company, and several of their coauthors are employees of Janssen or its parent company Johnson & Johnson.
ORLANDO – The investigational protease inhibitor simeprevir was associated with high levels of sustained virologic response in patients with both treatment-naive and relapsed hepatitis C viral infections, reported investigators at the annual Digestive Disease Week.
In the QUEST-2 phase III trial, 81.3% of previously untreated patients with hepatitis C (HCV) genotype 1 infections randomized to simeprevir (TMC435) and pegylated interferon-alfa (pegIFN/RBV) had a sustained virologic response following 12 weeks of therapy (SVR12, the primary endpoint), compared with 50% of those assigned to pegIFN/RBV and placebo (P less than .001), reported Dr. Fred Poordad from the University of Texas Health Science Center in San Antonio.
In the phase III PROMISE trial, 79.2% of patients with HCV genotype 1 infections who had a relapse following prior therapy with an interferon-based regimen had an SVR12 when treated with simeprevir, compared with 36.8% of patients treated with pegIFN/RBV and placebo (P less than .001), said Dr. Eric Lawitz, also from the University of Texas in San Antonio.
"Safety and tolerability appear to be comparable to placebo, and patient-reported outcomes support both the efficacy and the safety profiles of simeprevir," Dr. Poordad said.
QUEST-2
Simeprevir is a once-daily oral inhibitor of the HCV NS3/4A protease with demonstrated antiviral activity against HCV genotypes 1, 2, 4, 5, and 6.
In QUEST-2, 391 patients were randomized on a 2:1 basis to receive either simeprevir 150 mg daily plus pegIFN/RBV or placebo plus pegIFN/RBV for 12 weeks, followed by an additional 12 or 36 weeks of pegIFN/RBV depending on response-guided therapy criteria. If patients had HCV RNA less than 25 IU/mL at week 4 and undetectable at week 12, they received an additional 12 weeks of pegIFN/RBV. Patients outside of the response-guided criteria received a total of 36 additional weeks of pegIFN/RBV. In both treatment arms, patients were followed for an additional 24 months, for a total of 72 months.
A total of 235 of the 257 patients assigned to simeprevir (91.4%) met the response-guided criteria by week 24, completed therapy, and were then followed until study end. Of this group, 86% (202 patients) achieved SVR12.
Simeprevir was statistically significantly superior to placebo regardless of IL28B polymorphism genotype or METAVIR (fibrosis and inflammation) scores.
On-treatment failures, defined as a confirmed detectable HCV RNA level at the actual end of treatment, occurred in 7% of patients on simeprevir and 32.1% of controls. Relapses, defined as detectable HCV RNA on one or more follow-up visits following undetectable end-of-treatment levels, occurred in 12.7% and 23.9%, respectively (P values not shown).
Of the simeprevir-treated patients who did not achieve an SVR, 97.6% had emerging mutations in the NS3 protease domain at the time of treatment failure, Dr. Poordad said.
PROMISE
In the PROMISE trial, 393 patients who had experienced a relapse following interferon-based therapy were randomized to response guided therapy as described in the QUEST-2 study.
As noted before, 79.2% of patients assigned to simeprevir/pegIFN/RBV met the primary endpoint of SVR12, compared with 36.8% of patients assigned to placebo/pegIFN/RBV (P less than .001).
In this trial, simeprevir was significantly better than placebo in patients with both HCV genotypes 1a and 1b, and as in QUEST-2 was superior to placebo regardless of IL28B genotype or METAVIR score.
On-treatment failures occurred in 3.1% of simeprevir-treated patients and 27.1% of those on placebo and pegIFN/RBV. The respective relapse rates were 18.5% and 48.4%. As in QUEST-2, the large majority (92.3%) of simeprevir-treated patients who did not have an SVR had emerging mutations in the NS3 protease domain.
Safety
In QUEST-2, patients on simeprevir had more cases of rash, 27% vs. 20%, and photosensitivity, 4% vs. 1%. Anemia occurred in 13.6% and 15.7%, respectively. The incidences of other adverse events were similar between the groups.
In PROMISE, the most common adverse events were fatigue, influenzalike illness, pruritus, and headache. Anemia occurred in 17% of patients on the active drug plus pegIFN/RBV, compared with 20% for those on placebo/pegIFN/RBV. Neutropenia occurred in 18% and 22%, respectively. Rates of pruritus and rash were comparable between simeprevir and placebo.
The Food and Drug Administration has granted priority review status to simeprevir for the treatment of chronic HCV genotype 1.
The studies were funded by Janssen. Dr. Poordad and Dr. Lawitz have received grants and/or research support from the company, and several of their coauthors are employees of Janssen or its parent company Johnson & Johnson.
AT DDW 2013
Major finding: SVR 12 rates were 81.3% in treatment-naive patients with HCV genotype 1 treated with simeprevir/pegylated interferon/ribavirin, and 79.2% in relapsed patients, compared with 50% and 36.8% of patients treated with placebo and pegIFN/RBV.
Data source: Two randomized, controlled phase III studies involving 391 treatment-naive patients (QUEST-2), and 393 patients who had a relapse following prior interferon-based therapy (PROMISE).
Disclosures: The studies were funded by Janssen. Dr. Poordad and Dr. Lawitz have received grants and/or research support from the company, and several of their coauthors are employees of Janssen or its parent company Johnson & Johnson.

AMDEs in Children
Children with complex chronic conditions comprise an increasing proportion of hospital admissions, readmissions, and resource use.[1, 2, 3] Dependence on technology or medical devices is a frequent characteristic of children in this group.[4] Adverse medical device events (AMDEs) are estimated to occur in as many as 8% of all adult admissions, depending on the methods used to identify them.[5] These events may result in hospitalizations or complicate hospital stays. To date, however, the burden of AMDEs among hospitalized children is little described, even though children may be at increased risk for device events as compared to adults.[6] Although some medical devices are intended solely or primarily for use with children, most devices used with children have been initially developed for, tested with, and most frequently employed to treat adults.[6] Assessing the continued safety and effectiveness of medical devices marketed in the Unites States is the responsibility of the Center for Devices and Radiologic Health of the US Food and Drug Administration (FDA). Its existing mechanisms for postmarket device surveillance rely primarily on passive reporting systems and specific observational studies.[7]
The objective of this study was to utilize administrative data from children's hospitals to explore the prevalence and nature of AMDEs in tertiary care children's hospitals that treat significant numbers of children with complex needs requiring medical devices.
METHODS
Data were obtained from the Pediatric Health Information System (PHIS), an administrative database containing inpatient data from 44 not‐for‐profit, tertiary care, pediatric hospitals affiliated with the Children's Hospital Association. Data are deidentified at the time of submission, and are subjected to a number of reliability and validity checks.[8] Individual admission records have both a deidentified visit identification (ID) and patient ID, allowing for linkage of multiple admissions by the same patient.
AMDEs were defined by International Classification of Diseases, Ninth Revision (ICD‐9) codes, using a methodology developed by Samore et al., who identified a set of such codes that specified devices in their definitions and therefore were considered to have a high likelihood of indicating a device problem (see Supporting Information, Table S1, in the online version of this article).[5] The diagnosis codes were grouped into device categories (eg, nervous system, orthopedic, cardiac).
From the 44 hospitals, the primary study cohort consisted of any patient with an admission between January 1, 2004 and December 31, 2011 with 1 AMDE ICD‐9 code as a primary or secondary diagnosis.
Descriptive statistics for patient demographics and visit characteristics of AMDE admissions were generated and stratified by device category. We reported these as counts and percentages for categorical variables and as median and interquartile range for length of stay. We also reported on how frequently patients with AMDEs have a top 10 most common diagnosis and top 10 most common procedure during the AMDE admission. We also reported the presence or absence of a complex chronic condition.[9] We generated the list of most common principal diagnoses and procedures by a separate query of PHIS from 2004 to 2009. Our top 10 most common diagnoses included ICD‐9 codes 486 (pneumonia), 466.11 (acute bronchiolitis due to respiratory syncytial virus), V58.11 (chemotherapy encounter), 493.92 (asthma exacerbation), 493.91 (asthma with status asthmaticus), 466.19 (acute bronchiolitis due to other organism), 780.39 (other convulsions), 540.9 (acute appendicitis), 282.62 (sickle cell disease with crisis), and 276.51 (dehydration). Our top 10 most common procedures included ICD‐9 codes 38.93 (venous catheterization), 03.31 (spinal tap), 99.04 (packed blood cell transfusion), 99.15 (parenteral nutrition), 99.25 (cancer chemotherapy), 96.71 (invasive mechanical ventilation, <96 hours), 96.04 (endotracheal intubation), 96.72 (invasive mechanical ventilation,95 hours), 96.6 (enteral nutrition), and 99.05 (platelet transfusion). Analyses were performed using SAS Enterprise Guide version 4.2 for Windows (SAS Institute, Cary, NC).
This study was approved by Cincinnati Children's Hospital Medical Center Institutional Review Board.
RESULTS
Of the 4,115,755 admissions during the study period, 136,465 (3.3%) had at least 1 AMDE. Over our study period, AMDEs were associated with a mean 17,058 inpatient stays annually. The number of AMDE‐related admissions decreased the last 4 years of our study period despite generally increasing admissions at PHIS hospitals (Figure 1). For 55% of the admissions (75,206/136,465), this AMDE code represented the primary diagnosis. Of these visits with a primary AMDE diagnosis, 39,874 (53%) were related to nervous system devices. The visits associated with AMDEs were comprised of 88,908 unique patients, 55% of whom were male (Table 1). The median age on admission was 6 years, and the interquartile range was 1 to 14 years of age.
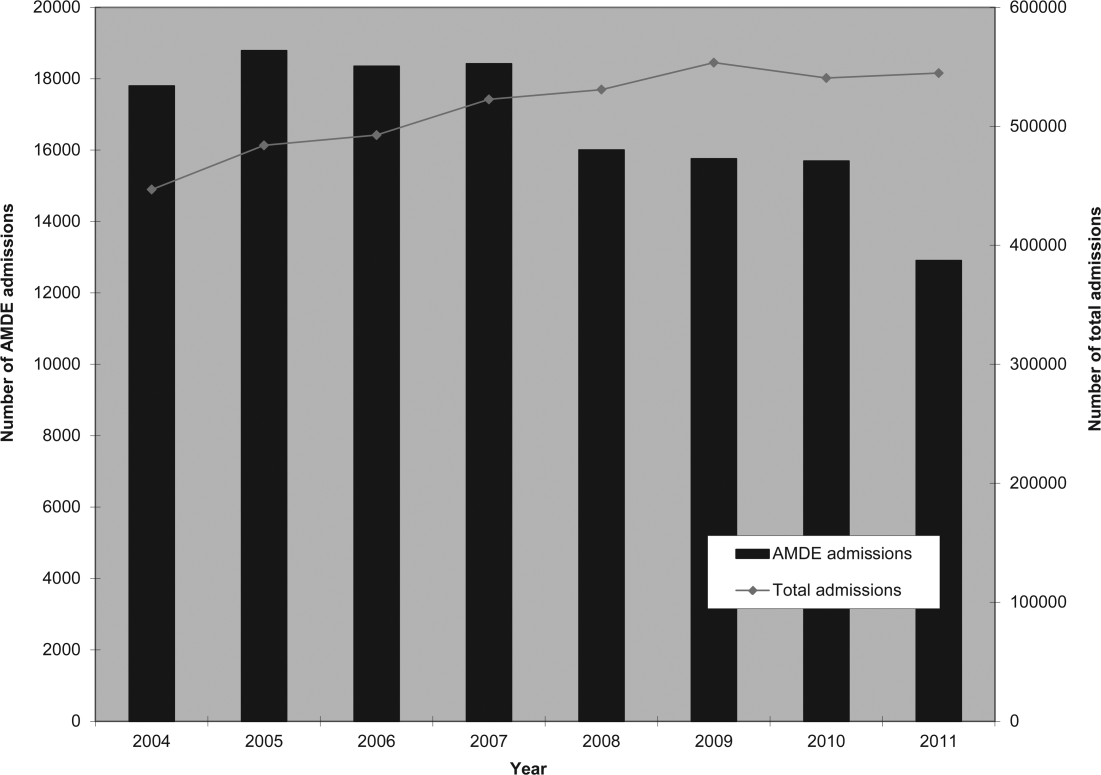
| Total, N=88,908 | |
|---|---|
| Age at first admission | |
| 2 years | 35,160 (40.0%) |
| 35 years | 9,352 (10.5%) |
| 611 years | 16,148 (18.2%) |
| 1218 years | 22,483 (25.3%) |
| 19 years | 5,765 (6.5%) |
| Gender | |
| Male | 49,172 (55.3%) |
| Female | 39,730 (44.7%) |
| Race | |
| White | 59,842 (67.3%) |
| Black | 14,747 (16.6%) |
| Asian | 1,910 (2.2%) |
| American Indian | 900 (1.0%) |
| Other | 8,732 (9.8%) |
| Missing | 2,777 (3.1%) |
| Number of admissions by patient | |
| 1 | 66,814 (75.1%) |
| 2 | 12,520 (14.1%) |
| 3 | 4,504 (5.1%) |
| 4 | 5,071 (5.7%) |
Among admissions with AMDEs, 2.9% ended in death. The mortality was 0.5% when an AMDE was the primary diagnosis and 5.7% when the AMDE was a secondary diagnosis. The median length of inpatient stays was 6 days, with an interquartile range of 2 to 17 days.
Vascular access AMDEs were the most common event associated with admissions (26.6%), followed by nervous system devices (17.8%) (Table 2). The majority (75.5%) of patients admitted with AMDEs had a complex chronic condition. Less than half (46.8%) of AMDE admissions had an associated code for 1 of the 10 most common principal procedures. A minority (14.3%) of admissions had an associated ICD‐9 code for 1 of the top 10 most common principal diagnoses.
| Device Category | Admissions, n=136,465 | Presence of Top 10 Most Common Principal Procedures, n=63,801 | Presence of Top 10 Most Common Principal Diagnoses, n=19,472 | Presence of 1 Complex Chronic Condition, n=103,003 |
|---|---|---|---|---|
| ||||
| Only 1 AMDE diagnosis | ||||
| Vascular access | 36,257 (26.6%) | 26,658 (41.8%) | 6,518 (33.5%) | 26,022 (25.3%) |
| Nervous system | 24,243 (17.8%) | 4,266 (6.7%) | 3,567 (18.3%) | 21,516 (20.9%) |
| Unspecified device | 21,222 (15.6%) | 11,368 (17.8%) | 2,512 (12.9%) | 13,826 (13.4%) |
| Cardiac | 4,384 (3.2%) | 1,959 (3.1%) | 309 (1.6%) | 3,962 (3.8%) |
| Orthopedic | 3,064 (2.2%) | 874 (1.4%) | 179 (0.9%) | 1,235 (1.2%) |
| Dialysis | 2,426 (1.8%) | 836 (1.3%) | 281 (1.4%) | 1,462 (1.4%) |
| Genitourinary | 1,165 (0.9%) | 388 (0.6%) | 166 (0.9%) | 668 (0.6%) |
| Prosthetic cardiac valve | 518 (0.4%) | 236 (0.4%) | 33 (0.2%) | 411 (0.4%) |
| Urologic catheters | 379 (0.3%) | 228 (0.4%) | 93 (0.5%) | 223 (0.2%) |
| Defibrillator | 197 (0.1%) | 11 (0.02%) | 4 (0.02%) | 18 (0.02%) |
| Ocular | 3 (0.002%) | 1 (0.002%) | 1 (0.005%) | 1 (0.001%) |
| Only 1 AMDE diagnosis subtotal | 93,861 (68.8%) | 46,825 (73.4%) | 13,663 (70.2%) | 69,344 (67.3%) |
| 2 AMDE diagnoses | 39,557 (29.0%) | 15,003 (23.5%) | 5,312 (27.3%) | 31,091 (30.2%) |
| >2 AMDE diagnoses | 3,047 (2.2%) | 1,973 (3.1%) | 497 (2.6%) | 2,568 (2.5%) |
DISCUSSION
To our knowledge, our study is the first to report the burden of AMDEs among children requiring hospitalization. AMDEs are common in this population of children cared for at tertiary care children's hospitals, accounting for or complicating 3.3% of inpatient stays in these 44 hospitals. AMDEs were associated with a mean of >17,000 total visits per year. Vascular access devices and nervous system devices were the most common device categories linked to AMDEs. Similar to published literature, we found that the youngest children accounted for the highest proportion of AMDEs.[10, 11]
The majority (>75%) of children with an AMDE admission had diagnoses indicating complex chronic conditions during the admission. Over a partially overlapping study period, Feudtner and colleagues found 25.2% of patients admitted to PHIS hospitals had complex chronic conditions.[12] This finding, combined with the uncommon association of the most prevalent diagnoses and procedures, suggests that the burden of AMDEs falls disproportionately on this population of children. Death occurred considerably less commonly when AMDE diagnosis was the primary versus a secondary diagnosis (0.5% vs 5.7%). This finding likely illustrates 2 distinct populations: children with an AMDE that causes admission who have a relatively low risk of mortality and a second group who have AMDE‐complicated hospitalizations that may have an already high risk of mortality.
Our findings complement those of Wang and colleagues who employed the National Electronic Injury Surveillance System All Injury Program database to provide national estimates of medical device‐associated adverse events.[11] Importantly, this group used a different population (patients presenting to the emergency department) and a different methodology. These authors reported on device‐associated events, as they did not collect information to discriminate the device's role in the event. A walker that malfunctioned leading to patient injury would be a device‐related event; however, a patient who has a walker suffering a fall would be device‐associated, even if the walker's role in the injury was uncertain. We believe our methodology, established by Samore et al., more accurately identifies device‐related events.[5] Wang et al. found that 6.3% of pediatric patients who presented to emergency departments with medical device‐associated events were admitted to the hospital.[11] This resulted in national estimates of 9,082 events with 95% confidence intervals of 2,990 to 25,373 hospitalizations. Our findings of >17,000 AMDE‐related inpatient stays per annum included not only AMDEs leading to admissions but also those that were complications during stays.
Our study has several limitations, most related to the possibility of misclassification present in administrative data. Our approach only captured events that led to or complicated admissions. We suspect that ICD‐9 codes likely missed some AMDEs and that our estimates may therefore under‐represent this problem in our population. Future studies should compare our methodology, which has produced the first across‐center estimates of AMDE admissions, to alternative event capture techniques. We were unable to determine which events were present on admission and which complicated hospital stays, and it is likely that differing interventions would be required to reduce these 2 types of AMDEs. Another important limitation is that the PHIS database, comprised of data on children receiving care at tertiary academic medical centers with large numbers of pediatric subspecialists, is not representative of the population of children overall. The individual ICD‐9 codes for AMDEs are sufficiently nonspecific to limit the ability to characterize device events from administrative data alone. The high prevalence of unspecified device‐related admissions is an additional limitation. Although the estimates of these types of AMDEs are important in describing the frequency of these events, the unspecified category limits the ability to fully stratify based on device type and then implement monitoring strategies and interventions based on each.
To our knowledge, this study is the first multicenter analysis of the spectrum of pediatric AMDEs in hospitalized children. The AMDE prevalence is substantial, and the burden of these events largely falls on children with complex chronic conditions. Despite its limitations, this study complements recent efforts to enhance postmarket surveillance of pediatric devices including that of the FDA's Office of Pediatric Therapeutics, the recent FDA report Strengthening Our National System for Medical Device Postmarket Surveillance (
Our description of AMDEs by device category and patient characteristics is a first and necessary step to understanding the public health burden associated with device use in the pediatric population. Further developments in refined coding and device designation (eg, UDI systems) are needed to refine these estimates.
Acknowledgments
The authors thank Amy Liu, with the Data Management Center, and Colleen Mangeot, with the Biostatistical Consulting Unit in the Division of Epidemiology and Biostatistics, for their assistance with the data pull and creation of the analytic dataset. The authors also thank Lilliam Ambroggio, PhD, and Joshua Schaffzin, MD, PhD, for their thoughtful review of draft manuscripts.
Disclosures: Dr. Brady was supported by funds from the Bureau of Health Professions (BHPr), Health Resources and Services Administration (HRSA), and Department of Health and Human Services (DHHS) under grant T32 HP10027. This project was supported by cooperative agreement number U18 HS016957‐03 from the Agency for Healthcare Research and Quality. The content is solely the responsibility of the authors and does not necessarily represent the official views of the Agency for Healthcare Research and Quality. The study sponsors had no role in the study design; the collection, analysis, and interpretation of data; the writing of the report; or the decision to submit the article for publication. The opinions and assertions presented herein are the private views of the authors and are not to be construed as conveying either an official endorsement or criticism by the US Department of Health and Human Services, The Public Health Service, or the US Food and Drug Administration.
- , , , et al. Hospital utilization and characteristics of patients experiencing recurrent readmissions within children's hospitals. JAMA. 2011;305(7):682–690.
- , , , et al. Children with complex chronic conditions in inpatient hospital settings in the United States. Pediatrics. 2010;126(4):647–655.
- , , , , , . Increasing prevalence of medically complex children in US hospitals. Pediatrics. 2010;126(4):638–646.
- , , , et al. Children with medical complexity: an emerging population for clinical and research initiatives. Pediatrics. 2011;127(3):529–538.
- , , , et al. Surveillance of medical device‐related hazards and adverse events in hospitalized patients. JAMA. 2004;291(3):325–334.
- Institute of Medicine (U.S.). Committee on Postmarket Surveillance of Pediatric Medical Devices. , . Safe medical devices for children. Washington, DC: National Academies Press; 2006.
- , . Pharmacovigilance. 2nd ed. Chichester, England ; Hoboken, NJ: John Wiley 2007.
- , , , . Corticosteroids and mortality in children with bacterial meningitis. JAMA. 2008;299(17):2048–2055.
- , , . Pediatric deaths attributable to complex chronic conditions: a population‐based study of Washington State, 1980–1997. Pediatrics. 2000;106(1 pt 2):205–209.
- , , , et al. Infection rates following initial cerebrospinal fluid shunt placement across pediatric hospitals in the United States. Clinical article. J Neurosurg Pediatr. 2009;4(2):156–165.
- , , , et al. Emergency department visits for medical device‐associated adverse events among children. Pediatrics. 2010;126(2):247–259.
- , , , et al. How well can hospital readmission be predicted in a cohort of hospitalized children? A retrospective, multicenter study. Pediatrics. 2009;123(1):286–293.
- , . Unique device identification in the service of public health. N Engl J Med. 2012;367(17):1583–1585.
Children with complex chronic conditions comprise an increasing proportion of hospital admissions, readmissions, and resource use.[1, 2, 3] Dependence on technology or medical devices is a frequent characteristic of children in this group.[4] Adverse medical device events (AMDEs) are estimated to occur in as many as 8% of all adult admissions, depending on the methods used to identify them.[5] These events may result in hospitalizations or complicate hospital stays. To date, however, the burden of AMDEs among hospitalized children is little described, even though children may be at increased risk for device events as compared to adults.[6] Although some medical devices are intended solely or primarily for use with children, most devices used with children have been initially developed for, tested with, and most frequently employed to treat adults.[6] Assessing the continued safety and effectiveness of medical devices marketed in the Unites States is the responsibility of the Center for Devices and Radiologic Health of the US Food and Drug Administration (FDA). Its existing mechanisms for postmarket device surveillance rely primarily on passive reporting systems and specific observational studies.[7]
The objective of this study was to utilize administrative data from children's hospitals to explore the prevalence and nature of AMDEs in tertiary care children's hospitals that treat significant numbers of children with complex needs requiring medical devices.
METHODS
Data were obtained from the Pediatric Health Information System (PHIS), an administrative database containing inpatient data from 44 not‐for‐profit, tertiary care, pediatric hospitals affiliated with the Children's Hospital Association. Data are deidentified at the time of submission, and are subjected to a number of reliability and validity checks.[8] Individual admission records have both a deidentified visit identification (ID) and patient ID, allowing for linkage of multiple admissions by the same patient.
AMDEs were defined by International Classification of Diseases, Ninth Revision (ICD‐9) codes, using a methodology developed by Samore et al., who identified a set of such codes that specified devices in their definitions and therefore were considered to have a high likelihood of indicating a device problem (see Supporting Information, Table S1, in the online version of this article).[5] The diagnosis codes were grouped into device categories (eg, nervous system, orthopedic, cardiac).
From the 44 hospitals, the primary study cohort consisted of any patient with an admission between January 1, 2004 and December 31, 2011 with 1 AMDE ICD‐9 code as a primary or secondary diagnosis.
Descriptive statistics for patient demographics and visit characteristics of AMDE admissions were generated and stratified by device category. We reported these as counts and percentages for categorical variables and as median and interquartile range for length of stay. We also reported on how frequently patients with AMDEs have a top 10 most common diagnosis and top 10 most common procedure during the AMDE admission. We also reported the presence or absence of a complex chronic condition.[9] We generated the list of most common principal diagnoses and procedures by a separate query of PHIS from 2004 to 2009. Our top 10 most common diagnoses included ICD‐9 codes 486 (pneumonia), 466.11 (acute bronchiolitis due to respiratory syncytial virus), V58.11 (chemotherapy encounter), 493.92 (asthma exacerbation), 493.91 (asthma with status asthmaticus), 466.19 (acute bronchiolitis due to other organism), 780.39 (other convulsions), 540.9 (acute appendicitis), 282.62 (sickle cell disease with crisis), and 276.51 (dehydration). Our top 10 most common procedures included ICD‐9 codes 38.93 (venous catheterization), 03.31 (spinal tap), 99.04 (packed blood cell transfusion), 99.15 (parenteral nutrition), 99.25 (cancer chemotherapy), 96.71 (invasive mechanical ventilation, <96 hours), 96.04 (endotracheal intubation), 96.72 (invasive mechanical ventilation,95 hours), 96.6 (enteral nutrition), and 99.05 (platelet transfusion). Analyses were performed using SAS Enterprise Guide version 4.2 for Windows (SAS Institute, Cary, NC).
This study was approved by Cincinnati Children's Hospital Medical Center Institutional Review Board.
RESULTS
Of the 4,115,755 admissions during the study period, 136,465 (3.3%) had at least 1 AMDE. Over our study period, AMDEs were associated with a mean 17,058 inpatient stays annually. The number of AMDE‐related admissions decreased the last 4 years of our study period despite generally increasing admissions at PHIS hospitals (Figure 1). For 55% of the admissions (75,206/136,465), this AMDE code represented the primary diagnosis. Of these visits with a primary AMDE diagnosis, 39,874 (53%) were related to nervous system devices. The visits associated with AMDEs were comprised of 88,908 unique patients, 55% of whom were male (Table 1). The median age on admission was 6 years, and the interquartile range was 1 to 14 years of age.
| Total, N=88,908 | |
|---|---|
| Age at first admission | |
| 2 years | 35,160 (40.0%) |
| 35 years | 9,352 (10.5%) |
| 611 years | 16,148 (18.2%) |
| 1218 years | 22,483 (25.3%) |
| 19 years | 5,765 (6.5%) |
| Gender | |
| Male | 49,172 (55.3%) |
| Female | 39,730 (44.7%) |
| Race | |
| White | 59,842 (67.3%) |
| Black | 14,747 (16.6%) |
| Asian | 1,910 (2.2%) |
| American Indian | 900 (1.0%) |
| Other | 8,732 (9.8%) |
| Missing | 2,777 (3.1%) |
| Number of admissions by patient | |
| 1 | 66,814 (75.1%) |
| 2 | 12,520 (14.1%) |
| 3 | 4,504 (5.1%) |
| 4 | 5,071 (5.7%) |
Among admissions with AMDEs, 2.9% ended in death. The mortality was 0.5% when an AMDE was the primary diagnosis and 5.7% when the AMDE was a secondary diagnosis. The median length of inpatient stays was 6 days, with an interquartile range of 2 to 17 days.
Vascular access AMDEs were the most common event associated with admissions (26.6%), followed by nervous system devices (17.8%) (Table 2). The majority (75.5%) of patients admitted with AMDEs had a complex chronic condition. Less than half (46.8%) of AMDE admissions had an associated code for 1 of the 10 most common principal procedures. A minority (14.3%) of admissions had an associated ICD‐9 code for 1 of the top 10 most common principal diagnoses.
| Device Category | Admissions, n=136,465 | Presence of Top 10 Most Common Principal Procedures, n=63,801 | Presence of Top 10 Most Common Principal Diagnoses, n=19,472 | Presence of 1 Complex Chronic Condition, n=103,003 |
|---|---|---|---|---|
| ||||
| Only 1 AMDE diagnosis | ||||
| Vascular access | 36,257 (26.6%) | 26,658 (41.8%) | 6,518 (33.5%) | 26,022 (25.3%) |
| Nervous system | 24,243 (17.8%) | 4,266 (6.7%) | 3,567 (18.3%) | 21,516 (20.9%) |
| Unspecified device | 21,222 (15.6%) | 11,368 (17.8%) | 2,512 (12.9%) | 13,826 (13.4%) |
| Cardiac | 4,384 (3.2%) | 1,959 (3.1%) | 309 (1.6%) | 3,962 (3.8%) |
| Orthopedic | 3,064 (2.2%) | 874 (1.4%) | 179 (0.9%) | 1,235 (1.2%) |
| Dialysis | 2,426 (1.8%) | 836 (1.3%) | 281 (1.4%) | 1,462 (1.4%) |
| Genitourinary | 1,165 (0.9%) | 388 (0.6%) | 166 (0.9%) | 668 (0.6%) |
| Prosthetic cardiac valve | 518 (0.4%) | 236 (0.4%) | 33 (0.2%) | 411 (0.4%) |
| Urologic catheters | 379 (0.3%) | 228 (0.4%) | 93 (0.5%) | 223 (0.2%) |
| Defibrillator | 197 (0.1%) | 11 (0.02%) | 4 (0.02%) | 18 (0.02%) |
| Ocular | 3 (0.002%) | 1 (0.002%) | 1 (0.005%) | 1 (0.001%) |
| Only 1 AMDE diagnosis subtotal | 93,861 (68.8%) | 46,825 (73.4%) | 13,663 (70.2%) | 69,344 (67.3%) |
| 2 AMDE diagnoses | 39,557 (29.0%) | 15,003 (23.5%) | 5,312 (27.3%) | 31,091 (30.2%) |
| >2 AMDE diagnoses | 3,047 (2.2%) | 1,973 (3.1%) | 497 (2.6%) | 2,568 (2.5%) |
DISCUSSION
To our knowledge, our study is the first to report the burden of AMDEs among children requiring hospitalization. AMDEs are common in this population of children cared for at tertiary care children's hospitals, accounting for or complicating 3.3% of inpatient stays in these 44 hospitals. AMDEs were associated with a mean of >17,000 total visits per year. Vascular access devices and nervous system devices were the most common device categories linked to AMDEs. Similar to published literature, we found that the youngest children accounted for the highest proportion of AMDEs.[10, 11]
The majority (>75%) of children with an AMDE admission had diagnoses indicating complex chronic conditions during the admission. Over a partially overlapping study period, Feudtner and colleagues found 25.2% of patients admitted to PHIS hospitals had complex chronic conditions.[12] This finding, combined with the uncommon association of the most prevalent diagnoses and procedures, suggests that the burden of AMDEs falls disproportionately on this population of children. Death occurred considerably less commonly when AMDE diagnosis was the primary versus a secondary diagnosis (0.5% vs 5.7%). This finding likely illustrates 2 distinct populations: children with an AMDE that causes admission who have a relatively low risk of mortality and a second group who have AMDE‐complicated hospitalizations that may have an already high risk of mortality.
Our findings complement those of Wang and colleagues who employed the National Electronic Injury Surveillance System All Injury Program database to provide national estimates of medical device‐associated adverse events.[11] Importantly, this group used a different population (patients presenting to the emergency department) and a different methodology. These authors reported on device‐associated events, as they did not collect information to discriminate the device's role in the event. A walker that malfunctioned leading to patient injury would be a device‐related event; however, a patient who has a walker suffering a fall would be device‐associated, even if the walker's role in the injury was uncertain. We believe our methodology, established by Samore et al., more accurately identifies device‐related events.[5] Wang et al. found that 6.3% of pediatric patients who presented to emergency departments with medical device‐associated events were admitted to the hospital.[11] This resulted in national estimates of 9,082 events with 95% confidence intervals of 2,990 to 25,373 hospitalizations. Our findings of >17,000 AMDE‐related inpatient stays per annum included not only AMDEs leading to admissions but also those that were complications during stays.
Our study has several limitations, most related to the possibility of misclassification present in administrative data. Our approach only captured events that led to or complicated admissions. We suspect that ICD‐9 codes likely missed some AMDEs and that our estimates may therefore under‐represent this problem in our population. Future studies should compare our methodology, which has produced the first across‐center estimates of AMDE admissions, to alternative event capture techniques. We were unable to determine which events were present on admission and which complicated hospital stays, and it is likely that differing interventions would be required to reduce these 2 types of AMDEs. Another important limitation is that the PHIS database, comprised of data on children receiving care at tertiary academic medical centers with large numbers of pediatric subspecialists, is not representative of the population of children overall. The individual ICD‐9 codes for AMDEs are sufficiently nonspecific to limit the ability to characterize device events from administrative data alone. The high prevalence of unspecified device‐related admissions is an additional limitation. Although the estimates of these types of AMDEs are important in describing the frequency of these events, the unspecified category limits the ability to fully stratify based on device type and then implement monitoring strategies and interventions based on each.
To our knowledge, this study is the first multicenter analysis of the spectrum of pediatric AMDEs in hospitalized children. The AMDE prevalence is substantial, and the burden of these events largely falls on children with complex chronic conditions. Despite its limitations, this study complements recent efforts to enhance postmarket surveillance of pediatric devices including that of the FDA's Office of Pediatric Therapeutics, the recent FDA report Strengthening Our National System for Medical Device Postmarket Surveillance (
Our description of AMDEs by device category and patient characteristics is a first and necessary step to understanding the public health burden associated with device use in the pediatric population. Further developments in refined coding and device designation (eg, UDI systems) are needed to refine these estimates.
Acknowledgments
The authors thank Amy Liu, with the Data Management Center, and Colleen Mangeot, with the Biostatistical Consulting Unit in the Division of Epidemiology and Biostatistics, for their assistance with the data pull and creation of the analytic dataset. The authors also thank Lilliam Ambroggio, PhD, and Joshua Schaffzin, MD, PhD, for their thoughtful review of draft manuscripts.
Disclosures: Dr. Brady was supported by funds from the Bureau of Health Professions (BHPr), Health Resources and Services Administration (HRSA), and Department of Health and Human Services (DHHS) under grant T32 HP10027. This project was supported by cooperative agreement number U18 HS016957‐03 from the Agency for Healthcare Research and Quality. The content is solely the responsibility of the authors and does not necessarily represent the official views of the Agency for Healthcare Research and Quality. The study sponsors had no role in the study design; the collection, analysis, and interpretation of data; the writing of the report; or the decision to submit the article for publication. The opinions and assertions presented herein are the private views of the authors and are not to be construed as conveying either an official endorsement or criticism by the US Department of Health and Human Services, The Public Health Service, or the US Food and Drug Administration.
- , , , et al. Hospital utilization and characteristics of patients experiencing recurrent readmissions within children's hospitals. JAMA. 2011;305(7):682–690.
- , , , et al. Children with complex chronic conditions in inpatient hospital settings in the United States. Pediatrics. 2010;126(4):647–655.
- , , , , , . Increasing prevalence of medically complex children in US hospitals. Pediatrics. 2010;126(4):638–646.
- , , , et al. Children with medical complexity: an emerging population for clinical and research initiatives. Pediatrics. 2011;127(3):529–538.
- , , , et al. Surveillance of medical device‐related hazards and adverse events in hospitalized patients. JAMA. 2004;291(3):325–334.
- Institute of Medicine (U.S.). Committee on Postmarket Surveillance of Pediatric Medical Devices. , . Safe medical devices for children. Washington, DC: National Academies Press; 2006.
- , . Pharmacovigilance. 2nd ed. Chichester, England ; Hoboken, NJ: John Wiley 2007.
- , , , . Corticosteroids and mortality in children with bacterial meningitis. JAMA. 2008;299(17):2048–2055.
- , , . Pediatric deaths attributable to complex chronic conditions: a population‐based study of Washington State, 1980–1997. Pediatrics. 2000;106(1 pt 2):205–209.
- , , , et al. Infection rates following initial cerebrospinal fluid shunt placement across pediatric hospitals in the United States. Clinical article. J Neurosurg Pediatr. 2009;4(2):156–165.
- , , , et al. Emergency department visits for medical device‐associated adverse events among children. Pediatrics. 2010;126(2):247–259.
- , , , et al. How well can hospital readmission be predicted in a cohort of hospitalized children? A retrospective, multicenter study. Pediatrics. 2009;123(1):286–293.
- , . Unique device identification in the service of public health. N Engl J Med. 2012;367(17):1583–1585.

International travel - Focus on timely intervention
Many of your patients will head for international destinations this summer, where they may be exposed to infectious diseases and other health risks they normally do not encounter in the United States.
For the majority of patients, these exposures will be brief; however, several may be extended due to study abroad or parental job relocation. More and more adolescents also are traveling to resource-limited areas doing volunteer work or adventure travel, and many are residing with host families. Children with chronic diseases pose concerns directly related to their underlying conditions, susceptibility, and availability of medical care in the host country. While most international travel plans are made at least 3 months in advance, health precautions such as immunizations and preventive medication often are not considered as travel plans are being finalized. If you are lucky, your patients will have mentioned their plans to you prior to finalizing their trips. You may receive a call at the last minute for assistance in helping to prepare them for a safe and healthy journey.

The U.S. Office of Travel & Tourism reports that slightly more than 60 million Americans traveled outside of the United States in 2012, with 28.5 million of the final destinations being overseas. Children accounted for approximately 2.4 million travelers. While tourism was the most common reason for travel, children were more likely to be visiting friends and relatives (VFR). Studies have revealed significantly increased health risks among VFR travelers, who often stay in private homes and in less-developed areas, compared with vacationers or business travelers who are more likely to be staying in hotels and in urban areas (Pediatrics 2010;125:e1072-80).
Is it really necessary to seek pretravel advice? Some travelers are not convinced. To facilitate this discussion, I thought I would share a recent call.
You are informed via voicemail that a 3-year-old is traveling with his family to Madras, India, for 8 weeks. He is visiting relatives, and the family may visit rural areas. The accommodations are air conditioned and the family is departing in 5 days! They would like to schedule an appointment immediately. What can you do?
Vital information has already been provided. The destination, type of accommodations, activities, duration of stay, and that the patient is a VFR are all important details when making vaccine and other recommendations. First, determine if the child’s routine immunizations are up to date. Next, determine the potential exposures for this patient, and identify vaccine-preventable and nonpreventable diseases. If there is a travel medicine specialist in your area who also sees children, you can refer the patient. If one is not readily available or you prefer to manage the patient, a great resource is the Centers for Disease Control and Prevention Traveler's Health site.
Vaccine preventable diseases include hepatitis A, hepatitis B, Japanese encephalitis, polio, rabies, typhoid, and influenza. Nonvaccine preventable diseases include chikungunya and dengue fevers. Avian influenza, malaria, tuberculosis, and traveler’s diarrhea are also cause for concern.
If you determine the routine immunizations are up to date, remember that measles is still a concern in many countries, and current U.S. recommendations state that all children at least 12 months of age should have two doses prior to leaving the United States. Although routinely administered at 4 years of age, the second dose of MMR can be administered as early as 4 weeks after the first dose. Those aged 6-11 months should have one dose prior to leaving the country. The remaining two doses should be administered at the usual time. Therefore, a total of three doses will be required to complete the series. Since the immunizations are up to date, this patient will also be protected against hepatitis A and B in addition to polio. Hepatitis A is the most common vaccine preventable disease acquired by travelers.
Rabies is prevalent in India, and all animal bites should be taken seriously. Because the patient is in a major urban area, access to both rabies vaccine and immunoglobulin should not be a concern. Japanese encephalitis will be circulating (May-October), but is usually found in rural agricultural areas. Mosquito precautions utilizing DEET (30%) on exposed areas or Permethrine-containing sprays on clothes to repel mosquitoes and ticks should be emphasized if travel to rural areas occurs. Vaccines for rabies and Japanese encephalitis would not be recommended for this patient. If the itinerary were different, they may be considered. Ixiaro, an inactivated Japanese encephalitis (JE) vaccine was approved for use in children as young as 2 months of age in May 2013. Previously, it was approved for use only in those at least 17 years of age in the United States. Both rabies and JE require a minimum of 21 and 28 days, respectively, to complete, and JE should be completed at least 1 week prior to exposure.
Typhoid fever (enteric fever) occurs worldwide, with an estimated 22 million cases annually. In 2012, 343 cases were reported in the United States, most of which were in recent travelers. The risk for typhoid fever is highest for travelers to southern Asia (6-30 times higher) than for all other destinations (Centers for Disease Control and Prevention. CDC Health Information for International Travel 2012. New York: Oxford University Press; 2012). Two types of vaccine are available: an oral, live attenuated vaccine for those at least 6 years of age and an injectable polysaccharide vaccine for those at least 2 years of age. In this case there is only one option, the injectable vaccine. Ideally, it should be administered at least 2 weeks prior to travel. Although this patient will not have optimal benefit of vaccine for at least 2 weeks, he will be there an additional 6 weeks, staying with friends and relatives, and is traveling to a high-risk country. Vaccine administration is recommended, and the parent should be fully informed when maximum benefit will occur. Food and water precautions are essential, especially during the first 2 weeks.
Precautions such as consumption of only boiled or bottled water, avoidance of undercooked or raw meat and seafood, and avoidance of raw fruit and vegetables to minimize acquisition of traveler’s diarrhea should be discussed. Antimicrobials also can be provided.
Options for malaria prophylaxis are limited due to the ensuing departure date and the child’s age. Atovaquone-Proguanil can be prescribed because it can be initiated 1-2 days prior to departure. It is taken daily while in India and for 1 week after return. He is too young for doxycycline. Mefloquine, administered weekly, should begin at least 2 weeks prior to exposure, so it is not an option. There is no role for chloroquine because chloroquine-resistant malaria is present in this country. In contrast to malaria, where mosquitoes usually feed dusk to dawn, chikungunya and dengue fever are transmitted by mosquitoes during the daytime.
No specific prevention for tuberculosis is available. Avoidance of persons with chronic cough or known disease is recommended.
It can be challenging for a busy practitioner to stay abreast of the latest developments in non–routinely administered vaccines, disease outbreaks, or country-specific entry requirements. Many vaccines, such as those against typhoid or rabies, are not routinely available in the patient’s medical home.
Ideally, patients planning international travel should be referred to a travel medicine clinic 1 month prior to travel. Some vaccines take up to 2 weeks to become effective, while others – such as yellow fever – should be administered at least 10 days prior to travel. However, interventions are still available for the last-minute patient, as in this case. Counseling for a variety of issues is provided. It’s not just about the vaccines.
International travel among children and adolescents will continue to rise. It behooves every primary care practitioner to develop a system to determine the summertime plans/needs of their patients. Not all travel medicine clinics provide services to children. It’s a good idea to find out which ones do in your area. You can always locate a clinic through the International Society of Travel Medicine and the Centers for Disease Control and Prevention.
While this call is not the norm, it occurs frequently. In contrast, another call for a 2-month photography trip to Uganda was received the same day. Departure was 6 weeks later!
Dr. Word is a pediatric infectious disease specialist and director of the Houston Travel Medicine Clinic. She said she had no relevant financial disclosures. Write to Dr. Word at pdnews@frontlinemedcom.com.
Many of your patients will head for international destinations this summer, where they may be exposed to infectious diseases and other health risks they normally do not encounter in the United States.
For the majority of patients, these exposures will be brief; however, several may be extended due to study abroad or parental job relocation. More and more adolescents also are traveling to resource-limited areas doing volunteer work or adventure travel, and many are residing with host families. Children with chronic diseases pose concerns directly related to their underlying conditions, susceptibility, and availability of medical care in the host country. While most international travel plans are made at least 3 months in advance, health precautions such as immunizations and preventive medication often are not considered as travel plans are being finalized. If you are lucky, your patients will have mentioned their plans to you prior to finalizing their trips. You may receive a call at the last minute for assistance in helping to prepare them for a safe and healthy journey.
The U.S. Office of Travel & Tourism reports that slightly more than 60 million Americans traveled outside of the United States in 2012, with 28.5 million of the final destinations being overseas. Children accounted for approximately 2.4 million travelers. While tourism was the most common reason for travel, children were more likely to be visiting friends and relatives (VFR). Studies have revealed significantly increased health risks among VFR travelers, who often stay in private homes and in less-developed areas, compared with vacationers or business travelers who are more likely to be staying in hotels and in urban areas (Pediatrics 2010;125:e1072-80).
Is it really necessary to seek pretravel advice? Some travelers are not convinced. To facilitate this discussion, I thought I would share a recent call.
You are informed via voicemail that a 3-year-old is traveling with his family to Madras, India, for 8 weeks. He is visiting relatives, and the family may visit rural areas. The accommodations are air conditioned and the family is departing in 5 days! They would like to schedule an appointment immediately. What can you do?
Vital information has already been provided. The destination, type of accommodations, activities, duration of stay, and that the patient is a VFR are all important details when making vaccine and other recommendations. First, determine if the child’s routine immunizations are up to date. Next, determine the potential exposures for this patient, and identify vaccine-preventable and nonpreventable diseases. If there is a travel medicine specialist in your area who also sees children, you can refer the patient. If one is not readily available or you prefer to manage the patient, a great resource is the Centers for Disease Control and Prevention Traveler's Health site.
Vaccine preventable diseases include hepatitis A, hepatitis B, Japanese encephalitis, polio, rabies, typhoid, and influenza. Nonvaccine preventable diseases include chikungunya and dengue fevers. Avian influenza, malaria, tuberculosis, and traveler’s diarrhea are also cause for concern.
If you determine the routine immunizations are up to date, remember that measles is still a concern in many countries, and current U.S. recommendations state that all children at least 12 months of age should have two doses prior to leaving the United States. Although routinely administered at 4 years of age, the second dose of MMR can be administered as early as 4 weeks after the first dose. Those aged 6-11 months should have one dose prior to leaving the country. The remaining two doses should be administered at the usual time. Therefore, a total of three doses will be required to complete the series. Since the immunizations are up to date, this patient will also be protected against hepatitis A and B in addition to polio. Hepatitis A is the most common vaccine preventable disease acquired by travelers.
Rabies is prevalent in India, and all animal bites should be taken seriously. Because the patient is in a major urban area, access to both rabies vaccine and immunoglobulin should not be a concern. Japanese encephalitis will be circulating (May-October), but is usually found in rural agricultural areas. Mosquito precautions utilizing DEET (30%) on exposed areas or Permethrine-containing sprays on clothes to repel mosquitoes and ticks should be emphasized if travel to rural areas occurs. Vaccines for rabies and Japanese encephalitis would not be recommended for this patient. If the itinerary were different, they may be considered. Ixiaro, an inactivated Japanese encephalitis (JE) vaccine was approved for use in children as young as 2 months of age in May 2013. Previously, it was approved for use only in those at least 17 years of age in the United States. Both rabies and JE require a minimum of 21 and 28 days, respectively, to complete, and JE should be completed at least 1 week prior to exposure.
Typhoid fever (enteric fever) occurs worldwide, with an estimated 22 million cases annually. In 2012, 343 cases were reported in the United States, most of which were in recent travelers. The risk for typhoid fever is highest for travelers to southern Asia (6-30 times higher) than for all other destinations (Centers for Disease Control and Prevention. CDC Health Information for International Travel 2012. New York: Oxford University Press; 2012). Two types of vaccine are available: an oral, live attenuated vaccine for those at least 6 years of age and an injectable polysaccharide vaccine for those at least 2 years of age. In this case there is only one option, the injectable vaccine. Ideally, it should be administered at least 2 weeks prior to travel. Although this patient will not have optimal benefit of vaccine for at least 2 weeks, he will be there an additional 6 weeks, staying with friends and relatives, and is traveling to a high-risk country. Vaccine administration is recommended, and the parent should be fully informed when maximum benefit will occur. Food and water precautions are essential, especially during the first 2 weeks.
Precautions such as consumption of only boiled or bottled water, avoidance of undercooked or raw meat and seafood, and avoidance of raw fruit and vegetables to minimize acquisition of traveler’s diarrhea should be discussed. Antimicrobials also can be provided.
Options for malaria prophylaxis are limited due to the ensuing departure date and the child’s age. Atovaquone-Proguanil can be prescribed because it can be initiated 1-2 days prior to departure. It is taken daily while in India and for 1 week after return. He is too young for doxycycline. Mefloquine, administered weekly, should begin at least 2 weeks prior to exposure, so it is not an option. There is no role for chloroquine because chloroquine-resistant malaria is present in this country. In contrast to malaria, where mosquitoes usually feed dusk to dawn, chikungunya and dengue fever are transmitted by mosquitoes during the daytime.
No specific prevention for tuberculosis is available. Avoidance of persons with chronic cough or known disease is recommended.
It can be challenging for a busy practitioner to stay abreast of the latest developments in non–routinely administered vaccines, disease outbreaks, or country-specific entry requirements. Many vaccines, such as those against typhoid or rabies, are not routinely available in the patient’s medical home.
Ideally, patients planning international travel should be referred to a travel medicine clinic 1 month prior to travel. Some vaccines take up to 2 weeks to become effective, while others – such as yellow fever – should be administered at least 10 days prior to travel. However, interventions are still available for the last-minute patient, as in this case. Counseling for a variety of issues is provided. It’s not just about the vaccines.
International travel among children and adolescents will continue to rise. It behooves every primary care practitioner to develop a system to determine the summertime plans/needs of their patients. Not all travel medicine clinics provide services to children. It’s a good idea to find out which ones do in your area. You can always locate a clinic through the International Society of Travel Medicine and the Centers for Disease Control and Prevention.
While this call is not the norm, it occurs frequently. In contrast, another call for a 2-month photography trip to Uganda was received the same day. Departure was 6 weeks later!
Dr. Word is a pediatric infectious disease specialist and director of the Houston Travel Medicine Clinic. She said she had no relevant financial disclosures. Write to Dr. Word at pdnews@frontlinemedcom.com.

Statins for A-fib are ready for prime time
The risk for atrial fibrillation increases with age and the presence of structural heart disease. AF exerts an enormous financial burden on the U.S. health care system. The overall prevalence of AF is 1%, and 70% of people with AF are 65 years of age or older. Inclusive of inpatient and outpatient expenditures, costs for the first episode of atrial fibrillation are estimated to be $15,000.
Perhaps we are all too familiar with the staggering resources consumed by patients who, despite adequate rate control, remain symptomatic. In these cases, an ounce of prevention could literally have been thousands of dollars of cure.
So, can we prevent A-fib?
Statins have been proposed as a way to do this. So, what’s the most recent evidence telling us about its efficacy?
Researchers in France conducted an updated systematic review of the literature to determine the benefit of statins for the prevention of AF (Curr. Opin. Cardiol. 2013;28:7-18). Studies were selected for inclusion if they were randomized, controlled clinical trials including a direct comparison between a statin and control condition or placebo.
Thirty-two studies were included, which enrolled a total of 71,005 patients. Statin use was significantly associated with a decreased risk of AF (odds ratio, 0.69; 95% CI: 0.57-0.83). The benefit of statin therapy was significant for the prevention of postoperative AF (OR, 0.37; 95% CI: 0.28-0.51) and secondary prevention of AF (OR, 0.57; 95% CI: 0.36-0.91). No clear benefit of statins for new-onset AF was identified, and no difference was observed between intensive and standard therapy.
The mechanism of action is hypothesized to be exerted through the anti-inflammatory and antioxidant effects of statins.
Some of these patients may already be on statins. But for those who are not and could tolerate them, the use of statins decreased the odds of postoperative and secondary AF by 40%-60%. This could result in enormous potential cost savings to the U.S. health care system.
The evidence is strong, so we need to ask ourselves, why are we not doing this already?
Dr. Ebbert is professor of medicine and a primary care clinician at the Mayo Clinic in Rochester, Minn. He reported having no relevant financial conflicts. The opinions expressed are those of the author.

Nab-paclitaxel is a valuable NSCLC therapy option
The FDA recently widened the approved use of nanoparticle albumin bound (nab) paclitaxel (nab-paclitaxel) to include first-line treatment for non–small-cell lung cancer (NSCLC), in combination with carboplatin. This approval was based on results of a global, phase 3 randomized trial conducted by Socinski et al that compared the use of nab-paclitaxel and solventbased paclitaxel injection in combination with carboplatin as first-line treatment of advanced NSCLC.1 Taxanes are the most widely used chemotherapeutic agents in solid tumor oncology. Paclitaxel and docetaxel are effective in the treatment of NSCLC and are frequently used for adjuvant therapy after resection, in combination with radiation for locally advanced disease and for treatment of patients with advanced disease. They are usually used in combination with platinum agents or as single-agent therapy in the relapsed refractory setting. Paclitaxel and docetaxel require synthetic solvents for intravenous administration, which can cause life-threatening allergic reactions and significant toxicity. Nab-paclitaxel is a novel, solvent-free formulation of paclitaxel, which can be administered without the need for steroid and antihistamine premedication. Furthermore, nab-paclitaxel delivers high concentrations of the drug’s active ingredient into the cancer cell with a reduced incidence of side effects compared with the solvent-based formulation. As summarized in the Community Translations article on page 166, the administration of nab-paclitaxel as firstline therapy in combination with carboplatin was efficacious and resulted in a significantly improved overall response rate (ORR), compared with paclitaxel (33% vs 25%, respectively; response rate ratio [RRR], 1.313; 95% CI, 1.082-1.593; P .005), and it achieved the study’s primary end point. Of note, ORR was significantly greater with nab-paclitaxel in patients with squamous cell histology (41% vs 24%; RRR, 1.680; P .001), with no difference between treatments being observed in patients with nonsquamous histology (ORR, 26% vs 25%) or adenocarcinoma (ORR, 26% vs 27%). There was no difference in PFS or survival between the 2 arms.
The FDA recently widened the approved use of nanoparticle albumin bound (nab) paclitaxel (nab-paclitaxel) to include first-line treatment for non–small-cell lung cancer (NSCLC), in combination with carboplatin. This approval was based on results of a global, phase 3 randomized trial conducted by Socinski et al that compared the use of nab-paclitaxel and solventbased paclitaxel injection in combination with carboplatin as first-line treatment of advanced NSCLC.1 Taxanes are the most widely used chemotherapeutic agents in solid tumor oncology. Paclitaxel and docetaxel are effective in the treatment of NSCLC and are frequently used for adjuvant therapy after resection, in combination with radiation for locally advanced disease and for treatment of patients with advanced disease. They are usually used in combination with platinum agents or as single-agent therapy in the relapsed refractory setting. Paclitaxel and docetaxel require synthetic solvents for intravenous administration, which can cause life-threatening allergic reactions and significant toxicity. Nab-paclitaxel is a novel, solvent-free formulation of paclitaxel, which can be administered without the need for steroid and antihistamine premedication. Furthermore, nab-paclitaxel delivers high concentrations of the drug’s active ingredient into the cancer cell with a reduced incidence of side effects compared with the solvent-based formulation. As summarized in the Community Translations article on page 166, the administration of nab-paclitaxel as firstline therapy in combination with carboplatin was efficacious and resulted in a significantly improved overall response rate (ORR), compared with paclitaxel (33% vs 25%, respectively; response rate ratio [RRR], 1.313; 95% CI, 1.082-1.593; P .005), and it achieved the study’s primary end point. Of note, ORR was significantly greater with nab-paclitaxel in patients with squamous cell histology (41% vs 24%; RRR, 1.680; P .001), with no difference between treatments being observed in patients with nonsquamous histology (ORR, 26% vs 25%) or adenocarcinoma (ORR, 26% vs 27%). There was no difference in PFS or survival between the 2 arms.
The FDA recently widened the approved use of nanoparticle albumin bound (nab) paclitaxel (nab-paclitaxel) to include first-line treatment for non–small-cell lung cancer (NSCLC), in combination with carboplatin. This approval was based on results of a global, phase 3 randomized trial conducted by Socinski et al that compared the use of nab-paclitaxel and solventbased paclitaxel injection in combination with carboplatin as first-line treatment of advanced NSCLC.1 Taxanes are the most widely used chemotherapeutic agents in solid tumor oncology. Paclitaxel and docetaxel are effective in the treatment of NSCLC and are frequently used for adjuvant therapy after resection, in combination with radiation for locally advanced disease and for treatment of patients with advanced disease. They are usually used in combination with platinum agents or as single-agent therapy in the relapsed refractory setting. Paclitaxel and docetaxel require synthetic solvents for intravenous administration, which can cause life-threatening allergic reactions and significant toxicity. Nab-paclitaxel is a novel, solvent-free formulation of paclitaxel, which can be administered without the need for steroid and antihistamine premedication. Furthermore, nab-paclitaxel delivers high concentrations of the drug’s active ingredient into the cancer cell with a reduced incidence of side effects compared with the solvent-based formulation. As summarized in the Community Translations article on page 166, the administration of nab-paclitaxel as firstline therapy in combination with carboplatin was efficacious and resulted in a significantly improved overall response rate (ORR), compared with paclitaxel (33% vs 25%, respectively; response rate ratio [RRR], 1.313; 95% CI, 1.082-1.593; P .005), and it achieved the study’s primary end point. Of note, ORR was significantly greater with nab-paclitaxel in patients with squamous cell histology (41% vs 24%; RRR, 1.680; P .001), with no difference between treatments being observed in patients with nonsquamous histology (ORR, 26% vs 25%) or adenocarcinoma (ORR, 26% vs 27%). There was no difference in PFS or survival between the 2 arms.