User login
News and Views that Matter to Pediatricians
The leading independent newspaper covering news and commentary in pediatrics.
The Cause of All That Stress: Tonsillectomy?
This transcript has been edited for clarity.
You know those times in your life when you’re just feeling ... stressed? You’re on the edge; you have no chill; everything just sort of gets to you. If you can step away from the anxiety for a moment, you might ask yourself where it’s all coming from. Is it really the stuff in your inbox at work or is it money issues at home? Is it something with your relationship, or maybe it’s your sleep quality or your diet? One thing you probably won’t blame for those acute stress reactions is the tonsillectomy you had as a kid. But according to new research, maybe you should.
Tonsillectomy and adenoidectomy are among the most common surgical procedures young people in the United States undergo, with about 300,000 cases a year, according to recent numbers. That’s down a bit from numbers a decade or so ago, but suffice it to say, a good chunk of the population is walking around right now without their tonsils.
The data supporting tonsillectomy have never been great. The two big indications for the surgery are recurrent sore throat — data show that tonsillectomy reduces this by about 0.7 sore throats per year— and obstructive sleep apnea (OSA). The data for improvement of OSA are a bit better than the data for sore throats.
Also, tonsillectomy is a relatively quick, relatively well-reimbursed surgery with indications that are — let’s be honest — somewhat subjective, and so variation is high. One study found that in a single Vermont town, nearly 60% of the population had had their tonsils removed by the time they turned 18. A few towns over, the rate was 20%.
A few factors have led to the decline of tonsillectomy in recent years. Reimbursement rates have gone down a bit. Additionally, better data collection and statistical analysis have shown that the benefits of the procedure are relatively modest.
And then there is a body of medical literature that at first struck me as surprising and almost bizarre: data linking tonsillectomy to subsequent physical and psychiatric disorders.
I teach a course on interpretation of the medical literature, and one of the first things I teach my students is to check their gut when they see the conclusion of a study.
Basically, even before you read the data, have a sense in your own mind if the hypothesis seems reasonable. If a paper is going to conclude that smoking leads to increased risk for bone cancer, I’d say that seems like a reasonable thing to study. If a paper purports to show a link between eating poultry and bone cancer, I’m going to be reading it with quite a bit more skepticism.
The technical term for that process is assessing “biologic plausibility.” If we’re talking tonsils, we have to ask ourselves: Is it plausible that removing someone’s tonsils when they are young should lead to major problems in the future?
At first blush, it didn’t seem very plausible to me.
But the truth is, there are quite a few studies out there demonstrating links like this: links between tonsillectomy and irritable bowel syndrome; links between tonsillectomy and cancer; links between tonsillectomy and depression.
And this week, appearing in JAMA Network Open, is a study linking tonsillectomy with stress disorders.
Researchers leveraged Sweden’s health database, which contains longitudinal data on basically every person who has lived in Sweden since 1981. This database let them know who had a tonsillectomy or adenoidectomy, and when, and what happened to them later in life.
I think the best way to present these data is to show you what they found, and then challenge that finding, and then show you what they did in anticipation of the challenges we would have to their findings. It’s a pretty thorough study.
So, topline results here. The researchers first identified 83,957 individuals who had their tonsils removed. They matched each of them with 10 controls who did not have their tonsils removed but were the same age and sex.
Over around 30 years of follow-up, those people who had their tonsils removed were 43% more likely to develop a stress-related disorder. Among the specific disorders, the risk for PTSD was substantially higher: 55% higher in the tonsillectomy group.
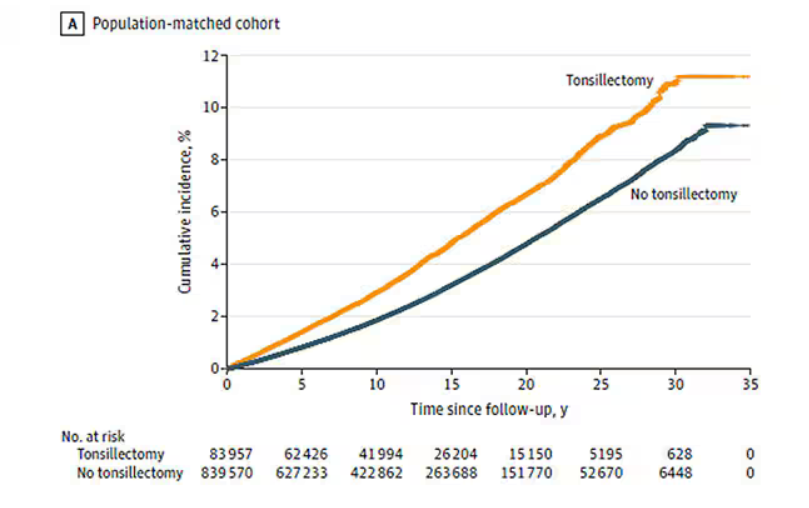
That’s pretty surprising, but I bet you already want to push back against this. Sure, the control group was the same age and sex, but other factors might be different between the two groups. You’d be right to think so. People who got their tonsils out were more likely to have parents with a history of stress-related disorders and who had lower educational attainment. But the primary results were adjusted for those factors.
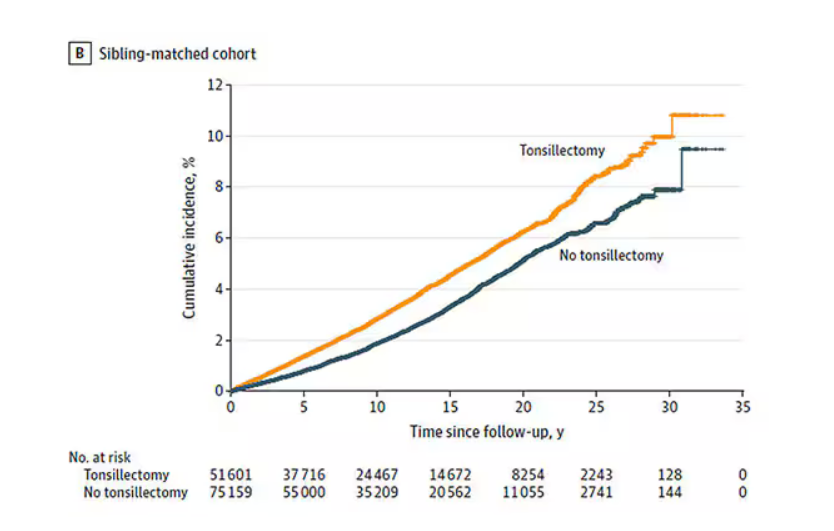
There’s more to a family than parental educational attainment, of course. To account for household factors that might be harder to measure, the researchers created a second control group, this one comprising the siblings of people who had their tonsils removed but who hadn’t themselves had their tonsils removed.
The relationship between tonsillectomy and stress disorders in this population was not quite as robust but still present: a 34% increase in any stress disorder and a 41% increase in the risk for PTSD.
Maybe kids who get their tonsils out are just followed more closely thereafter, so doctors might notice a stress disorder and document it in the medical record; whereas with other kids it might go unnoticed. This is known as ascertainment bias. The researchers addressed this in a sensitivity analysis where they excluded new diagnoses of stress disorders that occurred in the first 3 years after tonsillectomy. The results were largely unchanged.
So how do we explain these data? We observe a correlation between tonsillectomy in youth and stress disorders in later life. But correlation is not causation. One possibility, perhaps even the most likely possibility, is that tonsillectomy is a marker of some other problem. Maybe these kids are more prone to infections and are therefore more likely to need their tonsils removed. Then, after a lifetime of more infections than average, their stress responses are higher. Or maybe kids with a higher BMI are more likely to have their tonsils removed due to sleep apnea concerns, and it’s that elevated BMI that leads to higher stress in later life.
Or maybe this is causal. Maybe there actually is biological plausibility here. The authors suggest that removal of tonsils might lead to broader changes in the immune system; after all, tonsillar tissue is on the front line of our defense against pathogens that might enter our bodies through our mouths or noses. Immunologic changes lead to greater inflammation over time, and there is decent evidence to link chronic inflammation to a variety of physical and psychological disorders.
In support of this, the authors show that the kids with tonsillectomy were more likely to be hospitalized for an infectious disease in the future as well, in magnitudes similar to the increased risk for stress. But they don’t actually show that the relationship between tonsillectomy and stress is mediated by that increased risk for infectious disease.
In the end, I find these data really intriguing. Before I dug into the literature, it seemed highly unlikely that removal of these small lumps of tissue would have much of an effect on anything. Now I’m not so sure. A few things can be removed from the human body without any consequences, but it can be hard to know exactly what those consequences are.
That said, given the rather marginal benefits of tonsillectomy and the growing number of studies expanding on the risks, I expect that we’ll see the rates of the surgery decline even further in the future.
F. Perry Wilson, MD, MSCE, is an associate professor of medicine and public health and director of Yale’s Clinical and Translational Research Accelerator in New Haven, Connecticut. He reported no relevant conflicts of interest.
A version of this article first appeared on Medscape.com.
This transcript has been edited for clarity.
You know those times in your life when you’re just feeling ... stressed? You’re on the edge; you have no chill; everything just sort of gets to you. If you can step away from the anxiety for a moment, you might ask yourself where it’s all coming from. Is it really the stuff in your inbox at work or is it money issues at home? Is it something with your relationship, or maybe it’s your sleep quality or your diet? One thing you probably won’t blame for those acute stress reactions is the tonsillectomy you had as a kid. But according to new research, maybe you should.
Tonsillectomy and adenoidectomy are among the most common surgical procedures young people in the United States undergo, with about 300,000 cases a year, according to recent numbers. That’s down a bit from numbers a decade or so ago, but suffice it to say, a good chunk of the population is walking around right now without their tonsils.
The data supporting tonsillectomy have never been great. The two big indications for the surgery are recurrent sore throat — data show that tonsillectomy reduces this by about 0.7 sore throats per year— and obstructive sleep apnea (OSA). The data for improvement of OSA are a bit better than the data for sore throats.
Also, tonsillectomy is a relatively quick, relatively well-reimbursed surgery with indications that are — let’s be honest — somewhat subjective, and so variation is high. One study found that in a single Vermont town, nearly 60% of the population had had their tonsils removed by the time they turned 18. A few towns over, the rate was 20%.
A few factors have led to the decline of tonsillectomy in recent years. Reimbursement rates have gone down a bit. Additionally, better data collection and statistical analysis have shown that the benefits of the procedure are relatively modest.
And then there is a body of medical literature that at first struck me as surprising and almost bizarre: data linking tonsillectomy to subsequent physical and psychiatric disorders.
I teach a course on interpretation of the medical literature, and one of the first things I teach my students is to check their gut when they see the conclusion of a study.
Basically, even before you read the data, have a sense in your own mind if the hypothesis seems reasonable. If a paper is going to conclude that smoking leads to increased risk for bone cancer, I’d say that seems like a reasonable thing to study. If a paper purports to show a link between eating poultry and bone cancer, I’m going to be reading it with quite a bit more skepticism.
The technical term for that process is assessing “biologic plausibility.” If we’re talking tonsils, we have to ask ourselves: Is it plausible that removing someone’s tonsils when they are young should lead to major problems in the future?
At first blush, it didn’t seem very plausible to me.
But the truth is, there are quite a few studies out there demonstrating links like this: links between tonsillectomy and irritable bowel syndrome; links between tonsillectomy and cancer; links between tonsillectomy and depression.
And this week, appearing in JAMA Network Open, is a study linking tonsillectomy with stress disorders.
Researchers leveraged Sweden’s health database, which contains longitudinal data on basically every person who has lived in Sweden since 1981. This database let them know who had a tonsillectomy or adenoidectomy, and when, and what happened to them later in life.
I think the best way to present these data is to show you what they found, and then challenge that finding, and then show you what they did in anticipation of the challenges we would have to their findings. It’s a pretty thorough study.
So, topline results here. The researchers first identified 83,957 individuals who had their tonsils removed. They matched each of them with 10 controls who did not have their tonsils removed but were the same age and sex.
Over around 30 years of follow-up, those people who had their tonsils removed were 43% more likely to develop a stress-related disorder. Among the specific disorders, the risk for PTSD was substantially higher: 55% higher in the tonsillectomy group.
That’s pretty surprising, but I bet you already want to push back against this. Sure, the control group was the same age and sex, but other factors might be different between the two groups. You’d be right to think so. People who got their tonsils out were more likely to have parents with a history of stress-related disorders and who had lower educational attainment. But the primary results were adjusted for those factors.
There’s more to a family than parental educational attainment, of course. To account for household factors that might be harder to measure, the researchers created a second control group, this one comprising the siblings of people who had their tonsils removed but who hadn’t themselves had their tonsils removed.
The relationship between tonsillectomy and stress disorders in this population was not quite as robust but still present: a 34% increase in any stress disorder and a 41% increase in the risk for PTSD.
Maybe kids who get their tonsils out are just followed more closely thereafter, so doctors might notice a stress disorder and document it in the medical record; whereas with other kids it might go unnoticed. This is known as ascertainment bias. The researchers addressed this in a sensitivity analysis where they excluded new diagnoses of stress disorders that occurred in the first 3 years after tonsillectomy. The results were largely unchanged.
So how do we explain these data? We observe a correlation between tonsillectomy in youth and stress disorders in later life. But correlation is not causation. One possibility, perhaps even the most likely possibility, is that tonsillectomy is a marker of some other problem. Maybe these kids are more prone to infections and are therefore more likely to need their tonsils removed. Then, after a lifetime of more infections than average, their stress responses are higher. Or maybe kids with a higher BMI are more likely to have their tonsils removed due to sleep apnea concerns, and it’s that elevated BMI that leads to higher stress in later life.
Or maybe this is causal. Maybe there actually is biological plausibility here. The authors suggest that removal of tonsils might lead to broader changes in the immune system; after all, tonsillar tissue is on the front line of our defense against pathogens that might enter our bodies through our mouths or noses. Immunologic changes lead to greater inflammation over time, and there is decent evidence to link chronic inflammation to a variety of physical and psychological disorders.
In support of this, the authors show that the kids with tonsillectomy were more likely to be hospitalized for an infectious disease in the future as well, in magnitudes similar to the increased risk for stress. But they don’t actually show that the relationship between tonsillectomy and stress is mediated by that increased risk for infectious disease.
In the end, I find these data really intriguing. Before I dug into the literature, it seemed highly unlikely that removal of these small lumps of tissue would have much of an effect on anything. Now I’m not so sure. A few things can be removed from the human body without any consequences, but it can be hard to know exactly what those consequences are.
That said, given the rather marginal benefits of tonsillectomy and the growing number of studies expanding on the risks, I expect that we’ll see the rates of the surgery decline even further in the future.
F. Perry Wilson, MD, MSCE, is an associate professor of medicine and public health and director of Yale’s Clinical and Translational Research Accelerator in New Haven, Connecticut. He reported no relevant conflicts of interest.
A version of this article first appeared on Medscape.com.
Acne Outcome Measures: Do they Incorporate LGBTQ+ Inclusive Language?
TOPLINE:
with heteronormative terms used in three of six measures addressing intimate relationships.
METHODOLOGY:
- Researchers conducted an inductive thematic analysis of 22 PROMs for acne, identified through a PubMed search.
- LGBTQ+-inclusive language was defined per the National Institutes of Health style guide.
- The analysis included 16 PROMs: Nine were acne-specific with 56 relevant items, 4 were dermatology-specific with 28 items, and 4 were health-related with 43 items.
TAKEAWAY:
- LGBTQ+-noninclusive language was identified in four of nine acne-specific PROMs — the Acne Disability Index (ADI), Acne Quality of Life Scale (AQOL), Acne-Quality of Life (Acne-QoL), and Cardiff Acne Disability Index (CADI) — but not in health-related or dermatology-specific PROMs.
- Among PROMs addressing intimate relationships, three of six acne-specific measures (CADI, ADI, and Acne-QoL) used heteronormative language, while three acne-specific PROMs, three dermatology-specific PROMs, and one health-related PROM used nonheteronormative terminology (such as “partner”).
- All PROMs contained items with nongendered pronouns (such as “I” or “you” instead of “he” or “she”). However, the AQOL included gendered language (“brothers” and “sisters,” rather than “siblings”).
- Two acne-specific PROMs demonstrated partial LGBTQ+ inclusivity, incorporating some but not all LGBTQ+ identities.
IN PRACTICE:
“Using LGBTQ+-inclusive language may promote the acquisition of accurate and relevant data for patient care and clinical trials and even enhance patient-clinician relationships,” the authors of the study wrote. “While demographics such as sex, age, race, and ethnicity are commonly considered during patient-reported outcome development and validation,” wrote the authors of an accompanying editorial, the study highlights that “sexual orientation and gender identity should also be considered to ensure these measures have similar performance across diverse populations.”
SOURCE:
The study was led by Twan Sia, BA, Department of Dermatology, Stanford University School of Medicine in California. The authors of the editorial were John S. Barbieri, MD, MBA, Department of Dermatology, Brigham and Women’s Hospital, Boston, Massachusetts, and Mya L. Roberson, MSPH, PhD, University of North Carolina at Chapel Hill.
LIMITATIONS:
The study was limited to the analysis of only English-language PROMs.
DISCLOSURES:
Two study authors disclosed receiving grants or personal fees from various sources, including pharmaceutical companies outside the submitted work. Barbieri disclosed receiving consulting fees from Dexcel Pharma and Honeydew Care; Roberson disclosed receiving consulting fees from the National Committee for Quality Assurance.
This article was created using several editorial tools, including AI, as part of the process. Human editors reviewed this content before publication. A version of this article first appeared on Medscape.com.
H5N1 Avian Influenza Spreads Across North America
It’s been a while since I’ve discussed the H5N1 avian influenza clade 2.3.4.4b and its rapid spread in North America. I hope the facts prove me wrong, but many experts have been warning for some time that ideal conditions are forming for this virus, which for now only causes zoonoses, to pose a pandemic threat.
either because they work in other medical fields or think that the experience of the COVID-19 pandemic was a worst-case scenario that is unlikely to be repeated in the short term.
The Virus Has Flown to Hawaii
According to data from the Centers for Disease Control and Prevention in Atlanta, Georgia, the infection has now affected more than 500 cattle herds in 15 states. There are about 30 outbreaks reported in poultry, equally distributed between backyard and farm-raised birds, primarily located in California. Here alone, over 3 million birds have been affected.
Wild birds are believed to have transported the highly pathogenic virus via migration routes across the Pacific, introducing it to Hawaii for the first time. Just days after wastewater analysis detected the presence of H5N1 on the island of Oahu, home to the capital Honolulu, the first outbreak was promptly reported, killing at least a dozen ducks and geese in a backyard coop. Some of these birds had been taken in early November to the Mililani Pet Fair, a sort of domestic animal festival. Local authorities recommended that anyone who attended the fair, touched a duck or goose at the event, and developed symptoms including fever, cough, sore throat, and conjunctivitis, should isolate and seek medical advice.
Meanwhile, more than 50 farmers, animal handlers, or workers involved in the slaughter of cattle or poultry across seven states have been confirmed infected, presumably contracted at their workplace. The latest case, diagnosed recently in Oregon, presented with severe conjunctivitis and mild respiratory symptoms. More than half of these patients have been identified in recent weeks in California, where active surveillance measures have been implemented. However, there is strong suspicion that the actual number of people infected with mild symptoms in the rest of the country is much, much higher.
The Red Alert Lights Up in Canada
The level of concern was raised further with news of the first severe — indeed very severe — case of H5N1 avian influenza originating from the western edge of Canada. A teenager (gender not disclosed), previously healthy and without risk factors, was hospitalized with severe respiratory failure in the intensive care unit at British Columbia Children’s Hospital in Vancouver. The source of the infection is unknown, similar to only one other case in Missouri involving an adult already hospitalized for other reasons, which was identified by chance through influenza surveillance programs. We also know that the Canadian adolescent does not live on a farm and had no known contact with potentially infected animals. The only suspicions focus on the family dog, euthanized owing to unspecified health problems in the early days of the epidemiologic investigation. Although the dog tested negative for avian influenza, a necropsy will be conducted to rule out its involvement in the transmission chain.
An initial characterization of the virus has linked it to genotype D1.1, which is circulating among wild birds and poultry farms in Canada’s westernmost province, rather than the strain typical of dairy cows in the United States. The publication of the complete viral sequence over the past weekend has, for the first time, highlighted mutations that could enhance the virus’s ability to infect human cells.
How do we know this? From the highly contested “gain-of-function” studies, which artificially modify viruses to understand which genomic points require the most surveillance — those mutations that can make the infectious agent more virulent or more transmissible between people.
Under Special Surveillance for 20 Years
The influenza A (H5N1) avian virus is not new or previously unknown, like SARS-CoV-2, and this could (in theory) give us a slight advantage. We have known about it for decades, and it began infecting humans about 20 years ago, causing pneumonia with respiratory failure. It proved lethal in about half of the cases, but only in people who had close contact with infected poultry, primarily in Southeast Asia.
Hundreds of other human cases occurred worldwide, but always in low-income countries with poor hygiene conditions and where families lived in close contact with animals. This contributed to a false sense of security in Europe and North America, where the threat has been consistently underestimated. Despite an estimated fatality rate of around 50%, the media often labeled scientists’ warnings and health authorities’ efforts to remain prepared as false alarms, tainted by suspicions of catering to the interests of pharmaceutical companies.
Some people may recall the scandal involving Tamiflu, the Roche antiviral oseltamivir, that governments stockpiled when there were fears that the avian virus might acquire the ability to spread among humans. It was dubbed “a false antidote for a false pandemic,” referring to the potential avian pandemic and the 2009 H1N1 influenza pandemic, improperly called “swine flu,” and which turned out to be less severe than expected. There was talk of €2.64 billion being “wasted” to “please” the manufacturer. Although the Cochrane Collaboration made legitimate demands for rigor and transparency in conducting and publishing clinical trials, much of the public, and the journalists who wrote the stories, cared little about these technical aspects. The prevailing message was that stockpiling drugs (or vaccines) for a disease we don’t even know will occur is a waste of taxpayers’ money rather than a prudent preventive measure.
More Vulnerable Than Ever
If we were to ascribe strategic thinking to the virus, which it is not capable of, we might argue that it chose the ideal moment to conquer the world. It began circulating in the new clade in 2020, when experts and authorities were focused on the coronavirus. It spread from birds to marine mammals and finally to cattle, exploiting the public’s post-pandemic fatigue, as people no longer wanted to hear about infectious diseases and containment measures. It ultimately rode the wave of political polarization that irrationally equates prevention with supposed cowardice on the left, and recklessness with courageous freedom on the right.
The coincidence between the future appointments announced by the incoming Trump administration and the virus’s accelerated spread deserves attention from decision-makers and health professionals worldwide. The COVID-19 pandemic experience should have taught us that ignoring a threat doesn’t make it go away, if not in our health, then at least in our wallet. The economic repercussions of a virus circulating among animals crucial to our food chain and national economies should concern everyone, well before the threat crosses the ocean, because only then can we defend ourselves.
The proposed Secretary of Health and Human Services, Robert F. Kennedy, is a proponent of the supposed benefits of raw milk, which could serve as a potent vector for the virus. He is ideologically opposed to vaccinations. It’s hard to imagine he would utilize the H5N1 vaccine stockpiles held by the US government for a campaign starting at least with farmers, as was done prophylactically in Finland with products jointly procured by 15 European countries — a group the Italian government decided not to join.
If Kennedy indeed becomes responsible for US public health, it’s reasonable to fear that, in the name of freedom, he will try to delay as much as possible — even if necessary — the obligation to undergo testing and wear masks, not to mention more restrictive infection containment measures. It’s also unlikely he would support and promote the development of new mRNA products already under study, which would become indispensable if the disease begins to spread more easily among people, as well as animals. In such a case, traditional influenza vaccine cultivation methods using chicken eggs would prove too slow and quantitatively insufficient, especially if the virus continues to circulate among poultry.
In short, let’s keep our fingers crossed, but recognize that crossing our fingers might not be enough.
This story was translated from Univadis Italy using several editorial tools, including artificial intelligence, as part of the process. Human editors reviewed this content before publication. A version of this article appeared on Medscape.com.
Childhood Atopic Dermatitis Doesn’t Delay Puberty
TOPLINE:
METHODOLOGY:
- Investigators conducted a nationwide cohort study among 15,534 children in Denmark whose pubertal development was assessed every 6 months with a web-based questionnaire starting at the age of 11 years.
- The children were classified into three groups: No atopic dermatitis; self-reported doctor-diagnosed atopic dermatitis (maternal report of a doctor diagnosis at 6 months, 18 months, and/or 7 years of age); hospital-diagnosed atopic dermatitis (registry data showing it as the primary reason for hospital contact up to the age of 8 years), representing mainly severe cases.
- The main outcome was the age difference averaged across a range of pubertal milestones (attainment of Tanner stages; development of axillary hair, acne, and voice break; and occurrence of first ejaculation and menarche).
TAKEAWAY:
- Overall, 21.5% of the children had self-reported doctor-diagnosed atopic dermatitis and 0.7% had hospital-diagnosed atopic dermatitis.
- Relative to girls without atopic dermatitis, girls with self-reported doctor-diagnosed atopic dermatitis reached the milestones at the same age, with a mean difference of 0.0 months, and girls with hospital-diagnosed atopic dermatitis reached them a mean of 0.3 months earlier.
- Relative to boys without atopic dermatitis, boys with self-reported doctor-diagnosed atopic dermatitis reached the milestones a mean of 0.1 month later and boys with hospital-diagnosed atopic dermatitis reached them a mean of 0.3 months earlier.
- A more stringent definition of atopic dermatitis — persistent or recurrent atopic dermatitis at 7 years of age (assumed more likely to affect sleep and disrupt the skin barrier near the start of puberty) — was also not associated with delayed pubertal development.
IN PRACTICE:
“Previous studies on atopic dermatitis and puberty are limited, some suggest a link between atopic dermatitis and delayed puberty, akin to other chronic inflammatory diseases in childhood,” the authors wrote. “The results of the present study are reassuring for young patients with atopic dermatitis approaching puberty and reproductive health in adult life,” they concluded.
SOURCE:
The study was led by Camilla Lomholt Kjersgaard, MD, Aarhus University, Aarhus, Denmark, and was published online in JAAD International.
LIMITATIONS:
Limitations included a lack of information on treatment, the use of analyses that did not address missing data, and a possible misclassification of self-reported pubertal development.
DISCLOSURES:
The study was funded by the Danish Council for Independent Research; Aarhus University; and Fonden af Fam. Kjærsgaard, Sunds; and was cofunded by the European Union. The authors reported no relevant conflicts of interest.
A version of this article first appeared on Medscape.com.
Measurement-Based Treatment to Target Approaches
Clinical Scenario
Lilly is a 15-year-old girl in her sophomore year of high school. Over the course of a month after a romantic and then a friend-group breakup, her parents have been concerned about her increasing tearfulness every day and retreat from activities to avoid social interactions with others that she once enjoyed so much. She has been missing more and more school, saying that she can’t bear to go, and staying in bed during the days, even on weekends. You start her on an SSRI and recommend psychotherapy in the form of CBT offered through your office. She returns to the appointment in 2 weeks with you and then again in another 2 weeks. Her parents and she tell you, “I thought she would be better by now.” You feel stuck with how to proceed in the visit. You have correctly identified the problem as depression, started the recommended evidence-based treatments, but the parents and Lilly are looking to you for something more or different. There are not many or other local resources. When and how do you all determine what “better” looks and feels like? Where do you go from here?
Metrics Can Guide Next Steps
This clinical scenario is not uncommon. As a psychiatrist consultant in primary care, I often encounter the following comment and question: “Someone isn’t feeling better. I have them taking an SSRI and doing psychotherapy. What is the next thing to do?” In discussions with supervisees and in training residents, I often say that you will know that your consultations have made a real impact on providers’ practices when these questions shift from “what’s the next medication or treatment” to a more robust baseline and follow-up inventory of symptoms via common and available metrics (PHQ9A, PSC-17 or 30, SCARED) shared with you at the start, the middle, and at other times of treatment. Such metrics can more meaningfully guide your collaborative clinical discussions and decisions.

Tracking baseline metrics and follow-up with treatment interventions is a transformative approach to clinical care. But, in primary care, it’s common that the question around mental health care may not receive the same robust screening and tracking of symptoms which have the power to more thoughtfully guide decision-making, even though this is common in other forms of patient care which have more routine use of more objective data.
Measurement-based treatment to target approaches are well-studied, but not often or always implemented. They involve providing a baseline metric (PHQ9A, Pediatric Symptom Checklist 17 or 30, GAD7, or SCARED), and tracking that metric for response over time using specific scores for decision points.
An Alternative Clinical Scenario
Consider the following alternative scenario for the above patient using a measurement-based treatment to target approach:
Lilly is a 15-year-old girl in her sophomore year of high school with symptoms concerning for depression. A PHQ9A is administered in your appointment, and she scores 20 out of 30, exceeding the threshold score for 11 for depression. You start her on an SSRI and recommend psychotherapy in the form of CBT offered through your office. She returns to the appointment with you in 2 weeks and then again in another 2 weeks. You obtain a PHQ9A at each appointment, and track the change with her and her parents over time.
You share with her and the family that it is common that there will be fluctuations in measurements, and you know that a score change on the PHQ9A greater than 7 is considered a clinically significant, reliable change. So, a PHQ9 score reduction from 20 to 13 would be meaningful progress. While seeking a score within the normal and non-clinical range, the progress can be tracked in a way that allows a more robust monitoring of treatment response. If the scores do not improve, you can see that and act accordingly. This way of using metrics shifts the conversation from “how are you feeling now and today” to tracking symptoms more broadly and tracking those individual symptoms over time, some of which may improve and some which may be trickier to target.
Such a way of tracking common mental health symptoms with a focus on having data at baseline and throughout treatment allows a provider to change or adapt interventions, and to not chase something that can feel ephemeral, such as “feeling happy or looking better.”
For additional information on the measurement-based treatment to target approach, there are resources that share in more depth the research informing this approach, and other and broader real ways to integrate these practices into your own visits:
- Is Treatment Working? Detecting Real Change in the Treatment of Child and Adolescent Depression
- AACAP Clinical Update: Collaborative Mental Health Care for Children and Adolescents in Primary Care
Pawlowski is a child and adolescent consulting psychiatrist. She is a division chief at the University of Vermont Medical Center where she focuses on primary care mental health integration within primary care pediatrics, internal medicine, and family medicine.
Clinical Scenario
Lilly is a 15-year-old girl in her sophomore year of high school. Over the course of a month after a romantic and then a friend-group breakup, her parents have been concerned about her increasing tearfulness every day and retreat from activities to avoid social interactions with others that she once enjoyed so much. She has been missing more and more school, saying that she can’t bear to go, and staying in bed during the days, even on weekends. You start her on an SSRI and recommend psychotherapy in the form of CBT offered through your office. She returns to the appointment in 2 weeks with you and then again in another 2 weeks. Her parents and she tell you, “I thought she would be better by now.” You feel stuck with how to proceed in the visit. You have correctly identified the problem as depression, started the recommended evidence-based treatments, but the parents and Lilly are looking to you for something more or different. There are not many or other local resources. When and how do you all determine what “better” looks and feels like? Where do you go from here?
Metrics Can Guide Next Steps
This clinical scenario is not uncommon. As a psychiatrist consultant in primary care, I often encounter the following comment and question: “Someone isn’t feeling better. I have them taking an SSRI and doing psychotherapy. What is the next thing to do?” In discussions with supervisees and in training residents, I often say that you will know that your consultations have made a real impact on providers’ practices when these questions shift from “what’s the next medication or treatment” to a more robust baseline and follow-up inventory of symptoms via common and available metrics (PHQ9A, PSC-17 or 30, SCARED) shared with you at the start, the middle, and at other times of treatment. Such metrics can more meaningfully guide your collaborative clinical discussions and decisions.
Tracking baseline metrics and follow-up with treatment interventions is a transformative approach to clinical care. But, in primary care, it’s common that the question around mental health care may not receive the same robust screening and tracking of symptoms which have the power to more thoughtfully guide decision-making, even though this is common in other forms of patient care which have more routine use of more objective data.
Measurement-based treatment to target approaches are well-studied, but not often or always implemented. They involve providing a baseline metric (PHQ9A, Pediatric Symptom Checklist 17 or 30, GAD7, or SCARED), and tracking that metric for response over time using specific scores for decision points.
An Alternative Clinical Scenario
Consider the following alternative scenario for the above patient using a measurement-based treatment to target approach:
Lilly is a 15-year-old girl in her sophomore year of high school with symptoms concerning for depression. A PHQ9A is administered in your appointment, and she scores 20 out of 30, exceeding the threshold score for 11 for depression. You start her on an SSRI and recommend psychotherapy in the form of CBT offered through your office. She returns to the appointment with you in 2 weeks and then again in another 2 weeks. You obtain a PHQ9A at each appointment, and track the change with her and her parents over time.
You share with her and the family that it is common that there will be fluctuations in measurements, and you know that a score change on the PHQ9A greater than 7 is considered a clinically significant, reliable change. So, a PHQ9 score reduction from 20 to 13 would be meaningful progress. While seeking a score within the normal and non-clinical range, the progress can be tracked in a way that allows a more robust monitoring of treatment response. If the scores do not improve, you can see that and act accordingly. This way of using metrics shifts the conversation from “how are you feeling now and today” to tracking symptoms more broadly and tracking those individual symptoms over time, some of which may improve and some which may be trickier to target.
Such a way of tracking common mental health symptoms with a focus on having data at baseline and throughout treatment allows a provider to change or adapt interventions, and to not chase something that can feel ephemeral, such as “feeling happy or looking better.”
For additional information on the measurement-based treatment to target approach, there are resources that share in more depth the research informing this approach, and other and broader real ways to integrate these practices into your own visits:
- Is Treatment Working? Detecting Real Change in the Treatment of Child and Adolescent Depression
- AACAP Clinical Update: Collaborative Mental Health Care for Children and Adolescents in Primary Care
Pawlowski is a child and adolescent consulting psychiatrist. She is a division chief at the University of Vermont Medical Center where she focuses on primary care mental health integration within primary care pediatrics, internal medicine, and family medicine.
Rheumatology Match: Less than Half of Pediatric Positions Filled, Worsening Existing Trend
Over half of pediatric rheumatology fellowship positions went unfilled in 2024, according to the National Resident Matching Program (NRMP). Comparatively, nearly all adult rheumatology positions were filled.
Across all 39 subspecialties in internal medicine and pediatrics, there was an 86% fill rate. In pediatric subspecialties, the fill rate was 78%. There were more than 10,200 applicants in this year’s medicine and pediatric specialties match — a 9% increase from 2023 — and 81% matched to a position.
The NRMP reported that adult rheumatology filled 129 (97.7%) of 132 programs, with 284 (99%) out of 287 positions filled. In 2024, there were five new programs and 11 more fellowship positions available compared with the previous year.
In pediatric rheumatology, 16 (44%) of 36 programs were filled, with 27 (49%) of 55 positions filled. This is a notable decrease from 2023, where pediatric rheumatology filled 21 of 38 programs (55%) and 32 (62%) of 52 positions.
This year, 27 of 30 applicants preferring pediatric rheumatology matched to a program, while in 2023 all 32 applicants that preferred pediatric rheumatology matched.
“It’s a little disappointing that our overall number of applicants have not gone up,” Jay Mehta, MD, the program director of the Children’s Hospital of Philadelphia’s pediatric rheumatology fellowship said in an interview with Medscape Medical News. “It’s an especially exciting time in pediatric rheumatology, with really fantastic breakthroughs in terms of treatments and diagnostics. Unfortunately, that excitement hasn’t necessarily translated into more interest in our field.”
Mehta noted that the number of applicants to pediatric rheumatology fellowships have remained relatively consistent. Since 2019, the number of applicants has ranged from 28 to 33.
“Given the low number of overall positions/programs it is hard to read too much into year-to-year differences,” added Kristen Hayward, MD, a pediatric rheumatologist at Seattle Children’s in Washington. “While this total number of applicants per year is steady, this number is insufficient to build an adequate workforce for our current needs, much less for the future.”
This year, matched applicants to pediatric rheumatology included 13 MD graduates, eight DO graduates, five foreign applicants, and one US citizen international medical graduate.
In adult rheumatology, matched applicants included 108 MD graduates, 97 foreign applicants, 41 DO graduates, and 38 US citizen international medical graduates. A total of 365 applicants preferred the specialty, and 76% matched to rheumatology. Seven applicants matched to another specialty, and the remaining 79 did not match to any program.
Rheumatology was one of several specialties offering at least 150 positions with a fill rate of over 98%. The other specialties included allergy and immunology, cardiovascular disease, clinical cardiac electrophysiology, endocrinology, gastroenterology, and hematology and oncology.
While some pediatric subspecialties like critical care medicine and cardiology had fill rates over 90%, many “cognitive subspecialties” beyond pediatric rheumatology also struggled to fill spots, Hayward noted. Only 37% of pediatric nephrology positions and 48% of pediatric infectious disease positions were filled this year, in addition to a decline in filled pediatric-residency positions overall, she added.
Mehta had no relevant disclosures. Hayward previously owned stock/stock options for AbbVie/Abbott, Cigna/Express Scripts, Merck, and Teva and has received an educational grant from Pfizer.
A version of this article first appeared on Medscape.com.
Project’s Improvement in JIA Outcome Disparities Sets Stage for Further Interventions
WASHINGTON — A quality improvement project aimed at reducing racial disparities in juvenile idiopathic arthritis (JIA) led to a modest reduction in the overall clinical Juvenile Arthritis Disease Activity Score (cJADAS) and a 17% reduction in the disparity gap between Black and White patients, according to a study presented at the annual meeting of the American College of Rheumatology.
“Our work has led to initial progress in all groups, but we did not fully close the gap in outcomes,” Dori Abel, MD, MSHP, an attending rheumatologist at Children’s Hospital of Philadelphia in Pennsylvania, told attendees. But the project still revealed that it’s feasible to improve outcomes and reduce disparities with a “multipronged, equity-driven approach,” she said. “Stratifying data by demographic variables can reveal important differences in health care delivery and outcomes, catalyzing improvement efforts.”
Giya Harry, MD, MPH, MSc, an associate professor of pediatric rheumatology at Wake Forest University School of Medicine in Winston-Salem, North Carolina, was not involved in the study but praised both the effort and the progress made.
“The results are promising and suggest that with additional interventions targeting other key drivers, the team may be successful in completely eliminating the disparity in outcomes,” Harry said in an interview. “I applaud the hard work of Dr Abel and the other members of the team for doing the important work of characterizing the very complex issue of disparities in JIA outcomes across different race groups.”
It will now be important to build upon what the physicians learned during this process, said Harry, also the chair of the Diversity, Equity, Inclusion, and Accessibility committee of the Childhood Arthritis and Rheumatology Research Alliance.
“Patience is needed as they cycle through interventions with an emphasis on other key drivers” of disparities, Harry said.
Targeting Factors That Clinicians Can Potentially Influence
In her presentation, Abel discussed the various barriers that interfere with patients’ ability to move up the “JIA escalator” of getting referred and diagnosed, starting treatment and getting control of the disease, and monitoring and managing the disease and flares. These barriers include difficulties with access, trust, finances, insurance, caregivers’ missed work, medication burden, side effects, system barriers, and exhaustion and depression among caregivers and patients.
These barriers then contribute to disparities in JIA outcomes. In the STOP-JIA study, for example, Black children had greater polyarthritis disease activity in the first year and greater odds of radiographic damage, Abel noted. At her own institution, despite a mean cJADAS of 2.9 for the whole population of patients with JIA, the average was 5.0 for non-Hispanic Black patients, compared with 2.6 for non-Hispanic White patients.
The team therefore developed and implemented a quality improvement initiative aimed at improving the overall mean cJADAS and narrowing the gap between Black and White patients. The goal was to reduce the mean cJADAS to 2.7 by July 2024 and simultaneously reduce the cJADAS in Black patients by 1.2 units, or 50% of the baseline disparity gap, without increasing the existing gap.
The team first explored the many overlapping and interacting drivers of disparities within the realms of community characteristics, JIA treatment course, patient/family characteristics, organizational infrastructure, divisional infrastructure, and provider characteristics. While many of the individual factors driving disparities are outside clinicians’ control, “there are some domains clinicians may be able to directly influence, such as provider characteristics, JIA treatment course, and possibly divisional infrastructure,” Harry noted, and the team appeared to choose goals that fell under domains within clinicians’ potential influence.
The research team focused their efforts on four areas: Consistent outcome documentation, application of JIA best practices, providing access to at-risk patients, and team awareness and agency.
As part of improving consistent outcome documentation, they integrated outcome metrics into data visualization tools so that gaps were more evident. Applying JIA best practices included standardizing their approach to assessing medication adherence and barriers, with changes to the JIA note templates in the electronic health record and updates to medication adherence handouts.
Providing access to at-risk patients included several components:
- Creating a population management team
- Defining a target population to engage with for earlier follow-up
- Using a monthly batch outreach to defined patients
- Having a coordinator or social worker reach out to those who don’t make appointments
- Using a new JIA/high disease activity video follow-up program.
Finally, team awareness and agency involved giving physicians monthly access to mean cJADAS values for their own patients and at the division level. They also held quarterly disparity mitigation workshops.
Although the institution’s JIA population grew 13%, from 776 to 878 patients, over the course of the study, from January 2023 to May 2024, there was minimal change in the characteristics of the patient population. By May 2024, two thirds of patients (68%) were women, and 23% had public insurance. The population included 67% non-Hispanic White, 9% Hispanic/Latino, 7% non-Hispanic Black, and 4% Asian patients.
One third of the patients (32%) had the oligoarticular subtype, and other subtypes included enthesitis-related at 16%, polyarticular rheumatoid factor (RF)–negative at 15%, systemic at 7%, psoriatic at 6%, undifferentiated at 5%, and polyarticular RF-positive at 4%; data on subtype were unavailable for 14%. Most of their patients (71%) were in a high or very high quintile of the Childhood Opportunity Index, and 12% were in a low or very low quintile.
Results of the Quality Improvement Project
As of May 2024, the team had reached most of the goals they had set in terms of individual metrics. They met their goal of having a complete cJADAS calculated in more than 80% of JIA visits each month. With a goal of having over 90% of JIA monthly visits include disease activity target attestations, they reached 95% by May.
They aimed to have over half of JIA monthly visits include documentation of medication adherence/barrier assessment, and 75% of monthly visits had one. For their monthly outreach goal for overdue visits, they aimed to contact more than 75% of patients within 30 days if they were newly overdue for a follow-up visit but had only reached 47% by May 2024. The team had also completed 154 Maintenance of Certification assessments by May.
From initiation of project planning in January 2023 through May 2024, the overall JIA patient population experienced an improvement in cJADAS from 2.9 to 2.54. In individual cJADAS components, the mean patient global score improved from 1.71 to 1.47, the physician global score improved from 0.81 to 0.75, and the joint count score improved from 0.71 to 0.68.
In the non-Hispanic Black population, the mean cJADAS improved from 5.06 in January 2023 to 4.31 in May 2024. Mean cJADAS in the non-Hispanic White population fell from 2.63 to 2.29. With a difference of 0.4 points fewer between the Black and White populations, the disparity gap closed by 17%.
One of the team’s next steps will be to focus on the Hispanic population in 2024-2025 by optimizing language services, working toward greater family involvement to better understand barriers to care, and ongoing population management.
Abel and Harry had no disclosures. No external funding was noted.
A version of this article appeared on Medscape.com.
FROM ACR 2024
Could Biomarkers Help to Detect Lung Disease Earlier in Systemic JIA?
WASHINGTON — Children who have systemic juvenile idiopathic arthritis with lung disease (sJIA-LD) have distinct biomarker profiles that may hold potential in eventually detecting LD earlier and identifying personalized treatment, according to research presented at the American College of Rheumatology (ACR) 2024 Annual Meeting.
Established risk factors for LD, which affects up to 1 in every 20 patients with sJIA, include being of a younger age, having more macrophage activation syndrome (MAS) episodes, and having more adverse reactions to biologics, Esraa Eloseily, MD, MS, an assistant professor of pediatrics at UT Southwestern Children’s Medical Center, Dallas, told attendees.
“The pathophysiology remains unclear and debate centers around elevated IL-18 [interleukin 18] and T-cell activation in association with HLA-DRB1*15/DRESS [drug reaction with eosinophilia and systemic symptoms] reactions to biologics, and thus, we have urgent unmet needs to understand the prevalence, the pathogenesis, disease biomarkers, and influence of biologics,” Eloseily said.
Their study confirmed that patients with LD tended to be younger and have more MAS. The researchers also found lower hemoglobin and higher white blood cell counts and platelets in patients with sJIA-LD, as well as a higher medication burden, particularly with steroids, biologics, and Janus kinase (JAK) inhibitors.
Randy Cron, MD, PhD, director of the Division of Pediatric Rheumatology at the University of Alabama at Birmingham, attended the presentation and noted that every additional piece of information is helpful in filling out the picture of what we know and can predict about sJIA-LD development.
“We’re all learning as we go, so the more people that study this, the better,” Cron told Medscape Medical News. “Even if it’s just seeing things that other groups have seen or really solidifying the risk factors for the development of lung disease, I think, at this point, that’s one of the most clinically relevant things: Do we screen? Who do we screen? Certainly, kids who have very young age of onset, children who develop macrophage activation syndrome, children who have high IL-18 levels.”
Study Results
The study compared 37 patients with sJIA-LD from 16 Childhood Arthritis and Rheumatology Research Alliance (CARRA) Registry sites with 141 patients with sJIA but without LD who had similar follow-up durations in the CARRA Registry.
Disease duration for patients with sJIA-LD was defined as the time from their initial sJIA diagnosis to their baseline sJIA-LD cohort visit, which was considered their index visit. In patients without LD, duration was from their enrollment in the CARRA Registry to their last CARRA Registry visit, which was considered their index visit.
The patients with sJIA-LD were significantly younger — a median age of 1 year — at onset of sJIA than those without LD, who had a median age of 5 years (P < .0019). The patients with sJIA-LD were also younger (median age, 7 years) at their index visit than those without LD (median age, 10 years) (P < .0001).
There were also significant differences in medication usage between those with and without LD. While 40.5% of patients with sJIA-LD were using steroids at their index visit, only 11.4% of those without LD were using steroids (P < .0001). Yet the mean dose of steroids was significantly lower in those with LD (5.45 mg/d) than in those without (20.7 mg/d). In addition, nearly half the patients with sJIA-LD had ever used cyclosporin A (45.7%) compared with 2.8% of those without LD (P < .0001), and 17.1% of patients with sJIA-LD had used mycophenolate mofetil compared with 0.7% of those without LD (P = .0002).
Similar disparities were seen for usage of biologics and JAK inhibitors: Anakinra (82.9% vs 56.7%; P = .0036), abatacept (8.6% vs 1.4%; P = .053), tofacitinib (57.1% vs 5.7%; P < .0001), ruxolitinib (25.7% vs 0%; P < .0001), baricitinib (8.6% vs 0%; P = .007), and emapalumab (23% vs 0.7%; P < .0001). Further, 5.7% of those with sJIA-LD had taken etoposide and 22.9% had received intravenous immunoglobulin compared with 0% and 4.3%, respectively, in those without LD (P = .04 and P = .001).
Laboratory parameters of patients with sJIA-LD were also significantly different from those of patients without LD, including a higher white blood cell count (8.8 × 10⁹/L vs 8.1 × 10⁹/L; P = .01), higher platelets (316.5 × 10⁹/L vs 311.2 × 10⁹/L; P = .03), and lower hemoglobin (11.5 g/dL vs 12.6 g/dL; P = .007). Ferritin levels trended nonsignificantly higher in patients with sJIA-LD (506 ng/mL vs 173.2 ng/mL; P = .09), and aspartate aminotransferase levels were significantly higher (37 U/L vs 28.72 U/L; P < .0001).
Patients’ overall well-being was “unexpectedly” higher in patients with sJIA-LD (P = .007), Eloseily noted, including the parent/patient rating (P = .027). However, more of the patients without LD had an excellent (61%) or very good (20.4%) health-related quality of life compared with those with LD (13% and 39%), and nearly one third of patients with sJIA-LD (30.4%) had only fair health-related quality of life compared with 5.5% without LD (P = .0002).
In line with known risk factors, most of the patients with sJIA-LD had a prior MAS episode (67.6%) compared with 10.6% of those without LD (P < .0001). Mortality was also higher in those with LD, two of whom died, whereas none without LD died (P = .04).
While existing biomarkers have been reported, they lack independent validation, Eloseily told attendees. Among the known key biomarkers are IL-18/interferon (IFN)-gamma axis, which are known to drive MAS and pulmonary inflammation, especially in those with MAS and LD; ICAM-5 and MMP-7, which is linked to fibrosis and tissue remodeling; and CCL11, CCL17, and GDF-15, which is linked to fibrosis and inflammation.
Because the CARRA Registry has limited availability of biosamples for most patients, the researchers used plasma samples from the FROST study for 27 patients with sJIA-LD and 46 patients without LD. When they compared 23 biomarkers between the groups, most of the known key biomarkers, as well as several other biomarkers, were significantly elevated in those with LD compared with in those without:
- MMP-7 (P = .001)
- IFN gamma (P = .008)
- CCL11 (P < .0001)
- CCL17 (P = .002)
- CCL15 (P < .0001)
- MCP-1 (P = .0003)
- MCP-3 (P = .02)
- CCL25 (P < .0001)
- CD25 (P < .0001)
- GDF-15 (P < .0001)
- TRAIL (P < .0001)
- IL-23 (P = .002)
They found that IL-18 only trended higher (P = .07), and there were not adequate data for ICAM-5.
The study was limited by the differences in disease duration between the compared groups and the limited availability of biosamples, which they only had from patients enrolled in the FROST study.
The research was funded by CARRA and the Arthritis Foundation. Eloseily reported no disclosures. Cron reported serving as an adviser for AbbVie/Abbott and Sobi, receiving grant funding and speaking and consulting fees from Pfizer, and receiving royalties from Springer.
A version of this article appeared on Medscape.com.
FROM ACR 2024
Can We Fight Social Media’s Promotion of Junk Food?
Of those three truths, the one that tends to get more public health attention is advertising. More specifically, advertising junk food to kids.
Back in the days when cable television was king of all free time, study after study tried to quantify junk- and fast-food advertising to kids and speculated about its impact on childhood obesity rates. But as broadcast television use began fading, advertisers — and, of course, studies about advertising — turned their attention first to gaming and now to social media.
The social media numbers are quite staggering. According to a study published — probably not coincidentally — on Halloween, looking at the 40 top brands of junk- and fast food sold in Canada, those 40 brands alone were mentioned over 16 million times by social media users, reaching an estimated 42 billion total users within a 1-year period.
And unique to the challenge of junk- and fast-food advertising on social media is that it also includes “earned” advertising, the kind not paid for by manufacturers but rather the kind where friends, family, and influencers post about junk food. Occasionally, though, these lines are blurred by initiatives from fast-food manufacturers explicitly encouraging social sharing. Consequently, even were there a desire, there isn’t likely to be a regulatory mechanism to markedly reduce it.
For years, here in North America, excepting Quebec, the desire has been mainly to just talk about how concerned we are about junk-food advertising to kids. Elsewhere, however, some countries tried to do more, including both Mexico and Chile, which put kid-targeted TV food advertising bans in place in 2014 and 2016, respectively.
Did they work? It depends on what outcome you’re considering. If the question is, did they work in regard to obesity? — which is how everyone tends to frame the question — by themselves, probably not. No one sandbag stops a flood, and though junk-food advertising is certainly a sandbag, we’re still facing a torrential downpour of obesity contributors. No doubt they did work to reduce kids’ exposure to junk-food advertising on television, but what remains to be seen is whether there is a means to now tackle social media’s generous servings of the same. Moreover, the obesity lens is the wrong one. Ultraprocessed food consumption isn’t good for anyone, regardless of weight, and its reduced marketing and consumption is a worthy goal of its own.
But Chile and Mexico are filling more than single sandbags, as both countries have rolled out a suite of interventions they are hoping will help improve nutrition: from front-of–package labeling reforms and warnings, to the banning of advertising geared specifically to appeal to children (like sugary cereal cartoon mascots), to implementing sugar-sweetened-beverage taxes, to having blanket overall bans on food advertising during the daytime.
Mexico is even taking first steps to start addressing junk food’s ubiquity by banning its sale in schools altogether. Schools found to be selling common Mexican junk food fare, such as sugary fruit drinks; chips; artificial pork rinds; and soy-encased, salty peanuts with chili, will see their administrators facing heavy fines.
Because therein lies the biggest rub. Going back to those three simple truths, junk food is hyperpalatable and consequently tends to be what we crave when we’re hungry. So even if we miraculously one day do more than just talk about advertising reforms, and especially given that we won’t be able to do anything about social media’s earned product placements, junk food’s ubiquitous availability within arms’ reach or on our Uber Eats apps will see us be likely to continue its excessive consumption.
That’s not to say we shouldn’t emulate Mexico and Chile’s initiatives, nor that they shouldn’t continue to build upon them, but one thing is certain: Human nature and inconvenient truths around food are incredibly powerful forces that we haven’t yet figured out how to tame.
Dr. Freedhoff, Associate Professor, Department of Family Medicine, University of Ottawa; Medical Director, Bariatric Medical Institute, Ottawa, Ontario, Canada, has disclosed relevant financial relationships with Bariatric Medical Institute, Constant Health, Novo Nordisk, and Weighty Matters.
A version of this article appeared on Medscape.com.
National Noncompete Ban Unlikely to Survive Under Trump, Experts Say
Even before the presidential election, the Federal Trade Commission’s (FTC) national ban on noncompete clauses faced a tough battle for survival in the courts.
Now, legal specialists forecast a grim prognosis for the ban under Donald Trump’s return to the White House.
But a federal district’s court ruling put the ban on hold, and the Trump administration isn’t expected to support lifting the ban.
“It is likely that the Trump administration will decline to defend the rule and may not even appeal the district court’s ruling, which means that the ban on noncompetes will not go into effect,” Steven Lubet, JD, a professor emeritus at Northwestern University Pritzker School of Law, Chicago, Illinois, said in an interview.
What’s in a Noncompete Clause?
Noncompete clauses in employee contracts typically restrict when and where workers can take future jobs. In medicine, supporters argue that the clauses are fair. Hospitals and practices provide a base of patients to physicians, they say, in return for their agreement not to go work for a competitor.
But those opposed to these clauses argue that the restrictions harm careers and hurt patients by unfairly preventing physicians from moving to new jobs where they’re needed.
At an April meeting, the FTC board voted 3 to 2 to ban noncompete clauses; some nonprofit organizations and senior executives were expected to be exempt. The FTC estimated that the move would save the healthcare system alone as much as $194 billion over 10 years.
“A pandemic killed a million people in this country, and there are doctors who cannot work because of a noncompete,” declared FTC Commissioner Alvaro Bedoya.
Hospitals protested the move. In a statement, the general counsel for the American Hospital Association called it “bad law, bad policy, and a clear sign of an agency run amok” and said the FTC ignored “mountains of contrary legal precedent and evidence about its adverse impacts on the health care markets.”
Although the American Medical Association does not support a total ban, its House of Delegates adopted policies in 2023 to support the prohibition of noncompete contracts for physicians employed by for-profit and nonprofit hospitals, hospital systems, or staffing companies.
Texas Federal Judge Intervenes to Halt Ban
The ban was supposed to take effect on Sept. 4, 2024. But Texas federal judge Ada E. Brown struck down the ban in an Aug. 20 decision. She ruled that the FTC went beyond its authority.
“The district court based its ruling on a very dubious distinction between ‘unfair practices,’ which the FTC may prohibit, and ‘unfair competition,’ which, according to the court, it may not,” said Lubet.
In fact, the ban should stand, he said. “This is a classic case of the government intervening on behalf of consumers/patients by prohibiting an unfair and harmful employment practice,” Lubet said.
Amanda Hill, an attorney in Austin, Texas, who trains physicians about how to negotiate contracts, has a different take. “The Federal Trade Commission came down hard, and honestly, it really overstepped,” she said in an interview. “Congress needs to write laws, not regulatory bodies. I think all the lawyers went: ‘Good try, but you’re not going to get anywhere with that.’ ”
She noted that physicians themselves are divided over the value of noncompete clauses. “I would say 80% of my clients can’t stand noncompetes.” But another 20% own their own practices and hate the idea of losing their physicians to competitors, she said.
Trump Isn’t Seen as Likely to Support Ban
While the Biden administration firmly supported a ban on noncompete clauses, there isn’t a strict Democratic-Republican divide over whether the agreements are a good idea. Some red states have embraced bans, and Hill said this can make sense from a Republican point of view: “We don’t want to run doctors out of town and out of the state because they think they’re going to be bound by big hospitals and corporate interests.”
In fact, former Florida congressman Matt Gaetz, a Republican briefly tapped as President-elect Trump’s nominee for attorney general, supports noncompete clauses. He filed a friend-of-the-court brief with the Texas judge that supported the FTC’s ruling, saying it is a “vindication of economic freedom and free enterprise.”
But Republicans generally “believe that federal agencies are going too far and beyond the power granted to them by Congress,” Atlanta, Georgia, attorney Benjamin Fink, Esq., said in an interview.
And Trump is no fan of the FTC and its chair, Lina Khan, who may step down. Observers don’t expect that the Trump administration or a newly constituted FTC board will support an appeal of the Texas judge’s ruling.
“I don’t think anybody else — another agency or a private party — could step in place of the FTC if the FTC declines to defend the ban,” Atlanta attorney Neal F. Weinrich, Esq., said in an interview. In that case, “I think it ends.”
Attorneys Weinrich and Fink work at the same firm, which handles noncompete agreements for physicians.
Noncompete Ban Advocates Turn to States
Even if Kamala Harris had won the presidency, a national ban on noncompete clauses would have faced an uphill battle at the Supreme Court.
“The Supreme Court majority has been unsympathetic to administrative agencies, interpreting their authority very narrowly,” said Lubet.
So what happens to noncompete clauses now? While bipartisan bills in Congress have tried to ban them, legislation is unlikely to pass now that Republicans will control both the House and Senate, Fink said.
According to a recent article, 12 states prohibit noncompete clauses for physicians: Alabama, California, Colorado, Delaware, Massachusetts, Montana, New Hampshire, New Mexico, North Dakota, Oklahoma, Rhode Island, and South Dakota.
The remaining states allow noncompetes in some form, often excluding them for employees earning below a certain threshold. For example, in Oregon, noncompete agreements may apply to employees earning more than $113,241. Most states have provisions to adjust the threshold annually. The District of Columbia permits 2-year noncompetes for “medical specialists” earning over $250,000 annually.
Indiana employers can no longer enter into noncompete agreements with primary care providers. Other specialties may be subject to the clauses, except when the physician terminates the contract for cause or when an employer terminates the contract without cause.
“I definitely think states are going to continue to restrict the use of noncompetes,” Fink said.
Lubet has no disclosures. Hill, Fink, and Weinrich represent physicians in contract negotiations.
A version of this article appeared on Medscape.com.