User login
Patch Test–Directed Dietary Avoidance in the Management of Irritable Bowel Syndrome
Irritable bowel syndrome (IBS) is one of the most common disorders managed by primary care physicians and gastroenterologists.1 Characterized by abdominal pain coinciding with altered stool form and/or frequency as defined by the Rome IV diagnostic criteria,2 symptoms range from mild to debilitating and may remarkably impair quality of life and work productivity.1
The cause of IBS is poorly understood. Proposed pathophysiologic factors include impaired mucosal function, microbial imbalance, visceral hypersensitivity, psychologic dysfunction, genetic factors, neurotransmitter imbalance, postinfectious gastroenteritis, inflammation, and food intolerance, any or all of which may lead to the development and maintenance of IBS symptoms.3 More recent observations of inflammation in the intestinal lining4,5 and proinflammatory peripherally circulating cytokines6 challenge its traditional classification as a functional disorder.
The cause of this inflammation is of intense interest, with speculation that the bacterial microbiota, bile acids, association with postinfectious gastroenteritis and inflammatory bowel disease cases, and/or foods may contribute. Although approximately 50% of individuals with IBS report that foods aggravate their symptoms,7 studies investigating type I antibody–mediated immediate hypersensitivity have largely failed to demonstrate a substantial link, prompting many authorities to regard these associations as food “intolerances” rather than true allergies. Based on this body of literature, a large 2010 consensus report on all aspects of food allergies advises against food allergy testing for IBS.8
In contrast, by utilizing type IV food allergen skin patch testing, 2 proof-of-concept studies9,10 investigated a different allergic mechanism in IBS, namely cell-mediated delayed-type hypersensitivity. Because many foods and food additives are known to cause allergic contact dermatitis,11 it was hypothesized that these foods may elicit a similar delayed-type hypersensitivity response in the intestinal lining in previously sensitized individuals. By following a patch test–guided food avoidance diet, a large subpopulation of patients with IBS experienced partial or complete IBS symptom relief.9,10 Our study further investigates a role for food-related delayed-type hypersensitivities in the pathogenesis of IBS.
Methods
Patient Selection
This study was conducted in a secondary care community-based setting. All patients were self-referred over an 18-month period ending in October 2019, had physician-diagnosed IBS, and/or met the Rome IV criteria for IBS and presented expressly for the food patch testing on a fee-for-service basis. Subtype of IBS was determined on presentation by the self-reported historically predominant symptom. Duration of IBS symptoms was self-reported and was rounded to the nearest year for purposes of data collection.
Exclusion criteria included pregnancy, known allergy to adhesive tape or any of the food allergens used in the study, severe skin rash, symptoms that had a known cause other than IBS, or active treatment with systemic immunosuppressive medications.
Patch Testing
Skin patch testing was initiated using an extensive panel of 117 type IV food allergens (eTable)11 identified in the literature,12 most of which utilized standard compounded formulations13 or were available from reputable patch test manufacturers (Brial Allergen GmbH; Chemotechnique Diagnostics). This panel was not approved by the US Food and Drug Administration. The freeze-dried vegetable formulations were taken from the 2018 report.9 Standard skin patch test procedure protocols12 were used, affixing the patches to the upper aspect of the back.
Following patch test application on day 1, two follow-up visits occurred on day 3 and either day 4 or day 5. On day 3, patches were removed, and the initial results were read by a board-certified dermatologist according to a standard grading system.14 Interpretation of patch tests included no reaction, questionable reaction consisting of macular erythema, weak reaction consisting of erythema and slight edema, or strong reaction consisting of erythema and marked edema. On day 4 or day 5, the final patch test reading was performed, and patients were informed of their results. Patients were advised to avoid ingestion of all foods that elicited a questionable or positive patch test response for at least 3 months, and information about the foods and their avoidance also was distributed and reviewed.
Food Avoidance Questionnaire
Patients with questionable or positive patch tests at 72 or 96 hours were advised of their eligibility to participate in an institutional review board–approved food avoidance questionnaire study investigating the utility of patch test–guided food avoidance on IBS symptoms. The questionnaire assessed the following: (1) baseline average abdominal pain prior to patch test–guided avoidance diet (0=no symptoms; 10=very severe); (2) average abdominal pain since initiation of patch test–guided avoidance diet (0=no symptoms; 10=very severe); (3) degree of improvement in overall IBS symptoms by the end of the food avoidance period (0=no improvement; 10=great improvement); (4) compliance with the avoidance diet for the duration of the avoidance period (completely, partially, not at all, or not sure).
Questionnaires and informed consent were mailed to patients via the US Postal Service 3 months after completing the patch testing. The questionnaire and consent were to be completed and returned after dietary avoidance of the identified allergens for at least 3 months. Patients were not compensated for participation in the study.
Statistical Analysis
Statistical analysis of data collected from study questionnaires was performed with Microsoft Excel. Mean abdominal pain and mean global improvement scores were reported along with 1 SD of the mean. For comparison of mean abdominal pain and improvement in global IBS symptoms from baseline to after 3 months of identified allergen avoidance, a Mann-Whitney U test was performed, with P<.05 being considered statistically significant.
Results
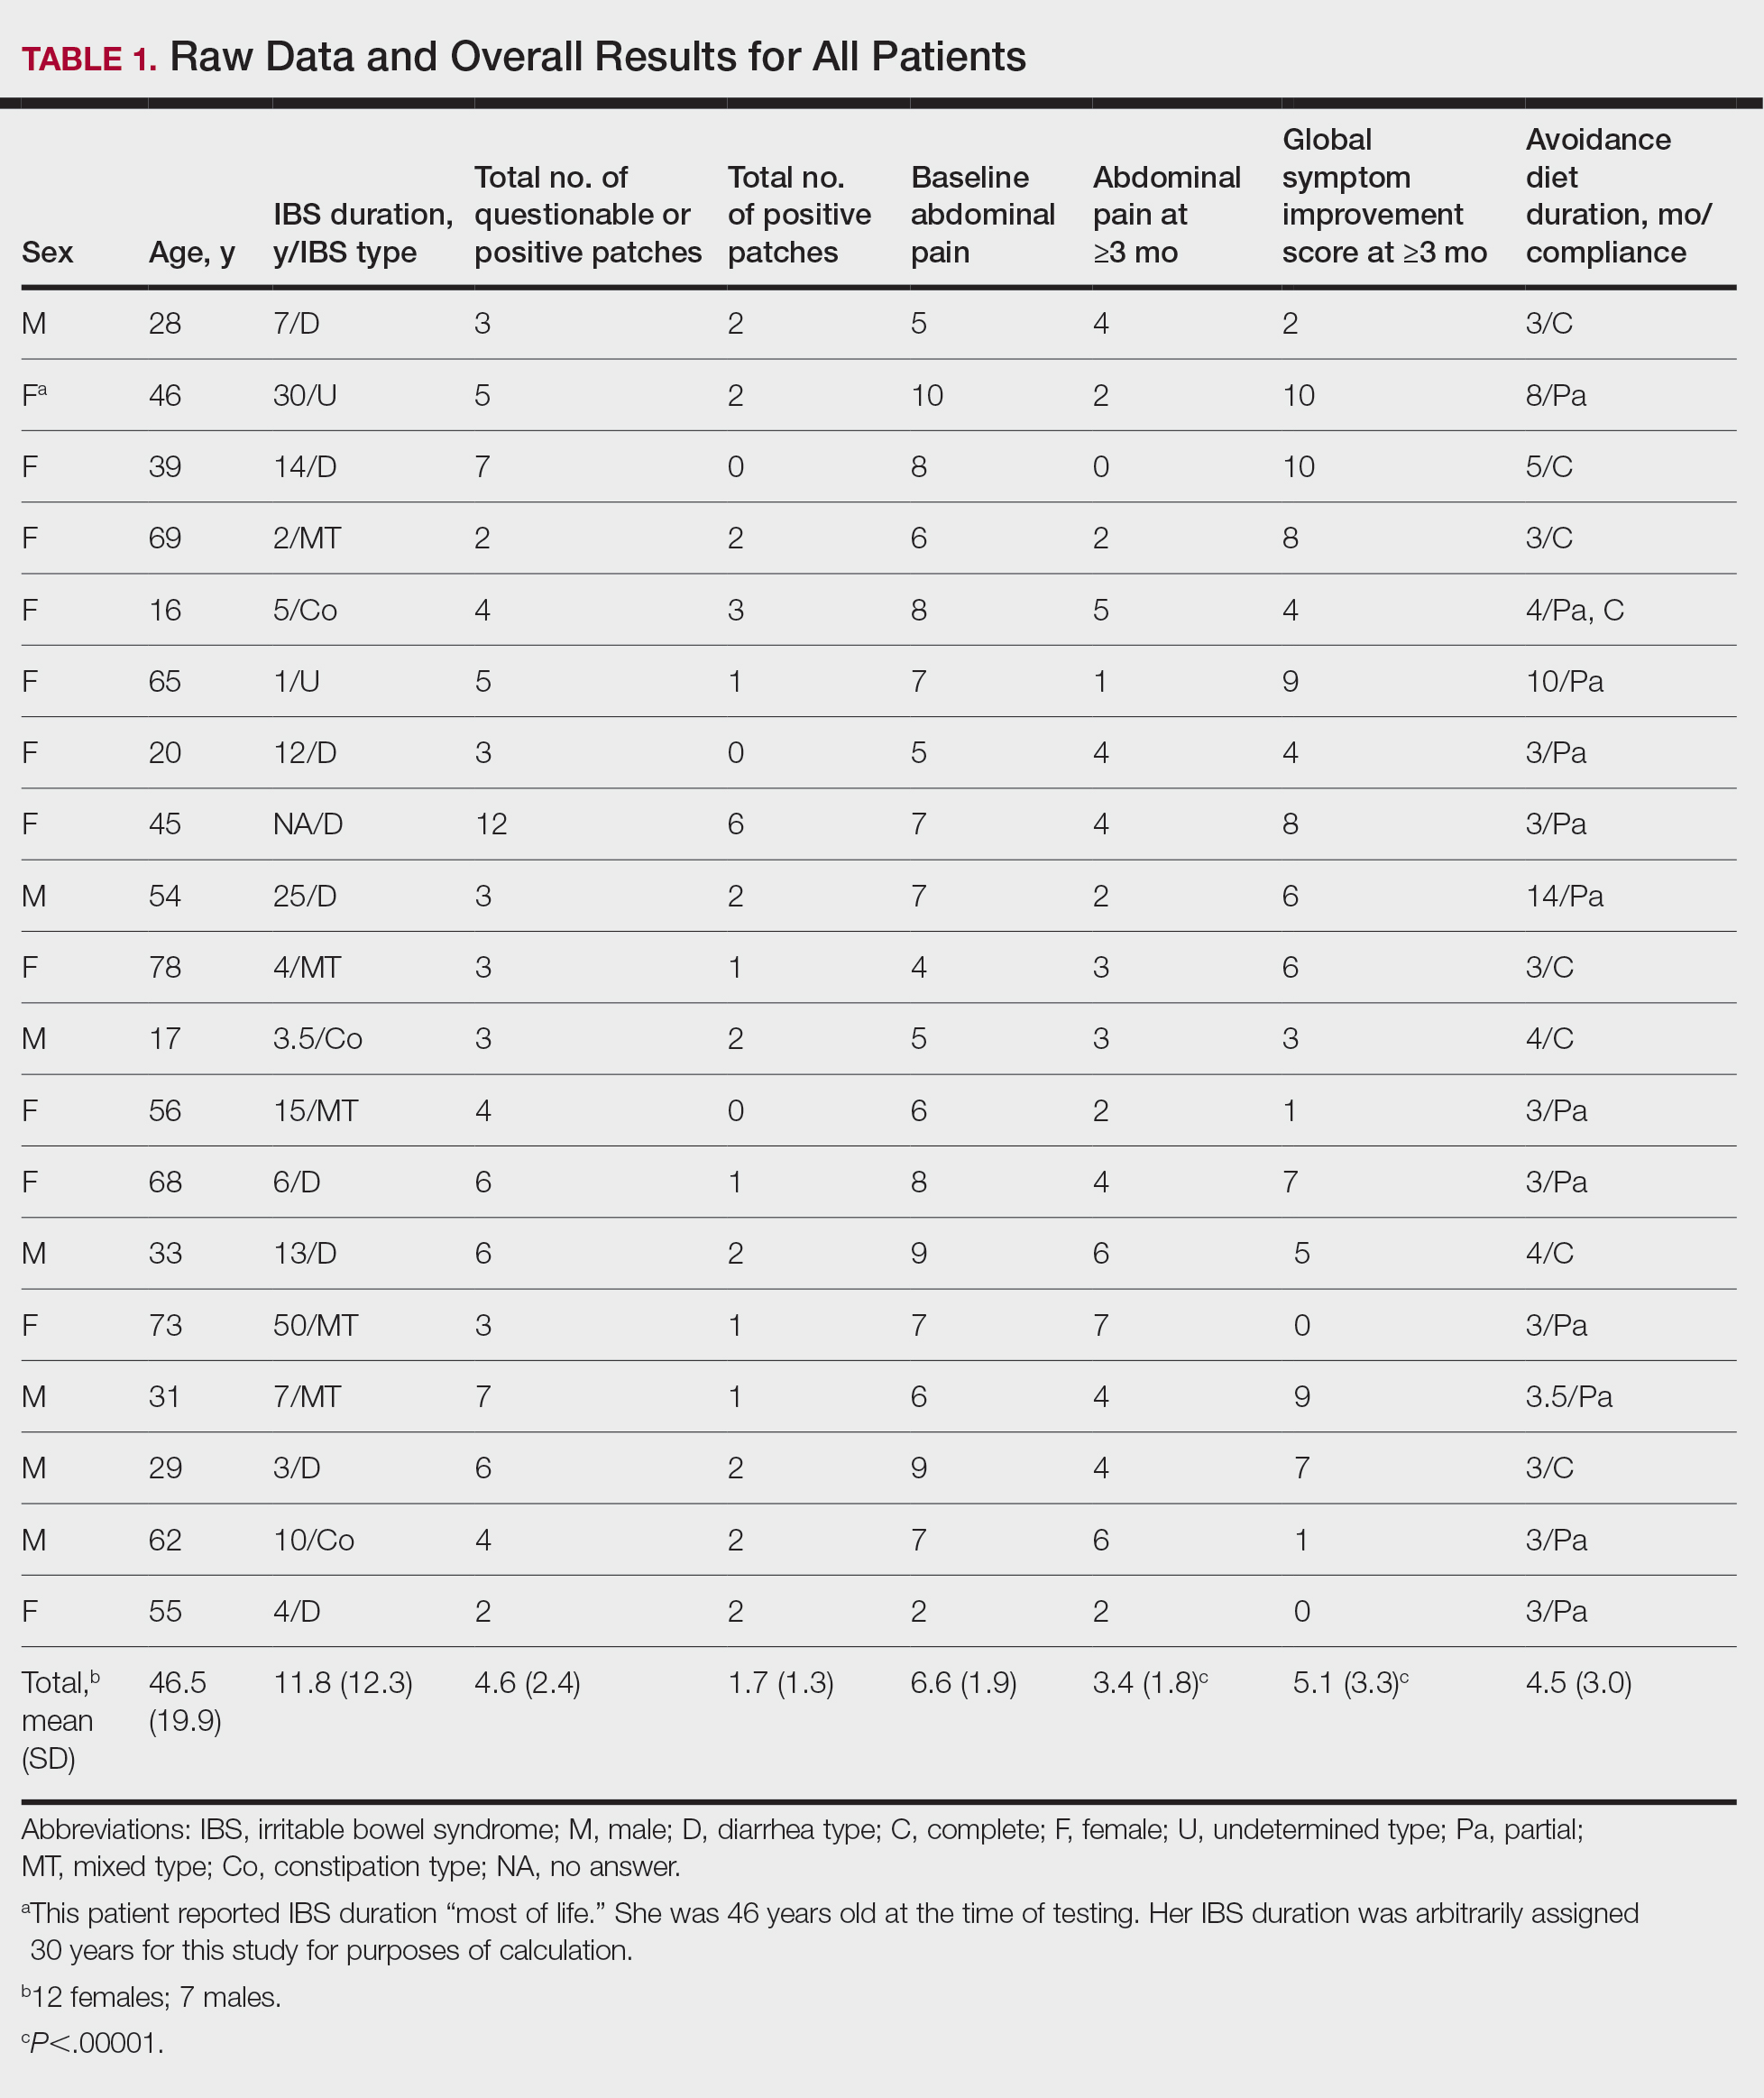
Thirty-seven consecutive patients underwent the testing and were eligible for the study. Nineteen patients were included in the study by virtue of completing and returning their posttest food avoidance questionnaire and informed consent. Eighteen patients were White and 1 was Asian. Subcategories of IBS were diarrhea predominant (9 [47.4%]), constipation predominant (3 [15.8%]), mixed type (5 [26.3%]), and undetermined type (2 [10.5%]). Questionnaire answers were reported after a mean (SD) duration of patch test–directed food avoidance of 4.5 (3.0) months (Table 1).
Overall Improvement
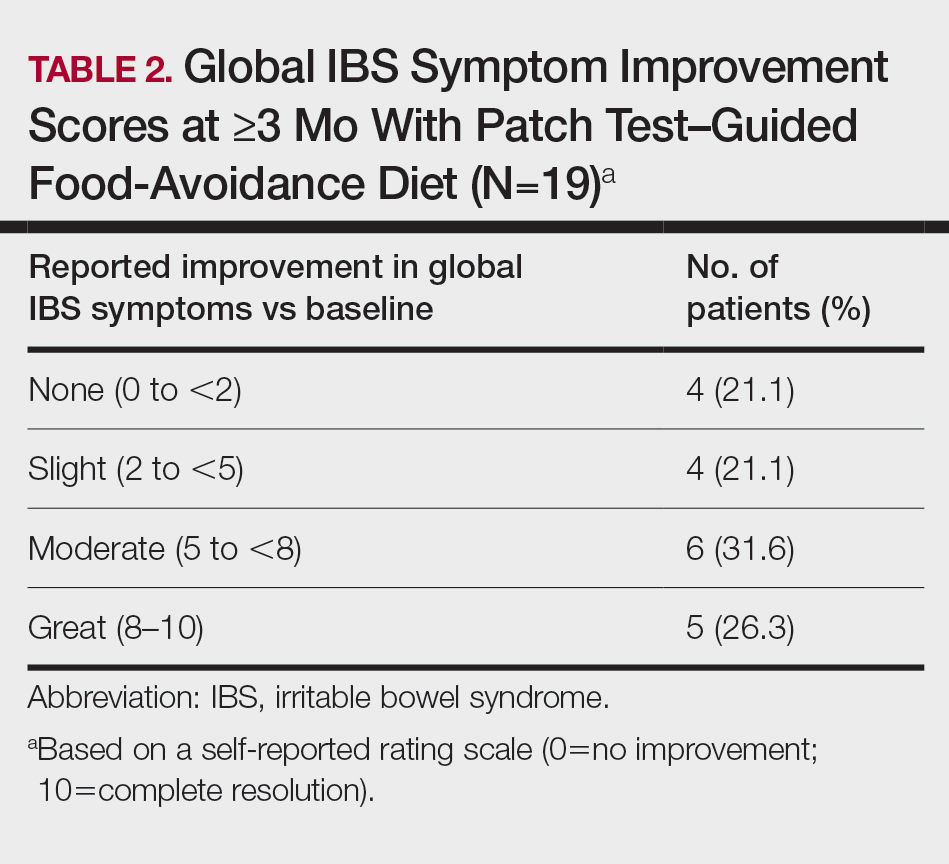
Fifteen (78.9%) patients reported at least slight to great improvement in their global IBS symptoms, and 4 (21.1%) reported no improvement (Table 2), with a mean (SD) improvement score of 5.1 (3.3)(P<.00001).
Abdominal Pain
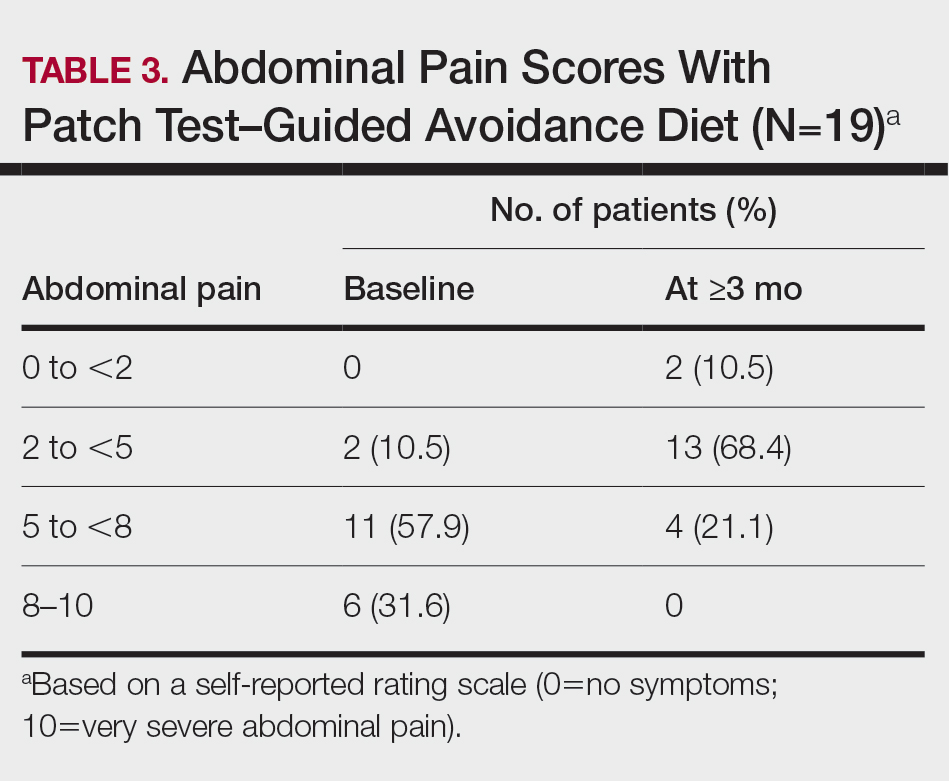
All 19 patients reported mild to marked abdominal pain at baseline. The mean (SD) baseline pain score was 6.6 (1.9). The mean (SD) pain score was 3.4 (1.8)(P<.00001) after an average patch test–guided dietary avoidance of 4.5 (3.0) months (Table 3).
Comment
Despite intense research interest and a growing number of new medications for IBS approved by the US Food and Drug Administration, there remains a large void in the search for cost-effective and efficacious approaches for IBS evaluation and treatment. In addition to major disturbances in quality of life,14,15 the cost to society in direct medical expenses and indirect costs associated with loss of productivity and work absenteeism is considerable; estimates range from $21 billion or more annually.16
Food Hypersensitivities Triggering IBS
This study further evaluated a role for skin patch testing to identify delayed-type (type IV) food hypersensitivities that trigger IBS symptoms and differed from the prior investigations9,10 in that the symptoms used to define IBS were updated from the Rome III17 to the newer Rome IV2 criteria. The data presented here show moderate to great improvement in global IBS symptoms in 58% (11/19) of patients, which is in line with a 2018 report of 40 study participants for whom follow-up at 3 or more months was available,9 providing additional support for a role for type IV food allergies in causing the same gastrointestinal tract symptoms that define IBS. The distinction between food-related studies, including this one, that implicate food allergies9,10 and prior studies that did not support a role for food allergies in IBS pathogenesis8 can be accounted for by the type of allergy investigated. Conclusions that IBS flares after food ingestion were attributable to intolerance rather than true allergy were based on results investigating only the humoral arm and failed to consider the cell-mediated arm of the immune system. As such, foods that appear to trigger IBS symptoms on an allergic basis in our study are recognized in the literature12 as type IV allergens that elicit cell-mediated immunologic responses rather than more widely recognized type I allergens, such as peanuts and shellfish, that elicit immediate-type hypersensitivity responses. Although any type IV food allergen(s) could be responsible, a pattern emerged in this study and the study published in 2018.9 Namely, some foods stood out as more frequently inducing patch test reactions, with the 3 most common being carmine, cinnamon bark oil, and sodium bisulfite (eTable). The sample size is relatively small, but the results raise the question of whether these foods are the most likely to trigger IBS symptoms in the general population. If so, is it the result of a higher innate sensitizing potential and/or a higher frequency of exposure in commonly eaten foods? Larger randomized clinical trials are needed.
Immune Response and IBS
There is mounting evidence that the immune system may play a role in the pathophysiology of IBS.18 Both lymphocyte infiltration of the myenteric plexus and an increase in intestinal mucosal T lymphocytes have been observed, and it is generally accepted that the mucosal immune system seems to be activated, at least in a subset of patients with IBS.19 Irritable bowel syndrome associations with quiescent inflammatory bowel disease or postinfectious gastroenteritis provide 2 potential causes for the inflammation, but most IBS patients have had neither.20 The mucosal lining of the intestine and immune system have vast exposure to intraluminal allergens in transit, and it is hypothesized that the same delayed-type hypersensitivity response elicited in the skin by patch testing is elicited in the intestine, resulting in the inflammation that triggers IBS symptoms.10 The results here add to the growing body of evidence that ingestion of type IV food allergens by previously sensitized individuals could, in fact, be the primary source of the inflammation observed in a large subpopulation of individuals who carry a diagnosis of IBS.
Food Allergens in Patch Testing
Many of the food allergens used in this study are commonly found in various nonfood products that may contact the skin. For example, many flavorings are used as fragrances, and many preservatives, binders, thickeners, emulsifiers, and stabilizers serve the same role in moisturizers, cosmetics, and topical medications. Likewise, nickel sulfate hexahydrate, ubiquitous in foods that arise from the earth, often is found in metal in jewelry, clothing components, and cell phones. All are potential sensitizers. Thus, the question may arise whether the causal relationship between the food allergens identified by patch testing and IBS symptoms might be more of a systemic effect akin to systemic contact dermatitis as sometimes follows ingestion of an allergen to which an individual has been topically sensitized, rather than the proposed localized immunologic response in the intestinal lining. We were unaware of patient history of allergic contact dermatitis to any of the patch test allergens in this study, but the dermatologist author here (M.S.) has unpublished experience with 2 other patients with IBS who have benefited from low-nickel diets after having had positive patch tests to nickel sulfate hexahydrate and who, in retrospect, did report a history of earring dermatitis. Future investigations using pre– and post–food challenge histologic assessments of the intestinal mucosa in patients who benefit from patch test–guided food avoidance diets should help to better define the mechanism.
Because IBS has not been traditionally associated with structural or biochemical abnormalities detectable with current routine diagnostic tools, it has long been viewed as a functional disorder. The findings published more recently,9,10 in addition to this study’s results, would negate this functional classification in the subset of patients with IBS symptoms who experience sustained relief of their symptoms by patch test–directed food avoidance. The underlying delayed-type hypersensitivity pathogenesis of the IBS-like symptoms in these individuals would mandate an organic classification, aptly named allergic contact enteritis.10
Follow-up Data
The mean (SD) follow-up duration for this study and the 2018 report9 was 4.5 (3.0) months and 7.6 (3.9) months, respectively. The placebo effect is a concern for disorders such as IBS in which primarily subjective outcome measures are available,21 and in a retrospective analysis of 25 randomized, placebo-controlled IBS clinical trials, Spiller22 concluded the optimum length of such trials to be more than 3 months, which these studies exceed. Although not blinded or placebo controlled, the length of follow-up in the 2018 report9 and here enhances the validity of the results.
Limitation
The retrospective manner in which the self-assessments were reported in this study introduces the potential for recall bias, a variable that could affect results. The presence and direction of bias by any given individual cannot be known, making it difficult to determine any effect it may have had. Further investigation should include daily assessments and refine the primary study end points to include both abdominal pain and the defecation considerations that define IBS.
Conclusion
Food patch testing has the potential to offer a safe, cost-effective approach to the evaluation and management of IBS symptoms. Randomized clinical trials are needed to further investigate the validity of the proof-of-concept results to date. For patients who benefit from a patch test–guided avoidance diet, invasive and costly endoscopic, radiologic, and laboratory testing and pharmacologic management could be averted. Symptomatic relief could be attained simply by avoiding the implicated foods, essentially doing more by doing less.
- Enck P, Aziz Q, Barbara G, et al. Irritable bowel syndrome. Nat Rev Dis Primers. 2016;2:1-24.
- Lacy BE, Patel NK. Rome criteria and a diagnostic approach to irritable bowel syndrome. J Clin Med. 2017;6:99.
- Barbara G, De Giorgio R, Stanghellini V, et al. New pathophysiological mechanisms in irritable bowel syndrome. Aliment Pharmacol Ther. 2004;20(suppl 2):1-9
- Chadwick VS, Chen W, Shu D, et al. Activation of the mucosal immune system in irritable bowel syndrome. Gastroenterology 2002;122:1778-1783.
- Tornblom H, Lindberg G, Nyberg B, et al. Full-thickness biopsy of the jejunum reveals inflammation and enteric neuropathy in irritable bowel syndrome. Gastroenterology. 2002;123:1972-1979.
- O’Mahony L, McCarthy J, Kelly
P, et al. Lactobacillus and bifidobacterium in irritable bowel syndrome: symptom responses and relationship to cytokine profiles. Gastroenterology. 2005;128:541-551. - Ragnarsson G, Bodemar G. Pain is temporally related to eating but not to defecation in the irritable bowel syndrome (IBS): patients’ description of diarrhea, constipation and symptom variation during a prospective 6-week study. Eur J Gastroenterol Hepatol. 1998;10:415-421.
- Boyce JA, Assa’ad A, Burks AW, et al. Guidelines for the diagnosis and management of food allergy in the United States: report of the NAID-sponsored expert panel. J Allergy Clin Immunol. 2010;126(6 suppl):S1-S58.
- Shin GH, Smith MS, Toro B, et al. Utility of food patch testing in the evaluation and management of irritable bowel syndrome. Skin. 2018;2:1-15.
- Stierstorfer MB, Sha CT. Food patch testing for irritable bowel syndrome. J Am Acad Dermatol. 2013;68:377-384.
- Marks JG, Belsito DV, DeLeo MD, et al. North American Contact Dermatitis Group patch test results for the detection of delayed-type hypersensitivity to topical allergens. J Am Acad Dermatol. 1998;38:911-918.
- Rietschel RL, Fowler JF Jr. Fisher’s Contact Dermatitis. BC Decker; 2008.
- DeGroot AC. Patch Testing. acdegroot Publishing; 2008.
- Gralnek IM, Hays RD, Kilbourne A, et al. The impact of irritable bowel syndrome on health-related quality of life. Gastroenterology. 2000;119:654-660.
- Halder SL, Lock GR, Talley NJ, et al. Impact of functional gastrointestinal disorders on health-related quality of life: a population-based case–control study. Aliment Pharmacol Ther. 2004;19:233-242.
- International Foundation for Gastrointestinal Disorders. About IBS. statistics. Accessed July 20, 2021. https://www.aboutibs.org/facts-about-ibs/statistics.html
- Rome Foundation. Guidelines—Rome III diagnostic criteria for functional gastrointestinal disorders. J Gastrointestin Liver Dis. 2006;15:307-312.
- Collins SM. Is the irritable gut an inflamed gut? Scand J Gastroenterol. 1992;192(suppl):102-105.
- Park MI, Camilleri M. Is there a role of food allergy in irritable bowel syndrome and functional dyspepsia? a systemic review. Neurogastroenterol Motil. 2006;18:595-607.
- Grover M, Herfarth H, Drossman DA. The functional-organic dichotomy: postinfectious irritable bowel syndrome and inflammatory bowel disease–irritable bowel syndrome. Clin Gastroenterol Hepatol. 2009;7:48-53.
- Hrobiartsson A, Gotzsche PC. Is the placebo powerless? an analysis of clinical trials comparing placebo with no treatment. N Engl J Med. 2001;344:1594-1602.
- Spiller RC. Problems and challenges in the design of irritable bowel syndrome clinical trials: experience from published trials. Am J Med. 1999;107:91S-97S.
Irritable bowel syndrome (IBS) is one of the most common disorders managed by primary care physicians and gastroenterologists.1 Characterized by abdominal pain coinciding with altered stool form and/or frequency as defined by the Rome IV diagnostic criteria,2 symptoms range from mild to debilitating and may remarkably impair quality of life and work productivity.1
The cause of IBS is poorly understood. Proposed pathophysiologic factors include impaired mucosal function, microbial imbalance, visceral hypersensitivity, psychologic dysfunction, genetic factors, neurotransmitter imbalance, postinfectious gastroenteritis, inflammation, and food intolerance, any or all of which may lead to the development and maintenance of IBS symptoms.3 More recent observations of inflammation in the intestinal lining4,5 and proinflammatory peripherally circulating cytokines6 challenge its traditional classification as a functional disorder.
The cause of this inflammation is of intense interest, with speculation that the bacterial microbiota, bile acids, association with postinfectious gastroenteritis and inflammatory bowel disease cases, and/or foods may contribute. Although approximately 50% of individuals with IBS report that foods aggravate their symptoms,7 studies investigating type I antibody–mediated immediate hypersensitivity have largely failed to demonstrate a substantial link, prompting many authorities to regard these associations as food “intolerances” rather than true allergies. Based on this body of literature, a large 2010 consensus report on all aspects of food allergies advises against food allergy testing for IBS.8
In contrast, by utilizing type IV food allergen skin patch testing, 2 proof-of-concept studies9,10 investigated a different allergic mechanism in IBS, namely cell-mediated delayed-type hypersensitivity. Because many foods and food additives are known to cause allergic contact dermatitis,11 it was hypothesized that these foods may elicit a similar delayed-type hypersensitivity response in the intestinal lining in previously sensitized individuals. By following a patch test–guided food avoidance diet, a large subpopulation of patients with IBS experienced partial or complete IBS symptom relief.9,10 Our study further investigates a role for food-related delayed-type hypersensitivities in the pathogenesis of IBS.
Methods
Patient Selection
This study was conducted in a secondary care community-based setting. All patients were self-referred over an 18-month period ending in October 2019, had physician-diagnosed IBS, and/or met the Rome IV criteria for IBS and presented expressly for the food patch testing on a fee-for-service basis. Subtype of IBS was determined on presentation by the self-reported historically predominant symptom. Duration of IBS symptoms was self-reported and was rounded to the nearest year for purposes of data collection.
Exclusion criteria included pregnancy, known allergy to adhesive tape or any of the food allergens used in the study, severe skin rash, symptoms that had a known cause other than IBS, or active treatment with systemic immunosuppressive medications.
Patch Testing
Skin patch testing was initiated using an extensive panel of 117 type IV food allergens (eTable)11 identified in the literature,12 most of which utilized standard compounded formulations13 or were available from reputable patch test manufacturers (Brial Allergen GmbH; Chemotechnique Diagnostics). This panel was not approved by the US Food and Drug Administration. The freeze-dried vegetable formulations were taken from the 2018 report.9 Standard skin patch test procedure protocols12 were used, affixing the patches to the upper aspect of the back.
Following patch test application on day 1, two follow-up visits occurred on day 3 and either day 4 or day 5. On day 3, patches were removed, and the initial results were read by a board-certified dermatologist according to a standard grading system.14 Interpretation of patch tests included no reaction, questionable reaction consisting of macular erythema, weak reaction consisting of erythema and slight edema, or strong reaction consisting of erythema and marked edema. On day 4 or day 5, the final patch test reading was performed, and patients were informed of their results. Patients were advised to avoid ingestion of all foods that elicited a questionable or positive patch test response for at least 3 months, and information about the foods and their avoidance also was distributed and reviewed.
Food Avoidance Questionnaire
Patients with questionable or positive patch tests at 72 or 96 hours were advised of their eligibility to participate in an institutional review board–approved food avoidance questionnaire study investigating the utility of patch test–guided food avoidance on IBS symptoms. The questionnaire assessed the following: (1) baseline average abdominal pain prior to patch test–guided avoidance diet (0=no symptoms; 10=very severe); (2) average abdominal pain since initiation of patch test–guided avoidance diet (0=no symptoms; 10=very severe); (3) degree of improvement in overall IBS symptoms by the end of the food avoidance period (0=no improvement; 10=great improvement); (4) compliance with the avoidance diet for the duration of the avoidance period (completely, partially, not at all, or not sure).
Questionnaires and informed consent were mailed to patients via the US Postal Service 3 months after completing the patch testing. The questionnaire and consent were to be completed and returned after dietary avoidance of the identified allergens for at least 3 months. Patients were not compensated for participation in the study.
Statistical Analysis
Statistical analysis of data collected from study questionnaires was performed with Microsoft Excel. Mean abdominal pain and mean global improvement scores were reported along with 1 SD of the mean. For comparison of mean abdominal pain and improvement in global IBS symptoms from baseline to after 3 months of identified allergen avoidance, a Mann-Whitney U test was performed, with P<.05 being considered statistically significant.
Results
Thirty-seven consecutive patients underwent the testing and were eligible for the study. Nineteen patients were included in the study by virtue of completing and returning their posttest food avoidance questionnaire and informed consent. Eighteen patients were White and 1 was Asian. Subcategories of IBS were diarrhea predominant (9 [47.4%]), constipation predominant (3 [15.8%]), mixed type (5 [26.3%]), and undetermined type (2 [10.5%]). Questionnaire answers were reported after a mean (SD) duration of patch test–directed food avoidance of 4.5 (3.0) months (Table 1).
Overall Improvement
Fifteen (78.9%) patients reported at least slight to great improvement in their global IBS symptoms, and 4 (21.1%) reported no improvement (Table 2), with a mean (SD) improvement score of 5.1 (3.3)(P<.00001).
Abdominal Pain
All 19 patients reported mild to marked abdominal pain at baseline. The mean (SD) baseline pain score was 6.6 (1.9). The mean (SD) pain score was 3.4 (1.8)(P<.00001) after an average patch test–guided dietary avoidance of 4.5 (3.0) months (Table 3).
Comment
Despite intense research interest and a growing number of new medications for IBS approved by the US Food and Drug Administration, there remains a large void in the search for cost-effective and efficacious approaches for IBS evaluation and treatment. In addition to major disturbances in quality of life,14,15 the cost to society in direct medical expenses and indirect costs associated with loss of productivity and work absenteeism is considerable; estimates range from $21 billion or more annually.16
Food Hypersensitivities Triggering IBS
This study further evaluated a role for skin patch testing to identify delayed-type (type IV) food hypersensitivities that trigger IBS symptoms and differed from the prior investigations9,10 in that the symptoms used to define IBS were updated from the Rome III17 to the newer Rome IV2 criteria. The data presented here show moderate to great improvement in global IBS symptoms in 58% (11/19) of patients, which is in line with a 2018 report of 40 study participants for whom follow-up at 3 or more months was available,9 providing additional support for a role for type IV food allergies in causing the same gastrointestinal tract symptoms that define IBS. The distinction between food-related studies, including this one, that implicate food allergies9,10 and prior studies that did not support a role for food allergies in IBS pathogenesis8 can be accounted for by the type of allergy investigated. Conclusions that IBS flares after food ingestion were attributable to intolerance rather than true allergy were based on results investigating only the humoral arm and failed to consider the cell-mediated arm of the immune system. As such, foods that appear to trigger IBS symptoms on an allergic basis in our study are recognized in the literature12 as type IV allergens that elicit cell-mediated immunologic responses rather than more widely recognized type I allergens, such as peanuts and shellfish, that elicit immediate-type hypersensitivity responses. Although any type IV food allergen(s) could be responsible, a pattern emerged in this study and the study published in 2018.9 Namely, some foods stood out as more frequently inducing patch test reactions, with the 3 most common being carmine, cinnamon bark oil, and sodium bisulfite (eTable). The sample size is relatively small, but the results raise the question of whether these foods are the most likely to trigger IBS symptoms in the general population. If so, is it the result of a higher innate sensitizing potential and/or a higher frequency of exposure in commonly eaten foods? Larger randomized clinical trials are needed.
Immune Response and IBS
There is mounting evidence that the immune system may play a role in the pathophysiology of IBS.18 Both lymphocyte infiltration of the myenteric plexus and an increase in intestinal mucosal T lymphocytes have been observed, and it is generally accepted that the mucosal immune system seems to be activated, at least in a subset of patients with IBS.19 Irritable bowel syndrome associations with quiescent inflammatory bowel disease or postinfectious gastroenteritis provide 2 potential causes for the inflammation, but most IBS patients have had neither.20 The mucosal lining of the intestine and immune system have vast exposure to intraluminal allergens in transit, and it is hypothesized that the same delayed-type hypersensitivity response elicited in the skin by patch testing is elicited in the intestine, resulting in the inflammation that triggers IBS symptoms.10 The results here add to the growing body of evidence that ingestion of type IV food allergens by previously sensitized individuals could, in fact, be the primary source of the inflammation observed in a large subpopulation of individuals who carry a diagnosis of IBS.
Food Allergens in Patch Testing
Many of the food allergens used in this study are commonly found in various nonfood products that may contact the skin. For example, many flavorings are used as fragrances, and many preservatives, binders, thickeners, emulsifiers, and stabilizers serve the same role in moisturizers, cosmetics, and topical medications. Likewise, nickel sulfate hexahydrate, ubiquitous in foods that arise from the earth, often is found in metal in jewelry, clothing components, and cell phones. All are potential sensitizers. Thus, the question may arise whether the causal relationship between the food allergens identified by patch testing and IBS symptoms might be more of a systemic effect akin to systemic contact dermatitis as sometimes follows ingestion of an allergen to which an individual has been topically sensitized, rather than the proposed localized immunologic response in the intestinal lining. We were unaware of patient history of allergic contact dermatitis to any of the patch test allergens in this study, but the dermatologist author here (M.S.) has unpublished experience with 2 other patients with IBS who have benefited from low-nickel diets after having had positive patch tests to nickel sulfate hexahydrate and who, in retrospect, did report a history of earring dermatitis. Future investigations using pre– and post–food challenge histologic assessments of the intestinal mucosa in patients who benefit from patch test–guided food avoidance diets should help to better define the mechanism.
Because IBS has not been traditionally associated with structural or biochemical abnormalities detectable with current routine diagnostic tools, it has long been viewed as a functional disorder. The findings published more recently,9,10 in addition to this study’s results, would negate this functional classification in the subset of patients with IBS symptoms who experience sustained relief of their symptoms by patch test–directed food avoidance. The underlying delayed-type hypersensitivity pathogenesis of the IBS-like symptoms in these individuals would mandate an organic classification, aptly named allergic contact enteritis.10
Follow-up Data
The mean (SD) follow-up duration for this study and the 2018 report9 was 4.5 (3.0) months and 7.6 (3.9) months, respectively. The placebo effect is a concern for disorders such as IBS in which primarily subjective outcome measures are available,21 and in a retrospective analysis of 25 randomized, placebo-controlled IBS clinical trials, Spiller22 concluded the optimum length of such trials to be more than 3 months, which these studies exceed. Although not blinded or placebo controlled, the length of follow-up in the 2018 report9 and here enhances the validity of the results.
Limitation
The retrospective manner in which the self-assessments were reported in this study introduces the potential for recall bias, a variable that could affect results. The presence and direction of bias by any given individual cannot be known, making it difficult to determine any effect it may have had. Further investigation should include daily assessments and refine the primary study end points to include both abdominal pain and the defecation considerations that define IBS.
Conclusion
Food patch testing has the potential to offer a safe, cost-effective approach to the evaluation and management of IBS symptoms. Randomized clinical trials are needed to further investigate the validity of the proof-of-concept results to date. For patients who benefit from a patch test–guided avoidance diet, invasive and costly endoscopic, radiologic, and laboratory testing and pharmacologic management could be averted. Symptomatic relief could be attained simply by avoiding the implicated foods, essentially doing more by doing less.
- Enck P, Aziz Q, Barbara G, et al. Irritable bowel syndrome. Nat Rev Dis Primers. 2016;2:1-24.
- Lacy BE, Patel NK. Rome criteria and a diagnostic approach to irritable bowel syndrome. J Clin Med. 2017;6:99.
- Barbara G, De Giorgio R, Stanghellini V, et al. New pathophysiological mechanisms in irritable bowel syndrome. Aliment Pharmacol Ther. 2004;20(suppl 2):1-9
- Chadwick VS, Chen W, Shu D, et al. Activation of the mucosal immune system in irritable bowel syndrome. Gastroenterology 2002;122:1778-1783.
- Tornblom H, Lindberg G, Nyberg B, et al. Full-thickness biopsy of the jejunum reveals inflammation and enteric neuropathy in irritable bowel syndrome. Gastroenterology. 2002;123:1972-1979.
- O’Mahony L, McCarthy J, Kelly
P, et al. Lactobacillus and bifidobacterium in irritable bowel syndrome: symptom responses and relationship to cytokine profiles. Gastroenterology. 2005;128:541-551. - Ragnarsson G, Bodemar G. Pain is temporally related to eating but not to defecation in the irritable bowel syndrome (IBS): patients’ description of diarrhea, constipation and symptom variation during a prospective 6-week study. Eur J Gastroenterol Hepatol. 1998;10:415-421.
- Boyce JA, Assa’ad A, Burks AW, et al. Guidelines for the diagnosis and management of food allergy in the United States: report of the NAID-sponsored expert panel. J Allergy Clin Immunol. 2010;126(6 suppl):S1-S58.
- Shin GH, Smith MS, Toro B, et al. Utility of food patch testing in the evaluation and management of irritable bowel syndrome. Skin. 2018;2:1-15.
- Stierstorfer MB, Sha CT. Food patch testing for irritable bowel syndrome. J Am Acad Dermatol. 2013;68:377-384.
- Marks JG, Belsito DV, DeLeo MD, et al. North American Contact Dermatitis Group patch test results for the detection of delayed-type hypersensitivity to topical allergens. J Am Acad Dermatol. 1998;38:911-918.
- Rietschel RL, Fowler JF Jr. Fisher’s Contact Dermatitis. BC Decker; 2008.
- DeGroot AC. Patch Testing. acdegroot Publishing; 2008.
- Gralnek IM, Hays RD, Kilbourne A, et al. The impact of irritable bowel syndrome on health-related quality of life. Gastroenterology. 2000;119:654-660.
- Halder SL, Lock GR, Talley NJ, et al. Impact of functional gastrointestinal disorders on health-related quality of life: a population-based case–control study. Aliment Pharmacol Ther. 2004;19:233-242.
- International Foundation for Gastrointestinal Disorders. About IBS. statistics. Accessed July 20, 2021. https://www.aboutibs.org/facts-about-ibs/statistics.html
- Rome Foundation. Guidelines—Rome III diagnostic criteria for functional gastrointestinal disorders. J Gastrointestin Liver Dis. 2006;15:307-312.
- Collins SM. Is the irritable gut an inflamed gut? Scand J Gastroenterol. 1992;192(suppl):102-105.
- Park MI, Camilleri M. Is there a role of food allergy in irritable bowel syndrome and functional dyspepsia? a systemic review. Neurogastroenterol Motil. 2006;18:595-607.
- Grover M, Herfarth H, Drossman DA. The functional-organic dichotomy: postinfectious irritable bowel syndrome and inflammatory bowel disease–irritable bowel syndrome. Clin Gastroenterol Hepatol. 2009;7:48-53.
- Hrobiartsson A, Gotzsche PC. Is the placebo powerless? an analysis of clinical trials comparing placebo with no treatment. N Engl J Med. 2001;344:1594-1602.
- Spiller RC. Problems and challenges in the design of irritable bowel syndrome clinical trials: experience from published trials. Am J Med. 1999;107:91S-97S.
Practice Points
- Recent observations of inflammation in irritable bowel syndrome (IBS) challenge its traditional classification as a functional disorder.
- Delayed-type food hypersensitivities, as detectable by skin patch testing, to type IV food allergens are one plausible cause for intestinal inflammation.
- Patch test–directed food avoidance improves IBS symptoms in some patients and offers a new approach to the evaluation and management of this condition.
- Dermatologists and other health care practitioners with expertise in patch testing are uniquely positioned to utilize these skills to help patients with IBS.

Comparison of Renal Function Between Tenofovir Disoproxil Fumarate and Other Nucleos(t)ide Reverse Transcriptase Inhibitors in Patients With Hepatitis B Virus Infection
Infection with hepatitis B virus (HBV) is associated with risk of potentially lethal, chronic infection and is a major public health problem. Infection from HBV has the potential to lead to liver failure, cirrhosis, and cancer.1,2 Chronic HBV infection exists in as many as 2.2 million Americans, and in 2015 alone, HBV was estimated to be associated with 887,000 deaths worldwide.1,3 Suppression of viral load is the basis of treatment, necessitating long-term use of medication for treatment.4 Nucleoside reverse transcriptase inhibitors (entecavir, lamivudine, telbivudine) and nucleotide reverse transcriptase inhibitors (adefovir, tenofovir), have improved the efficacy and tolerability of chronic HBV treatment compared with interferon-based agents.4-7 However, concerns remain regarding long-term risk of nephrotoxicity, in particular with tenofovir disoproxil fumarate (TDF), which could lead to a limitation of safe and effective options for certain populations.5,6,8 A newer formulation, tenofovir alafenamide fumarate (TAF), has improved the kidney risks, but expense remains a limiting factor for this agent.9
Nucleos(t)ide reverse transcriptase inhibitors (NRTIs) have demonstrated efficacy in reducing HBV viral load and other markers of improvement in chronic HBV, but entecavir and tenofovir have tended to demonstrate greater efficacy in clinical trials.5-7 Several studies have suggested potential benefits of tenofovir-based treatment over other NRTIs, including greater viral load achievement compared with adefovir, efficacy in patients with previous failure of lamivudine or adefovir, and long-term efficacy in chronic HBV infection.10-12 A 2019 systematic review suggests TDF and TAF are more effective than other NRTIs for achieving viral load suppression.13 Other NRTIs are not without their own risks, including mitochondrial dysfunction, mostly with lamivudine and telbivudine.4
Despite these data, guidelines have varied in their treatment recommendations in the context of chronic kidney disease partly due to variations in the evidence regarding nephrotoxicity.7,14 Cohort studies and case reports have suggested association between TDF and acute kidney injury in patients with HIV infection as well as long-term reductions in kidney function.15,16 In one study, 58% of patients treated with TDF did not return to baseline kidney function after an event of acute kidney injury.17 However, little data are available on whether this association exists for chronic HBV treatment in the absence of HIV infection. One retrospective analysis comparing TDF and entecavir in chronic HBV without HIV showed greater incidence of creatinine clearance < 60 mL/min with TDF but greater incidence of serum creatinine (SCr) ≥ 2.5 mg/dL in the entacavir group, making it difficult to reach a clear conclusion on risks.18 Other studies have either suffered from small cohorts with TDF or included patients with HIV coinfection.19,20 Although a retrospective comparison of TDF and entecavir, randomly matched 1:2 to account for differences between groups, showed lower estimated glomerular filtration rate (eGFR) in the TDF group, more data are needed.21 Entecavir remains an option for many patient, but for those who have failed nucleosides, few options remain.
With the advantages available from TDF and the continued expense of TAF, more data regarding the risks of nephrotoxicity with TDF would be beneficial. The objective of this study was to compare treatment with TDF and other NRTIs in chronic HBV monoinfection to distinguish any differences in kidney function changes over time. With hopes of gathering enough data to distinguish between groups, information was gathered from across the Veterans Health Administration (VHA) system.
Methods
A nationwide, multicenter, retrospective, cohort study of veterans with HBV infection was conducted to compare the effects of various NRTIs on renal function. Patient were identified through the US Department of Veterans Affairs Corporate Data Warehouse (CDW), using data from July 1, 2005 to July 31, 2015. Patients were included who had positive HBV surface antigen (HBsAg) or newly prescribed NRTI. Multiple drug episodes could be included for each patient. That is, if a patient who had previously been included had another instance of a newly prescribed NRTI, this would be included in the analysis. Exclusion criteria were patients aged < 18 years, those with NRTI prescription for ≤ 1 month, and concurrent HIV infection. All patients with HBsAg were included for the study for increasing the sensitivity in gathering patients; however, those patients were included only if they received NRTI concurrent with the laboratory test results used for the primary endpoint (ie, SCr) to be included in the analysis.
How data are received from CDW bears some explanation. A basic way to understand the way data are received is that questions can be asked such as “for X population, at this point in time, was the patient on Y drug and what was the SCr value.” Therefore, inclusion and exclusion must first be specified to define the population, after which point certain data points can be received depending on the specifications made. For this reason, there is no way to determine, for example, whether a certain patient continued TDF use for the duration of the study, only at the defined points in time (described below) to receive the specific data.
For the patients included, information was retrieved from the first receipt of the NRTI prescription to 36 months after initiation. Baseline characteristics included age, sex, race, and ethnicity, and were defined at time of NRTI initiation. Values for SCr were compared at baseline, 3, 6, 12, 24, and 36 months after prescription of NRTI. The date of laboratory results was associated with the nearest date of comparison. Values for eGFR were determined by the modification of diet in renal disease equation. Values for eGFR are available in the CDW, whereas there is no direct means to calculate creatinine clearance with the available data, so eGFR was used for this study.
The primary endpoint was a change in eGFR in patients taking TDF after adjustment for time with the full cohort. Secondary analyses included the overall effect of time for the full cohort and change in renal function for each NRTI group. Mean and standard deviation for eGFR were determined for each NRTI group using the available data points. Analyses of the primary and secondary endpoints were completed using a linear mixed model with terms for time, to account for fixed effects, and specific NRTI used to account for random effects. A 2-sided α of .05 was used to determine statistical significance.
Results
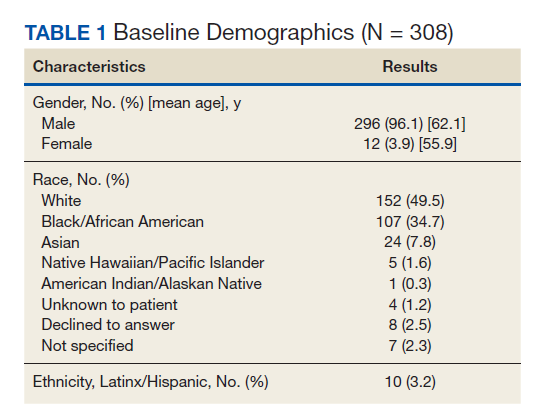
A total of 413 drug episodes from 308 subjects met inclusion criteria for the study. Of these subjects, 229 were still living at the time of query. Most study participants were male (96%), the mean age was 62.1 years for males and 55.9 years for females; 49.5% were White and 39.7% were Black veterans (Table 1).
The NRTIs received by patients during the study period included TDF, TDF/emtricitabine, adefovir, entecavir, and lamivudine. No patients were on telbivudine. Formulations including TAF had not been approved by the US Food and Drug Administration (FDA) by the end of the study period, and as such were not found in the study.13 A plurality of participants received entecavir (94 of 223 at baseline), followed by TDF (n = 38) (Table 2). Of note, only 8 participants received TDF/emtricitabine at baseline. Differences were found between the groups in number of SCr data points available at 36 months vs baseline. The TDF group had the greatest reduction in data points available with 38 laboratory values at baseline vs 15 at 36 months (39.5% of baseline). From the available data, it is not possible to determine whether these represent medication discontinuations, missing values, lost to follow-up, or some other cause. Baseline eGFR was highest in the 2 TDF groups, with TDF alone at 77.7 mL/min (1.4-5.5 mL/min higher than the nontenofovir groups) and TDF/emtricitabine at 89.7 mL/min (13.4-17.5 mL/min higher than nontenofovir groups) (Table 3).
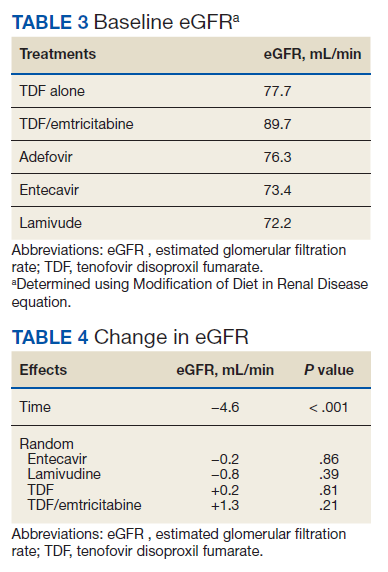
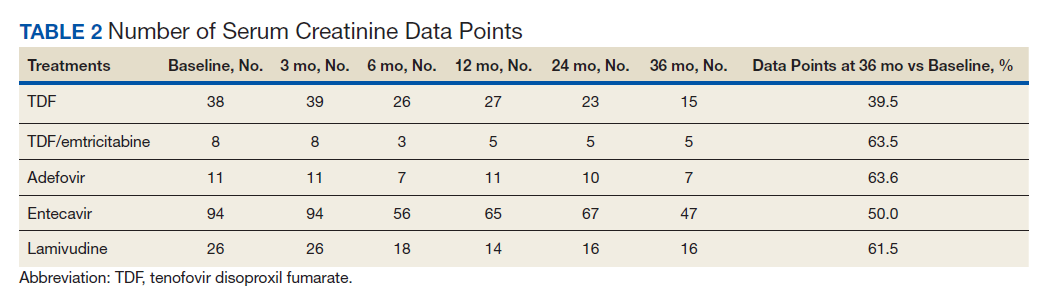
Table 4 contains data for the primarily and secondary analyses, examining change in eGFR. The fixed-effects analysis revealed a significant negative association between eGFR and time of −4.6 mL/min (P < .001) for all the NRTI groups combined. After accounting for this effect of time, there was no statistically significant correlation between use of TDF and change in eGFR (+0.2 mL/min, P = .81). For the TDF/emtricitabine group, a positive but statistically nonsignificant change was found (+1.3 mL/min, P = .21), but numbers were small and may have been insufficient to detect a difference. Similarly, no statistically significant change in eGFR was found after the fixed effects for either entecavir (−0.2 mL/min, P = .86) or lamivudine (−0.8 mL/min, P = .39). While included in the full analysis for fixed effects, random effects data were not received for the adefovir group due to heterogeneity and small quantity of the data, producing an unclear result.
Discussion
This study demonstrated a decline in eGFR over time in a similar fashion for all NRTIs used in patients treated for HBV monoinfection, but no greater decline in renal function was found with use of TDF vs other NRTIs. A statistically significant decline in eGFR of −4.55 mL/min over the 36-month time frame of the study was demonstrated for the full cohort, but no statistically significant change in eGFR was found for any individual NRTI after accounting for the fixed effect of time. If TDF is not associated with additional risk of nephrotoxicity compared with other NRTIs, this could have important implications for treatment when considering the evidence that tenofovir-based treatment seems to be more effective than other medications for suppressing viral load.13
This result runs contrary to data in patients given NRTIs for HIV infection as well as a more recent cohort study in chronic HBV infectioin, which showed a statistically significant difference in kidney dysfunction between TDF and entecavir (-15.73 vs -5.96 mL/min/m2, P < .001).5-7,21 Possible mechanism for differences in response between HIV and HBV patients has not been elucidated, but the inherent risk of developing chronic kidney disease from HIV disease may play a role.22 The possibility remains that all NRTIs cause a degree of kidney impairment in patients treated for chronic HBV infection as evidenced by the statistically significant fixed effect for time in the present study. The cause of this effect is unknown but may be independently related to HBV infection or may be specific to NRTI therapy. No control group of patients not receiving NRTI therapy was included in this study, so conclusions cannot be drawn regarding whether all NRTIs are associated with decline in renal function in chronic HBV infection.
Limitations
Although this study did not detect a difference in change in eGFR between TDF and other NRTI treatments, it is possible that the length of data collection was not adequate to account for possible kidney injury from TDF. A study assessing renal tubular dysfunction in patients receiving adefovir or TDF showed a mean onset of dysfunction of 49 months.15 It is possible that participants in this study would go on to develop renal dysfunction in the future. This potential also was observed in a more recent retrospective cohort study in chronic HBV infection, which showed the greatest degree of decline in kidney function between 36 and 48 months (−11.87 to −15.73 mL/min/m2 for the TDF group).21
The retrospective design created additional limitations. We attempted to account for some by using a matched cohort for the entecavir group, and there was no statistically significant difference between the groups in baseline characteristics. In HIV patients, a 10-year follow-up study continued to show decline in eGFR throughout the study, though the greatest degree of reduction occurred in the first year of the study.10 The higher baseline eGFR of the TDF recipients, 77.7 mL/min for the TDF alone group and 89.7 mL/min for the TDF/emtricitabine group vs 72.2 to 76.3 mL/min in the other NRTI groups, suggests high potential for selection bias. Some health care providers were likely to avoid TDF in patients with lower eGFR due to the data suggesting nephrotoxicity in other populations. Another limitation is that the reason for the missing laboratory values could not be determined. The TDF group had the greatest disparity in SCr data availability at baseline vs 36 months, with 39.5% concurrence with TDF alone compared with 50.0 to 63.6% in the other groups. Other treatment received outside the VHA system also could have influenced results.
Conclusions
This retrospective, multicenter, cohort study did not find a difference between TDF and other NRTIs for changes in renal function over time in patients with HBV infection without HIV. There was a fixed effect for time, ie, all NRTI groups showed some decline in renal function over time (−4.6 mL/min), but the effects were similar across groups. The results appear contrary to studies with comorbid HIV showing a decline in renal function with TDF, but present studies in HBV monotherapy have mixed results.
Further studies are needed to validate these results, as this and previous studies have several limitations. If these results are confirmed, a possible mechanism for these differences between patients with and without HIV should be examined. In addition, a study looking specifically at incidence of acute kidney injury rather than overall decline in renal function would add important data. If the results of this study are confirmed, there could be clinical implications in choice of agent with treatment of HBV monoinfection. This would add to the overall armament of medications available for chronic HBV infection and could create cost savings in certain situations if providers feel more comfortable continuing to use TDF instead of switching to the more expensive TAF.
Acknowledgments
Funding for this study was provided by the Veterans Health Administration.
1. Chartier M, Maier MM, Morgan TR, et al. Achieving excellence in hepatitis B virus care for veterans in the Veterans Health Administration. Fed Pract. 2018;35(suppl 2):S49-S53.
2. Chayanupatkul M, Omino R, Mittal S, et al. Hepatocellular carcinoma in the absence of cirrhosis in patients with chronic hepatitis B virus infection. J Hepatol. 2017;66(2):355-362. doi:10.1016/j.jhep.2016.09.013
3. World Health Organization. Global hepatitis report, 2017. Published April 19, 2017. Accessed July 15, 2021. https://www.who.int/publications/i/item/global-hepatitis-report-2017
4. Kayaaslan B, Guner R. Adverse effects of oral antiviral therapy in chronic hepatitis B. World J Hepatol. 2017;9(5):227-241. doi:10.4254/wjh.v9.i5.227
5. Lampertico P, Chan HL, Janssen HL, Strasser SI, Schindler R, Berg T. Review article: long-term safety of nucleoside and nucleotide analogues in HBV-monoinfected patients. Aliment Pharmacol Ther. 2016;44(1):16-34. doi:10.1111/apt.13659
6. Pipili C, Cholongitas E, Papatheodoridis G. Review article: nucleos(t)ide analogues in patients with chronic hepatitis B virus infection and chronic kidney disease. Aliment Pharmacol Ther. 2014;39(1):35-46. doi:10.1111/apt.12538
7. Terrault NA, Bzowej NH, Chang KM, et al. AASLD guidelines for treatment of chronic hepatitis B. Hepatology. 2016;63(1):261-283. doi:10.1002/hep.28156
8. Gupta SK. Tenofovir-associated Fanconi syndrome: review of the FDA adverse event reporting system. AIDS Patient Care STDS. 2008;22(2):99-103. doi:10.1089/apc.2007.0052
9. Canadian Agency for Drugs and Technologies in Health. Pharmacoeconomic review teport: tenofovir alafenamide (Vemlidy): (Gilead Sciences Canada, Inc.): indication: treatment of chronic hepatitis B in adults with compensated liver disease. Published April 2018. Accessed July 15, 2021. https://www.ncbi.nlm.nih.gov/books/NBK532825/
10. Marcellin P, Heathcote EJ, Buti M, et al. Tenofovir disoproxil fumarate versus adefovir dipivoxil for chronic hepatitis B. N Engl J Med. 2008;359(23):2442-2455. doi:10.1056/NEJMoa0802878
11. van Bömmel F, de Man RA, Wedemeyer H, et al. Long-term efficacy of tenofovir monotherapy for hepatitis B virus-monoinfected patients after failure of nucleoside/nucleotide analogues. Hepatology. 2010;51(1):73-80. doi:10.1002/hep.23246
12. Gordon SC, Krastev Z, Horban A, et al. Efficacy of tenofovir disoproxil fumarate at 240 weeks in patients with chronic hepatitis B with high baseline viral load. Hepatology. 2013;58(2):505-513. doi:10.1002/hep.26277
13. Wong WWL, Pechivanoglou P, Wong J, et al. Antiviral treatment for treatment-naïve chronic hepatitis B: systematic review and network meta-analysis of randomized controlled trials. Syst Rev. 2019;8(1):207. Published 2019 Aug 19. doi:10.1186/s13643-019-1126-1
14. Han Y, Zeng A, Liao H, Liu Y, Chen Y, Ding H. The efficacy and safety comparison between tenofovir and entecavir in treatment of chronic hepatitis B and HBV related cirrhosis: A systematic review and meta-analysis. Int Immunopharmacol. 2017;42:168-175. doi:10.1016/j.intimp.2016.11.022
15. Laprise C, Baril JG, Dufresne S, Trottier H. Association between tenofovir exposure and reduced kidney function in a cohort of HIV-positive patients: results from 10 years of follow-up. Clin Infect Dis. 2013;56(4):567-575. doi:10.1093/cid/cis937
16. Hall AM, Hendry BM, Nitsch D, Connolly JO. Tenofovir-associated kidney toxicity in HIV-infected patients: a review of the evidence. Am J Kidney Dis. 2011;57(5):773-780. doi:10.1053/j.ajkd.2011.01.022
17. Veiga TM, Prazeres AB, Silva D, et al. Tenofovir nephrotoxicity is an important cause of acute kidney injury in hiv infected inpatients. Abstract FR-PO481 presented at: American Society of Nephrology Kidney Week 2015; November 6, 2015; San Diego, CA.
18. Tan LK, Gilleece Y, Mandalia S, et al. Reduced glomerular filtration rate but sustained virologic response in HIV/hepatitis B co-infected individuals on long-term tenofovir. J Viral Hepat. 2009;16(7):471-478. doi:10.1111/j.1365-2893.2009.01084.x
19. Gish RG, Clark MD, Kane SD, Shaw RE, Mangahas MF, Baqai S. Similar risk of renal events among patients treated with tenofovir or entecavir for chronic hepatitis B. Clin Gastroenterol Hepatol. 2012;10(8):941-e68. doi:10.1016/j.cgh.2012.04.008
20. Gara N, Zhao X, Collins MT, et al. Renal tubular dysfunction during long-term adefovir or tenofovir therapy in chronic hepatitis B. Aliment Pharmacol Ther. 2012;35(11):1317-1325. doi:10.1111/j.1365-2036.2012.05093.x
21. Tsai HJ, Chuang YW, Lee SW, Wu CY, Yeh HZ, Lee TY. Using the chronic kidney disease guidelines to evaluate the renal safety of tenofovir disoproxil fumarate in hepatitis B patients. Aliment Pharmacol Ther. 2018;47(12):1673-1681. doi:10.1111/apt.14682
22. Szczech LA, Gupta SK, Habash R, et al. The clinical epidemiology and course of the spectrum of renal diseases associated with HIV infection. Kidney Int. 2004;66(3):1145-1152. doi:10.1111/j.1523-1755.2004.00865.x
Infection with hepatitis B virus (HBV) is associated with risk of potentially lethal, chronic infection and is a major public health problem. Infection from HBV has the potential to lead to liver failure, cirrhosis, and cancer.1,2 Chronic HBV infection exists in as many as 2.2 million Americans, and in 2015 alone, HBV was estimated to be associated with 887,000 deaths worldwide.1,3 Suppression of viral load is the basis of treatment, necessitating long-term use of medication for treatment.4 Nucleoside reverse transcriptase inhibitors (entecavir, lamivudine, telbivudine) and nucleotide reverse transcriptase inhibitors (adefovir, tenofovir), have improved the efficacy and tolerability of chronic HBV treatment compared with interferon-based agents.4-7 However, concerns remain regarding long-term risk of nephrotoxicity, in particular with tenofovir disoproxil fumarate (TDF), which could lead to a limitation of safe and effective options for certain populations.5,6,8 A newer formulation, tenofovir alafenamide fumarate (TAF), has improved the kidney risks, but expense remains a limiting factor for this agent.9
Nucleos(t)ide reverse transcriptase inhibitors (NRTIs) have demonstrated efficacy in reducing HBV viral load and other markers of improvement in chronic HBV, but entecavir and tenofovir have tended to demonstrate greater efficacy in clinical trials.5-7 Several studies have suggested potential benefits of tenofovir-based treatment over other NRTIs, including greater viral load achievement compared with adefovir, efficacy in patients with previous failure of lamivudine or adefovir, and long-term efficacy in chronic HBV infection.10-12 A 2019 systematic review suggests TDF and TAF are more effective than other NRTIs for achieving viral load suppression.13 Other NRTIs are not without their own risks, including mitochondrial dysfunction, mostly with lamivudine and telbivudine.4
Despite these data, guidelines have varied in their treatment recommendations in the context of chronic kidney disease partly due to variations in the evidence regarding nephrotoxicity.7,14 Cohort studies and case reports have suggested association between TDF and acute kidney injury in patients with HIV infection as well as long-term reductions in kidney function.15,16 In one study, 58% of patients treated with TDF did not return to baseline kidney function after an event of acute kidney injury.17 However, little data are available on whether this association exists for chronic HBV treatment in the absence of HIV infection. One retrospective analysis comparing TDF and entecavir in chronic HBV without HIV showed greater incidence of creatinine clearance < 60 mL/min with TDF but greater incidence of serum creatinine (SCr) ≥ 2.5 mg/dL in the entacavir group, making it difficult to reach a clear conclusion on risks.18 Other studies have either suffered from small cohorts with TDF or included patients with HIV coinfection.19,20 Although a retrospective comparison of TDF and entecavir, randomly matched 1:2 to account for differences between groups, showed lower estimated glomerular filtration rate (eGFR) in the TDF group, more data are needed.21 Entecavir remains an option for many patient, but for those who have failed nucleosides, few options remain.
With the advantages available from TDF and the continued expense of TAF, more data regarding the risks of nephrotoxicity with TDF would be beneficial. The objective of this study was to compare treatment with TDF and other NRTIs in chronic HBV monoinfection to distinguish any differences in kidney function changes over time. With hopes of gathering enough data to distinguish between groups, information was gathered from across the Veterans Health Administration (VHA) system.
Methods
A nationwide, multicenter, retrospective, cohort study of veterans with HBV infection was conducted to compare the effects of various NRTIs on renal function. Patient were identified through the US Department of Veterans Affairs Corporate Data Warehouse (CDW), using data from July 1, 2005 to July 31, 2015. Patients were included who had positive HBV surface antigen (HBsAg) or newly prescribed NRTI. Multiple drug episodes could be included for each patient. That is, if a patient who had previously been included had another instance of a newly prescribed NRTI, this would be included in the analysis. Exclusion criteria were patients aged < 18 years, those with NRTI prescription for ≤ 1 month, and concurrent HIV infection. All patients with HBsAg were included for the study for increasing the sensitivity in gathering patients; however, those patients were included only if they received NRTI concurrent with the laboratory test results used for the primary endpoint (ie, SCr) to be included in the analysis.
How data are received from CDW bears some explanation. A basic way to understand the way data are received is that questions can be asked such as “for X population, at this point in time, was the patient on Y drug and what was the SCr value.” Therefore, inclusion and exclusion must first be specified to define the population, after which point certain data points can be received depending on the specifications made. For this reason, there is no way to determine, for example, whether a certain patient continued TDF use for the duration of the study, only at the defined points in time (described below) to receive the specific data.
For the patients included, information was retrieved from the first receipt of the NRTI prescription to 36 months after initiation. Baseline characteristics included age, sex, race, and ethnicity, and were defined at time of NRTI initiation. Values for SCr were compared at baseline, 3, 6, 12, 24, and 36 months after prescription of NRTI. The date of laboratory results was associated with the nearest date of comparison. Values for eGFR were determined by the modification of diet in renal disease equation. Values for eGFR are available in the CDW, whereas there is no direct means to calculate creatinine clearance with the available data, so eGFR was used for this study.
The primary endpoint was a change in eGFR in patients taking TDF after adjustment for time with the full cohort. Secondary analyses included the overall effect of time for the full cohort and change in renal function for each NRTI group. Mean and standard deviation for eGFR were determined for each NRTI group using the available data points. Analyses of the primary and secondary endpoints were completed using a linear mixed model with terms for time, to account for fixed effects, and specific NRTI used to account for random effects. A 2-sided α of .05 was used to determine statistical significance.
Results
A total of 413 drug episodes from 308 subjects met inclusion criteria for the study. Of these subjects, 229 were still living at the time of query. Most study participants were male (96%), the mean age was 62.1 years for males and 55.9 years for females; 49.5% were White and 39.7% were Black veterans (Table 1).
The NRTIs received by patients during the study period included TDF, TDF/emtricitabine, adefovir, entecavir, and lamivudine. No patients were on telbivudine. Formulations including TAF had not been approved by the US Food and Drug Administration (FDA) by the end of the study period, and as such were not found in the study.13 A plurality of participants received entecavir (94 of 223 at baseline), followed by TDF (n = 38) (Table 2). Of note, only 8 participants received TDF/emtricitabine at baseline. Differences were found between the groups in number of SCr data points available at 36 months vs baseline. The TDF group had the greatest reduction in data points available with 38 laboratory values at baseline vs 15 at 36 months (39.5% of baseline). From the available data, it is not possible to determine whether these represent medication discontinuations, missing values, lost to follow-up, or some other cause. Baseline eGFR was highest in the 2 TDF groups, with TDF alone at 77.7 mL/min (1.4-5.5 mL/min higher than the nontenofovir groups) and TDF/emtricitabine at 89.7 mL/min (13.4-17.5 mL/min higher than nontenofovir groups) (Table 3).
Table 4 contains data for the primarily and secondary analyses, examining change in eGFR. The fixed-effects analysis revealed a significant negative association between eGFR and time of −4.6 mL/min (P < .001) for all the NRTI groups combined. After accounting for this effect of time, there was no statistically significant correlation between use of TDF and change in eGFR (+0.2 mL/min, P = .81). For the TDF/emtricitabine group, a positive but statistically nonsignificant change was found (+1.3 mL/min, P = .21), but numbers were small and may have been insufficient to detect a difference. Similarly, no statistically significant change in eGFR was found after the fixed effects for either entecavir (−0.2 mL/min, P = .86) or lamivudine (−0.8 mL/min, P = .39). While included in the full analysis for fixed effects, random effects data were not received for the adefovir group due to heterogeneity and small quantity of the data, producing an unclear result.
Discussion
This study demonstrated a decline in eGFR over time in a similar fashion for all NRTIs used in patients treated for HBV monoinfection, but no greater decline in renal function was found with use of TDF vs other NRTIs. A statistically significant decline in eGFR of −4.55 mL/min over the 36-month time frame of the study was demonstrated for the full cohort, but no statistically significant change in eGFR was found for any individual NRTI after accounting for the fixed effect of time. If TDF is not associated with additional risk of nephrotoxicity compared with other NRTIs, this could have important implications for treatment when considering the evidence that tenofovir-based treatment seems to be more effective than other medications for suppressing viral load.13
This result runs contrary to data in patients given NRTIs for HIV infection as well as a more recent cohort study in chronic HBV infectioin, which showed a statistically significant difference in kidney dysfunction between TDF and entecavir (-15.73 vs -5.96 mL/min/m2, P < .001).5-7,21 Possible mechanism for differences in response between HIV and HBV patients has not been elucidated, but the inherent risk of developing chronic kidney disease from HIV disease may play a role.22 The possibility remains that all NRTIs cause a degree of kidney impairment in patients treated for chronic HBV infection as evidenced by the statistically significant fixed effect for time in the present study. The cause of this effect is unknown but may be independently related to HBV infection or may be specific to NRTI therapy. No control group of patients not receiving NRTI therapy was included in this study, so conclusions cannot be drawn regarding whether all NRTIs are associated with decline in renal function in chronic HBV infection.
Limitations
Although this study did not detect a difference in change in eGFR between TDF and other NRTI treatments, it is possible that the length of data collection was not adequate to account for possible kidney injury from TDF. A study assessing renal tubular dysfunction in patients receiving adefovir or TDF showed a mean onset of dysfunction of 49 months.15 It is possible that participants in this study would go on to develop renal dysfunction in the future. This potential also was observed in a more recent retrospective cohort study in chronic HBV infection, which showed the greatest degree of decline in kidney function between 36 and 48 months (−11.87 to −15.73 mL/min/m2 for the TDF group).21
The retrospective design created additional limitations. We attempted to account for some by using a matched cohort for the entecavir group, and there was no statistically significant difference between the groups in baseline characteristics. In HIV patients, a 10-year follow-up study continued to show decline in eGFR throughout the study, though the greatest degree of reduction occurred in the first year of the study.10 The higher baseline eGFR of the TDF recipients, 77.7 mL/min for the TDF alone group and 89.7 mL/min for the TDF/emtricitabine group vs 72.2 to 76.3 mL/min in the other NRTI groups, suggests high potential for selection bias. Some health care providers were likely to avoid TDF in patients with lower eGFR due to the data suggesting nephrotoxicity in other populations. Another limitation is that the reason for the missing laboratory values could not be determined. The TDF group had the greatest disparity in SCr data availability at baseline vs 36 months, with 39.5% concurrence with TDF alone compared with 50.0 to 63.6% in the other groups. Other treatment received outside the VHA system also could have influenced results.
Conclusions
This retrospective, multicenter, cohort study did not find a difference between TDF and other NRTIs for changes in renal function over time in patients with HBV infection without HIV. There was a fixed effect for time, ie, all NRTI groups showed some decline in renal function over time (−4.6 mL/min), but the effects were similar across groups. The results appear contrary to studies with comorbid HIV showing a decline in renal function with TDF, but present studies in HBV monotherapy have mixed results.
Further studies are needed to validate these results, as this and previous studies have several limitations. If these results are confirmed, a possible mechanism for these differences between patients with and without HIV should be examined. In addition, a study looking specifically at incidence of acute kidney injury rather than overall decline in renal function would add important data. If the results of this study are confirmed, there could be clinical implications in choice of agent with treatment of HBV monoinfection. This would add to the overall armament of medications available for chronic HBV infection and could create cost savings in certain situations if providers feel more comfortable continuing to use TDF instead of switching to the more expensive TAF.
Acknowledgments
Funding for this study was provided by the Veterans Health Administration.
1. Chartier M, Maier MM, Morgan TR, et al. Achieving excellence in hepatitis B virus care for veterans in the Veterans Health Administration. Fed Pract. 2018;35(suppl 2):S49-S53.
2. Chayanupatkul M, Omino R, Mittal S, et al. Hepatocellular carcinoma in the absence of cirrhosis in patients with chronic hepatitis B virus infection. J Hepatol. 2017;66(2):355-362. doi:10.1016/j.jhep.2016.09.013
3. World Health Organization. Global hepatitis report, 2017. Published April 19, 2017. Accessed July 15, 2021. https://www.who.int/publications/i/item/global-hepatitis-report-2017
4. Kayaaslan B, Guner R. Adverse effects of oral antiviral therapy in chronic hepatitis B. World J Hepatol. 2017;9(5):227-241. doi:10.4254/wjh.v9.i5.227
5. Lampertico P, Chan HL, Janssen HL, Strasser SI, Schindler R, Berg T. Review article: long-term safety of nucleoside and nucleotide analogues in HBV-monoinfected patients. Aliment Pharmacol Ther. 2016;44(1):16-34. doi:10.1111/apt.13659
6. Pipili C, Cholongitas E, Papatheodoridis G. Review article: nucleos(t)ide analogues in patients with chronic hepatitis B virus infection and chronic kidney disease. Aliment Pharmacol Ther. 2014;39(1):35-46. doi:10.1111/apt.12538
7. Terrault NA, Bzowej NH, Chang KM, et al. AASLD guidelines for treatment of chronic hepatitis B. Hepatology. 2016;63(1):261-283. doi:10.1002/hep.28156
8. Gupta SK. Tenofovir-associated Fanconi syndrome: review of the FDA adverse event reporting system. AIDS Patient Care STDS. 2008;22(2):99-103. doi:10.1089/apc.2007.0052
9. Canadian Agency for Drugs and Technologies in Health. Pharmacoeconomic review teport: tenofovir alafenamide (Vemlidy): (Gilead Sciences Canada, Inc.): indication: treatment of chronic hepatitis B in adults with compensated liver disease. Published April 2018. Accessed July 15, 2021. https://www.ncbi.nlm.nih.gov/books/NBK532825/
10. Marcellin P, Heathcote EJ, Buti M, et al. Tenofovir disoproxil fumarate versus adefovir dipivoxil for chronic hepatitis B. N Engl J Med. 2008;359(23):2442-2455. doi:10.1056/NEJMoa0802878
11. van Bömmel F, de Man RA, Wedemeyer H, et al. Long-term efficacy of tenofovir monotherapy for hepatitis B virus-monoinfected patients after failure of nucleoside/nucleotide analogues. Hepatology. 2010;51(1):73-80. doi:10.1002/hep.23246
12. Gordon SC, Krastev Z, Horban A, et al. Efficacy of tenofovir disoproxil fumarate at 240 weeks in patients with chronic hepatitis B with high baseline viral load. Hepatology. 2013;58(2):505-513. doi:10.1002/hep.26277
13. Wong WWL, Pechivanoglou P, Wong J, et al. Antiviral treatment for treatment-naïve chronic hepatitis B: systematic review and network meta-analysis of randomized controlled trials. Syst Rev. 2019;8(1):207. Published 2019 Aug 19. doi:10.1186/s13643-019-1126-1
14. Han Y, Zeng A, Liao H, Liu Y, Chen Y, Ding H. The efficacy and safety comparison between tenofovir and entecavir in treatment of chronic hepatitis B and HBV related cirrhosis: A systematic review and meta-analysis. Int Immunopharmacol. 2017;42:168-175. doi:10.1016/j.intimp.2016.11.022
15. Laprise C, Baril JG, Dufresne S, Trottier H. Association between tenofovir exposure and reduced kidney function in a cohort of HIV-positive patients: results from 10 years of follow-up. Clin Infect Dis. 2013;56(4):567-575. doi:10.1093/cid/cis937
16. Hall AM, Hendry BM, Nitsch D, Connolly JO. Tenofovir-associated kidney toxicity in HIV-infected patients: a review of the evidence. Am J Kidney Dis. 2011;57(5):773-780. doi:10.1053/j.ajkd.2011.01.022
17. Veiga TM, Prazeres AB, Silva D, et al. Tenofovir nephrotoxicity is an important cause of acute kidney injury in hiv infected inpatients. Abstract FR-PO481 presented at: American Society of Nephrology Kidney Week 2015; November 6, 2015; San Diego, CA.
18. Tan LK, Gilleece Y, Mandalia S, et al. Reduced glomerular filtration rate but sustained virologic response in HIV/hepatitis B co-infected individuals on long-term tenofovir. J Viral Hepat. 2009;16(7):471-478. doi:10.1111/j.1365-2893.2009.01084.x
19. Gish RG, Clark MD, Kane SD, Shaw RE, Mangahas MF, Baqai S. Similar risk of renal events among patients treated with tenofovir or entecavir for chronic hepatitis B. Clin Gastroenterol Hepatol. 2012;10(8):941-e68. doi:10.1016/j.cgh.2012.04.008
20. Gara N, Zhao X, Collins MT, et al. Renal tubular dysfunction during long-term adefovir or tenofovir therapy in chronic hepatitis B. Aliment Pharmacol Ther. 2012;35(11):1317-1325. doi:10.1111/j.1365-2036.2012.05093.x
21. Tsai HJ, Chuang YW, Lee SW, Wu CY, Yeh HZ, Lee TY. Using the chronic kidney disease guidelines to evaluate the renal safety of tenofovir disoproxil fumarate in hepatitis B patients. Aliment Pharmacol Ther. 2018;47(12):1673-1681. doi:10.1111/apt.14682
22. Szczech LA, Gupta SK, Habash R, et al. The clinical epidemiology and course of the spectrum of renal diseases associated with HIV infection. Kidney Int. 2004;66(3):1145-1152. doi:10.1111/j.1523-1755.2004.00865.x
The Gut-Brain Axis: Literature Overview and Psychiatric Applications
The gut-brain axis (GBA) refers to the link between the human brain with its various cognitive and affective functions and the gastrointestinal (GI) system, which includes the enteric nervous system and the diverse microbiome inhabiting the gut lumen. The neurochemical aspects of the GBA have been studied in germ-free mice; these studies demonstrate how absence or derangement of this microbiome can cause significant alterations in levels of serotonin, brain-derived neurotrophic factor, tryptophan, and other neurocompounds.1,2 These neurotransmitter alterations have demonstrable effects on anxiety, cognition, socialization, and neuronal development in mice.1,2
Current evidence suggests that the GBA works through a combination of both fast-acting neural and delayed immune-mediated mechanisms in a bidirectional manner with feedback on and from both systems.3 In addition to their direct effects on neural pathways and immune modulation, intestinal microbiota are essential in the production of a vast array of vitamins, cofactors, and nutrients required for optimal health and metabolism.4 Existing research on the GBA demonstrates the direct functional impact of the intestinal microbiome on neurologic and psychiatric health.
We will review current knowledge regarding this intriguing relationship. In doing so, we take a closer look at several specific genera and families of intestinal microbiota, review the microbiome’s effects on immune function, and examine the relationship between this microbiome and mental disease, using specific examples such as generalized anxiety disorder (GAD) and major depressive disorder (MDD). We seek to consolidate existing knowledge on the intricacies of the GBA in the hope that it may promote individual health and become a standard component in the treatment of mental illness.
Direct Activation of Neuronal Pathways
Vagal and spinal afferent nerve pathways convey information regarding hormonal, chemical, and mechanical stimuli from the intestines to the brain.3 These afferent neurons have been shown to be responsive to microbial signals and cytokines as well as to gut hormones. This provides the basis for research that presumes that neurobehavioral change may ensue from manipulating the gut microbes emitting these chemical signals to which these afferent neurons respond.3 Using these same pathways, efferent neurons of the parasympathetic and sympathetic nervous systems can modulate the intestinal environment by altering acid and bile secretion, mucous production, and motility. This modulation can directly impact the relative diversity of intestinal flora, and in more extreme states, may result in bacterial overgrowth.5 Of particular relevance to mental health (MH) is that the frequency of migrating motor complexes that promote peristalsis can be directly influenced by readily modifiable behaviors such as sleep and food intake, which can cause one bacterial species to dominate in a higher percentage.5 This imbalance of gut microbes has been implicated in contributing to somatic conditions, such as irritable bowel syndrome (IBS), which the literature has shown is related to psychiatric conditions such as anxiety. 5
The Microbiome and Host Immunity
The GI tract is colonized with commensal microorganisms from dozens of bacterial, archaeal, fungal, and protozoal groups.6 This relationship has its most classical immunologic interaction in the toll-like receptors. These receptors are on the lymphoid Peyer patches of the GI tract, which sample microorganisms and develop immunoglobulin (IgA) antibodies to them. Evidence exists that commensal microflora play a critical role in the regulation of host inflammatory response.7
The relationship between the microbiome and the immune system remains poorly understood, yet evidence has shown that the use of probiotics may reduce inflammation and its sequelae. Probiotics have been shown to have a beneficial effect on autoimmune diseases, such as Crohn disease and ulcerative colitis, specifically with certain strains of Escherichia coli (E coli) and a proprietary probiotic from VSL pharmaceuticals.8,9 However, these interventions are not without risk. Fecal microbiota transplants have a risk of transferring unwanted organisms, potentially including COVID-19.10 Additionally, the use of probiotics is generally discouraged in immunocompromised, chronically ill, and/or hospitalized patients, as these patients may be at greater risk of developing probiotic bacteremia and sepsis.11
Studies have also demonstrated that ingesting probiotics may decrease the expression of pro-inflammatory cytokines.11 In a study comparing patients with ulcerative colitis who were prescribed both sulfasalazine and probiotic supplements vs sulfasalazine alone, patients who took the probiotic supplements were shown to have less colonic inflammation and decreased expression of cytokines such as IL-6, tumor necrosis factor-α (TNF-α), and nuclear factor-κβ.12
Gut-Specific Bacterial Phyla
Over the past decade, much attention has been paid toward 2 bacterial phyla that compromise a large proportion of the human gut microbiome: Firmicutes and Bacteroidetes. Intestinal Firmicutes species are predominantly Gram positive and are found as both cocci and bacilli. Well-known classes within the phylum Firmicutes include Bacilli (orders Bacillales and Lactobacillales) and Clostridia. The phylum Bacteroidetes is composed of Gram-negative rods and includes the genus Bacteroides—a substantial component of mammalian gut biomes. The ratio of Firmicutes to Bacteroidetes, also known as the F/B ratio, have shown fascinating patterns in certain psychiatric conditions. This knowledge may be applied to better identify, treat, and manage such patients.
Regarding bacterial phyla and their relationship to mood disorders, interesting patterns have been observed. In one population of patients with anorexia nervosa (AN) lower diversity within classes of Firmicutes bacteria was observed compared with age- and sex-matched controls without AN.13 As patients were re-fed and treated in this study, there was a significant corresponding increase in microbiome diversity; however, the level of bacterial diversity in re-fed patients with AN was still far less than that of patients in the control group. In patients with AN with comorbid depression, diversity was noted to be exceptionally reduced. Similarly, patients with AN with a more severe eating disorder psychopathology demonstrated decreased microbial diversity.13
The impact of intestinal microbiome diversity and relative bacterial population density in MH conditions such as anxiety, depression, and eating disorders remains an intriguing avenue worth further exploring. Modulating these phenomena may reduce overall dysfunction and serve as a possible treatment modality.
Anxiety and the Microbiome
GAD is characterized by decreased social and occupational functioning. Anxiolytic pharmacotherapy combined with psychotherapy are the current mainstays of GAD treatment. Given the interplay of the gut microbiome and MH, probiotics may prove to be a promising alternative or adjunct treatment option.
The human stress response is enacted largely through the hypothalamus-pituitary-adrenal (HPA) axis. Anxiety and situational fear trigger a stress response that results in increased cortisol being released from the adrenal glands, thereby disrupting typical GI function by modifying the frequency of migrating motor complexes, the electromechanical impulses within the smooth muscle of the stomach and small bowel that allow for propagation of chyme. This, in turn, has downstream consequences on the composition of the intestinal microbiome.14 Patients with GAD have a lower prevalence of Faecalibacterium, Eubacterium rectale, Lachnospira, Butyricioccus, and Sutterella, all important producers of short-chain fatty acids (SCFA).15,16 Diminished SCFA production has been linked to intestinal barrier dysfunction, contributing to increases in gut endothelial permeability and facilitating a proinflammatory response with resultant neural feedback loops.17,18 Indeed, proinflammatory cytokines, namely C-reactive protein (CRP), interleukin 6 (IL-6), and TNF-α were found to be elevated in patients with diagnosed GAD.19 These proinflammatory cytokines are critical in neurochemical modulation as they inhibit the essential enzyme tetrahydrobiopterin, a cofactor of monoamine synthesis, thereby decreasing the monoamine neurotransmitters serotonin, dopamine, and norepinephrine.20 Decrease in the monoamine neurotransmitters serves as the lynchpin for the monoamine hypothesis of both anxiety and depression and currently guides our choice in pharmacotherapy.21
Anxiolytic pharmacotherapy targets the neurochemical consequences of GAD to ameliorate social, functional, and emotional impairment. However, the physiology of the gut-brain feedback loop in GAD is an attractive target for the creation and trialing of probiotics, which can rebalance intestinal flora, reduce inflammation, and allow for increased synthesis of monoamine neurotransmitters. Indeed, Lactobacillus and Bifidobacterium have been shown to possess anxiolytic properties by increasing serotonin and SCFAs while reducing the HPA adrenergic response.22
Depression and the Microbiome
MDD significantly diminishes quality of life and is the leading cause of disability worldwide, affecting nearly 350 million individuals.23 Psychotherapy in conjunction with pharmacotherapy aimed at increasing cerebral serotonin availability are the current mainstays of MDD treatment. Yet the brain does not exist in isolation: It has 3 known methods of bidirectional communication with the GI tract via the vagus nerve, immune mediators, and bacterial metabolites.24,25
The vagus nerve (vagus means wandering in Latin), is the longest nerve of the autonomic nervous system (ANS) and historically has been called the pneumogastric nerve for its parasympathetic innervation of the heart, lungs, and digestive tract. Current research supports that up to 80% of the fibers within the vagus nerve are afferent, relaying signals from the GI tract to the brain.26 Therefore, modulation of vagus nerve signaling may theoretically impact mental health. Indeed, studies have demonstrated clinically significant improvement in patients with treatment-resistant depression who underwent vagal nerve stimulation (VNS).27 Although the mechanism by which it exerts its mood-modulating activity is not well understood, recent human and animal studies indicate that VNS may alter central neurotransmitter levels, having demonstrated the ability to increase serotonin levels.25 Also the vagus nerve possesses the ability to differentiate between pathogenic and nonpathogenic gut microorganisms; beneficial gut flora emit signals within the gut lumen, which in turn, are transmitted through afferent vagus nerve fibers to the brain, effecting both anti-inflammatory and mood-modulating responses.25,28
Immunomediators involving intestinal microbiota also are known to play a critical role in the pathophysiology of MDD. Depression is closely tied to systemic inflammation; both are hypothesized to have played a role in the evolutionary response to fighting infection and healing wounds.29 With regard to the gut, MDD is associated with increased GI permeability, which allows for microorganisms to leak through the intestinal mucosa into the systemic circulation and stimulate an inflammatory response.18 Levels of IgM and IgA against enterobacteria lipopolysaccharides (LPS) were found to be markedly greater in patients with MDD vs those of nondepressed controls.30 Current research indicates that IgM and IgA against LPS of translocated bacteria serve to amplify immune pathways seen in the pathophysiology of chronic MDD.30,31 Further research is indicated to deduce whether bacterial translocation with subsequent immune response induces MDD in susceptible individuals, or whether translocation occurs secondary to the systemic inflammation seen in MDD.
The makeup of the GI microbiome is fundamentally altered in patients with MDD, with a marked reduction in both microorganism diversity and density.30 Patients with MDD have been shown to have increased levels of Alistipes, a bacterium that also is elevated in chronic fatigue syndrome and irritable bowel syndrome (IBS), diagnoses that are associated with MDD.32-34 Lower counts of Bifidobacterium and Lactobacillus are documented in both MDD and IBS patients as well.35 Decreased Bifidobacterium and Lactobacillus might indicate a causal rather than correlative relationship as these bacterium take the precursor monosodium glutamate to create γ-aminobutyric acid (GABA).36
Psychobiotics and Mental Health
The pathophysiology of the bidirectional communication between the gut and the brain offers an attractive approach for treatment modalities. Currently, the research into probiotic supplementation to treat mental disorders, such as anxiety and depression, is still in its infancy, and treatment guidelines do not support their routine administration. There is great promise in the use of probiotics to ameliorate psychiatric symptomatology, referred to by many in the field as psychobiotics.
One pathophysiology of the stress response seen in anxiety can be traced to the HPA axis and increased cortisol levels, with downstream effects on the microbiome through modification of the migrating motor complexes. Healthy volunteers tasked with taking a trademarked galactooligosaccharide prebiotic daily for 3 weeks had a reduced salivary cortisol awakening response compared with that of a placebo (maltodextrin). The same group demonstrated decreased attentional vigilance to negative information in a dot-probe task compared with attentional vigilance with positive information.37 It is possible that this was due to the decreased stress response secondary to probiotic consumption. In mice models, a probiotic consisting of Lactobacillus helveticus and Bifidobacterium longum (B longum) (bacterium that are decreased in GAD and MDD) demonstrated anxiolytic-like behavior. The same formulation also demonstrated beneficial psychological effects in healthy human volunteers.22 In mice models, Lactobacillus feeding was superior to citalopram in anxiolysis and in cognitive functioning.38
Like GAD, the pathophysiology of the GBA in MDD is an attractive target for psychobiotic therapy. Although current research is not yet sufficient to create general guidelines or recommendations for the routine administration of psychobiotics, it holds significant promise as an effective primary and/or adjunct treatment. In patients with IBS, administration of B longum reduced depression and increased quality of life. This same study demonstrated that probiotic administration was associated with reduced limbic activity in the brain.39 In MDD, the hippocampus demonstrates altered expression of various transcription factors and cellular metabolism.40 In a double-blind placebo-controlled trial, Lactobaccillus rhamnosus supplementation in postnatal mothers resulted in less severe depressive symptoms reported.41 Furthermore, probiotic supplementation consisting of Lactobacillus acidophilus, Lactobacillus casei, and Bifidobacterium bifidum in patients with MDD for 8 weeks had significant decreases in score on the Beck Depression Inventory scale.42 Also, a meta-analysis of probiotic administration on depression scales demonstrated appreciably lower scores after administration in both patients with MDD and healthy patients aged 60 years, although these results were found to be correlative.43 However, while promising, another meta-analysis of 10 randomized controlled trials found probiotic supplementation had no significant effect on mood.44
The Role of Diet
Although there has been tremendous focus on new and improved therapeutics to address MH conditions, such as depression and anxiety, there also has been renewed interest in the fundamental importance and benefit of a wholesome diet. Recent literature has shown how diet may play a pivotal role in the development and severity of mental illness and holds promise as another potential target for treatment. A 2010 cross-sectional population study of more than 1000 adult women aged 20 to 93 years demonstrated that women with a largely Western dietary pattern (ie, largely composed of processed meats, pizza, chips, hamburgers, white bread, sugar, flavored milk drinks, and beer) were more likely to have dysthymic disorder or major depression, whereas women in this same cohort with a more traditional dietary pattern (ie, composed mainly of vegetables, fruit, lamb, beef, fish, and whole grains) were found to have significantly reduced odds for depression or dysthymic disorder as well as anxiety disorders.45
Several other large-scale population studies such as the SUN cohort study, Hordaland Health study, Whitehall II cohort study, and RHEA mother and baby cohort study have demonstrated similar findings: that a more wholesome diet composed mainly of lean meats, vegetables, fruits, and whole grains was associated with significantly reduced risk of depression compared with a largely processed, high fat, and high sugar diet. This trend also has been observed in children and adolescents and is of particular importance when considering that many psychological and psychiatric problems tend to arise in the formative and often turbulent years prior to adulthood.46
The causal relationship between diet and MH may be better understood by taking a closer look at a crucial intermediate factor: the gut microbiome. The interplay between diet and intestinal microbiome was well elucidated in a landmark 2010 study by De Filippo and colleagues.47 In this study, the microbiota of 14 healthy children from a small village in Burkina Faso (BF) were compared with those of 15 healthy children from an urban area of Florence, Italy (EU). The BF children were reported to consume a traditional rural African diet that is primarily vegetarian, rich in fiber, and low in animal protein and fat, whereas the EU children were noted as consuming a typical Western diet low in fiber but rich in animal protein, fat, sugar, and starch. Comparison revealed that EU children had a higher F/B ratio than their BF counterparts, a metric that has been associated with obesity.47 Furthermore, increased exposure to environmental microbes associated with a fiber-rich diet has been postulated to increase the richness of intestinal flora and serve as a protective factor against noninfectious and inflammatory colonic diseases, which are found to be more prevalent in Western nations whose diets lack fiber. BF children were found to have increased microbial diversity and increased abundance of bacteria capable of producing SCFA relative to their EU counterparts, both of which have a positive influence on the gut, systemic inflammation, and MH.47
Conclusions
Diet has a powerful impact on the intestinal microbiome, which in turn directly impacts our physical and MH in myriad ways. The well-known benefits of a wholesome, nutritious, and well-varied diet include reduced cardiovascular risk, improved glycemic control, GI regularity, and decreased depression. Along with a balanced diet, patients may achieve further benefit with the addition of probiotics.
With regard to psychiatry in particular, increased awareness of the intimate relationship between the gut and the brain is expected to have profound implications for the field. Given this mounting data, immunology, microbiology, and GI pathophysiology should be included in future discussions regarding MH. Their application will likely improve both somatic and mental well-being. We anticipate that newly discovered probiotics and other psychobiotic formulations will be routinely included in a psychiatrist’s pharmacopeia in the near future. Unfortunately, as is clear from our review of the current literature, we do not yet have specific interventions targeting the intestinal microbiome to recommend for the management of specific psychiatric conditions. However, this should not deter further exploring diet modification and psychobiotic supplementation as a means of impacting the intestinal microbiome in the pursuit of psychiatric symptom relief.
Dietary modification is already a standard component of sound primary care medicine, designed to mitigate risk for cardiovascular disease. This exploration can occur as part of otherwise standard psychiatric care and be used as a form of behavioral activation for the patient. Furthermore, explaining the interconnectedness of the mind, brain, and body along with the rationale for experimentation could further help destigmatize the experience of mental illness.
1. Diaz Heijtz R, Wang S, Anuar F, et al. Normal gut microbiota modulates brain development and behavior. Proc Natl Acad Sci USA. 2011;108(7):3047-3052. doi:10.1073/pnas.1010529108
2. Tomkovich S, Jobin C. Microbiota and host immune responses: a love-hate relationship. Immunology. 2016;147(1):1-10. doi:10.1111/imm.12538
3. Bruce-Keller AJ, Salbaum JM, Berthoud HR. Harnessing gut microbes for mental health: getting from here to there. Biol Psychiatry. 2018;83(3):214-223. doi:10.1016/j.biopsych.2017.08.014
4. Patterson E, Cryan JF, Fitzgerald GF, Ross RP, Dinan TG, Stanton C. Gut microbiota, the pharmabiotics they produce and host health. Proc Nutr Soc. 2014;73(4):477-489. doi:10.1017/S0029665114001426
5. Mayer EA, Tillisch K, Gupta A. Gut/brain axis and the microbiota. J Clin Invest. 2015;125(3):926-938. doi:10.1172/JCI76304
6. Lazar V, Ditu LM, Pircalabioru GG, et al. Aspects of gut microbiota and immune system interactions in infectious diseases, immunopathology, and cancer. Front Immunol. 2018;9:1830. doi:10.3389/fimmu.2018.01830
7. Rakoff-Nahoum S, Paglino J, Eslami-Varzaneh F, Edberg S, Medzhitov R. Recognition of commensal microflora by toll-like receptors is required for intestinal homeostasis. Cell. 2004;118(2):229-241. doi:10.1016/j.cell.2004.07.002
8. Ghosh S, van Heel D, Playford RJ. Probiotics in inflammatory bowel disease: is it all gut flora modulation? Gut. 2004;53(5):620-622. doi:10.1136/gut.2003.034249
9. Fedorak RN. Probiotics in the management of ulcerative colitis. Gastroenterol Hepatol (NY). 2010;6(11):688-690.
10. Ianiro G, Mullish BH, Kelly CR, et al. Screening of faecal microbiota transplant donors during the COVID-19 outbreak: suggestions for urgent updates from an international expert panel. Lancet Gastroenterol Hepatol. 2020;5(5):430-432. doi:10.1016/S2468-1253(20)30082-0
11. Verna EC, Lucak S. Use of probiotics in gastrointestinal disorders: what to recommend? Therap Adv Gastroenterol. 2010;3(5):307-319. doi:10.1177/1756283X10373814
12. Hegazy SK, El-Bedewy MM. Effect of probiotics on pro-inflammatory cytokines and NF-kappaB activation in ulcerative colitis. World J Gastroenterol. 2010;16(33):4145-4151. doi:10.3748/wjg.v16.i33.4145
13. Kleiman SC, Watson HJ, Bulik-Sullivan EC, et al. The intestinal microbiota in acute anorexia nervosa and during renourishment: relationship to depression, anxiety, and eating disorder psychopathology. Psychosom Med. 2015;77(9):969-981. doi:10.1097/PSY.0000000000000247
14. Rodes L, Paul A, Coussa-Charley M, et al. Transit time affects the community stability of Lactobacillus and Bifidobacterium species in an in vitro model of human colonic microbiotia. Artif Cells Blood Substit Immobil Biotechnol. 2011;39(6):351-356. doi:10.3109/10731199.2011.622280
15. Jiang HY, Zhang X, Yu ZH, et al. Altered gut microbiota profile in patients with generalized anxiety disorder. J Psychiatr Res. 2018;104:130-136. doi:10.1016/j.jpsychires.2018.07.007
16. van de Wouw M, Boehme M, Lyte JM, et al. Short‐chain fatty acids: microbial metabolites that alleviate stress‐induced brain–gut axis alterations. J Physiol. 2018;596(20):4923-4944 doi:10.1113/JP276431.
17. Morris G, Berk M, Carvalho A, et al. The role of the microbial metabolites including tryptophan catabolites and short chain fatty acids in the pathophysiology of immune-inflammatory and neuroimmune disease. Mol Neurobiol. 2017;54(6):4432-4451 doi:10.1007/s12035-016-0004-2.
18. Kelly JR, Kennedy PJ, Cryan JF, Dinan TG, Clarke G, Hyland NP. Breaking down the barriers: the gut microbiome, intestinal permeability and stress-related psychiatric disorders. Front Cell Neurosci. 2015;9:392. doi:10.3389/fncel.2015.00392
19. Duivis HE, Vogelzangs N, Kupper N, de Jonge P, Penninx BW. Differential association of somatic and cognitive symptoms of depression and anxiety with inflammation: findings from the Netherlands Study of Depression and Anxiety (NESDA). Psychoneuroendocrinology. 2013;38(9):1573-1585. doi:10.1016/j.psyneuen.2013.01.002
20. Miller AH, Raison CL. The role of inflammation in depression: from evolutionary imperative to modern treatment target. Nat Rev Immunol. 2016;16(1):22-34. doi:10.1038/nri.2015.5
21. Morilak DA, Frazer A. Antidepressants and brain monoaminergic systems: a dimensional approach to understanding their behavioural effects in depression and anxiety disorders. Int J Neuropsychopharmacol. 2004;7(2):193-218. doi:10.1017/S1461145704004080
22. Messaoudi M, Lalonde R, Violle N, et al. Assessment of psychotropic-like properties of a probiotic formulation (Lactobacillus helveticus R0052 and Bifidobacterium longum R0175) in rats and human subjects. Br J Nutr. 2011;105(5):755-764. doi:10.1017/S0007114510004319
23. Ishak WW, Mirocha J, James D. Quality of life in major depressive disorder before/after multiple steps of treatment and one-year follow-up. Acta Psychiatr Scand. 2014;131(1):51-60. doi:10.1111/acps.12301
24. El Aidy S, Dinan TG, Cryan JF. Immune modulation of the brain-gut-microbe axis. Front Microbiol. 2014;5:146. doi:10.3389/fmicb.2014.00146
25. Browning KN, Verheijden S, Boeckxstaens GE. The vagus nerve in appetite regulation, mood, and intestinal inflammation. Gastroenterology. 2017;152(4):730-744. doi:10.1053/j.gastro.2016.10.046
26. Berthoud HR, Neuhuber WL. Functional and chemical anatomy of the afferent vagal system. Auton Neurosci. 2000;85(1-3):1-7. doi:10.1016/S1566-0702(00)00215-0
27. Nahas Z, Marangell LB, Husain MM, et al. Two-year outcome of vagus nerve stimulation (VNS) for treatment of major depressive episodes. J Clin Psychiatry. 2005;66(9). doi:10.4088/jcp.v66n0902
28. Forsythe P, Bienenstock J, Kunze WA. Vagal pathways for microbiome-brain-gut axis communication. In: Microbial Endocrinology: The Microbiota-Gut-Brain Axis in Health and Disease. New York, NY: Springer; 2014:115-133.
29. Miller AH, Raison CL. The role of inflammation in depression: from evolutionary imperative to modern treatment target. Nat Rev Immunol. 2015;16(1):22-34. doi:10.1038/nri.2015.5
30. Mass M, Kubera M, Leunis JC. The gut-brain barrier in major depression: intestinal mucosal dysfunction with an increased translocation of LPS from gram negative enterobacteria (leaky gut) plays a role in the inflammatory pathophysiology of depression. Neuro Endocrinol Lett. 2008;29(1):117-124.
31. Goehler LE, Gaykema RP, Opitz N, Reddaway R, Badr N, Lyte M. Activation in vagal afferents and central autonomic pathways: early responses to intestinal infection with Campylobacter jejuni. Brain, Behav Immun. 2005;19(4):334-344. doi:10.1016/j.bbi.2004.09.002
32. Stevens BR, Goel R, Seungbum K, et al. Increased human intestinal barrier permeability plasma biomarkers zonulin and FABP2 correlated with plasma LPS and altered gut microbiome in anxiety or depression. Gut. 2018;67(8):1555-1557. doi:10.1136/gutjnl-2017-314759

33. Kelly JR, Borre Y, O’Brien C, et al. Transferring the blues: depression-associated gut microbiota induces neurobehavioural changes in the rat. J Psychiatr Res. 2016;82:109-118. doi:10.1016/j.jpsychires.2016.07.019
34. Jiang H, Ling Z, Zhang Y, et al. Altered fecal microbiota composition in patients with major depressive disorder. Brain Behav Immun. 2015;48:186-194. doi:10.1016/j.bbi.2015.03.016
35. Frémont M, Coomans D, Massart S, De Meirleir K. High-throughput 16S rRNA gene sequencing reveals alterations of intestinal microbiota in myalgic encephalomyelitis/chronic fatigue syndrome patients. Anaerobe. 2013;22:50-56. doi:10.1016/j.anaerobe.2013.06.002
36. Saulnier DM, Riehle K, Mistretta TA, et al. Gastrointestinal microbiome signatures of pediatric patients with irritable bowel syndrome. Gastroenterol. 2011;141(5):1782-1791. doi:10.1053/j.gastro.2011.06.072
37. Schmidt K, Cowen PJ, Harmer CJ, Tzortzis G, Errington S, Burnet PW. Prebiotic intake reduces the waking cortisol response and alters emotional bias in healthy volunteers. Psychopharmacology (Berl). 2015;232(10):1793-1801. doi:10.1007/s00213-014-3810-0
38. Liang S, Wang T, Hu X, et al. Administration of Lactobacillus helveticus NS8 improves behavioral, cognitive, and biochemical aberrations caused by chronic restraint stress. Neuroscience. 2015;310:561-577. doi:10.1016/j.neuroscience
39. Pinto-Sanchez MI, Hall GB, Ghajar K, et al. Probiotic Bifidobacterium longum NCC3001 reduces depression scores and alters brain activity: a pilot study in patients with irritable bowel syndrome. Gastroenterology. 2017;153(2):448-459. doi:10.1053/j.gastro.2017.05.003
40. Sequeira A, Klempan T, Canetti L, Benkelfat C, Rouleau GA, Turecki G. Patterns of gene expression in the limbic system of suicides with and without major depression. Mol Psychiatry. 2007;12(7):640-555. doi:10.1038/sj.mp.4001969
41. Slykerman RF, Hood F, Wickens K, et al. Effect of Lactobacillus rhamnosus HN001 in pregnancy on postpartum symptoms of depression and anxiety: a randomised double-blind placebo-controlled trial. EBioMedicine. 2017;24:159-165. doi:10.1016/j.ebiom.2017.09.013
42. Akkasheh G, Kashani-Poor Z, Tajabadi-Ebrahimi M, et al. Clinical and metabolic response to probiotic administration in patients with major depressive disorder: a randomized, double-blind, placebo-controlled trial. Nutrition. 2016;32(3):315-320. doi:10.1016/j.nut.2015.09.003
43. Huang R, Wang K, Hu J. Effect of probiotics on depression: a systematic review and meta-analysis of randomized controlled trials. Nutrients. 2016;8(8):483. doi:10.3390/nu8080483
44. Ng QX, Peters C, Ho CY, Lim DY, Yeo WS. A meta-analysis of the use of probiotics to alleviate depressive symptoms. J Affect Disord. 2018;228:13-19. doi:10.1016/j.jad.2017.11.063
45. Jacka FN, Pasco JA, Mykletun A, et al. Association of Western and traditional diets with depression and anxiety in women. Am J Psychiatry. 2010;167(3):305-311. doi:10.1176/appi.ajp.2009.09060881.
46. Jacka FN, Mykletun A, Berk M. Moving towards a population health approach to the primary prevention of common mental disorders. BMC Med. 2012;10:149. doi: 10.1186/1741-7015-10-149
47. De Filippo C, Cavalieri D, Di Paola Met, et al. Impact of diet in shaping gut microbiota revealed by a comparative study in children from Europe and rural Africa. Proc Natl Acad Sci U S A. 2010;107(33):14691-14696. doi:10.1073/pnas.1005963107
The gut-brain axis (GBA) refers to the link between the human brain with its various cognitive and affective functions and the gastrointestinal (GI) system, which includes the enteric nervous system and the diverse microbiome inhabiting the gut lumen. The neurochemical aspects of the GBA have been studied in germ-free mice; these studies demonstrate how absence or derangement of this microbiome can cause significant alterations in levels of serotonin, brain-derived neurotrophic factor, tryptophan, and other neurocompounds.1,2 These neurotransmitter alterations have demonstrable effects on anxiety, cognition, socialization, and neuronal development in mice.1,2
Current evidence suggests that the GBA works through a combination of both fast-acting neural and delayed immune-mediated mechanisms in a bidirectional manner with feedback on and from both systems.3 In addition to their direct effects on neural pathways and immune modulation, intestinal microbiota are essential in the production of a vast array of vitamins, cofactors, and nutrients required for optimal health and metabolism.4 Existing research on the GBA demonstrates the direct functional impact of the intestinal microbiome on neurologic and psychiatric health.
We will review current knowledge regarding this intriguing relationship. In doing so, we take a closer look at several specific genera and families of intestinal microbiota, review the microbiome’s effects on immune function, and examine the relationship between this microbiome and mental disease, using specific examples such as generalized anxiety disorder (GAD) and major depressive disorder (MDD). We seek to consolidate existing knowledge on the intricacies of the GBA in the hope that it may promote individual health and become a standard component in the treatment of mental illness.
Direct Activation of Neuronal Pathways
Vagal and spinal afferent nerve pathways convey information regarding hormonal, chemical, and mechanical stimuli from the intestines to the brain.3 These afferent neurons have been shown to be responsive to microbial signals and cytokines as well as to gut hormones. This provides the basis for research that presumes that neurobehavioral change may ensue from manipulating the gut microbes emitting these chemical signals to which these afferent neurons respond.3 Using these same pathways, efferent neurons of the parasympathetic and sympathetic nervous systems can modulate the intestinal environment by altering acid and bile secretion, mucous production, and motility. This modulation can directly impact the relative diversity of intestinal flora, and in more extreme states, may result in bacterial overgrowth.5 Of particular relevance to mental health (MH) is that the frequency of migrating motor complexes that promote peristalsis can be directly influenced by readily modifiable behaviors such as sleep and food intake, which can cause one bacterial species to dominate in a higher percentage.5 This imbalance of gut microbes has been implicated in contributing to somatic conditions, such as irritable bowel syndrome (IBS), which the literature has shown is related to psychiatric conditions such as anxiety. 5
The Microbiome and Host Immunity
The GI tract is colonized with commensal microorganisms from dozens of bacterial, archaeal, fungal, and protozoal groups.6 This relationship has its most classical immunologic interaction in the toll-like receptors. These receptors are on the lymphoid Peyer patches of the GI tract, which sample microorganisms and develop immunoglobulin (IgA) antibodies to them. Evidence exists that commensal microflora play a critical role in the regulation of host inflammatory response.7
The relationship between the microbiome and the immune system remains poorly understood, yet evidence has shown that the use of probiotics may reduce inflammation and its sequelae. Probiotics have been shown to have a beneficial effect on autoimmune diseases, such as Crohn disease and ulcerative colitis, specifically with certain strains of Escherichia coli (E coli) and a proprietary probiotic from VSL pharmaceuticals.8,9 However, these interventions are not without risk. Fecal microbiota transplants have a risk of transferring unwanted organisms, potentially including COVID-19.10 Additionally, the use of probiotics is generally discouraged in immunocompromised, chronically ill, and/or hospitalized patients, as these patients may be at greater risk of developing probiotic bacteremia and sepsis.11
Studies have also demonstrated that ingesting probiotics may decrease the expression of pro-inflammatory cytokines.11 In a study comparing patients with ulcerative colitis who were prescribed both sulfasalazine and probiotic supplements vs sulfasalazine alone, patients who took the probiotic supplements were shown to have less colonic inflammation and decreased expression of cytokines such as IL-6, tumor necrosis factor-α (TNF-α), and nuclear factor-κβ.12
Gut-Specific Bacterial Phyla
Over the past decade, much attention has been paid toward 2 bacterial phyla that compromise a large proportion of the human gut microbiome: Firmicutes and Bacteroidetes. Intestinal Firmicutes species are predominantly Gram positive and are found as both cocci and bacilli. Well-known classes within the phylum Firmicutes include Bacilli (orders Bacillales and Lactobacillales) and Clostridia. The phylum Bacteroidetes is composed of Gram-negative rods and includes the genus Bacteroides—a substantial component of mammalian gut biomes. The ratio of Firmicutes to Bacteroidetes, also known as the F/B ratio, have shown fascinating patterns in certain psychiatric conditions. This knowledge may be applied to better identify, treat, and manage such patients.
Regarding bacterial phyla and their relationship to mood disorders, interesting patterns have been observed. In one population of patients with anorexia nervosa (AN) lower diversity within classes of Firmicutes bacteria was observed compared with age- and sex-matched controls without AN.13 As patients were re-fed and treated in this study, there was a significant corresponding increase in microbiome diversity; however, the level of bacterial diversity in re-fed patients with AN was still far less than that of patients in the control group. In patients with AN with comorbid depression, diversity was noted to be exceptionally reduced. Similarly, patients with AN with a more severe eating disorder psychopathology demonstrated decreased microbial diversity.13
The impact of intestinal microbiome diversity and relative bacterial population density in MH conditions such as anxiety, depression, and eating disorders remains an intriguing avenue worth further exploring. Modulating these phenomena may reduce overall dysfunction and serve as a possible treatment modality.
Anxiety and the Microbiome
GAD is characterized by decreased social and occupational functioning. Anxiolytic pharmacotherapy combined with psychotherapy are the current mainstays of GAD treatment. Given the interplay of the gut microbiome and MH, probiotics may prove to be a promising alternative or adjunct treatment option.
The human stress response is enacted largely through the hypothalamus-pituitary-adrenal (HPA) axis. Anxiety and situational fear trigger a stress response that results in increased cortisol being released from the adrenal glands, thereby disrupting typical GI function by modifying the frequency of migrating motor complexes, the electromechanical impulses within the smooth muscle of the stomach and small bowel that allow for propagation of chyme. This, in turn, has downstream consequences on the composition of the intestinal microbiome.14 Patients with GAD have a lower prevalence of Faecalibacterium, Eubacterium rectale, Lachnospira, Butyricioccus, and Sutterella, all important producers of short-chain fatty acids (SCFA).15,16 Diminished SCFA production has been linked to intestinal barrier dysfunction, contributing to increases in gut endothelial permeability and facilitating a proinflammatory response with resultant neural feedback loops.17,18 Indeed, proinflammatory cytokines, namely C-reactive protein (CRP), interleukin 6 (IL-6), and TNF-α were found to be elevated in patients with diagnosed GAD.19 These proinflammatory cytokines are critical in neurochemical modulation as they inhibit the essential enzyme tetrahydrobiopterin, a cofactor of monoamine synthesis, thereby decreasing the monoamine neurotransmitters serotonin, dopamine, and norepinephrine.20 Decrease in the monoamine neurotransmitters serves as the lynchpin for the monoamine hypothesis of both anxiety and depression and currently guides our choice in pharmacotherapy.21
Anxiolytic pharmacotherapy targets the neurochemical consequences of GAD to ameliorate social, functional, and emotional impairment. However, the physiology of the gut-brain feedback loop in GAD is an attractive target for the creation and trialing of probiotics, which can rebalance intestinal flora, reduce inflammation, and allow for increased synthesis of monoamine neurotransmitters. Indeed, Lactobacillus and Bifidobacterium have been shown to possess anxiolytic properties by increasing serotonin and SCFAs while reducing the HPA adrenergic response.22
Depression and the Microbiome
MDD significantly diminishes quality of life and is the leading cause of disability worldwide, affecting nearly 350 million individuals.23 Psychotherapy in conjunction with pharmacotherapy aimed at increasing cerebral serotonin availability are the current mainstays of MDD treatment. Yet the brain does not exist in isolation: It has 3 known methods of bidirectional communication with the GI tract via the vagus nerve, immune mediators, and bacterial metabolites.24,25
The vagus nerve (vagus means wandering in Latin), is the longest nerve of the autonomic nervous system (ANS) and historically has been called the pneumogastric nerve for its parasympathetic innervation of the heart, lungs, and digestive tract. Current research supports that up to 80% of the fibers within the vagus nerve are afferent, relaying signals from the GI tract to the brain.26 Therefore, modulation of vagus nerve signaling may theoretically impact mental health. Indeed, studies have demonstrated clinically significant improvement in patients with treatment-resistant depression who underwent vagal nerve stimulation (VNS).27 Although the mechanism by which it exerts its mood-modulating activity is not well understood, recent human and animal studies indicate that VNS may alter central neurotransmitter levels, having demonstrated the ability to increase serotonin levels.25 Also the vagus nerve possesses the ability to differentiate between pathogenic and nonpathogenic gut microorganisms; beneficial gut flora emit signals within the gut lumen, which in turn, are transmitted through afferent vagus nerve fibers to the brain, effecting both anti-inflammatory and mood-modulating responses.25,28
Immunomediators involving intestinal microbiota also are known to play a critical role in the pathophysiology of MDD. Depression is closely tied to systemic inflammation; both are hypothesized to have played a role in the evolutionary response to fighting infection and healing wounds.29 With regard to the gut, MDD is associated with increased GI permeability, which allows for microorganisms to leak through the intestinal mucosa into the systemic circulation and stimulate an inflammatory response.18 Levels of IgM and IgA against enterobacteria lipopolysaccharides (LPS) were found to be markedly greater in patients with MDD vs those of nondepressed controls.30 Current research indicates that IgM and IgA against LPS of translocated bacteria serve to amplify immune pathways seen in the pathophysiology of chronic MDD.30,31 Further research is indicated to deduce whether bacterial translocation with subsequent immune response induces MDD in susceptible individuals, or whether translocation occurs secondary to the systemic inflammation seen in MDD.
The makeup of the GI microbiome is fundamentally altered in patients with MDD, with a marked reduction in both microorganism diversity and density.30 Patients with MDD have been shown to have increased levels of Alistipes, a bacterium that also is elevated in chronic fatigue syndrome and irritable bowel syndrome (IBS), diagnoses that are associated with MDD.32-34 Lower counts of Bifidobacterium and Lactobacillus are documented in both MDD and IBS patients as well.35 Decreased Bifidobacterium and Lactobacillus might indicate a causal rather than correlative relationship as these bacterium take the precursor monosodium glutamate to create γ-aminobutyric acid (GABA).36
Psychobiotics and Mental Health
The pathophysiology of the bidirectional communication between the gut and the brain offers an attractive approach for treatment modalities. Currently, the research into probiotic supplementation to treat mental disorders, such as anxiety and depression, is still in its infancy, and treatment guidelines do not support their routine administration. There is great promise in the use of probiotics to ameliorate psychiatric symptomatology, referred to by many in the field as psychobiotics.
One pathophysiology of the stress response seen in anxiety can be traced to the HPA axis and increased cortisol levels, with downstream effects on the microbiome through modification of the migrating motor complexes. Healthy volunteers tasked with taking a trademarked galactooligosaccharide prebiotic daily for 3 weeks had a reduced salivary cortisol awakening response compared with that of a placebo (maltodextrin). The same group demonstrated decreased attentional vigilance to negative information in a dot-probe task compared with attentional vigilance with positive information.37 It is possible that this was due to the decreased stress response secondary to probiotic consumption. In mice models, a probiotic consisting of Lactobacillus helveticus and Bifidobacterium longum (B longum) (bacterium that are decreased in GAD and MDD) demonstrated anxiolytic-like behavior. The same formulation also demonstrated beneficial psychological effects in healthy human volunteers.22 In mice models, Lactobacillus feeding was superior to citalopram in anxiolysis and in cognitive functioning.38
Like GAD, the pathophysiology of the GBA in MDD is an attractive target for psychobiotic therapy. Although current research is not yet sufficient to create general guidelines or recommendations for the routine administration of psychobiotics, it holds significant promise as an effective primary and/or adjunct treatment. In patients with IBS, administration of B longum reduced depression and increased quality of life. This same study demonstrated that probiotic administration was associated with reduced limbic activity in the brain.39 In MDD, the hippocampus demonstrates altered expression of various transcription factors and cellular metabolism.40 In a double-blind placebo-controlled trial, Lactobaccillus rhamnosus supplementation in postnatal mothers resulted in less severe depressive symptoms reported.41 Furthermore, probiotic supplementation consisting of Lactobacillus acidophilus, Lactobacillus casei, and Bifidobacterium bifidum in patients with MDD for 8 weeks had significant decreases in score on the Beck Depression Inventory scale.42 Also, a meta-analysis of probiotic administration on depression scales demonstrated appreciably lower scores after administration in both patients with MDD and healthy patients aged 60 years, although these results were found to be correlative.43 However, while promising, another meta-analysis of 10 randomized controlled trials found probiotic supplementation had no significant effect on mood.44
The Role of Diet
Although there has been tremendous focus on new and improved therapeutics to address MH conditions, such as depression and anxiety, there also has been renewed interest in the fundamental importance and benefit of a wholesome diet. Recent literature has shown how diet may play a pivotal role in the development and severity of mental illness and holds promise as another potential target for treatment. A 2010 cross-sectional population study of more than 1000 adult women aged 20 to 93 years demonstrated that women with a largely Western dietary pattern (ie, largely composed of processed meats, pizza, chips, hamburgers, white bread, sugar, flavored milk drinks, and beer) were more likely to have dysthymic disorder or major depression, whereas women in this same cohort with a more traditional dietary pattern (ie, composed mainly of vegetables, fruit, lamb, beef, fish, and whole grains) were found to have significantly reduced odds for depression or dysthymic disorder as well as anxiety disorders.45
Several other large-scale population studies such as the SUN cohort study, Hordaland Health study, Whitehall II cohort study, and RHEA mother and baby cohort study have demonstrated similar findings: that a more wholesome diet composed mainly of lean meats, vegetables, fruits, and whole grains was associated with significantly reduced risk of depression compared with a largely processed, high fat, and high sugar diet. This trend also has been observed in children and adolescents and is of particular importance when considering that many psychological and psychiatric problems tend to arise in the formative and often turbulent years prior to adulthood.46
The causal relationship between diet and MH may be better understood by taking a closer look at a crucial intermediate factor: the gut microbiome. The interplay between diet and intestinal microbiome was well elucidated in a landmark 2010 study by De Filippo and colleagues.47 In this study, the microbiota of 14 healthy children from a small village in Burkina Faso (BF) were compared with those of 15 healthy children from an urban area of Florence, Italy (EU). The BF children were reported to consume a traditional rural African diet that is primarily vegetarian, rich in fiber, and low in animal protein and fat, whereas the EU children were noted as consuming a typical Western diet low in fiber but rich in animal protein, fat, sugar, and starch. Comparison revealed that EU children had a higher F/B ratio than their BF counterparts, a metric that has been associated with obesity.47 Furthermore, increased exposure to environmental microbes associated with a fiber-rich diet has been postulated to increase the richness of intestinal flora and serve as a protective factor against noninfectious and inflammatory colonic diseases, which are found to be more prevalent in Western nations whose diets lack fiber. BF children were found to have increased microbial diversity and increased abundance of bacteria capable of producing SCFA relative to their EU counterparts, both of which have a positive influence on the gut, systemic inflammation, and MH.47
Conclusions
Diet has a powerful impact on the intestinal microbiome, which in turn directly impacts our physical and MH in myriad ways. The well-known benefits of a wholesome, nutritious, and well-varied diet include reduced cardiovascular risk, improved glycemic control, GI regularity, and decreased depression. Along with a balanced diet, patients may achieve further benefit with the addition of probiotics.
With regard to psychiatry in particular, increased awareness of the intimate relationship between the gut and the brain is expected to have profound implications for the field. Given this mounting data, immunology, microbiology, and GI pathophysiology should be included in future discussions regarding MH. Their application will likely improve both somatic and mental well-being. We anticipate that newly discovered probiotics and other psychobiotic formulations will be routinely included in a psychiatrist’s pharmacopeia in the near future. Unfortunately, as is clear from our review of the current literature, we do not yet have specific interventions targeting the intestinal microbiome to recommend for the management of specific psychiatric conditions. However, this should not deter further exploring diet modification and psychobiotic supplementation as a means of impacting the intestinal microbiome in the pursuit of psychiatric symptom relief.
Dietary modification is already a standard component of sound primary care medicine, designed to mitigate risk for cardiovascular disease. This exploration can occur as part of otherwise standard psychiatric care and be used as a form of behavioral activation for the patient. Furthermore, explaining the interconnectedness of the mind, brain, and body along with the rationale for experimentation could further help destigmatize the experience of mental illness.
1. Diaz Heijtz R, Wang S, Anuar F, et al. Normal gut microbiota modulates brain development and behavior. Proc Natl Acad Sci USA. 2011;108(7):3047-3052. doi:10.1073/pnas.1010529108
2. Tomkovich S, Jobin C. Microbiota and host immune responses: a love-hate relationship. Immunology. 2016;147(1):1-10. doi:10.1111/imm.12538
3. Bruce-Keller AJ, Salbaum JM, Berthoud HR. Harnessing gut microbes for mental health: getting from here to there. Biol Psychiatry. 2018;83(3):214-223. doi:10.1016/j.biopsych.2017.08.014
4. Patterson E, Cryan JF, Fitzgerald GF, Ross RP, Dinan TG, Stanton C. Gut microbiota, the pharmabiotics they produce and host health. Proc Nutr Soc. 2014;73(4):477-489. doi:10.1017/S0029665114001426
5. Mayer EA, Tillisch K, Gupta A. Gut/brain axis and the microbiota. J Clin Invest. 2015;125(3):926-938. doi:10.1172/JCI76304
6. Lazar V, Ditu LM, Pircalabioru GG, et al. Aspects of gut microbiota and immune system interactions in infectious diseases, immunopathology, and cancer. Front Immunol. 2018;9:1830. doi:10.3389/fimmu.2018.01830
7. Rakoff-Nahoum S, Paglino J, Eslami-Varzaneh F, Edberg S, Medzhitov R. Recognition of commensal microflora by toll-like receptors is required for intestinal homeostasis. Cell. 2004;118(2):229-241. doi:10.1016/j.cell.2004.07.002
8. Ghosh S, van Heel D, Playford RJ. Probiotics in inflammatory bowel disease: is it all gut flora modulation? Gut. 2004;53(5):620-622. doi:10.1136/gut.2003.034249
9. Fedorak RN. Probiotics in the management of ulcerative colitis. Gastroenterol Hepatol (NY). 2010;6(11):688-690.
10. Ianiro G, Mullish BH, Kelly CR, et al. Screening of faecal microbiota transplant donors during the COVID-19 outbreak: suggestions for urgent updates from an international expert panel. Lancet Gastroenterol Hepatol. 2020;5(5):430-432. doi:10.1016/S2468-1253(20)30082-0
11. Verna EC, Lucak S. Use of probiotics in gastrointestinal disorders: what to recommend? Therap Adv Gastroenterol. 2010;3(5):307-319. doi:10.1177/1756283X10373814
12. Hegazy SK, El-Bedewy MM. Effect of probiotics on pro-inflammatory cytokines and NF-kappaB activation in ulcerative colitis. World J Gastroenterol. 2010;16(33):4145-4151. doi:10.3748/wjg.v16.i33.4145
13. Kleiman SC, Watson HJ, Bulik-Sullivan EC, et al. The intestinal microbiota in acute anorexia nervosa and during renourishment: relationship to depression, anxiety, and eating disorder psychopathology. Psychosom Med. 2015;77(9):969-981. doi:10.1097/PSY.0000000000000247
14. Rodes L, Paul A, Coussa-Charley M, et al. Transit time affects the community stability of Lactobacillus and Bifidobacterium species in an in vitro model of human colonic microbiotia. Artif Cells Blood Substit Immobil Biotechnol. 2011;39(6):351-356. doi:10.3109/10731199.2011.622280
15. Jiang HY, Zhang X, Yu ZH, et al. Altered gut microbiota profile in patients with generalized anxiety disorder. J Psychiatr Res. 2018;104:130-136. doi:10.1016/j.jpsychires.2018.07.007
16. van de Wouw M, Boehme M, Lyte JM, et al. Short‐chain fatty acids: microbial metabolites that alleviate stress‐induced brain–gut axis alterations. J Physiol. 2018;596(20):4923-4944 doi:10.1113/JP276431.
17. Morris G, Berk M, Carvalho A, et al. The role of the microbial metabolites including tryptophan catabolites and short chain fatty acids in the pathophysiology of immune-inflammatory and neuroimmune disease. Mol Neurobiol. 2017;54(6):4432-4451 doi:10.1007/s12035-016-0004-2.
18. Kelly JR, Kennedy PJ, Cryan JF, Dinan TG, Clarke G, Hyland NP. Breaking down the barriers: the gut microbiome, intestinal permeability and stress-related psychiatric disorders. Front Cell Neurosci. 2015;9:392. doi:10.3389/fncel.2015.00392
19. Duivis HE, Vogelzangs N, Kupper N, de Jonge P, Penninx BW. Differential association of somatic and cognitive symptoms of depression and anxiety with inflammation: findings from the Netherlands Study of Depression and Anxiety (NESDA). Psychoneuroendocrinology. 2013;38(9):1573-1585. doi:10.1016/j.psyneuen.2013.01.002
20. Miller AH, Raison CL. The role of inflammation in depression: from evolutionary imperative to modern treatment target. Nat Rev Immunol. 2016;16(1):22-34. doi:10.1038/nri.2015.5
21. Morilak DA, Frazer A. Antidepressants and brain monoaminergic systems: a dimensional approach to understanding their behavioural effects in depression and anxiety disorders. Int J Neuropsychopharmacol. 2004;7(2):193-218. doi:10.1017/S1461145704004080
22. Messaoudi M, Lalonde R, Violle N, et al. Assessment of psychotropic-like properties of a probiotic formulation (Lactobacillus helveticus R0052 and Bifidobacterium longum R0175) in rats and human subjects. Br J Nutr. 2011;105(5):755-764. doi:10.1017/S0007114510004319
23. Ishak WW, Mirocha J, James D. Quality of life in major depressive disorder before/after multiple steps of treatment and one-year follow-up. Acta Psychiatr Scand. 2014;131(1):51-60. doi:10.1111/acps.12301
24. El Aidy S, Dinan TG, Cryan JF. Immune modulation of the brain-gut-microbe axis. Front Microbiol. 2014;5:146. doi:10.3389/fmicb.2014.00146
25. Browning KN, Verheijden S, Boeckxstaens GE. The vagus nerve in appetite regulation, mood, and intestinal inflammation. Gastroenterology. 2017;152(4):730-744. doi:10.1053/j.gastro.2016.10.046
26. Berthoud HR, Neuhuber WL. Functional and chemical anatomy of the afferent vagal system. Auton Neurosci. 2000;85(1-3):1-7. doi:10.1016/S1566-0702(00)00215-0
27. Nahas Z, Marangell LB, Husain MM, et al. Two-year outcome of vagus nerve stimulation (VNS) for treatment of major depressive episodes. J Clin Psychiatry. 2005;66(9). doi:10.4088/jcp.v66n0902
28. Forsythe P, Bienenstock J, Kunze WA. Vagal pathways for microbiome-brain-gut axis communication. In: Microbial Endocrinology: The Microbiota-Gut-Brain Axis in Health and Disease. New York, NY: Springer; 2014:115-133.
29. Miller AH, Raison CL. The role of inflammation in depression: from evolutionary imperative to modern treatment target. Nat Rev Immunol. 2015;16(1):22-34. doi:10.1038/nri.2015.5
30. Mass M, Kubera M, Leunis JC. The gut-brain barrier in major depression: intestinal mucosal dysfunction with an increased translocation of LPS from gram negative enterobacteria (leaky gut) plays a role in the inflammatory pathophysiology of depression. Neuro Endocrinol Lett. 2008;29(1):117-124.
31. Goehler LE, Gaykema RP, Opitz N, Reddaway R, Badr N, Lyte M. Activation in vagal afferents and central autonomic pathways: early responses to intestinal infection with Campylobacter jejuni. Brain, Behav Immun. 2005;19(4):334-344. doi:10.1016/j.bbi.2004.09.002
32. Stevens BR, Goel R, Seungbum K, et al. Increased human intestinal barrier permeability plasma biomarkers zonulin and FABP2 correlated with plasma LPS and altered gut microbiome in anxiety or depression. Gut. 2018;67(8):1555-1557. doi:10.1136/gutjnl-2017-314759
33. Kelly JR, Borre Y, O’Brien C, et al. Transferring the blues: depression-associated gut microbiota induces neurobehavioural changes in the rat. J Psychiatr Res. 2016;82:109-118. doi:10.1016/j.jpsychires.2016.07.019
34. Jiang H, Ling Z, Zhang Y, et al. Altered fecal microbiota composition in patients with major depressive disorder. Brain Behav Immun. 2015;48:186-194. doi:10.1016/j.bbi.2015.03.016
35. Frémont M, Coomans D, Massart S, De Meirleir K. High-throughput 16S rRNA gene sequencing reveals alterations of intestinal microbiota in myalgic encephalomyelitis/chronic fatigue syndrome patients. Anaerobe. 2013;22:50-56. doi:10.1016/j.anaerobe.2013.06.002
36. Saulnier DM, Riehle K, Mistretta TA, et al. Gastrointestinal microbiome signatures of pediatric patients with irritable bowel syndrome. Gastroenterol. 2011;141(5):1782-1791. doi:10.1053/j.gastro.2011.06.072
37. Schmidt K, Cowen PJ, Harmer CJ, Tzortzis G, Errington S, Burnet PW. Prebiotic intake reduces the waking cortisol response and alters emotional bias in healthy volunteers. Psychopharmacology (Berl). 2015;232(10):1793-1801. doi:10.1007/s00213-014-3810-0
38. Liang S, Wang T, Hu X, et al. Administration of Lactobacillus helveticus NS8 improves behavioral, cognitive, and biochemical aberrations caused by chronic restraint stress. Neuroscience. 2015;310:561-577. doi:10.1016/j.neuroscience
39. Pinto-Sanchez MI, Hall GB, Ghajar K, et al. Probiotic Bifidobacterium longum NCC3001 reduces depression scores and alters brain activity: a pilot study in patients with irritable bowel syndrome. Gastroenterology. 2017;153(2):448-459. doi:10.1053/j.gastro.2017.05.003
40. Sequeira A, Klempan T, Canetti L, Benkelfat C, Rouleau GA, Turecki G. Patterns of gene expression in the limbic system of suicides with and without major depression. Mol Psychiatry. 2007;12(7):640-555. doi:10.1038/sj.mp.4001969
41. Slykerman RF, Hood F, Wickens K, et al. Effect of Lactobacillus rhamnosus HN001 in pregnancy on postpartum symptoms of depression and anxiety: a randomised double-blind placebo-controlled trial. EBioMedicine. 2017;24:159-165. doi:10.1016/j.ebiom.2017.09.013
42. Akkasheh G, Kashani-Poor Z, Tajabadi-Ebrahimi M, et al. Clinical and metabolic response to probiotic administration in patients with major depressive disorder: a randomized, double-blind, placebo-controlled trial. Nutrition. 2016;32(3):315-320. doi:10.1016/j.nut.2015.09.003
43. Huang R, Wang K, Hu J. Effect of probiotics on depression: a systematic review and meta-analysis of randomized controlled trials. Nutrients. 2016;8(8):483. doi:10.3390/nu8080483
44. Ng QX, Peters C, Ho CY, Lim DY, Yeo WS. A meta-analysis of the use of probiotics to alleviate depressive symptoms. J Affect Disord. 2018;228:13-19. doi:10.1016/j.jad.2017.11.063
45. Jacka FN, Pasco JA, Mykletun A, et al. Association of Western and traditional diets with depression and anxiety in women. Am J Psychiatry. 2010;167(3):305-311. doi:10.1176/appi.ajp.2009.09060881.
46. Jacka FN, Mykletun A, Berk M. Moving towards a population health approach to the primary prevention of common mental disorders. BMC Med. 2012;10:149. doi: 10.1186/1741-7015-10-149
47. De Filippo C, Cavalieri D, Di Paola Met, et al. Impact of diet in shaping gut microbiota revealed by a comparative study in children from Europe and rural Africa. Proc Natl Acad Sci U S A. 2010;107(33):14691-14696. doi:10.1073/pnas.1005963107
A Step Toward Health Equity for Veterans: Evidence Supports Removing Race From Kidney Function Calculations
The American Medical Association publicly acknowledged in November 2020 that race is a social construct without biological basis, with many other leading medical organizations following suit.1 Historically, biased science based on observed human physical differences has incorrectly asserted a racial biological hierarchy.2,3 Today, leading health care organizations recognize that the effects of racist policies in housing, education, employment, and the criminal justice system contribute to health disparities and have a disproportionately negative impact on Black, Indigenous, and People of Color.3,4
Racial classification systems are fraught with bias. Trying to classify a complex and nuanced identity such as race into discrete categories does not capture the extensive heterogeneity at the individual level or within the increasingly diverse, multiracial population.5 Racial and ethnic categories used in collecting census data and research, as defined by the US Office of Management and Budget, have evolved over time.6 These changes in classification are a reflection of changes in the political environment, not changes in scientific knowledge of race and ethnicity.6
The Use of Race in Research and Practice
In the United States, racial minorities bear a disproportionate burden of morbidity and mortality across all major disease categories.3 These disparities cannot be explained by genetics.4 The Human Genome Project in 2003 confirmed that racial categories have no biologic or genetic basis and that there is more intraracial than interracial genetic variation.3 Nevertheless, significant misapplication of race in medical research and clinical practice remains. Instead of attributing observed differences in health outcomes between racial groups to innate physiological differences between the groups, clinicians and researchers must carefully consider the impact of racism.7 This includes considering the complex interactions between socioeconomic, political, and environmental factors, and how they affect health.3
While race is not biologic, the effects of racism can have biologic effects, and advocates appropriately cite the need to collect race as an important category in epidemiological analysis. When race and ethnicity are used as a study variable, bioethicists Kaplan and Bennett recommend that researchers: (1) account for limitations due to imprecision of racial categories; (2) avoid attributing causality when there is an association between race/ethnicity and a health outcome; and (3) refrain from exacerbating racial disparities.6
At the bedside, race has become embedded in clinical, seemingly objective, decision-making tools used across medical specialties.8 These algorithms often use observational outcomes data and draw conclusions by explicitly or implicitly assuming biological differences among races. By crudely adjusting for race without identifying the root cause for observed racial differences, these tools can further magnify health inequities.8 With the increased recognition that race cannot be used as a proxy for genetic ancestry, and that racial and ethnic categories are complex sociopolitical constructs that have changed over time, the practice of race-based medicine is increasingly being criticized.8
This article presents a case for the removal of the race coefficient from estimated glomerular filtration rate (eGFR) calculations that exacerbate disparities in kidney health by overestimating kidney function in Black patients.8 The main justification for using the race coefficient stems from the disproven assumption that Black people have more muscle mass compared with non-Black people.9 The questioning of this racist assertion has led to a national movement to reevaluate the use of race in eGFR calculations.
Racial Disparities in Kidney Disease
According to epidemiological data published by the National Kidney Foundation (NKF) and American Society of Nephrology (ASN), 37 million people in the United States have chronic kidney disease (CKD).10 Black Americans make up 13% of the US population yet they account for more than 30% of patients with end-stage kidney disease (ESKD) and 35% of those on dialysis.10,11 There is a 3 times greater risk for progression from early-stage CKD to ESKD in Black Americans when compared to the risk for White Americans.11 Black patients are younger at the time of CKD diagnosis and, once diagnosed, experience a faster progression to ESKD.12 These disparities are partially attributable to delays in diagnosis, preventative measures, and referrals to nephrology care.12
In a VA medical center study, although Black patients were referred to nephrology care at higher rates than White patients, Black patients had faster progression to CKD stage 5.13 An earlier study showed that, at any given eGFR, Black patients have higher levels of albuminuria compared to White patients.14 While the reasons behind this observation are likely complex and multifactorial, one hypothesis is that Black patients were already at a more advanced stage of kidney disease at the time of referral as a result of the overestimation of eGFR calculations related to the use of a race coefficient.
Additionally, numerous analyses have revealed that Black patients are less likely to be identified as transplant candidates, less likely to be referred for transplant evaluation and, once on the waiting list, wait longer than do White patients.11,15
Estimated Glomerular Filtration Rate
It is imperative that clinicians have the most accurate measure of GFR to ensure timely diagnosis and appropriate management in patients with CKD. The gold standard for determining renal function requires measuring GFR using an ideal, exogenous, filtration marker such as iothalamate. However, this process is complex and time-consuming, rendering it infeasible in routine care. As a result, we usually estimate GFR using endogenous serum markers such as creatinine and cystatin C. Due to availability and cost, serum creatinine (SCr) is the most widely used marker for estimating kidney function. However, many pitfalls are inherent in its use, including the effects of tubular secretion, extrarenal clearance, and day-to-day variability in creatinine generation related to muscle mass, diet, and activity.16 The 2 most widely used estimation equations are the Modification of Diet in Renal Disease (MDRD) study equation and Chronic Kidney Disease Epidemiology Collaboration (CKD-EPI) creatinine equation; both equations incorporate correction factors for age, sex, and race.
The VA uses MDRD, which was derived and validated in a cohort of 1628 patients that included only 197 Black patients (12%), resulting in an eGFR for Black patients that is 21% higher than is the eGFR for non-Black patients with the same SCr value.9 In the VA electronic health record, the race coefficient is incorporated directly into eGFR laboratory calculations based on the race that the veteran self-identified during intake. Because the laboratory reports only a race-adjusted eGFR, there is a lack of transparency as many health care providers and patients are unaware that a race coefficient is used in eGFR calculations at the VA.
Case for Removing Race Coefficient
When applied to cohorts outside the original study, both the MDRD and CKD-EPI equations have proved to be highly biased, imprecise, and inaccurate when compared to measured GFR (mGFR).15,17 For any given eGFR, the possible mGFR may span 3 stages of CKD, underscoring the limitations of using such a crude estimate in clinical decision making.17
Current Kidney Estimation Pitfalls
A recent cohort study by Zelnick and colleagues that included 1658 self-identified Black adults showed less bias between mGFR and eGFR without the use of a race coefficient, and a shorter median time to transplant eligibility by 1.9 years.15 This study provides further evidence that these equations were derived from a biased observational data set that overestimates eGFR in Black patients living with CKD. This overestimation is particularly egregious for frail or malnourished patients with CKD and multiple comorbidities, with many potential harmful clinical consequences.
In addition, multiple international studies in African countries have demonstrated worse performance of eGFR calculations when using the race coefficient than without it. In the Democratic Republic of the Congo, eGFR was calculated for adults using MDRD with and without the race coefficient, as well as CKD-EPI with and without the race coefficient, and then compared to mGFR. Both the MDRD and the CKD-EPI equations overestimated GFR when using the race coefficient, and notably the equations without the race coefficient had better correlation to mGFR.18 Similar data were also found in studies from South Africa, the Ivory Coast, Brazil, and Europe.19-22
Clinical Consequences of Race Coefficient Use
The use of a race coefficient in these estimation equations causes adverse clinical outcomes. In early stages of CKD, overestimation of eGFR using the race coefficient can cause an under-recognition of CKD, and can lead to delays in diagnosis and failure to implement measures to slow its progression, such as minimizing drug-related nephrotoxic injury and iatrogenic acute kidney injury. Consequently, a patient with an overestimated eGFR may suffer an accelerated progression to ESKD and premature mortality from cardiovascular disease.23
In advanced CKD stages, eGFR overestimation may result in delayed referral to a nephrologist (recommended at eGFR < 30mL/min/1.73 m2), nutrition counseling, renal replacement therapy education, timely referral for renal replacement therapy access placement, and transplant evaluation (can be listed when eGFR < 20 mL/min/1.73 m2).16,24,25
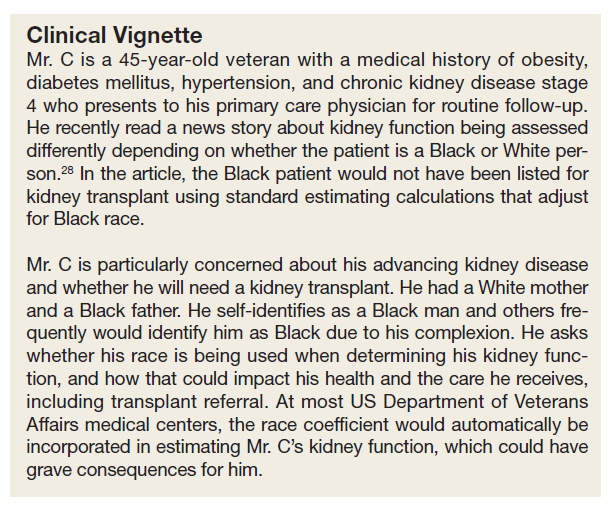
In the Clinical Vignette, it is clear from the information presented that Mr. C’s concerns are well-founded. Table 1 presents the impact on eGFR caused by the race coefficient using the MDRD and CKD-EPI equations. In many VA systems, this overestimation would prevent him from being referred for a kidney transplant at this visit, thereby perpetuating racial health disparities in kidney transplantation.
Concerns About Removal of Race From eGFR Calculations
Opponents of removing the race coefficient assert that a lower eGFR will preclude some patients from qualifying for medications such as metformin and certain anticoagulants, or that it may result in subtherapeutic dosing of drugs such as antibiotics and chemotherapeutic agents.26 These recommendations are in place for patient safety, so conversely maintaining the race coefficient and overestimating eGFR will expose some patients to medication toxicity. Another fear is that lower eGFRs will have the unintended consequence of limiting the kidney donor pool. However, this can be prevented by following current guidelines to use mGFR in settings where accurate GFR is imperative.16 Additionally, some nephrologists have expressed concern that diagnosing more patients with advanced stages of CKD will result in inappropriately early initiation of dialysis. Again, this risk can be mitigated by ensuring that nephrologists consider multiple clinical factors and data points, not simply eGFR when deciding to initiate dialysis. Also, an increase in referrals to nephrology may occur when the race coefficient is removed and increased wait times at some VA medical centers could be a concern. An increase in appropriate referrals would show that removing the race coefficient was having its intended effect—more veterans with advanced CKD being seen by nephrologists.
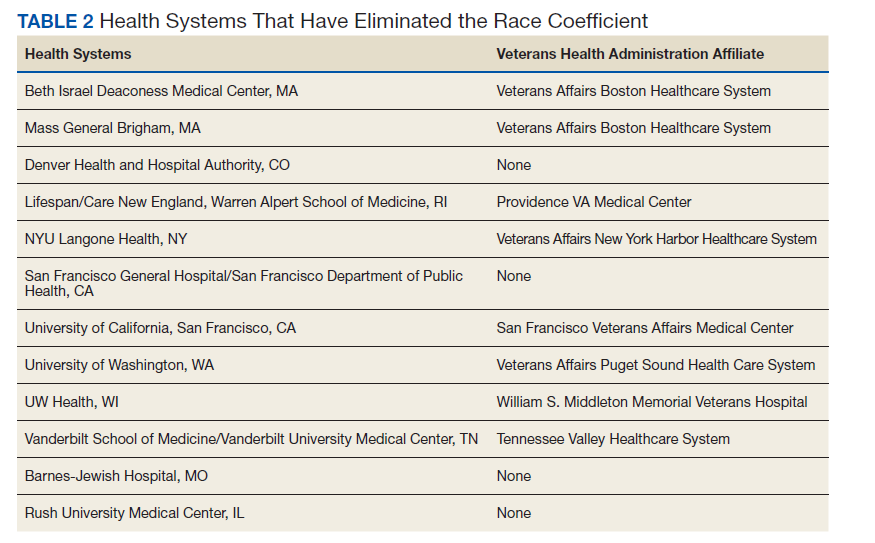
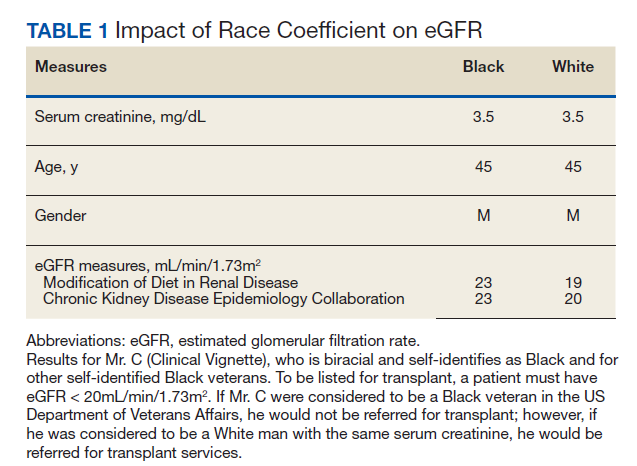
When considering the lack of biological plausibility, inaccuracy, and the clinical harms associated with the use of the race coefficient in eGFR calculations, the benefits of removing the race coefficient from eGFR calculations within the VA far outweigh any potential risks.
A Call for Equity
The National Conversation on Race and eGFR
To advance health equity, members of the medical community have advocated for the removal of the race coefficient from eGFR calculations for years. Beth Israel Deaconess Medical Center was the first establishment to institute this change in 2017. Since then, many health systems across the country that are affiliated with Veterans Health Administration (VHA) medical centers have removed the race coefficient from eGFR equations (Table 2). Many other hospital systems are contemplating this change.
In July 2020, the NKF and the ASN established a joint task force dedicated to reassessing the inclusion of race in eGFR calculations. This task force acknowledges that race is a social, not biological, construct.12 The NKF/ASN task force is now in the second of its 3-phase process. In March 2021, prior to publication of their phase 1 findings, they announced “(1) race modifiers should not be included in equations to estimate kidney function; and (2) current race-based equations should be replaced by a suitable approach that is accurate, inclusive, and standardized in every laboratory in the United States. Any such approach must not differentially introduce bias, inaccuracy, or inequalities.”27
Health Equity in the VHA
In January 2021, President Biden issued an executive order to advance racial equity and support underserved communities through the federal government and its agencies. The VHA is the largest integrated health care system in the United States serving 9 million veterans and is one of the largest federal agencies. As VA clinicians, it is our responsibility to examine the evidence, consider national guidance, and ensure health equity for veterans by practicing unbiased medicine. The evidence and the interim guidance from the NKF-ASN task force clearly indicate that the race coefficient should no longer be used.27 It is imperative that we make these changes immediately knowing that the use of race in kidney function calculators is harming Black veterans. Similar to finding evidence of harm in a treatment group in a clinical trial, it is unethical to wait. Removal of the race coefficient in eGFR calculations will allow VHA clinicians to provide timely and high-quality care to our patients as well as establish the VHA as a national leader in health equity.
VISN 12 Leads the Way
On May 11, 2021, the VA Great Lakes Health Care System, Veterans Integrated Service Network (VISN) 12, leaders responded to this author group’s call to advance health equity and voted to remove the race coefficient from eGFR calculations. Other VISNs should follow, and the VHA should continue to work with national leaders and experts to establish and implement superior tools to ensure the highest quality of kidney health care for all veterans.
Acknowledgments
The authors would like to thank the medical students across the nation who have been leading the charge on this important issue. The authors are also thankful for the collaboration and support of all members of the Jesse Brown for Black Lives (JB4BL) Task Force.
1. American Medical Association. New AMA policies recognize race as a social, not biological, construct. Published November 16, 2020. Accessed July 16, 2021. www.ama|-assn.org/press-center/press-releases/new-ama-policies-recognize-race-social-not-biological-construct
2. Bennett L. The Shaping of Black America. Johnson Publishing Co; 1975.
3. David R, Collins J Jr. Disparities in infant mortality: what’s genetics got to do with it? Am J Public Health. 2007;97(7):1191-1197. doi:10.2105/AJPH.2005.068387
4. Centers for Disease Control and Prevention. Media statement from CDC director Rochelle P. Walensky, MD, MPH, on racism and health. Published April 8, 2021. Accessed July 16, 2021. https://www.cdc.gov/media/releases/2021/s0408-racism-health.html
5. Bonham VL, Green ED, Pérez-Stable EJ. Examining how race, ethnicity, and ancestry data are used in biomedical research. JAMA. 2018;320(15):1533-1534. doi:10.1001/jama.2018.13609
6. Kaplan JB, Bennett T. Use of race and ethnicity in biomedical publication. JAMA. 2003;289(20):2709-2716. doi:10.1001/jama.289.20.2709
7. Braun L, Wentz A, Baker R, Richardson E, Tsai J. Racialized algorithms for kidney function: Erasing social experience. Soc Sci Med. 2021;268:113548. doi:10.1016/j.socscimed.2020.113548
8. Vyas DA, Eisenstein LG, Jones DS. Hidden in plain sight - reconsidering the use of race correction in clinical algorithms. N Engl J Med. 2020;383(9):874-882. doi:10.1056/NEJMms2004740
9. Levey AS, Bosch JP, Lewis JB, Greene T, Rogers N, Roth D. A more accurate method to estimate glomerular filtration rate from serum creatinine: a new prediction equation. Modification of Diet in Renal Disease Study Group. Ann Intern Med. 1999;130(6):461-470. doi:10.7326/0003-4819-130-6-199903160-00002
10. National Kidney Foundation and American Society of Nephrology. Establishing a task force to reassess the inclusion of race in diagnosing kidney diseases. Published July 2, 2020. Accessed May 10, 2021. https://www.kidney.org/news/establishing-task-force-to-reassess-inclusion-race-diagnosing-kidney-diseases
11. Norton JM, Moxey-Mims MM, Eggers PW, et al. Social determinants of racial disparities in CKD. J Am Soc Nephrol. 2016;27(9):2576-2595. doi:10.1681/ASN.201601002712. Delgado C, Baweja M, Burrows NR, et al. Reassessing the Inclusion of Race in Diagnosing Kidney Diseases: An Interim Report from the NKF-ASN Task Force. J Am Soc Nephrol. 2021;32(6):1305-1317. doi:10.1681/ASN.2021010039
13. Suarez J, Cohen JB, Potluri V, et al. Racial disparities in nephrology consultation and disease progression among veterans with CKD: an observational cohort study. J Am Soc Nephrol. 2018;29(10):2563-2573. doi:10.1681/ASN.2018040344
14. McClellan WM, Warnock DG, Judd S, et al. Albuminuria and racial disparities in the risk for ESRD. J Am Soc Nephrol. 2011;22(9):1721-1728. doi:10.1681/ASN.2010101085
15. Zelnick LR, Leca N, Young B, Bansal N. Association of the estimated glomerular filtration rate with vs without a coefficient for race with time to eligibility for kidney transplant. JAMA Netw Open. 2021;4(1):e2034004. Published 2021 Jan 4. doi:10.1001/jamanetworkopen.2020.34004
16. Kidney Disease Improving Global Outcomes. KDIGO 2012 clinical practice guideline for the evaluation and management of chronic kidney disease. Published January 2013. Accessed July 16, 2021. https://kdigo.org/wp-content/uploads/2017/02/KDIGO_2012_CKD_GL.pdf
17. Sehgal AR. Race and the false precision of glomerular filtration rate estimates. Ann Intern Med. 2020;173(12):1008-1009. doi:10.7326/M20-4951
18. Bukabau JB, Sumaili EK, Cavalier E, et al. Performance of glomerular filtration rate estimation equations in Congolese healthy adults: the inopportunity of the ethnic correction. PLoS One. 2018;13(3):e0193384. Published 2018 Mar 2. doi:10.1371/journal.pone.0193384
19. van Deventer HE, George JA, Paiker JE, Becker PJ, Katz IJ. Estimating glomerular filtration rate in black South Africans by use of the modification of diet in renal disease and Cockcroft-Gault equations. Clin Chem. 2008;54(7):1197-1202. doi:10.1373/clinchem.2007.099085
20. Sagou Yayo É, Aye M, Konan JL, et al. Inadéquation du facteur ethnique pour l’estimation du débit de filtration glomérulaire en population générale noire-africaine : résultats en Côte d’Ivoire [Inadequacy of the African-American ethnic factor to estimate glomerular filtration rate in an African general population: results from Côte d›Ivoire]. Nephrol Ther. 2016;12(6):454-459. doi:10.1016/j.nephro.2016.03.006
21. Zanocco JA, Nishida SK, Passos MT, et al. Race adjustment for estimating glomerular filtration rate is not always necessary. Nephron Extra. 2012;2(1):293-302. doi:10.1159/000343899
22. Flamant M, Vidal-Petiot E, Metzger M, et al. Performance of GFR estimating equations in African Europeans: basis for a lower race-ethnicity factor than in African Americans. Am J Kidney Dis. 2013;62(1):182-184. doi:10.1053/j.ajkd.2013.03.015
23. Shlipak MG, Tummalapalli SL, Boulware LE, et al. The case for early identification and intervention of chronic kidney disease: conclusions from a Kidney Disease: Improving Global Outcomes (KDIGO) Controversies Conference. Kidney Int. 2021;99(1):34-47. doi:10.1016/j.kint.2020.10.012
24. Eneanya ND, Yang W, Reese PP. Reconsidering the consequences of using race to estimate kidney function. JAMA. 2019;322(2):113-114. doi:10.1001/jama.2019.5774
25. Diao JA, Wu GJ, Taylor HA, et al. Clinical implications of removing race from estimates of kidney function. JAMA. 2021;325(2):184-186. doi:10.1001/jama.2020.22124
26. Diao JA, Inker LA, Levey AS, Tighiouart H, Powe NR, Manrai AK. In search of a better equation - performance and equity in estimates of kidney function. N Engl J Med. 2021;384(5):396-399. doi:10.1056/NEJMp2028243
27. National Kidney Foundation and American Society of Nephrology. [Letter]. Published March 05, 2021. Accessed July 16, 2021. https://www.asn-online.org/g/blast/files/NKF-ASN-eGFR-March2021.pdf
28. Waddell K. Medical algorithms have a race problem. Consumer Reports. September 18, 2020. Accessed July 16, 2021. https://www.consumerreports.org/medical-tests/medical-algorithms-have-a-race-problem
The American Medical Association publicly acknowledged in November 2020 that race is a social construct without biological basis, with many other leading medical organizations following suit.1 Historically, biased science based on observed human physical differences has incorrectly asserted a racial biological hierarchy.2,3 Today, leading health care organizations recognize that the effects of racist policies in housing, education, employment, and the criminal justice system contribute to health disparities and have a disproportionately negative impact on Black, Indigenous, and People of Color.3,4
Racial classification systems are fraught with bias. Trying to classify a complex and nuanced identity such as race into discrete categories does not capture the extensive heterogeneity at the individual level or within the increasingly diverse, multiracial population.5 Racial and ethnic categories used in collecting census data and research, as defined by the US Office of Management and Budget, have evolved over time.6 These changes in classification are a reflection of changes in the political environment, not changes in scientific knowledge of race and ethnicity.6
The Use of Race in Research and Practice
In the United States, racial minorities bear a disproportionate burden of morbidity and mortality across all major disease categories.3 These disparities cannot be explained by genetics.4 The Human Genome Project in 2003 confirmed that racial categories have no biologic or genetic basis and that there is more intraracial than interracial genetic variation.3 Nevertheless, significant misapplication of race in medical research and clinical practice remains. Instead of attributing observed differences in health outcomes between racial groups to innate physiological differences between the groups, clinicians and researchers must carefully consider the impact of racism.7 This includes considering the complex interactions between socioeconomic, political, and environmental factors, and how they affect health.3
While race is not biologic, the effects of racism can have biologic effects, and advocates appropriately cite the need to collect race as an important category in epidemiological analysis. When race and ethnicity are used as a study variable, bioethicists Kaplan and Bennett recommend that researchers: (1) account for limitations due to imprecision of racial categories; (2) avoid attributing causality when there is an association between race/ethnicity and a health outcome; and (3) refrain from exacerbating racial disparities.6
At the bedside, race has become embedded in clinical, seemingly objective, decision-making tools used across medical specialties.8 These algorithms often use observational outcomes data and draw conclusions by explicitly or implicitly assuming biological differences among races. By crudely adjusting for race without identifying the root cause for observed racial differences, these tools can further magnify health inequities.8 With the increased recognition that race cannot be used as a proxy for genetic ancestry, and that racial and ethnic categories are complex sociopolitical constructs that have changed over time, the practice of race-based medicine is increasingly being criticized.8
This article presents a case for the removal of the race coefficient from estimated glomerular filtration rate (eGFR) calculations that exacerbate disparities in kidney health by overestimating kidney function in Black patients.8 The main justification for using the race coefficient stems from the disproven assumption that Black people have more muscle mass compared with non-Black people.9 The questioning of this racist assertion has led to a national movement to reevaluate the use of race in eGFR calculations.
Racial Disparities in Kidney Disease
According to epidemiological data published by the National Kidney Foundation (NKF) and American Society of Nephrology (ASN), 37 million people in the United States have chronic kidney disease (CKD).10 Black Americans make up 13% of the US population yet they account for more than 30% of patients with end-stage kidney disease (ESKD) and 35% of those on dialysis.10,11 There is a 3 times greater risk for progression from early-stage CKD to ESKD in Black Americans when compared to the risk for White Americans.11 Black patients are younger at the time of CKD diagnosis and, once diagnosed, experience a faster progression to ESKD.12 These disparities are partially attributable to delays in diagnosis, preventative measures, and referrals to nephrology care.12
In a VA medical center study, although Black patients were referred to nephrology care at higher rates than White patients, Black patients had faster progression to CKD stage 5.13 An earlier study showed that, at any given eGFR, Black patients have higher levels of albuminuria compared to White patients.14 While the reasons behind this observation are likely complex and multifactorial, one hypothesis is that Black patients were already at a more advanced stage of kidney disease at the time of referral as a result of the overestimation of eGFR calculations related to the use of a race coefficient.
Additionally, numerous analyses have revealed that Black patients are less likely to be identified as transplant candidates, less likely to be referred for transplant evaluation and, once on the waiting list, wait longer than do White patients.11,15
Estimated Glomerular Filtration Rate
It is imperative that clinicians have the most accurate measure of GFR to ensure timely diagnosis and appropriate management in patients with CKD. The gold standard for determining renal function requires measuring GFR using an ideal, exogenous, filtration marker such as iothalamate. However, this process is complex and time-consuming, rendering it infeasible in routine care. As a result, we usually estimate GFR using endogenous serum markers such as creatinine and cystatin C. Due to availability and cost, serum creatinine (SCr) is the most widely used marker for estimating kidney function. However, many pitfalls are inherent in its use, including the effects of tubular secretion, extrarenal clearance, and day-to-day variability in creatinine generation related to muscle mass, diet, and activity.16 The 2 most widely used estimation equations are the Modification of Diet in Renal Disease (MDRD) study equation and Chronic Kidney Disease Epidemiology Collaboration (CKD-EPI) creatinine equation; both equations incorporate correction factors for age, sex, and race.
The VA uses MDRD, which was derived and validated in a cohort of 1628 patients that included only 197 Black patients (12%), resulting in an eGFR for Black patients that is 21% higher than is the eGFR for non-Black patients with the same SCr value.9 In the VA electronic health record, the race coefficient is incorporated directly into eGFR laboratory calculations based on the race that the veteran self-identified during intake. Because the laboratory reports only a race-adjusted eGFR, there is a lack of transparency as many health care providers and patients are unaware that a race coefficient is used in eGFR calculations at the VA.
Case for Removing Race Coefficient
When applied to cohorts outside the original study, both the MDRD and CKD-EPI equations have proved to be highly biased, imprecise, and inaccurate when compared to measured GFR (mGFR).15,17 For any given eGFR, the possible mGFR may span 3 stages of CKD, underscoring the limitations of using such a crude estimate in clinical decision making.17
Current Kidney Estimation Pitfalls
A recent cohort study by Zelnick and colleagues that included 1658 self-identified Black adults showed less bias between mGFR and eGFR without the use of a race coefficient, and a shorter median time to transplant eligibility by 1.9 years.15 This study provides further evidence that these equations were derived from a biased observational data set that overestimates eGFR in Black patients living with CKD. This overestimation is particularly egregious for frail or malnourished patients with CKD and multiple comorbidities, with many potential harmful clinical consequences.
In addition, multiple international studies in African countries have demonstrated worse performance of eGFR calculations when using the race coefficient than without it. In the Democratic Republic of the Congo, eGFR was calculated for adults using MDRD with and without the race coefficient, as well as CKD-EPI with and without the race coefficient, and then compared to mGFR. Both the MDRD and the CKD-EPI equations overestimated GFR when using the race coefficient, and notably the equations without the race coefficient had better correlation to mGFR.18 Similar data were also found in studies from South Africa, the Ivory Coast, Brazil, and Europe.19-22
Clinical Consequences of Race Coefficient Use
The use of a race coefficient in these estimation equations causes adverse clinical outcomes. In early stages of CKD, overestimation of eGFR using the race coefficient can cause an under-recognition of CKD, and can lead to delays in diagnosis and failure to implement measures to slow its progression, such as minimizing drug-related nephrotoxic injury and iatrogenic acute kidney injury. Consequently, a patient with an overestimated eGFR may suffer an accelerated progression to ESKD and premature mortality from cardiovascular disease.23
In advanced CKD stages, eGFR overestimation may result in delayed referral to a nephrologist (recommended at eGFR < 30mL/min/1.73 m2), nutrition counseling, renal replacement therapy education, timely referral for renal replacement therapy access placement, and transplant evaluation (can be listed when eGFR < 20 mL/min/1.73 m2).16,24,25
In the Clinical Vignette, it is clear from the information presented that Mr. C’s concerns are well-founded. Table 1 presents the impact on eGFR caused by the race coefficient using the MDRD and CKD-EPI equations. In many VA systems, this overestimation would prevent him from being referred for a kidney transplant at this visit, thereby perpetuating racial health disparities in kidney transplantation.
Concerns About Removal of Race From eGFR Calculations
Opponents of removing the race coefficient assert that a lower eGFR will preclude some patients from qualifying for medications such as metformin and certain anticoagulants, or that it may result in subtherapeutic dosing of drugs such as antibiotics and chemotherapeutic agents.26 These recommendations are in place for patient safety, so conversely maintaining the race coefficient and overestimating eGFR will expose some patients to medication toxicity. Another fear is that lower eGFRs will have the unintended consequence of limiting the kidney donor pool. However, this can be prevented by following current guidelines to use mGFR in settings where accurate GFR is imperative.16 Additionally, some nephrologists have expressed concern that diagnosing more patients with advanced stages of CKD will result in inappropriately early initiation of dialysis. Again, this risk can be mitigated by ensuring that nephrologists consider multiple clinical factors and data points, not simply eGFR when deciding to initiate dialysis. Also, an increase in referrals to nephrology may occur when the race coefficient is removed and increased wait times at some VA medical centers could be a concern. An increase in appropriate referrals would show that removing the race coefficient was having its intended effect—more veterans with advanced CKD being seen by nephrologists.
When considering the lack of biological plausibility, inaccuracy, and the clinical harms associated with the use of the race coefficient in eGFR calculations, the benefits of removing the race coefficient from eGFR calculations within the VA far outweigh any potential risks.
A Call for Equity
The National Conversation on Race and eGFR
To advance health equity, members of the medical community have advocated for the removal of the race coefficient from eGFR calculations for years. Beth Israel Deaconess Medical Center was the first establishment to institute this change in 2017. Since then, many health systems across the country that are affiliated with Veterans Health Administration (VHA) medical centers have removed the race coefficient from eGFR equations (Table 2). Many other hospital systems are contemplating this change.
In July 2020, the NKF and the ASN established a joint task force dedicated to reassessing the inclusion of race in eGFR calculations. This task force acknowledges that race is a social, not biological, construct.12 The NKF/ASN task force is now in the second of its 3-phase process. In March 2021, prior to publication of their phase 1 findings, they announced “(1) race modifiers should not be included in equations to estimate kidney function; and (2) current race-based equations should be replaced by a suitable approach that is accurate, inclusive, and standardized in every laboratory in the United States. Any such approach must not differentially introduce bias, inaccuracy, or inequalities.”27
Health Equity in the VHA
In January 2021, President Biden issued an executive order to advance racial equity and support underserved communities through the federal government and its agencies. The VHA is the largest integrated health care system in the United States serving 9 million veterans and is one of the largest federal agencies. As VA clinicians, it is our responsibility to examine the evidence, consider national guidance, and ensure health equity for veterans by practicing unbiased medicine. The evidence and the interim guidance from the NKF-ASN task force clearly indicate that the race coefficient should no longer be used.27 It is imperative that we make these changes immediately knowing that the use of race in kidney function calculators is harming Black veterans. Similar to finding evidence of harm in a treatment group in a clinical trial, it is unethical to wait. Removal of the race coefficient in eGFR calculations will allow VHA clinicians to provide timely and high-quality care to our patients as well as establish the VHA as a national leader in health equity.
VISN 12 Leads the Way
On May 11, 2021, the VA Great Lakes Health Care System, Veterans Integrated Service Network (VISN) 12, leaders responded to this author group’s call to advance health equity and voted to remove the race coefficient from eGFR calculations. Other VISNs should follow, and the VHA should continue to work with national leaders and experts to establish and implement superior tools to ensure the highest quality of kidney health care for all veterans.
Acknowledgments
The authors would like to thank the medical students across the nation who have been leading the charge on this important issue. The authors are also thankful for the collaboration and support of all members of the Jesse Brown for Black Lives (JB4BL) Task Force.
1. American Medical Association. New AMA policies recognize race as a social, not biological, construct. Published November 16, 2020. Accessed July 16, 2021. www.ama|-assn.org/press-center/press-releases/new-ama-policies-recognize-race-social-not-biological-construct
2. Bennett L. The Shaping of Black America. Johnson Publishing Co; 1975.
3. David R, Collins J Jr. Disparities in infant mortality: what’s genetics got to do with it? Am J Public Health. 2007;97(7):1191-1197. doi:10.2105/AJPH.2005.068387
4. Centers for Disease Control and Prevention. Media statement from CDC director Rochelle P. Walensky, MD, MPH, on racism and health. Published April 8, 2021. Accessed July 16, 2021. https://www.cdc.gov/media/releases/2021/s0408-racism-health.html
5. Bonham VL, Green ED, Pérez-Stable EJ. Examining how race, ethnicity, and ancestry data are used in biomedical research. JAMA. 2018;320(15):1533-1534. doi:10.1001/jama.2018.13609
6. Kaplan JB, Bennett T. Use of race and ethnicity in biomedical publication. JAMA. 2003;289(20):2709-2716. doi:10.1001/jama.289.20.2709
7. Braun L, Wentz A, Baker R, Richardson E, Tsai J. Racialized algorithms for kidney function: Erasing social experience. Soc Sci Med. 2021;268:113548. doi:10.1016/j.socscimed.2020.113548
8. Vyas DA, Eisenstein LG, Jones DS. Hidden in plain sight - reconsidering the use of race correction in clinical algorithms. N Engl J Med. 2020;383(9):874-882. doi:10.1056/NEJMms2004740
9. Levey AS, Bosch JP, Lewis JB, Greene T, Rogers N, Roth D. A more accurate method to estimate glomerular filtration rate from serum creatinine: a new prediction equation. Modification of Diet in Renal Disease Study Group. Ann Intern Med. 1999;130(6):461-470. doi:10.7326/0003-4819-130-6-199903160-00002
10. National Kidney Foundation and American Society of Nephrology. Establishing a task force to reassess the inclusion of race in diagnosing kidney diseases. Published July 2, 2020. Accessed May 10, 2021. https://www.kidney.org/news/establishing-task-force-to-reassess-inclusion-race-diagnosing-kidney-diseases
11. Norton JM, Moxey-Mims MM, Eggers PW, et al. Social determinants of racial disparities in CKD. J Am Soc Nephrol. 2016;27(9):2576-2595. doi:10.1681/ASN.201601002712. Delgado C, Baweja M, Burrows NR, et al. Reassessing the Inclusion of Race in Diagnosing Kidney Diseases: An Interim Report from the NKF-ASN Task Force. J Am Soc Nephrol. 2021;32(6):1305-1317. doi:10.1681/ASN.2021010039
13. Suarez J, Cohen JB, Potluri V, et al. Racial disparities in nephrology consultation and disease progression among veterans with CKD: an observational cohort study. J Am Soc Nephrol. 2018;29(10):2563-2573. doi:10.1681/ASN.2018040344
14. McClellan WM, Warnock DG, Judd S, et al. Albuminuria and racial disparities in the risk for ESRD. J Am Soc Nephrol. 2011;22(9):1721-1728. doi:10.1681/ASN.2010101085
15. Zelnick LR, Leca N, Young B, Bansal N. Association of the estimated glomerular filtration rate with vs without a coefficient for race with time to eligibility for kidney transplant. JAMA Netw Open. 2021;4(1):e2034004. Published 2021 Jan 4. doi:10.1001/jamanetworkopen.2020.34004
16. Kidney Disease Improving Global Outcomes. KDIGO 2012 clinical practice guideline for the evaluation and management of chronic kidney disease. Published January 2013. Accessed July 16, 2021. https://kdigo.org/wp-content/uploads/2017/02/KDIGO_2012_CKD_GL.pdf
17. Sehgal AR. Race and the false precision of glomerular filtration rate estimates. Ann Intern Med. 2020;173(12):1008-1009. doi:10.7326/M20-4951
18. Bukabau JB, Sumaili EK, Cavalier E, et al. Performance of glomerular filtration rate estimation equations in Congolese healthy adults: the inopportunity of the ethnic correction. PLoS One. 2018;13(3):e0193384. Published 2018 Mar 2. doi:10.1371/journal.pone.0193384
19. van Deventer HE, George JA, Paiker JE, Becker PJ, Katz IJ. Estimating glomerular filtration rate in black South Africans by use of the modification of diet in renal disease and Cockcroft-Gault equations. Clin Chem. 2008;54(7):1197-1202. doi:10.1373/clinchem.2007.099085
20. Sagou Yayo É, Aye M, Konan JL, et al. Inadéquation du facteur ethnique pour l’estimation du débit de filtration glomérulaire en population générale noire-africaine : résultats en Côte d’Ivoire [Inadequacy of the African-American ethnic factor to estimate glomerular filtration rate in an African general population: results from Côte d›Ivoire]. Nephrol Ther. 2016;12(6):454-459. doi:10.1016/j.nephro.2016.03.006
21. Zanocco JA, Nishida SK, Passos MT, et al. Race adjustment for estimating glomerular filtration rate is not always necessary. Nephron Extra. 2012;2(1):293-302. doi:10.1159/000343899
22. Flamant M, Vidal-Petiot E, Metzger M, et al. Performance of GFR estimating equations in African Europeans: basis for a lower race-ethnicity factor than in African Americans. Am J Kidney Dis. 2013;62(1):182-184. doi:10.1053/j.ajkd.2013.03.015
23. Shlipak MG, Tummalapalli SL, Boulware LE, et al. The case for early identification and intervention of chronic kidney disease: conclusions from a Kidney Disease: Improving Global Outcomes (KDIGO) Controversies Conference. Kidney Int. 2021;99(1):34-47. doi:10.1016/j.kint.2020.10.012
24. Eneanya ND, Yang W, Reese PP. Reconsidering the consequences of using race to estimate kidney function. JAMA. 2019;322(2):113-114. doi:10.1001/jama.2019.5774
25. Diao JA, Wu GJ, Taylor HA, et al. Clinical implications of removing race from estimates of kidney function. JAMA. 2021;325(2):184-186. doi:10.1001/jama.2020.22124
26. Diao JA, Inker LA, Levey AS, Tighiouart H, Powe NR, Manrai AK. In search of a better equation - performance and equity in estimates of kidney function. N Engl J Med. 2021;384(5):396-399. doi:10.1056/NEJMp2028243
27. National Kidney Foundation and American Society of Nephrology. [Letter]. Published March 05, 2021. Accessed July 16, 2021. https://www.asn-online.org/g/blast/files/NKF-ASN-eGFR-March2021.pdf
28. Waddell K. Medical algorithms have a race problem. Consumer Reports. September 18, 2020. Accessed July 16, 2021. https://www.consumerreports.org/medical-tests/medical-algorithms-have-a-race-problem
Feasibility of Risk Stratification of Patients Presenting to the Emergency Department With Chest Pain Using HEART Score
From the Department of Internal Medicine, Mount Sinai Health System, Icahn School of Medicine at Mount Sinai, New York, NY (Dr. Gandhi), and the School of Medicine, Seth Gordhandas Sunderdas Medical College, and King Edward Memorial Hospital, Mumbai, India (Drs. Gandhi and Tiwari).
Objective: Calculation of HEART score to (1) stratify patients as low-risk, intermediate-risk, high-risk, and to predict the short-term incidence of major adverse cardiovascular events (MACE), and (2) demonstrate feasibility of HEART score in our local settings.
Design: A prospective cohort study of patients with a chief complaint of chest pain concerning for acute coronary syndrome.
Setting: Participants were recruited from the emergency department (ED) of King Edward Memorial Hospital, a tertiary care academic medical center and a resource-limited setting in Mumbai, India.
Participants: We evaluated 141 patients aged 18 years and older presenting to the ED and stratified them using the HEART score. To assess patients’ progress, a follow-up phone call was made within 6 weeks after presentation to the ED.
Measurements: The primary outcomes were a risk stratification, 6-week occurrence of MACE, and performance of unscheduled revascularization or stress testing. The secondary outcomes were discharge or death.
Results: The 141 participants were stratified into low-risk, intermediate-risk, and high-risk groups: 67 (47.52%), 44 (31.21%), and 30 (21.28%), respectively. The 6-week incidence of MACE in each category was 1.49%, 18.18%, and 90%, respectively. An acute myocardial infarction was diagnosed in 24 patients (17.02%), 15 patients (10.64%) underwent percutaneous coronary intervention (PCI), and 4 patients (2.84%) underwent coronary artery bypass graft (CABG). Overall, 98.5% of low-risk patients and 93.33% of high-risk patients had an uneventful recovery following discharge; therefore, extrapolation based on results demonstrated reduced health care utilization. All the survey respondents found the HEART score to be feasible. The patient characteristics and risk profile of the patients with and without MACE demonstrated that: patients with MACE were older and had a higher proportion of males, hypertension, type 2 diabetes mellitus, smoking, hypercholesterolemia, prior history of PCI/CABG, and history of stroke.
Conclusion: The HEART score seems to be a useful tool for risk stratification and a reliable predictor of outcomes in chest pain patients and can therefore be used for triage.
Keywords: chest pain; emergency department; HEART score; acute coronary syndrome; major adverse cardiac events; myocardial infarction; revascularization.
Cardiovascular diseases (CVDs), especially coronary heart disease (CHD), have epidemic proportions worldwide. Globally, in 2012, CVD led to 17.5 million deaths,1,2 with more than 75% of them occurring in developing countries. In contrast to developed countries, where mortality from CHD is rapidly declining, it is increasing in developing countries.1,3 Current estimates from epidemiologic studies from various parts of India indicate the prevalence of CHD in India to be between 7% and 13% in urban populations and 2% and 7% in rural populations.4
Premature mortality in terms of years of life lost because of CVD in India increased by 59% over a 20-year span, from 23.2 million in 1990 to 37 million in 2010.5 Studies conducted in Mumbai (Mumbai Cohort Study) reported very high CVD mortality rates, approaching 500 per 100 000 for men and 250 per 100 000 for women.6,7 However, to the best of our knowledge, in the Indian population, there are minimal data on utilization of a triage score, such as the HEART score, in chest pain patients in the emergency department (ED) in a resource-limited setting.
The most common reason for admitting patients to the ED is chest pain.8 There are various cardiac and noncardiac etiologies of chest pain presentation. Acute coronary syndrome (ACS) needs to be ruled out first in every patient presenting with chest pain. However, 80% of patients with ACS have no clear diagnostic features on presentation.9 The timely diagnosis and treatment of patients with ACS improves their prognosis. Therefore, clinicians tend to start each patient on ACS treatment to reduce the risk, which often leads to increased costs due to unnecessary, time-consuming diagnostic procedures that may place burdens on both the health care system and the patient.10
Several risk-stratifying tools have been developed in the last few years. Both the GRACE and TIMI risk scores have been designed for risk stratification of patients with proven ACS and not for the chest pain population at the ED.11 Some of these tools are applicable to patients with all types of chest pain presenting to the ED, such as the Manchester Triage System. Other, more selective systems are devoted to the risk stratification of suspected ACS in the ED. One is the HEART score.12
The first study on the HEART score—an acronym that stands for History, Electrocardiogram, Age, Risk factors, and Troponin—was done by Backus et al, who proved that the HEART score is an easy, quick, and reliable predictor of outcomes in chest pain patients.10 The HEART score predicts the short-term incidence of major adverse cardiac events (MACE), which allows clinicians to stratify patients as low-risk, intermediate-risk, and high-risk and to guide their clinical decision-making accordingly. It was developed to provide clinicians with a simple, reliable predictor of cardiac risk on the basis of the lowest score of 0 (very low-risk) up to a score of 10 (very high-risk).
We studied the clinical performance of the HEART score in patients with chest pain, focusing on the efficacy and safety of rapidly identifying patients at risk of MACE. We aimed to determine (1) whether the HEART score is a reliable predictor of outcomes of chest pain patients presenting to the ED; (2) whether the score is feasible in our local settings; and (3) whether it describes the risk profile of patients with and without MACE.
Methods
Setting
Participants were recruited from the ED of King Edward Memorial Hospital, a municipal teaching hospital in Mumbai. The study institute is a tertiary care academic medical center located in Parel, Mumbai, Maharashtra, and is a resource-limited setting serving urban, suburban, and rural populations. Participants requiring urgent attention are first seen by a casualty officer and then referred to the emergency ward. Here, the physician on duty evaluates them and decides on admission to the various wards, like the general ward, medical intensive care unit (ICU), coronary care unit (CCU), etc. The specialist’s opinion may also be obtained before admission. Critically ill patients are initially admitted to the emergency ward and stabilized before being shifted to other areas of the hospital.
Participants
Patients aged 18 years and older presenting with symptoms of acute chest pain or suspected ACS were stratified by priority using the chest pain scoring system—the HEART score. Only patients presenting to the ED were eligible for the study. Informed consent from the patient or next of kin was mandatory for participation in the study.
Patients were determined ineligible for the following reasons: a clear cause for chest pain other than ACS (eg, trauma, diagnosed aortic dissection), persisting or recurrent chest pain caused by rheumatic diseases or cancer (a terminal illness), pregnancy, unable or unwilling to provide informed consent, or incomplete data.
Study design
We conducted a
We conducted our study to determine the importance of calculating the HEART score in each patient, which will help to correctly place them into low-, intermediate-, and high-risk groups for clinically important, irreversible adverse cardiac events and guide the clinical decision-making. Patients with low risk will avoid costly tests and hospital admissions, thus decreasing the cost of treatment and ensuring timely discharge from the ED. Patients with high risk will be treated immediately, to possibly prevent a life-threatening, ACS-related incident. Thus, the HEART score will serve as a quick and reliable predictor of outcomes in chest pain patients and help clinicians to make accurate diagnostic and therapeutic choices in uncertain situations.
HEART score
The total number of points for History, Electrocardiogram (ECG), Age, Risk factors, and Troponin was noted as the HEART score (Table 1).
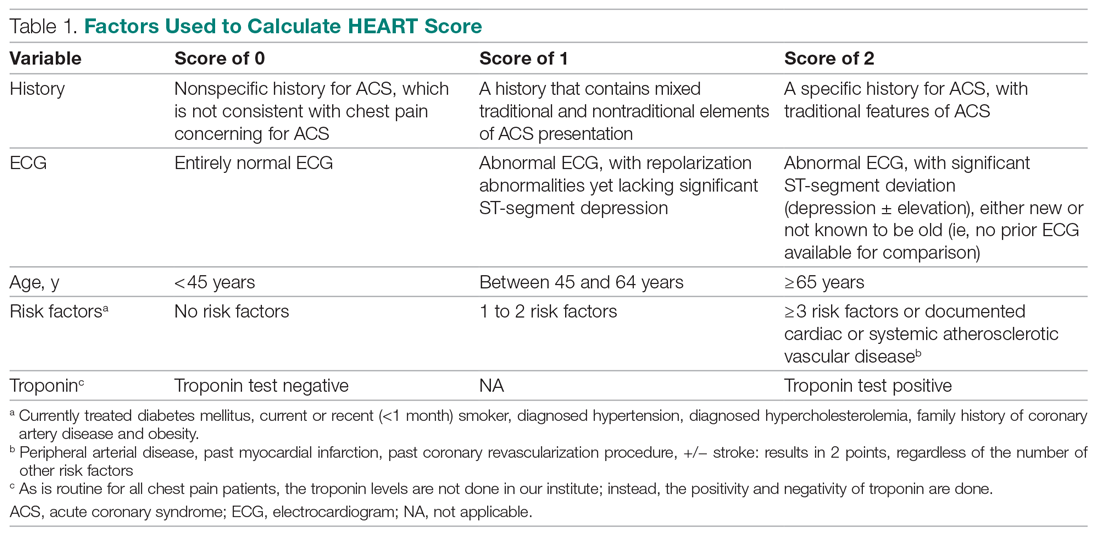
For this study, the patient’s history and ECGs were interpreted by internal medicine attending physicians in the ED. The ECG taken in the emergency room was reviewed and classified, and a copy of the admission ECG was added to the file. The recommendation for patients with a HEART score in a particular range was evaluated. Notably, those with a score of 3 or lower led to a recommendation of reassurance and early discharge. Those with a HEART score in the intermediate range (4-6) were admitted to the hospital for further clinical observation and testing, whereas a high HEART score (7-10) led to admission for intensive monitoring and early intervention. In the analysis of HEART score data, we only used those patients having records for all 5 parameters, excluding patients without an ECG or troponin test.
Results
Myocardial infarction (MI) was defined based on Universal Definition of Myocardial Infarction.13 Coronary revascularization was defined as angioplasty with or without stent placement or coronary artery bypass surgery.14 Percutaneous coronary intervention (PCI) was defined as any therapeutic catheter intervention in the coronary arteries. Coronary artery bypass graft (CABG) surgery was defined as any cardiac surgery in which coronary arteries were operated on.
The primary outcomes in this study were the (1) risk stratification of chest pain patients into low-risk, intermediate-risk, and high-risk categories; (2) incidence of a MACE within 6 weeks of initial presentation. MACE consists of acute myocardial infarction (AMI), PCI, CABG, coronary angiography revealing procedurally correctable stenosis managed conservatively, and death due to any cause.
Our secondary outcomes were discharge or death due to any cause within 6 weeks after presentation.
Follow-up
Within 6 weeks after presentation to the ED, a follow-up phone call was placed to assess the patient’s progress. The follow-up focused on the endpoint of MACE, comprising all-cause death, MI, and revascularization. No patient was lost to follow-up.
Statistical analysis
We aimed to find a difference in the 6-week MACE between low-, intermediate-, and high-risk categories of the HEART score. The prevalence of CHD in India is 10%,4 and assuming an α of 0.05, we needed a sample of 141 patients from the ED patient population. Continuous variables were presented by mean (SD), and categorical variables as percentages. We used t test and the Mann-Whitney U test for comparison of means for continuous variables, χ2 for categorical variables, and Fisher’s exact test for comparison of the categorical variables. Results with P < .05 were considered statistically significant.
We evaluated 141 patients presenting to the ED with chest pain concerning for ACS during the study period, from July 2019 to October 2019.
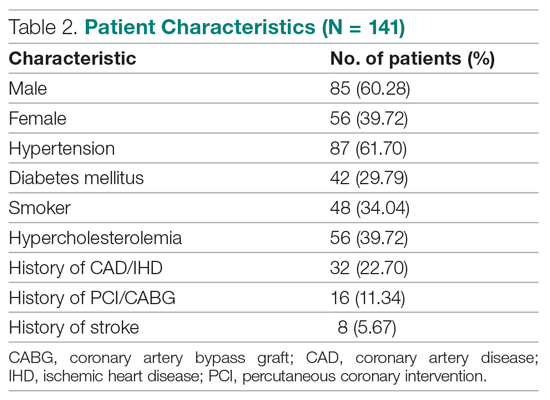
Primary outcomes
The risk stratification of the HEART score in chest pain patients and the incidence of 6-week MACE are outlined in Table 3
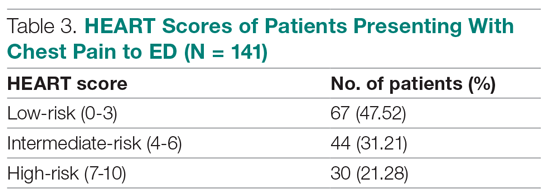
The distribution of the HEART score’s 5 elements in the groups with or without MACE endpoints is shown in Table 5. Notice the significant differences between the groups. A follow-up phone call was made within 6 weeks after the presentation to the ED to assess the patient’s progress. The 6-week follow-up call data are included in Table 6.
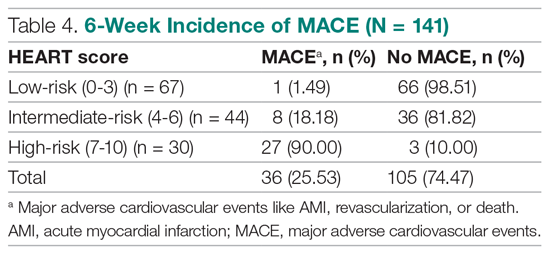
Of 141 patients, 36 patients (25.53%) were diagnosed with MACE within 6 weeks of presentation.
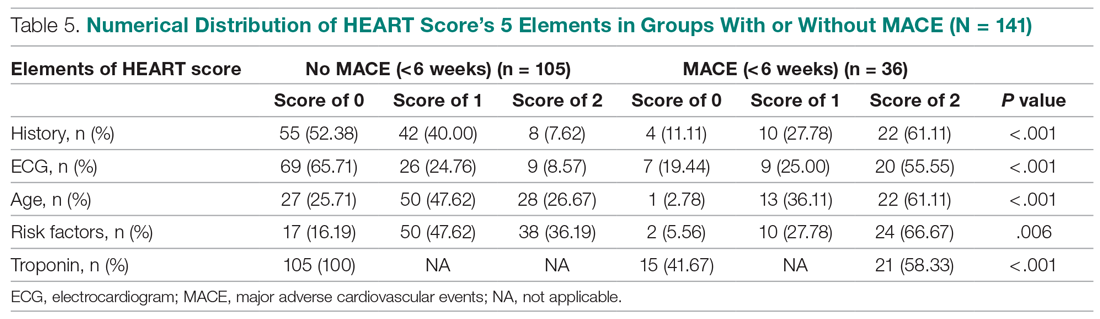
Myocardial infarction—An AMI was diagnosed in 24 of the 141 patients (17.02%). Twenty-one of those already had positive markers on admission (apparently, these AMI had started before their arrival to the emergency room). One AMI occurred 2 days after admission in a 66-year-old male, and another occurred 10 days after discharge. A further AMI occurred 2 weeks after discharge. All 3 patients belonged to the intermediate-risk group.
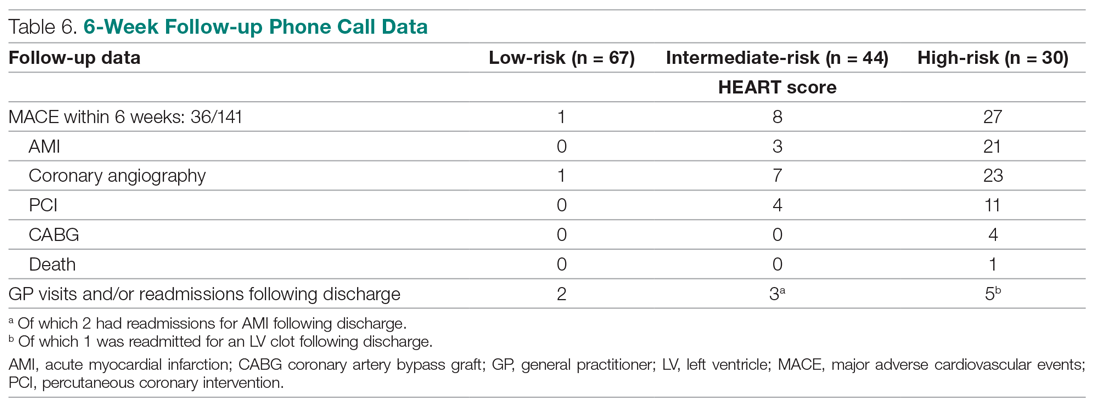
Revascularization—Coronary angiography was performed in 31 of 141 patients (21.99%). Revascularization was performed in 19 patients (13.48%), of which 15 were PCIs (10.64%) and 4 were CABGs (2.84%).
Mortality—One patient died from the study population. He was a 72-year-old male who died 14 days after admission. He had a HEART score of 8.
Among the 67 low-risk patients:
- MACE: Coronary angiography was performed in 1 patient (1.49%). Among the 67 patients in the low-risk category, there was no cases of AMI or deaths. The remaining 66 patients (98.51%) had an uneventful recovery following discharge.
- General practitioner (GP) visits/readmissions following discharge: Two of 67 patients (2.99%) had GP visits following discharge, of which 1 was uneventful. The other patient, a 64-year-old male, was readmitted due to a recurrent history of chest pain and underwent coronary angiography.
Among the 44 intermediate-risk patients:
- MACE: Of the 7 of 44 patients (15.91%) who had coronary angiography, 3 patients (6.82%) had AMI, of which 1 occurred 2 days after admission in a 66-year-old male. Two patients had AMI following discharge. There were no deaths. Overall, 42 of 44 patients (95.55%) had an uneventful recovery following discharge.
- GP visits/readmissions following discharge: Three of 44 patients (6.82%) had repeated visits following discharge. One was a GP visit that was uneventful. The remaining 2 patients were diagnosed with AMI and readmitted following discharge. One AMI occurred 10 days after discharge in a patient with a HEART score of 6; another occurred 2 weeks after discharge in a patient with a HEART score of 5.
Among the 30 high-risk patients:
- MACE: Twenty-three of 30 patients (76.67%) underwent coronary angiography. One patient died 5 days after discharge. The patient had a HEART score of 8. Most patients however, had an uneventful recovery following discharge (28, 93.33%).
- GP visits/readmissions following discharge: Five of 30 patients (16.67%) had repeated visits following discharge. Two were uneventful. Two patients had a history of recurrent chest pain that resolved on Sorbitrate. One patient was readmitted 2 weeks following discharge due to a complication: a left ventricular clot was found. The patient had a HEART score of 10.
Secondary outcome—Overall, 140 of 141 patients were discharged. One patient died: a 72-year-old male with a HEART score of 8.
Feasibility—To determine the ease and feasibility of performing a HEART score in chest pain patients presenting to the ED, a survey was distributed to the internal medicine physicians in the ED. In the survey, the Likert scale was used to rate the ease of utilizing the HEART score and whether the physicians found it feasible to use it for risk stratification of their chest pain patients. A total of 12 of 15 respondents (80%) found it “easy” to use. Of the remaining 3 respondents, 2 (13.33%) rated the HEART score “very easy” to use, while 1 (6.66%) considered it “difficult” to work with. None of the respondents said that it was not feasible to perform a HEART score in the ED.
Risk factors for reaching an endpoint:
We compared risk profiles between the patient groups with and without an endpoint. The group of patients with MACE were older and had a higher proportion of males than the group of patients without MACE. Moreover, they also had a higher prevalence of hypertension, type 2 diabetes mellitus, smoking, hypercholesterolemia, prior history of PCI/CABG, and history of stroke. These also showed a significant association with MACE. Obesity was not included in our risk factors as we did not have data collected to measure body mass index. Results are represented in Table 7.
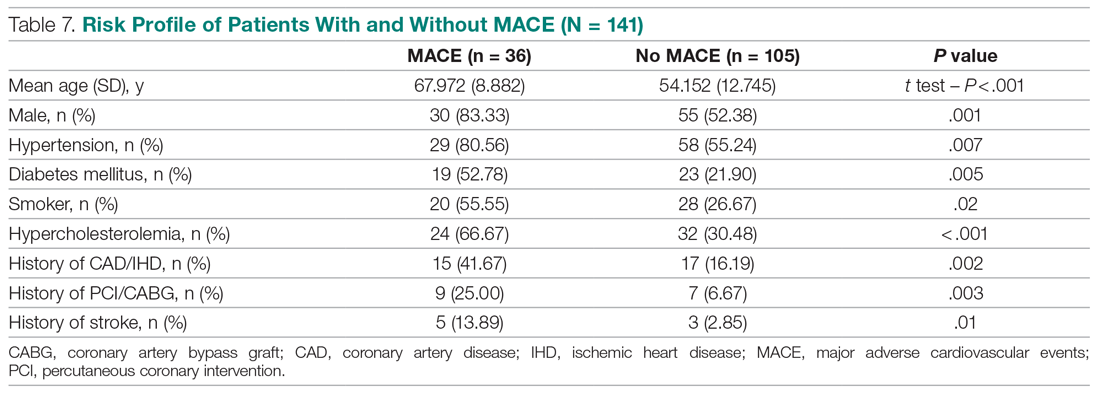
Discussion
Our study described a patient population presenting to an ED with chest pain as their primary complaint. The results of this prospective study confirm that the HEART score is an excellent system to triage chest pain patients. It provides the clinician with a reliable predictor of the outcome (MACE) after the patient’s arrival, based on available clinical data and in a resource-limited setting like ours.
Cardiovascular epidemiology studies indicate that this has become a significant public health problem in India.1 Several risk scores for ACS have been published in European and American guidelines. However, in the Indian population, minimal data are available on utilization of such a triage score (HEART score) in chest pain patients in the ED in a resource-limited setting, to the best of our knowledge. In India, only 1 such study is reported,15 at the Sundaram Medical Foundation, a 170-bed community hospital in Chennai. In this study, 13 of 14 patients (92.86%) with a high HEART score had MACE, indicating a sensitivity of 92.86%; in the 44 patients with a low HEART score, 1 patient (2.22%) had MACE, indicating a specificity of 97.78%; and in the 28 patients with a moderate HEART score, 12 patients (42.86%) had MACE.
In looking for the optimal risk-stratifying system for chest pain patients, we analyzed the HEART score. The first study on the HEART score was done Backus et al, proving that the HEART score is an easy, quick, and reliable predictor of outcomes in chest pain patients.10 The HEART score had good discriminatory power, too. The C statistic for the HEART score for ACS occurrence shows a value of 0.83. This signifies a good-to-excellent ability to stratify all-cause chest pain patients in the ED for their risk of MACE. The application of the HEART score to our patient population demonstrated that the majority of the patients belonged to the low-risk category, as reported in the first cohort study that applied the HEART score.8 The relationship between the HEART score category and occurrence of MACE within 6 weeks showed a curve with 3 different patterns, corresponding to the 3 risk categories defined in the literature.11,12 The risk stratification of chest pain patients using the 3 categories (0-3, 4-6, 7-10) identified MACE with an incidence similar to the multicenter study of Backus et al,10,11 but with a greater risk of MACE in the high-risk category (Figure).
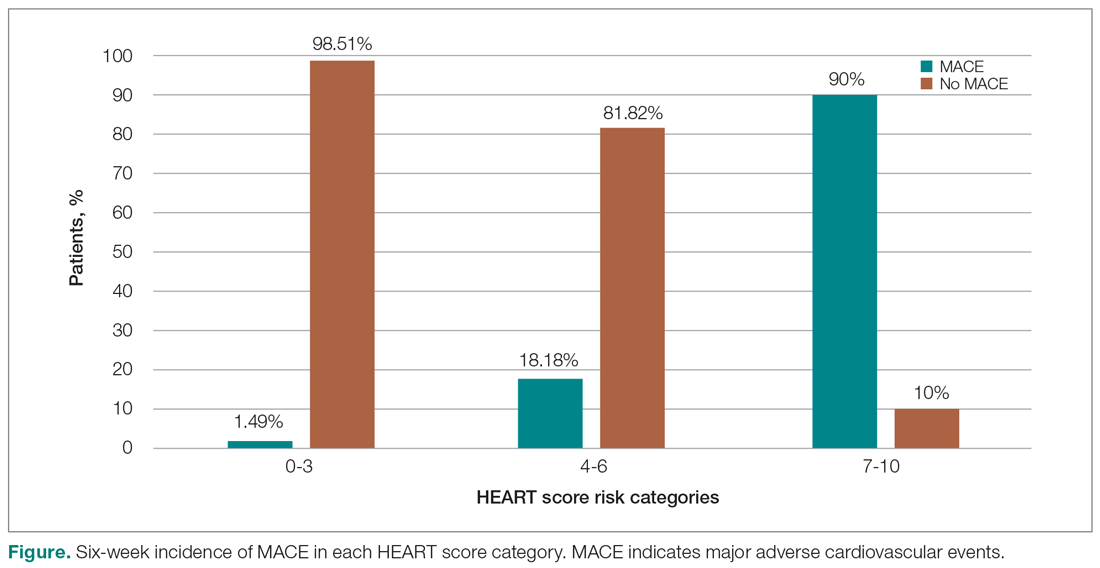
Thus, our study confirmed the utility of the HEART score categories to predict the 6-week incidence of MACE. The sensitivity, specificity, and positive and negative predictive values for the established cut-off scores of 4 and 7 are shown in Table 8. The patients in the low-risk category, corresponding to a score < 4, had a very high negative predictive value, thus identifying a small-risk population. The patients in the high-risk category (score ≥ 7) showed a high positive predictive value, allowing the identification of a high-risk population, even in patients with more atypical presentations. Therefore, the HEART score may help clinicians to make accurate management choices by being a strong predictor of both event-free survival and potentially life-threatening cardiac events.11,12
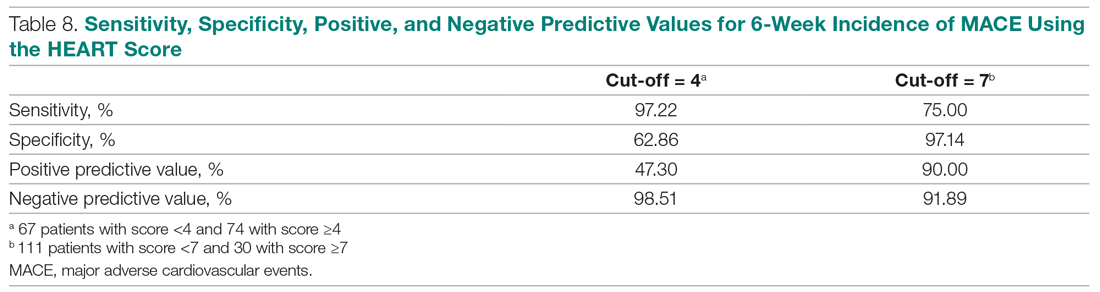
Our study tested the efficacy of the HEART score pathway in helping clinicians make smart diagnostic and therapeutic choices. It confirmed that the HEART score was accurate in predicting the short-term incidence of MACE, thus stratifying patients according to their risk severity. In our study, 67 of 141 patients (47.52%) had low-risk HEART scores, and we found the 6-week incidence of MACE to be 1.49%. We omitted the diagnostic and treatment evaluation for patients in the low-risk category and moved onto discharge. Overall, 66 of 67 patients (98.51%) in the low-risk category had an uneventful recovery following discharge. Only 2 of 67 these patients (2.99%) of patients had health care utilization following discharge. Therefore, extrapolation based on results demonstrates reduced health care utilization. Previous studies have shown similar results.9,12,14,16 For instance, in a prospective study conducted in the Netherlands, low-risk patients representing 36.4% of the total were found to have a low MACE rate (1.7%).9 These low-risk patients were categorized as appropriate and safe for ED discharge without additional cardiac evaluation or inpatient admission.9 Another retrospective study in Portugal,12 and one in Chennai, India,15 found the 6-week incidence of MACE to be 2.00% and 2.22%, respectively. The results of the first HEART Pathway Randomized Control Trial14 showed that the HEART score pathway reduces health care utilization (cardiac testing, hospitalization, and hospital length of stay). The study also showed that these gains occurred without any of the patients that were identified for early discharge, suffering from MACE at 30 days, or secondary increase in cardiac-related hospitalizations. Similar results were obtained by a randomized trial conducted in North Carolina17 that also demonstrated a reduction in objective cardiac testing, a doubling of the rate of early discharge from the ED, and a reduced length of stay by half a day. Another study using a modified HEART score also demonstrated that when low-risk patients are evaluated with cardiac testing, the likelihood for false positives is high.16 Hoffman et al also reported that patients randomized to coronary computed tomographic angiography (CCTA) received > 2.5 times more radiation exposure.16 Thus, low-risk patients may be safely discharged without the need for stress testing or CCTA.
In our study, 30 out of 141 patients (21.28%) had high-risk HEART scores (7-10), and we found the 6-week incidence of MACE to be 90%. Based on the pathway leading to inpatient admission and intensive treatment, 23 of 30 patients (76.67%) patients in our study underwent coronary angiography and further therapeutic treatment. In the high-risk category, 28 of 30 patients (93.33%) patients had an uneventful recovery following discharge. Previous studies have shown similar results. A retrospective study in Portugal showed that 76.9% of the high-risk patients had a 6-week incidence of MACE.12 In a study in the Netherlands,9 72.7% of high-risk patients had a 6-week incidence of MACE. Therefore, a HEART score of ≥ 7 in patients implies early aggressive treatment, including invasive strategies, when necessary, without noninvasive treatment preceding it.8
In terms of intermediate risk, in our study 44 of 141 patients (31.21%) patients had an intermediate-risk HEART score (4-6), and we found the 6-week incidence of MACE to be 18.18%. Based on the pathway, they were kept in the observation ward on admission. In our study, 7 of 44 patients (15.91%) underwent coronary angiography and further treatment; 42 of 44 patients (95.55%) had an uneventful recovery following discharge. In a prospective study in the Netherlands, 46.1% of patients with an intermediate score had a 6-week MACE incidence of 16.6%.10 Similarly, in another retrospective study in Portugal, the incidence of 6-week MACE in intermediate-risk patients (36.7%) was found to be 15.6%.12 Therefore, in patients with a HEART score of 4-6 points, immediate discharge is not an option, as this figure indicates a risk of 18.18% for an adverse outcome. These patients should be admitted for clinical observation, treated as an ACS awaiting final diagnosis, and subjected to noninvasive investigations, such as repeated troponin. Using the HEART score as guidance in the treatment of chest pain patients will benefit patients on both sides of the spectrum.11,12
Our sample presented a male predominance, a wide range of age, and a mean age similar to that of previous studies.12.16 Some risk factors, we found, can increase significantly the odds of chest pain being of cardiovascular origin, such as male gender, smoking, hypertension, type 2 diabetes mellitus, and hypercholesterolemia. Other studies also reported similar findings.8,12,16 Risk factors for premature CHD have been quantified in the case-control INTERHEART study.1 In the INTERHEART study, 8 common risk factors explained > 90% of AMIs in South Asian and Indian patients. The risk factors include dyslipidemia, smoking or tobacco use, known hypertension, known diabetes, abdominal obesity, physical inactivity, low fruit and vegetable intake, and psychosocial stress.1 Regarding the feasibility of treating physicians using the HEART score in the ED, we observed that, based on the Likert scale, 80% of survey respondents found it easy to use, and 100% found it feasible in the ED.
However, there were certain limitations to our study. It involved a single academic medical center and a small sample size, which limit generalizability of the findings. In addition, troponin levels are not calculated at our institution, as it is a resource-limited setting; therefore, we used a positive and negative as +2 and 0, respectively.
Conclusion
The HEART score provides the clinician with a quick and reliable predictor of outcome of patients with chest pain after arrival to the ED and can be used for triage. For patients with low HEART scores (0-3), short-term MACE can be excluded with greater than 98% certainty. In these patients, one may consider reserved treatment and discharge policies that may also reduce health care utilization. In patients with high HEART scores (7-10), the high risk of MACE (90%) may indicate early aggressive treatment, including invasive strategies, when necessary. Therefore, the HEART score may help clinicians make accurate management choices by being a strong predictor of both event-free survival and potentially life-threatening cardiac events. Age, gender, and cardiovascular risk factors may also be considered in the assessment of patients. This study confirmed the utility of the HEART score categories to predict the 6-week incidence of MACE.
Corresponding author: Smrati Bajpai Tiwari, MD, DNB, FAIMER, Department of Medicine, Seth Gordhandas Sunderdas Medical College and King Edward Memorial Hospital, Acharya Donde Marg, Parel, Mumbai 400 012, Maharashtra, India; smrati.bajpai@gmail.com.
Financial disclosures: None.
1. Gupta R, Mohan I, Narula J. Trends in coronary heart disease epidemiology in India. Ann Glob Health. 2016;82:307-315.
2. World Health Organization. Global status report on non-communicable diseases 2014. Accessed June 22, 2021. https://apps.who.int/iris/bitstream/handle/10665/148114/9789241564854_eng.pdf
3. Fuster V, Kelly BB, eds. Promoting Cardiovascular Health in the Developing World: A Critical Challenge to Achieve Global Health. Institutes of Medicine; 2010.
4. Krishnan MN. Coronary heart disease and risk factors in India—on the brink of an epidemic. Indian Heart J. 2012;64:364-367.
5. Prabhakaran D, Jeemon P, Roy A. Cardiovascular diseases in India: current epidemiology and future directions. Circulation. 2016;133:1605-1620.
6. Aeri B, Chauhan S. The rising incidence of cardiovascular diseases in India: assessing its economic impact. J Prev Cardiol. 2015;4:735-740.
7. Pednekar M, Gupta R, Gupta PC. Illiteracy, low educational status and cardiovascular mortality in India. BMC Public Health. 2011;11:567.
8. Six AJ, Backus BE, Kelder JC. Chest pain in the emergency room: value of the HEART score. Neth Heart J. 2008;16:191-196.
9. Backus BE, Six AJ, Kelder JC, et al. A prospective validation of the HEART score for chest pain patients at the emergency department. Int J Cardiol. 2013;168;2153-2158.
10. Backus BE, Six AJ, Kelder JC, et al. Chest pain in the emergency room: a multicenter validation of the HEART score. Crit Pathw Cardiol. 2010;9:164-169.
11. Backus BE, Six AJ, Kelder JH, et al. Risk scores for patients with chest pain: evaluation in the emergency department. Curr Cardiol Rev. 2011;7:2-8.
12. Leite L, Baptista R, Leitão J, et al. Chest pain in the emergency department: risk stratification with Manchester triage system and HEART score. BMC Cardiovasc Disord. 2015;15:48.
13. Thygesen K, Alpert JS, Jaffe AS, et al. Fourth Universal Definition of Myocardial Infarction. Circulation. 2018;138:e618-e651.
14. Mahler SA, Riley RF, Hiestand BC, et al. The HEART Pathway randomized trial: identifying emergency department patients with acute chest pain for early discharge. Circ Cardiovasc Qual Outcomes. 2015;8:195-203.
15. Natarajan B, Mallick P, Thangalvadi TA, Rajavelu P. Validation of the HEART score in Indian population. Int J Emerg Med. 2015,8(suppl 1):P5.
16. McCord J, Cabrera R, Lindahl B, et al. Prognostic utility of a modified HEART score in chest pain patients in the emergency department. Circ Cardiovasc Qual Outcomes. 2017;10:e003101.
17. Mahler SA, Miller CD, Hollander JE, et al. Identifying patients for early discharge: performance of decision rules among patients with acute chest pain. Int J Cardiol. 2012;168:795-802.
From the Department of Internal Medicine, Mount Sinai Health System, Icahn School of Medicine at Mount Sinai, New York, NY (Dr. Gandhi), and the School of Medicine, Seth Gordhandas Sunderdas Medical College, and King Edward Memorial Hospital, Mumbai, India (Drs. Gandhi and Tiwari).
Objective: Calculation of HEART score to (1) stratify patients as low-risk, intermediate-risk, high-risk, and to predict the short-term incidence of major adverse cardiovascular events (MACE), and (2) demonstrate feasibility of HEART score in our local settings.
Design: A prospective cohort study of patients with a chief complaint of chest pain concerning for acute coronary syndrome.
Setting: Participants were recruited from the emergency department (ED) of King Edward Memorial Hospital, a tertiary care academic medical center and a resource-limited setting in Mumbai, India.
Participants: We evaluated 141 patients aged 18 years and older presenting to the ED and stratified them using the HEART score. To assess patients’ progress, a follow-up phone call was made within 6 weeks after presentation to the ED.
Measurements: The primary outcomes were a risk stratification, 6-week occurrence of MACE, and performance of unscheduled revascularization or stress testing. The secondary outcomes were discharge or death.
Results: The 141 participants were stratified into low-risk, intermediate-risk, and high-risk groups: 67 (47.52%), 44 (31.21%), and 30 (21.28%), respectively. The 6-week incidence of MACE in each category was 1.49%, 18.18%, and 90%, respectively. An acute myocardial infarction was diagnosed in 24 patients (17.02%), 15 patients (10.64%) underwent percutaneous coronary intervention (PCI), and 4 patients (2.84%) underwent coronary artery bypass graft (CABG). Overall, 98.5% of low-risk patients and 93.33% of high-risk patients had an uneventful recovery following discharge; therefore, extrapolation based on results demonstrated reduced health care utilization. All the survey respondents found the HEART score to be feasible. The patient characteristics and risk profile of the patients with and without MACE demonstrated that: patients with MACE were older and had a higher proportion of males, hypertension, type 2 diabetes mellitus, smoking, hypercholesterolemia, prior history of PCI/CABG, and history of stroke.
Conclusion: The HEART score seems to be a useful tool for risk stratification and a reliable predictor of outcomes in chest pain patients and can therefore be used for triage.
Keywords: chest pain; emergency department; HEART score; acute coronary syndrome; major adverse cardiac events; myocardial infarction; revascularization.
Cardiovascular diseases (CVDs), especially coronary heart disease (CHD), have epidemic proportions worldwide. Globally, in 2012, CVD led to 17.5 million deaths,1,2 with more than 75% of them occurring in developing countries. In contrast to developed countries, where mortality from CHD is rapidly declining, it is increasing in developing countries.1,3 Current estimates from epidemiologic studies from various parts of India indicate the prevalence of CHD in India to be between 7% and 13% in urban populations and 2% and 7% in rural populations.4
Premature mortality in terms of years of life lost because of CVD in India increased by 59% over a 20-year span, from 23.2 million in 1990 to 37 million in 2010.5 Studies conducted in Mumbai (Mumbai Cohort Study) reported very high CVD mortality rates, approaching 500 per 100 000 for men and 250 per 100 000 for women.6,7 However, to the best of our knowledge, in the Indian population, there are minimal data on utilization of a triage score, such as the HEART score, in chest pain patients in the emergency department (ED) in a resource-limited setting.
The most common reason for admitting patients to the ED is chest pain.8 There are various cardiac and noncardiac etiologies of chest pain presentation. Acute coronary syndrome (ACS) needs to be ruled out first in every patient presenting with chest pain. However, 80% of patients with ACS have no clear diagnostic features on presentation.9 The timely diagnosis and treatment of patients with ACS improves their prognosis. Therefore, clinicians tend to start each patient on ACS treatment to reduce the risk, which often leads to increased costs due to unnecessary, time-consuming diagnostic procedures that may place burdens on both the health care system and the patient.10
Several risk-stratifying tools have been developed in the last few years. Both the GRACE and TIMI risk scores have been designed for risk stratification of patients with proven ACS and not for the chest pain population at the ED.11 Some of these tools are applicable to patients with all types of chest pain presenting to the ED, such as the Manchester Triage System. Other, more selective systems are devoted to the risk stratification of suspected ACS in the ED. One is the HEART score.12
The first study on the HEART score—an acronym that stands for History, Electrocardiogram, Age, Risk factors, and Troponin—was done by Backus et al, who proved that the HEART score is an easy, quick, and reliable predictor of outcomes in chest pain patients.10 The HEART score predicts the short-term incidence of major adverse cardiac events (MACE), which allows clinicians to stratify patients as low-risk, intermediate-risk, and high-risk and to guide their clinical decision-making accordingly. It was developed to provide clinicians with a simple, reliable predictor of cardiac risk on the basis of the lowest score of 0 (very low-risk) up to a score of 10 (very high-risk).
We studied the clinical performance of the HEART score in patients with chest pain, focusing on the efficacy and safety of rapidly identifying patients at risk of MACE. We aimed to determine (1) whether the HEART score is a reliable predictor of outcomes of chest pain patients presenting to the ED; (2) whether the score is feasible in our local settings; and (3) whether it describes the risk profile of patients with and without MACE.
Methods
Setting
Participants were recruited from the ED of King Edward Memorial Hospital, a municipal teaching hospital in Mumbai. The study institute is a tertiary care academic medical center located in Parel, Mumbai, Maharashtra, and is a resource-limited setting serving urban, suburban, and rural populations. Participants requiring urgent attention are first seen by a casualty officer and then referred to the emergency ward. Here, the physician on duty evaluates them and decides on admission to the various wards, like the general ward, medical intensive care unit (ICU), coronary care unit (CCU), etc. The specialist’s opinion may also be obtained before admission. Critically ill patients are initially admitted to the emergency ward and stabilized before being shifted to other areas of the hospital.
Participants
Patients aged 18 years and older presenting with symptoms of acute chest pain or suspected ACS were stratified by priority using the chest pain scoring system—the HEART score. Only patients presenting to the ED were eligible for the study. Informed consent from the patient or next of kin was mandatory for participation in the study.
Patients were determined ineligible for the following reasons: a clear cause for chest pain other than ACS (eg, trauma, diagnosed aortic dissection), persisting or recurrent chest pain caused by rheumatic diseases or cancer (a terminal illness), pregnancy, unable or unwilling to provide informed consent, or incomplete data.
Study design
We conducted a
We conducted our study to determine the importance of calculating the HEART score in each patient, which will help to correctly place them into low-, intermediate-, and high-risk groups for clinically important, irreversible adverse cardiac events and guide the clinical decision-making. Patients with low risk will avoid costly tests and hospital admissions, thus decreasing the cost of treatment and ensuring timely discharge from the ED. Patients with high risk will be treated immediately, to possibly prevent a life-threatening, ACS-related incident. Thus, the HEART score will serve as a quick and reliable predictor of outcomes in chest pain patients and help clinicians to make accurate diagnostic and therapeutic choices in uncertain situations.
HEART score
The total number of points for History, Electrocardiogram (ECG), Age, Risk factors, and Troponin was noted as the HEART score (Table 1).
For this study, the patient’s history and ECGs were interpreted by internal medicine attending physicians in the ED. The ECG taken in the emergency room was reviewed and classified, and a copy of the admission ECG was added to the file. The recommendation for patients with a HEART score in a particular range was evaluated. Notably, those with a score of 3 or lower led to a recommendation of reassurance and early discharge. Those with a HEART score in the intermediate range (4-6) were admitted to the hospital for further clinical observation and testing, whereas a high HEART score (7-10) led to admission for intensive monitoring and early intervention. In the analysis of HEART score data, we only used those patients having records for all 5 parameters, excluding patients without an ECG or troponin test.
Results
Myocardial infarction (MI) was defined based on Universal Definition of Myocardial Infarction.13 Coronary revascularization was defined as angioplasty with or without stent placement or coronary artery bypass surgery.14 Percutaneous coronary intervention (PCI) was defined as any therapeutic catheter intervention in the coronary arteries. Coronary artery bypass graft (CABG) surgery was defined as any cardiac surgery in which coronary arteries were operated on.
The primary outcomes in this study were the (1) risk stratification of chest pain patients into low-risk, intermediate-risk, and high-risk categories; (2) incidence of a MACE within 6 weeks of initial presentation. MACE consists of acute myocardial infarction (AMI), PCI, CABG, coronary angiography revealing procedurally correctable stenosis managed conservatively, and death due to any cause.
Our secondary outcomes were discharge or death due to any cause within 6 weeks after presentation.
Follow-up
Within 6 weeks after presentation to the ED, a follow-up phone call was placed to assess the patient’s progress. The follow-up focused on the endpoint of MACE, comprising all-cause death, MI, and revascularization. No patient was lost to follow-up.
Statistical analysis
We aimed to find a difference in the 6-week MACE between low-, intermediate-, and high-risk categories of the HEART score. The prevalence of CHD in India is 10%,4 and assuming an α of 0.05, we needed a sample of 141 patients from the ED patient population. Continuous variables were presented by mean (SD), and categorical variables as percentages. We used t test and the Mann-Whitney U test for comparison of means for continuous variables, χ2 for categorical variables, and Fisher’s exact test for comparison of the categorical variables. Results with P < .05 were considered statistically significant.
We evaluated 141 patients presenting to the ED with chest pain concerning for ACS during the study period, from July 2019 to October 2019.
Primary outcomes
The risk stratification of the HEART score in chest pain patients and the incidence of 6-week MACE are outlined in Table 3
The distribution of the HEART score’s 5 elements in the groups with or without MACE endpoints is shown in Table 5. Notice the significant differences between the groups. A follow-up phone call was made within 6 weeks after the presentation to the ED to assess the patient’s progress. The 6-week follow-up call data are included in Table 6.
Of 141 patients, 36 patients (25.53%) were diagnosed with MACE within 6 weeks of presentation.
Myocardial infarction—An AMI was diagnosed in 24 of the 141 patients (17.02%). Twenty-one of those already had positive markers on admission (apparently, these AMI had started before their arrival to the emergency room). One AMI occurred 2 days after admission in a 66-year-old male, and another occurred 10 days after discharge. A further AMI occurred 2 weeks after discharge. All 3 patients belonged to the intermediate-risk group.
Revascularization—Coronary angiography was performed in 31 of 141 patients (21.99%). Revascularization was performed in 19 patients (13.48%), of which 15 were PCIs (10.64%) and 4 were CABGs (2.84%).
Mortality—One patient died from the study population. He was a 72-year-old male who died 14 days after admission. He had a HEART score of 8.
Among the 67 low-risk patients:
- MACE: Coronary angiography was performed in 1 patient (1.49%). Among the 67 patients in the low-risk category, there was no cases of AMI or deaths. The remaining 66 patients (98.51%) had an uneventful recovery following discharge.
- General practitioner (GP) visits/readmissions following discharge: Two of 67 patients (2.99%) had GP visits following discharge, of which 1 was uneventful. The other patient, a 64-year-old male, was readmitted due to a recurrent history of chest pain and underwent coronary angiography.
Among the 44 intermediate-risk patients:
- MACE: Of the 7 of 44 patients (15.91%) who had coronary angiography, 3 patients (6.82%) had AMI, of which 1 occurred 2 days after admission in a 66-year-old male. Two patients had AMI following discharge. There were no deaths. Overall, 42 of 44 patients (95.55%) had an uneventful recovery following discharge.
- GP visits/readmissions following discharge: Three of 44 patients (6.82%) had repeated visits following discharge. One was a GP visit that was uneventful. The remaining 2 patients were diagnosed with AMI and readmitted following discharge. One AMI occurred 10 days after discharge in a patient with a HEART score of 6; another occurred 2 weeks after discharge in a patient with a HEART score of 5.
Among the 30 high-risk patients:
- MACE: Twenty-three of 30 patients (76.67%) underwent coronary angiography. One patient died 5 days after discharge. The patient had a HEART score of 8. Most patients however, had an uneventful recovery following discharge (28, 93.33%).
- GP visits/readmissions following discharge: Five of 30 patients (16.67%) had repeated visits following discharge. Two were uneventful. Two patients had a history of recurrent chest pain that resolved on Sorbitrate. One patient was readmitted 2 weeks following discharge due to a complication: a left ventricular clot was found. The patient had a HEART score of 10.
Secondary outcome—Overall, 140 of 141 patients were discharged. One patient died: a 72-year-old male with a HEART score of 8.
Feasibility—To determine the ease and feasibility of performing a HEART score in chest pain patients presenting to the ED, a survey was distributed to the internal medicine physicians in the ED. In the survey, the Likert scale was used to rate the ease of utilizing the HEART score and whether the physicians found it feasible to use it for risk stratification of their chest pain patients. A total of 12 of 15 respondents (80%) found it “easy” to use. Of the remaining 3 respondents, 2 (13.33%) rated the HEART score “very easy” to use, while 1 (6.66%) considered it “difficult” to work with. None of the respondents said that it was not feasible to perform a HEART score in the ED.
Risk factors for reaching an endpoint:
We compared risk profiles between the patient groups with and without an endpoint. The group of patients with MACE were older and had a higher proportion of males than the group of patients without MACE. Moreover, they also had a higher prevalence of hypertension, type 2 diabetes mellitus, smoking, hypercholesterolemia, prior history of PCI/CABG, and history of stroke. These also showed a significant association with MACE. Obesity was not included in our risk factors as we did not have data collected to measure body mass index. Results are represented in Table 7.
Discussion
Our study described a patient population presenting to an ED with chest pain as their primary complaint. The results of this prospective study confirm that the HEART score is an excellent system to triage chest pain patients. It provides the clinician with a reliable predictor of the outcome (MACE) after the patient’s arrival, based on available clinical data and in a resource-limited setting like ours.
Cardiovascular epidemiology studies indicate that this has become a significant public health problem in India.1 Several risk scores for ACS have been published in European and American guidelines. However, in the Indian population, minimal data are available on utilization of such a triage score (HEART score) in chest pain patients in the ED in a resource-limited setting, to the best of our knowledge. In India, only 1 such study is reported,15 at the Sundaram Medical Foundation, a 170-bed community hospital in Chennai. In this study, 13 of 14 patients (92.86%) with a high HEART score had MACE, indicating a sensitivity of 92.86%; in the 44 patients with a low HEART score, 1 patient (2.22%) had MACE, indicating a specificity of 97.78%; and in the 28 patients with a moderate HEART score, 12 patients (42.86%) had MACE.
In looking for the optimal risk-stratifying system for chest pain patients, we analyzed the HEART score. The first study on the HEART score was done Backus et al, proving that the HEART score is an easy, quick, and reliable predictor of outcomes in chest pain patients.10 The HEART score had good discriminatory power, too. The C statistic for the HEART score for ACS occurrence shows a value of 0.83. This signifies a good-to-excellent ability to stratify all-cause chest pain patients in the ED for their risk of MACE. The application of the HEART score to our patient population demonstrated that the majority of the patients belonged to the low-risk category, as reported in the first cohort study that applied the HEART score.8 The relationship between the HEART score category and occurrence of MACE within 6 weeks showed a curve with 3 different patterns, corresponding to the 3 risk categories defined in the literature.11,12 The risk stratification of chest pain patients using the 3 categories (0-3, 4-6, 7-10) identified MACE with an incidence similar to the multicenter study of Backus et al,10,11 but with a greater risk of MACE in the high-risk category (Figure).
Thus, our study confirmed the utility of the HEART score categories to predict the 6-week incidence of MACE. The sensitivity, specificity, and positive and negative predictive values for the established cut-off scores of 4 and 7 are shown in Table 8. The patients in the low-risk category, corresponding to a score < 4, had a very high negative predictive value, thus identifying a small-risk population. The patients in the high-risk category (score ≥ 7) showed a high positive predictive value, allowing the identification of a high-risk population, even in patients with more atypical presentations. Therefore, the HEART score may help clinicians to make accurate management choices by being a strong predictor of both event-free survival and potentially life-threatening cardiac events.11,12
Our study tested the efficacy of the HEART score pathway in helping clinicians make smart diagnostic and therapeutic choices. It confirmed that the HEART score was accurate in predicting the short-term incidence of MACE, thus stratifying patients according to their risk severity. In our study, 67 of 141 patients (47.52%) had low-risk HEART scores, and we found the 6-week incidence of MACE to be 1.49%. We omitted the diagnostic and treatment evaluation for patients in the low-risk category and moved onto discharge. Overall, 66 of 67 patients (98.51%) in the low-risk category had an uneventful recovery following discharge. Only 2 of 67 these patients (2.99%) of patients had health care utilization following discharge. Therefore, extrapolation based on results demonstrates reduced health care utilization. Previous studies have shown similar results.9,12,14,16 For instance, in a prospective study conducted in the Netherlands, low-risk patients representing 36.4% of the total were found to have a low MACE rate (1.7%).9 These low-risk patients were categorized as appropriate and safe for ED discharge without additional cardiac evaluation or inpatient admission.9 Another retrospective study in Portugal,12 and one in Chennai, India,15 found the 6-week incidence of MACE to be 2.00% and 2.22%, respectively. The results of the first HEART Pathway Randomized Control Trial14 showed that the HEART score pathway reduces health care utilization (cardiac testing, hospitalization, and hospital length of stay). The study also showed that these gains occurred without any of the patients that were identified for early discharge, suffering from MACE at 30 days, or secondary increase in cardiac-related hospitalizations. Similar results were obtained by a randomized trial conducted in North Carolina17 that also demonstrated a reduction in objective cardiac testing, a doubling of the rate of early discharge from the ED, and a reduced length of stay by half a day. Another study using a modified HEART score also demonstrated that when low-risk patients are evaluated with cardiac testing, the likelihood for false positives is high.16 Hoffman et al also reported that patients randomized to coronary computed tomographic angiography (CCTA) received > 2.5 times more radiation exposure.16 Thus, low-risk patients may be safely discharged without the need for stress testing or CCTA.
In our study, 30 out of 141 patients (21.28%) had high-risk HEART scores (7-10), and we found the 6-week incidence of MACE to be 90%. Based on the pathway leading to inpatient admission and intensive treatment, 23 of 30 patients (76.67%) patients in our study underwent coronary angiography and further therapeutic treatment. In the high-risk category, 28 of 30 patients (93.33%) patients had an uneventful recovery following discharge. Previous studies have shown similar results. A retrospective study in Portugal showed that 76.9% of the high-risk patients had a 6-week incidence of MACE.12 In a study in the Netherlands,9 72.7% of high-risk patients had a 6-week incidence of MACE. Therefore, a HEART score of ≥ 7 in patients implies early aggressive treatment, including invasive strategies, when necessary, without noninvasive treatment preceding it.8
In terms of intermediate risk, in our study 44 of 141 patients (31.21%) patients had an intermediate-risk HEART score (4-6), and we found the 6-week incidence of MACE to be 18.18%. Based on the pathway, they were kept in the observation ward on admission. In our study, 7 of 44 patients (15.91%) underwent coronary angiography and further treatment; 42 of 44 patients (95.55%) had an uneventful recovery following discharge. In a prospective study in the Netherlands, 46.1% of patients with an intermediate score had a 6-week MACE incidence of 16.6%.10 Similarly, in another retrospective study in Portugal, the incidence of 6-week MACE in intermediate-risk patients (36.7%) was found to be 15.6%.12 Therefore, in patients with a HEART score of 4-6 points, immediate discharge is not an option, as this figure indicates a risk of 18.18% for an adverse outcome. These patients should be admitted for clinical observation, treated as an ACS awaiting final diagnosis, and subjected to noninvasive investigations, such as repeated troponin. Using the HEART score as guidance in the treatment of chest pain patients will benefit patients on both sides of the spectrum.11,12
Our sample presented a male predominance, a wide range of age, and a mean age similar to that of previous studies.12.16 Some risk factors, we found, can increase significantly the odds of chest pain being of cardiovascular origin, such as male gender, smoking, hypertension, type 2 diabetes mellitus, and hypercholesterolemia. Other studies also reported similar findings.8,12,16 Risk factors for premature CHD have been quantified in the case-control INTERHEART study.1 In the INTERHEART study, 8 common risk factors explained > 90% of AMIs in South Asian and Indian patients. The risk factors include dyslipidemia, smoking or tobacco use, known hypertension, known diabetes, abdominal obesity, physical inactivity, low fruit and vegetable intake, and psychosocial stress.1 Regarding the feasibility of treating physicians using the HEART score in the ED, we observed that, based on the Likert scale, 80% of survey respondents found it easy to use, and 100% found it feasible in the ED.
However, there were certain limitations to our study. It involved a single academic medical center and a small sample size, which limit generalizability of the findings. In addition, troponin levels are not calculated at our institution, as it is a resource-limited setting; therefore, we used a positive and negative as +2 and 0, respectively.
Conclusion
The HEART score provides the clinician with a quick and reliable predictor of outcome of patients with chest pain after arrival to the ED and can be used for triage. For patients with low HEART scores (0-3), short-term MACE can be excluded with greater than 98% certainty. In these patients, one may consider reserved treatment and discharge policies that may also reduce health care utilization. In patients with high HEART scores (7-10), the high risk of MACE (90%) may indicate early aggressive treatment, including invasive strategies, when necessary. Therefore, the HEART score may help clinicians make accurate management choices by being a strong predictor of both event-free survival and potentially life-threatening cardiac events. Age, gender, and cardiovascular risk factors may also be considered in the assessment of patients. This study confirmed the utility of the HEART score categories to predict the 6-week incidence of MACE.
Corresponding author: Smrati Bajpai Tiwari, MD, DNB, FAIMER, Department of Medicine, Seth Gordhandas Sunderdas Medical College and King Edward Memorial Hospital, Acharya Donde Marg, Parel, Mumbai 400 012, Maharashtra, India; smrati.bajpai@gmail.com.
Financial disclosures: None.
1. Gupta R, Mohan I, Narula J. Trends in coronary heart disease epidemiology in India. Ann Glob Health. 2016;82:307-315.
2. World Health Organization. Global status report on non-communicable diseases 2014. Accessed June 22, 2021. https://apps.who.int/iris/bitstream/handle/10665/148114/9789241564854_eng.pdf
3. Fuster V, Kelly BB, eds. Promoting Cardiovascular Health in the Developing World: A Critical Challenge to Achieve Global Health. Institutes of Medicine; 2010.
4. Krishnan MN. Coronary heart disease and risk factors in India—on the brink of an epidemic. Indian Heart J. 2012;64:364-367.
5. Prabhakaran D, Jeemon P, Roy A. Cardiovascular diseases in India: current epidemiology and future directions. Circulation. 2016;133:1605-1620.
6. Aeri B, Chauhan S. The rising incidence of cardiovascular diseases in India: assessing its economic impact. J Prev Cardiol. 2015;4:735-740.
7. Pednekar M, Gupta R, Gupta PC. Illiteracy, low educational status and cardiovascular mortality in India. BMC Public Health. 2011;11:567.
8. Six AJ, Backus BE, Kelder JC. Chest pain in the emergency room: value of the HEART score. Neth Heart J. 2008;16:191-196.
9. Backus BE, Six AJ, Kelder JC, et al. A prospective validation of the HEART score for chest pain patients at the emergency department. Int J Cardiol. 2013;168;2153-2158.
10. Backus BE, Six AJ, Kelder JC, et al. Chest pain in the emergency room: a multicenter validation of the HEART score. Crit Pathw Cardiol. 2010;9:164-169.
11. Backus BE, Six AJ, Kelder JH, et al. Risk scores for patients with chest pain: evaluation in the emergency department. Curr Cardiol Rev. 2011;7:2-8.
12. Leite L, Baptista R, Leitão J, et al. Chest pain in the emergency department: risk stratification with Manchester triage system and HEART score. BMC Cardiovasc Disord. 2015;15:48.
13. Thygesen K, Alpert JS, Jaffe AS, et al. Fourth Universal Definition of Myocardial Infarction. Circulation. 2018;138:e618-e651.
14. Mahler SA, Riley RF, Hiestand BC, et al. The HEART Pathway randomized trial: identifying emergency department patients with acute chest pain for early discharge. Circ Cardiovasc Qual Outcomes. 2015;8:195-203.
15. Natarajan B, Mallick P, Thangalvadi TA, Rajavelu P. Validation of the HEART score in Indian population. Int J Emerg Med. 2015,8(suppl 1):P5.
16. McCord J, Cabrera R, Lindahl B, et al. Prognostic utility of a modified HEART score in chest pain patients in the emergency department. Circ Cardiovasc Qual Outcomes. 2017;10:e003101.
17. Mahler SA, Miller CD, Hollander JE, et al. Identifying patients for early discharge: performance of decision rules among patients with acute chest pain. Int J Cardiol. 2012;168:795-802.
Real-World Experience With Automated Insulin Pump Technology in Veterans With Type 1 Diabetes
Insulin pump technology has been available since the 1970s. Innovation in insulin pumps has had significant impact on the management of diabetes mellitus (DM). In recent years, automated insulin pump technology (AIP) has proven to be a safe and effective way to treat DM. It has been studied mostly in highly organized randomized controlled trials (RCTs) in younger populations with type 1 DM (T1DM).1-3
One of the challenges in DM care has always been the wide variations in daily plasma glucose concentration that often cause major swings of hyperglycemia and hypoglycemia. Extreme variations in blood glucose have also been linked to adverse outcomes, including poor micro- and macrovascular outcomes.4,5 AIP technology is a hybrid closed-loop system that attempts to solve this problem by adjusting insulin delivery in response to real-time glucose information from a continuous glucose monitor (CGM). Glucose measurements are sent to the insulin pump in real time, which uses a specialized algorithm to determine whether insulin delivery should be up-titrated, down-titrated, or suspended.6
Several studies have shown that AIP technology reduces glucose variability and increases the percentage of time within the optimal glucose range.1-3,7 Its safety is especially indicated for patients with long-standing DM who often have hypoglycemia unawareness and recurrent episodes of hypoglycemia.7 Safety is the major advantage of the hybrid closed-loop system as long duration of DM makes patients particularly prone to emergency department (ED) visits and hospitalizations for severe hypoglycemia.8 Recurrent hypoglycemia also is associated with increased cardiovascular mortality in epidemiologic studies.9
Safety was the primary endpoint in the pivotal trial in a multicenter clinical study where 124 participants (mean age, 37.8 years; DM duration, 21.7 years; hemoglobin A1c [HbA1c], 7.4%) were monitored for 3 months while using a hybrid closed-loop pump, similar to the one used in our study.10 Remarkably, there were no device-related episodes of severe hypoglycemia or ketoacidosis. There was even a small but significant difference in HbA1c (7.4% at baseline, 6.9% at 3 months) and of the time in target range measured by CGM from 66.7% at baseline to 72.2% at 3 months). However, the mean age of the population studied was young (mean age, 37.8 years). It is unclear how these results would translate for a population of older patients with T1DM. Moreover, use of AIP systems have not been systematically tested outside of carefully controlled studies, as it would be in middle-aged veterans followed in outpatient US Department of Veterans Affairs (VA) clinics. Such an approach in the context of optimal glucose monitoring combined with use of structured DM education can significantly reduce impaired awareness of hypoglycemia in patients with T1DM of long duration.11
This is the first study to assess the feasibility of AIP technology in a real-world population of older veterans with T1DM in terms of safety and acceptability, because AIP has just recently become available for patient care in the Veterans Health Administration (VHA). This group of patients is of particular interest because they have been largely overlooked in earlier studies. They represent an older population with long-standing DM where hypoglycemia unawareness is often recurrent and incapacitating. In addition, long-standing DM makes optimal glycemic control mandatory to prevent microvascular complications.
Methods
In this retrospective review study,, we examined available data in patients with T1DM at the Malcom Randall VA Medical Center diabetes clinic in Gainesville, Florida, between March and December of 2018 who agreed to use AIP. In this clinic, the AIP system was offered to T1DM patients when the 4-year warranty of a previous insulin pump expired, they had frequent hypoglycemic events, or they were on multiple daily injections and were proficient with carbohydrate counting and adjusting insulin doses and willing to use an insulin pump. Veterans were trained on AIP use by a certified diabetes educator and pump trainer in sessions that lasted 2 to 4 hours depending on previous experience with AIP. Institutional review board approval was obtained at the University of Florida.
Demographic and clinical data before and after the initiation of AIP were collected, including standard insulin pump/CGM information for the Medtronic 670G and Guardian 3 Sensor AIPs. Several variables were evaluated, including age, gender, year of DM diagnosis, time of initiation of AIP, HbA1c, download data (percentage sensor wear, time in automated mode and manual mode, time in/above/below range, bolus information, insulin use, average sensor blood glucose, average meter blood glucose, pump settings), weight, body mass index (BMI), glucose meter information, history of hypoglycemia unawareness.
The primary outcome for this study was safety as assessed by percentage of time below target range on glucose sensor (time below target range is defined as < 70 mg/dL). We also addressed the secondary endpoint of efficacy as the percentage of time in-range defined as blood glucose per glucose sensor of 70 mg/dL to 180 mg/dL (efficacy), percentage of glucose sensor wear, and HbA1c.
Statistics
Comparisons of changes in continuous variables between groups were performed by an analysis of covariance (ANCOVA), adjusting for baseline levels. Fisher exact test (χ2) and unpaired t test were used to compare group differences at baseline for categorical and continuous variables, respectively, while Wilcoxon rank sum test was used for nonnormally distributed values. Changes in continuous measures within the same group were tested by paired t test or Wilcoxon matched-pairs signed rank test when applicable. Analyses were performed using Stata 11.0.
Results
Thirty-seven veterans with T1DM using AIPs in 2018 were evaluated at baseline and at follow up visits (Tables 1 and 2). Time frame for follow-up was approximately 3 months, although there was some variation. Of note, the mean weight and BMI corresponded to mostly lean individuals, consistent with the diagnosis of T1DM.
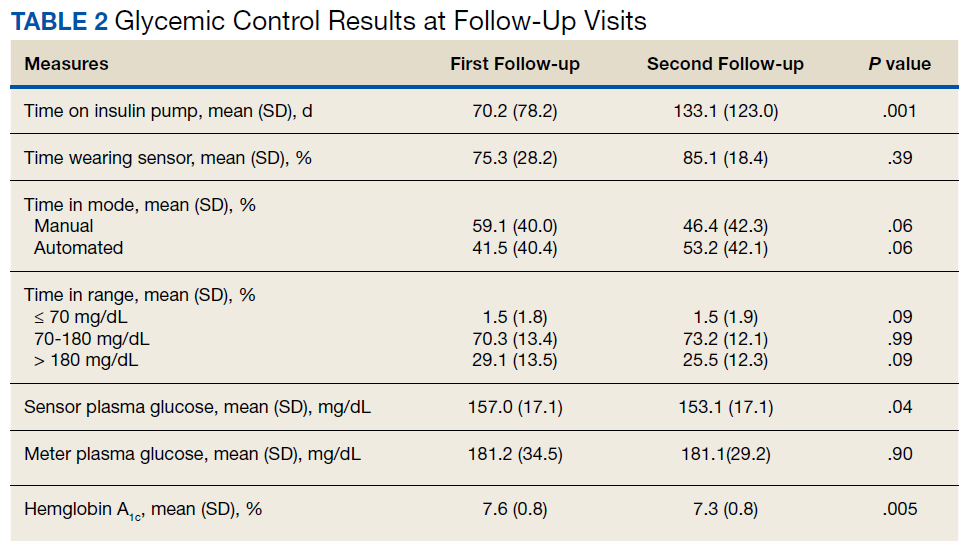
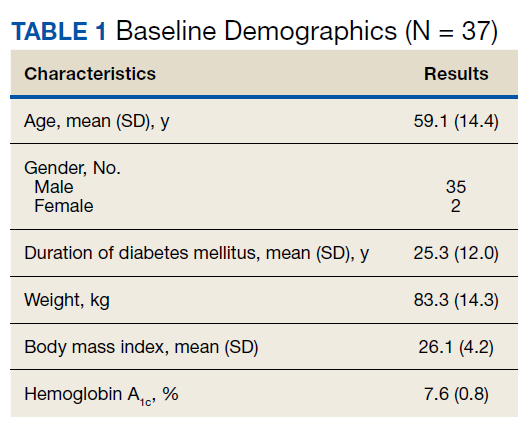
Time below target range hypoglycemia (sensor glucose < 70 mg/dL) remained low at each follow-up visit (both 1.5%). Percentage of time in automated mode increased from first to second follow-up visit after initiation of AIP (41% vs 53%, P = .06). Percentage of sensor wear numerically increased from first to second follow-up visit (75% vs 85%, P = .39), same as time in range, defined as sensor glucose 70 to 180 mg/dL, from first to second follow-up visit (70% vs 73%, P = .09). Time above range, defined as sensor glucose > 180 mg/dL, demonstrated a strong trend toward decreasing between follow-up appointments (29% to 25%; P = .09). HbA1c decreased from 7.6% to 7.3% (P = .005).
About half of the patients (18 of 37) reported hypoglycemia unawareness before the initiation of the 670G AIP. On follow-up visit 61% (11 of 18) reported significant improvement in awareness. Of the remaining 18 patients who reported normal awareness before automated mode, 17% (3 of 18) described a new onset unawareness.
Discussion
This study evaluated the safety of adopting a new DM technology in the real world of an outpatient VA clinic. To the best of our knowledge, this is the first study evaluating the use of AIP specifically in a population of middle-aged veterans with longstanding T1DM. After a mean 7 months of follow-up, participants accepted AIP use as evidenced by increased sensor wear over time and experienced improvements in DM measures that indicate successful use (ie, time in automated mode, which represents reduced glycemic variability). These results show success of an AIP approach in a demographically older group of patients.
AIP has been shown to have positive effects on glycemic control such as time in target glucose range (goal ≥ 70%). In our relatively small pilot study, there was trend for an improvement in the time in range from the first to second clinical follow-up visit, suggesting true patient involvement with the use of the device. Studies involving overall younger cohorts have proved that AIP technology is safe and efficacious for outpatient management of T1DM.7,10,12,13 However, they were all conducted under the safety of a research setting, and trials enrolled a younger population believed to adapt with more ease to this new technology. Tauschmann and colleagues performed a multicenter, parallel randomized controlled trial that compared hybrid closed-loop AIP therapy with sensor-augmented pump therapy in patients with suboptimal T1DM control.12 Results showed that the hybrid closed-loop system increased the time that the glucose concentration was within the target range (70-180 mg/dL) from 54% in the sensor-augmented pump group to 65% on the closed-loop system (P < .001). A small but significant improvement in HBA1c (from 8.0 -7.4%) and low rates of hypoglycemia (2.6% of time below 70 mg/dL) were also noted.12
A similar benefit was observed in a 2019 landmark study by Brown and colleagues of 168 patients with T1DM at 7 university medical centers who were treated for 6 months with either a closed-loop system (closed-loop group) or a sensor-augmented pump (control group) in a parallel-group, unblinded, randomized trial study.13 Mean (SD) time in the target range increased in the closed-loop group from 61% (17) at baseline to 71% (12) during the 6 months. HbA1c decreased from 7.4 to 7.1% and time ≤ 70 mg/dL was just 1.6%. However, only 13% of patients were aged ≥ 40 years in the study by Tauschmann and colleagues, and mean age was 33 years in the Brown and colleagues study.12,13 In contrast, the mean (SD) age in our study was 59 (14) years. Our pilot study also showed comparable, or somewhat better results, as mean time in target range was 72%, HbA1c was 7.3%, and time ≤ 70 mg/dL was just 1.5%.
In the only other single-center study in adults with T1DM (mean age 45 years), Faulds and colleagues evaluated changes in glycemic control and adherence in patient using the same hybrid closed-loop system.14 Treatment resulted in a decrease in HbA1c compared with baseline similar to our study, most notably for patients who had higher baseline HbA1c. However, over its short duration (6 to 12 weeks), there was decreased time in automated mode in study patients, likely due to treatment burden. Our study in older patients showed a similar reduction in HbA1c from baseline up to the 7-month visit but with increased sensor wear and time in automated mode.
There are many possible reasons for improved time in target range in our older population. Contrary to common belief that older age may be a barrier to adopting complex technology, it is likely that older age and longer duration of DM motivates adherence to a therapy that reduces glucose swings, offers a greater sense of safety and control, and improves quality of life. This is underscored by improvements over time in sensor wear and time in automated mode, measures of adherence, and successful AIP management. In support of a motivation factor to adopt insulin pump therapy in patients with long-standing T1DM, Faulds and colleagues found that older age and higher baseline HbA1c were associated with less time spent in hypoglycemia.14
The close supervision of patients by a certified diabetes educator and pump trainer may have helped improve glycemic control. Veterans received initial training, weekly follow-ups for 4 to 5 visits, and then bimonthly visits. There was also good access to the DM care team through a secure VA messaging system. This allowed for prompt troubleshooting and gave veterans the support they needed for the successful technology adoption.
The use of real-time CGM led to improvements in hypoglycemia unawareness. The nature of automated insulin delivery not only allows the patient to use a immediate CGM, but automatically lowers the delivery of insulin, further minimizing the risk of hypoglycemia.15 This combined approach explains the improvement in self-reported hypoglycemia unawareness in our cohort which decreased by 61%. As in our study, very recently Pratley and colleagues reported in a 6-month follow-up study that the greatest benefit of CGM was not the -0.3% improvement of glycemic control (similar in magnitude to our study) but the 47% decrease in the primary outcome of CGM-measured time in hypoglycemia.16
Hybrid closed-loop insulin delivery improves glucose control while reducing the risk of hypoglycemia. There is consensus that this approach is cost-effective and saves resources in the management of these complex patients, so prone to severe microvascular complications and hypoglycemia.17,18 A recent analysis by Pease and colleagues concluded that the hybrid closed-loop system was safer and more cost-effective when compared with the current standard of care, comprising insulin injections and capillary glucose testing.19 This held true even after several sensitivity analyses were performed, including baseline glycemic control, treatment effects, technology costs, age, and time horizon. This is relevant to the VHA, which at all times must consider the most cost-effective approach. Therefore, while there is no such debate about the cost-effectiveness of AIP technology for younger adults with T1DM, this study closes the knowledge gap for middle-aged veterans.7,10,12,13 The current study demonstrates that even for older patients with long-standing T1DM, when proper access to supplies and support services are made available, treatment is associated with considerable success.
Finally, AIP is well suited for telehealth applications. Data can be uploaded remotely and sent to VA health care providers, which can facilitate care without the need to travel. Distance is often a barrier for access and optimal care of veterans. The current COVID-19 pandemic is another barrier to access that may persist in the near future and adds value to AIP management.
There were a few challenges with use of AIP. Although transition to AIP was smooth for most patients already on insulin pump therapy, several noted requests for calibration in the middle of the night in automated mode, which affected sleep. Also, AIP technology requires some computer literacy to navigate the menu and address sensor calibrations, which can be a challenge for some. Based on our results, we would recommend AIP in veterans who are appropriately trained in carbohydrate counting, understand the principles of insulin therapy, and are able to navigate a computer screen menu. Most T1DM patients already using insulin pump meet those recommendations, thus, they are good candidates.
Limitations
There are some limitations to our study. The small sample size and single-center nature prevent generalization. Also, the veteran population cannot be extrapolated to other populations. For instance, the majority of the patients in this study were male.
Conclusions
We report that an AIP approach for patients with long-standing T1DM is well accepted and engages patients into monitoring their blood sugars and achieving better glycemic control. This was achieved with minimal hypoglycemia in a population where often hypoglycemia unawareness makes DM care a challenge. Future studies within the VHA are needed to fully assess the long-term benefits and cost-effectiveness of this technology in veterans.
1. Saunders A, Messer LH, Forlenza GP. MiniMed 670G hybrid closed loop artificial pancreas system for the treatment of type 1 diabetes mellitus: overview of its safety and efficacy. Expert Rev Med Devices. 2019;16(10):845-853. doi:10.1080/17434440.2019.1670639
2. Beato-Víbora PI, Quirós-López C, Lázaro-Martín L, et al. Impact of sensor-augmented pump therapy with predictive low-glucose suspend function on glycemic control and patient satisfaction in adults and children with type 1 diabetes. Diabetes Technol Ther. 2018;20(11):738-743. doi:10.1089/dia.2018.0199
3. De Ridder F, den Brinker M, De Block C. The road from intermittently scanned continuous glucose monitoring to hybrid closed-loop systems. Part B: results from randomized controlled trials. Ther Adv Endocrinol Metab. 2019;10:2042018819871903. Published 2019 Aug 30. doi:10.1177/2042018819871903
4. Monnier L, Colette C, Wojtusciszyn A, et al. Toward defining the threshold between low and high glucose variability in dabetes. Diabetes Care. 2017;40(7):832-838. doi:10.2337/dc16-1769
5. Monnier L, Colette C, Owens DR. The application of simple metrics in the assessment of glycaemic variability. Diabetes Metab. 2018;44(4):313-319. doi:10.1016/j.diabet.2018.02.008
6. Thabit H, Hovorka R. Coming of age: the artificial pancreas for type 1 diabetes. Diabetologia. 2016;59(9):1795-1805. doi:10.1007/s00125-016-4022-4
7. Anderson SM, Buckingham BA, Breton MD, et al. Hybrid closed-loop control is safe and effective for people with type 1 diabetes who are at moderate to high risk for hypoglycemia. Diabetes Technol Ther. 2019;21(6):356-363. doi:10.1089/dia.2019.0018
8. Liu J, Wang R, Ganz ML, Paprocki Y, Schneider D, Weatherall J. The burden of severe hypoglycemia in type 1 diabetes. Curr Med Res Opin. 2018;34(1):171-177. doi:10.1080/03007995.2017.1391079
9. Rawshani A, Sattar N, Franzén S, et al. Excess mortality and cardiovascular disease in young adults with type 1 diabetes in relation to age at onset: a nationwide, register-based cohort study. Lancet. 2018;392(10146):477-486. doi:10.1016/S0140-6736(18)31506-X
10. Bergenstal RM, Garg S, Weinzimer SA, et al. Safety of a hybrid closed-loop insulin delivery system in patients with type 1 diabetes. JAMA. 2016;316(13):1407-1408. doi:10.1001/jama.2016.11708
11. Little SA, Speight J, Leelarathna L, et al. Sustained reduction in severe hypoglycemia in adults with type 1 diabetes complicated by impaired awareness of hypoglycemia: two-year follow-up in the HypoCOMPaSS randomized clinical trial. Diabetes Care. 2018;41(8):1600-1607. doi:10.2337/dc17-2682
12. Tauschmann M, Thabit H, Bally L, et al. Closed-loop insulin delivery in suboptimally controlled type 1 diabetes: a multicentre, 12-week randomised trial [published correction appears in Lancet. 2018 Oct 13;392(10155):1310]. Lancet. 2018;392(10155):1321-1329. doi:10.1016/S0140-6736(18)31947-0
13. Brown SA, Kovatchev BP, Raghinaru D, et al. Six-month randomized, multicenter trial of closed-loop control in type 1 diabetes. N Engl J Med. 2019;381(18):1707-1717. doi:10.1056/NEJMoa1907863
14. Faulds ER, Zappe J, Dungan KM. Real-world implications of hybrid close loop (HCL) insulin delivery system. Endocr Pract. 2019;25(5):477-484. doi:10.4158/EP-2018-0515
15. Rickels MR, Peleckis AJ, Dalton-Bakes C, et al. Continuous glucose monitoring for hypoglycemia avoidance and glucose counterregulation in long-standing type 1 diabetes. J Clin Endocrinol Metab. 2018;103(1):105-114. doi:10.1210/jc.2017-01516
16. Pratley RE, Kanapka LG, Rickels MR, et al. Effect of continuous glucose monitoring on hypoglycemia in older adults with type 1 diabetes: a randomized clinical trial. JAMA. 2020;323(23):2397-2406. doi:10.1001/jama.2020.6928
17. Bekiari E, Kitsios K, Thabit H, et al. Artificial pancreas treatment for outpatients with type 1 diabetes: systematic review and meta-analysis. BMJ. 2018;361:k1310. Published 2018 Apr 18. doi:10.1136/bmj.k1310
18. American Diabetes Association. Addendum. 7. Diabetes technology: standards of medical care in diabetes-2020. Diabetes Care. 2020;43(suppl 1):S77-S88. Diabetes Care. 2020;43(8):1981. doi:10.2337/dc20-ad08c
19. Pease A, Zomer E, Liew D, et al. Cost-effectiveness analysis of a hybrid closed-loop system versus multiple daily injections and capillary glucose testing for adults with type 1 dabetes. Diabetes Technol Ther. 2020;22(11):812-821. doi:10.1089/dia.2020.0064
Insulin pump technology has been available since the 1970s. Innovation in insulin pumps has had significant impact on the management of diabetes mellitus (DM). In recent years, automated insulin pump technology (AIP) has proven to be a safe and effective way to treat DM. It has been studied mostly in highly organized randomized controlled trials (RCTs) in younger populations with type 1 DM (T1DM).1-3
One of the challenges in DM care has always been the wide variations in daily plasma glucose concentration that often cause major swings of hyperglycemia and hypoglycemia. Extreme variations in blood glucose have also been linked to adverse outcomes, including poor micro- and macrovascular outcomes.4,5 AIP technology is a hybrid closed-loop system that attempts to solve this problem by adjusting insulin delivery in response to real-time glucose information from a continuous glucose monitor (CGM). Glucose measurements are sent to the insulin pump in real time, which uses a specialized algorithm to determine whether insulin delivery should be up-titrated, down-titrated, or suspended.6
Several studies have shown that AIP technology reduces glucose variability and increases the percentage of time within the optimal glucose range.1-3,7 Its safety is especially indicated for patients with long-standing DM who often have hypoglycemia unawareness and recurrent episodes of hypoglycemia.7 Safety is the major advantage of the hybrid closed-loop system as long duration of DM makes patients particularly prone to emergency department (ED) visits and hospitalizations for severe hypoglycemia.8 Recurrent hypoglycemia also is associated with increased cardiovascular mortality in epidemiologic studies.9
Safety was the primary endpoint in the pivotal trial in a multicenter clinical study where 124 participants (mean age, 37.8 years; DM duration, 21.7 years; hemoglobin A1c [HbA1c], 7.4%) were monitored for 3 months while using a hybrid closed-loop pump, similar to the one used in our study.10 Remarkably, there were no device-related episodes of severe hypoglycemia or ketoacidosis. There was even a small but significant difference in HbA1c (7.4% at baseline, 6.9% at 3 months) and of the time in target range measured by CGM from 66.7% at baseline to 72.2% at 3 months). However, the mean age of the population studied was young (mean age, 37.8 years). It is unclear how these results would translate for a population of older patients with T1DM. Moreover, use of AIP systems have not been systematically tested outside of carefully controlled studies, as it would be in middle-aged veterans followed in outpatient US Department of Veterans Affairs (VA) clinics. Such an approach in the context of optimal glucose monitoring combined with use of structured DM education can significantly reduce impaired awareness of hypoglycemia in patients with T1DM of long duration.11
This is the first study to assess the feasibility of AIP technology in a real-world population of older veterans with T1DM in terms of safety and acceptability, because AIP has just recently become available for patient care in the Veterans Health Administration (VHA). This group of patients is of particular interest because they have been largely overlooked in earlier studies. They represent an older population with long-standing DM where hypoglycemia unawareness is often recurrent and incapacitating. In addition, long-standing DM makes optimal glycemic control mandatory to prevent microvascular complications.
Methods
In this retrospective review study,, we examined available data in patients with T1DM at the Malcom Randall VA Medical Center diabetes clinic in Gainesville, Florida, between March and December of 2018 who agreed to use AIP. In this clinic, the AIP system was offered to T1DM patients when the 4-year warranty of a previous insulin pump expired, they had frequent hypoglycemic events, or they were on multiple daily injections and were proficient with carbohydrate counting and adjusting insulin doses and willing to use an insulin pump. Veterans were trained on AIP use by a certified diabetes educator and pump trainer in sessions that lasted 2 to 4 hours depending on previous experience with AIP. Institutional review board approval was obtained at the University of Florida.
Demographic and clinical data before and after the initiation of AIP were collected, including standard insulin pump/CGM information for the Medtronic 670G and Guardian 3 Sensor AIPs. Several variables were evaluated, including age, gender, year of DM diagnosis, time of initiation of AIP, HbA1c, download data (percentage sensor wear, time in automated mode and manual mode, time in/above/below range, bolus information, insulin use, average sensor blood glucose, average meter blood glucose, pump settings), weight, body mass index (BMI), glucose meter information, history of hypoglycemia unawareness.
The primary outcome for this study was safety as assessed by percentage of time below target range on glucose sensor (time below target range is defined as < 70 mg/dL). We also addressed the secondary endpoint of efficacy as the percentage of time in-range defined as blood glucose per glucose sensor of 70 mg/dL to 180 mg/dL (efficacy), percentage of glucose sensor wear, and HbA1c.
Statistics
Comparisons of changes in continuous variables between groups were performed by an analysis of covariance (ANCOVA), adjusting for baseline levels. Fisher exact test (χ2) and unpaired t test were used to compare group differences at baseline for categorical and continuous variables, respectively, while Wilcoxon rank sum test was used for nonnormally distributed values. Changes in continuous measures within the same group were tested by paired t test or Wilcoxon matched-pairs signed rank test when applicable. Analyses were performed using Stata 11.0.
Results
Thirty-seven veterans with T1DM using AIPs in 2018 were evaluated at baseline and at follow up visits (Tables 1 and 2). Time frame for follow-up was approximately 3 months, although there was some variation. Of note, the mean weight and BMI corresponded to mostly lean individuals, consistent with the diagnosis of T1DM.
Time below target range hypoglycemia (sensor glucose < 70 mg/dL) remained low at each follow-up visit (both 1.5%). Percentage of time in automated mode increased from first to second follow-up visit after initiation of AIP (41% vs 53%, P = .06). Percentage of sensor wear numerically increased from first to second follow-up visit (75% vs 85%, P = .39), same as time in range, defined as sensor glucose 70 to 180 mg/dL, from first to second follow-up visit (70% vs 73%, P = .09). Time above range, defined as sensor glucose > 180 mg/dL, demonstrated a strong trend toward decreasing between follow-up appointments (29% to 25%; P = .09). HbA1c decreased from 7.6% to 7.3% (P = .005).
About half of the patients (18 of 37) reported hypoglycemia unawareness before the initiation of the 670G AIP. On follow-up visit 61% (11 of 18) reported significant improvement in awareness. Of the remaining 18 patients who reported normal awareness before automated mode, 17% (3 of 18) described a new onset unawareness.
Discussion
This study evaluated the safety of adopting a new DM technology in the real world of an outpatient VA clinic. To the best of our knowledge, this is the first study evaluating the use of AIP specifically in a population of middle-aged veterans with longstanding T1DM. After a mean 7 months of follow-up, participants accepted AIP use as evidenced by increased sensor wear over time and experienced improvements in DM measures that indicate successful use (ie, time in automated mode, which represents reduced glycemic variability). These results show success of an AIP approach in a demographically older group of patients.
AIP has been shown to have positive effects on glycemic control such as time in target glucose range (goal ≥ 70%). In our relatively small pilot study, there was trend for an improvement in the time in range from the first to second clinical follow-up visit, suggesting true patient involvement with the use of the device. Studies involving overall younger cohorts have proved that AIP technology is safe and efficacious for outpatient management of T1DM.7,10,12,13 However, they were all conducted under the safety of a research setting, and trials enrolled a younger population believed to adapt with more ease to this new technology. Tauschmann and colleagues performed a multicenter, parallel randomized controlled trial that compared hybrid closed-loop AIP therapy with sensor-augmented pump therapy in patients with suboptimal T1DM control.12 Results showed that the hybrid closed-loop system increased the time that the glucose concentration was within the target range (70-180 mg/dL) from 54% in the sensor-augmented pump group to 65% on the closed-loop system (P < .001). A small but significant improvement in HBA1c (from 8.0 -7.4%) and low rates of hypoglycemia (2.6% of time below 70 mg/dL) were also noted.12
A similar benefit was observed in a 2019 landmark study by Brown and colleagues of 168 patients with T1DM at 7 university medical centers who were treated for 6 months with either a closed-loop system (closed-loop group) or a sensor-augmented pump (control group) in a parallel-group, unblinded, randomized trial study.13 Mean (SD) time in the target range increased in the closed-loop group from 61% (17) at baseline to 71% (12) during the 6 months. HbA1c decreased from 7.4 to 7.1% and time ≤ 70 mg/dL was just 1.6%. However, only 13% of patients were aged ≥ 40 years in the study by Tauschmann and colleagues, and mean age was 33 years in the Brown and colleagues study.12,13 In contrast, the mean (SD) age in our study was 59 (14) years. Our pilot study also showed comparable, or somewhat better results, as mean time in target range was 72%, HbA1c was 7.3%, and time ≤ 70 mg/dL was just 1.5%.
In the only other single-center study in adults with T1DM (mean age 45 years), Faulds and colleagues evaluated changes in glycemic control and adherence in patient using the same hybrid closed-loop system.14 Treatment resulted in a decrease in HbA1c compared with baseline similar to our study, most notably for patients who had higher baseline HbA1c. However, over its short duration (6 to 12 weeks), there was decreased time in automated mode in study patients, likely due to treatment burden. Our study in older patients showed a similar reduction in HbA1c from baseline up to the 7-month visit but with increased sensor wear and time in automated mode.
There are many possible reasons for improved time in target range in our older population. Contrary to common belief that older age may be a barrier to adopting complex technology, it is likely that older age and longer duration of DM motivates adherence to a therapy that reduces glucose swings, offers a greater sense of safety and control, and improves quality of life. This is underscored by improvements over time in sensor wear and time in automated mode, measures of adherence, and successful AIP management. In support of a motivation factor to adopt insulin pump therapy in patients with long-standing T1DM, Faulds and colleagues found that older age and higher baseline HbA1c were associated with less time spent in hypoglycemia.14
The close supervision of patients by a certified diabetes educator and pump trainer may have helped improve glycemic control. Veterans received initial training, weekly follow-ups for 4 to 5 visits, and then bimonthly visits. There was also good access to the DM care team through a secure VA messaging system. This allowed for prompt troubleshooting and gave veterans the support they needed for the successful technology adoption.
The use of real-time CGM led to improvements in hypoglycemia unawareness. The nature of automated insulin delivery not only allows the patient to use a immediate CGM, but automatically lowers the delivery of insulin, further minimizing the risk of hypoglycemia.15 This combined approach explains the improvement in self-reported hypoglycemia unawareness in our cohort which decreased by 61%. As in our study, very recently Pratley and colleagues reported in a 6-month follow-up study that the greatest benefit of CGM was not the -0.3% improvement of glycemic control (similar in magnitude to our study) but the 47% decrease in the primary outcome of CGM-measured time in hypoglycemia.16
Hybrid closed-loop insulin delivery improves glucose control while reducing the risk of hypoglycemia. There is consensus that this approach is cost-effective and saves resources in the management of these complex patients, so prone to severe microvascular complications and hypoglycemia.17,18 A recent analysis by Pease and colleagues concluded that the hybrid closed-loop system was safer and more cost-effective when compared with the current standard of care, comprising insulin injections and capillary glucose testing.19 This held true even after several sensitivity analyses were performed, including baseline glycemic control, treatment effects, technology costs, age, and time horizon. This is relevant to the VHA, which at all times must consider the most cost-effective approach. Therefore, while there is no such debate about the cost-effectiveness of AIP technology for younger adults with T1DM, this study closes the knowledge gap for middle-aged veterans.7,10,12,13 The current study demonstrates that even for older patients with long-standing T1DM, when proper access to supplies and support services are made available, treatment is associated with considerable success.
Finally, AIP is well suited for telehealth applications. Data can be uploaded remotely and sent to VA health care providers, which can facilitate care without the need to travel. Distance is often a barrier for access and optimal care of veterans. The current COVID-19 pandemic is another barrier to access that may persist in the near future and adds value to AIP management.
There were a few challenges with use of AIP. Although transition to AIP was smooth for most patients already on insulin pump therapy, several noted requests for calibration in the middle of the night in automated mode, which affected sleep. Also, AIP technology requires some computer literacy to navigate the menu and address sensor calibrations, which can be a challenge for some. Based on our results, we would recommend AIP in veterans who are appropriately trained in carbohydrate counting, understand the principles of insulin therapy, and are able to navigate a computer screen menu. Most T1DM patients already using insulin pump meet those recommendations, thus, they are good candidates.
Limitations
There are some limitations to our study. The small sample size and single-center nature prevent generalization. Also, the veteran population cannot be extrapolated to other populations. For instance, the majority of the patients in this study were male.
Conclusions
We report that an AIP approach for patients with long-standing T1DM is well accepted and engages patients into monitoring their blood sugars and achieving better glycemic control. This was achieved with minimal hypoglycemia in a population where often hypoglycemia unawareness makes DM care a challenge. Future studies within the VHA are needed to fully assess the long-term benefits and cost-effectiveness of this technology in veterans.
1. Saunders A, Messer LH, Forlenza GP. MiniMed 670G hybrid closed loop artificial pancreas system for the treatment of type 1 diabetes mellitus: overview of its safety and efficacy. Expert Rev Med Devices. 2019;16(10):845-853. doi:10.1080/17434440.2019.1670639
2. Beato-Víbora PI, Quirós-López C, Lázaro-Martín L, et al. Impact of sensor-augmented pump therapy with predictive low-glucose suspend function on glycemic control and patient satisfaction in adults and children with type 1 diabetes. Diabetes Technol Ther. 2018;20(11):738-743. doi:10.1089/dia.2018.0199
3. De Ridder F, den Brinker M, De Block C. The road from intermittently scanned continuous glucose monitoring to hybrid closed-loop systems. Part B: results from randomized controlled trials. Ther Adv Endocrinol Metab. 2019;10:2042018819871903. Published 2019 Aug 30. doi:10.1177/2042018819871903
4. Monnier L, Colette C, Wojtusciszyn A, et al. Toward defining the threshold between low and high glucose variability in dabetes. Diabetes Care. 2017;40(7):832-838. doi:10.2337/dc16-1769
5. Monnier L, Colette C, Owens DR. The application of simple metrics in the assessment of glycaemic variability. Diabetes Metab. 2018;44(4):313-319. doi:10.1016/j.diabet.2018.02.008
6. Thabit H, Hovorka R. Coming of age: the artificial pancreas for type 1 diabetes. Diabetologia. 2016;59(9):1795-1805. doi:10.1007/s00125-016-4022-4
7. Anderson SM, Buckingham BA, Breton MD, et al. Hybrid closed-loop control is safe and effective for people with type 1 diabetes who are at moderate to high risk for hypoglycemia. Diabetes Technol Ther. 2019;21(6):356-363. doi:10.1089/dia.2019.0018
8. Liu J, Wang R, Ganz ML, Paprocki Y, Schneider D, Weatherall J. The burden of severe hypoglycemia in type 1 diabetes. Curr Med Res Opin. 2018;34(1):171-177. doi:10.1080/03007995.2017.1391079
9. Rawshani A, Sattar N, Franzén S, et al. Excess mortality and cardiovascular disease in young adults with type 1 diabetes in relation to age at onset: a nationwide, register-based cohort study. Lancet. 2018;392(10146):477-486. doi:10.1016/S0140-6736(18)31506-X
10. Bergenstal RM, Garg S, Weinzimer SA, et al. Safety of a hybrid closed-loop insulin delivery system in patients with type 1 diabetes. JAMA. 2016;316(13):1407-1408. doi:10.1001/jama.2016.11708
11. Little SA, Speight J, Leelarathna L, et al. Sustained reduction in severe hypoglycemia in adults with type 1 diabetes complicated by impaired awareness of hypoglycemia: two-year follow-up in the HypoCOMPaSS randomized clinical trial. Diabetes Care. 2018;41(8):1600-1607. doi:10.2337/dc17-2682
12. Tauschmann M, Thabit H, Bally L, et al. Closed-loop insulin delivery in suboptimally controlled type 1 diabetes: a multicentre, 12-week randomised trial [published correction appears in Lancet. 2018 Oct 13;392(10155):1310]. Lancet. 2018;392(10155):1321-1329. doi:10.1016/S0140-6736(18)31947-0
13. Brown SA, Kovatchev BP, Raghinaru D, et al. Six-month randomized, multicenter trial of closed-loop control in type 1 diabetes. N Engl J Med. 2019;381(18):1707-1717. doi:10.1056/NEJMoa1907863
14. Faulds ER, Zappe J, Dungan KM. Real-world implications of hybrid close loop (HCL) insulin delivery system. Endocr Pract. 2019;25(5):477-484. doi:10.4158/EP-2018-0515
15. Rickels MR, Peleckis AJ, Dalton-Bakes C, et al. Continuous glucose monitoring for hypoglycemia avoidance and glucose counterregulation in long-standing type 1 diabetes. J Clin Endocrinol Metab. 2018;103(1):105-114. doi:10.1210/jc.2017-01516
16. Pratley RE, Kanapka LG, Rickels MR, et al. Effect of continuous glucose monitoring on hypoglycemia in older adults with type 1 diabetes: a randomized clinical trial. JAMA. 2020;323(23):2397-2406. doi:10.1001/jama.2020.6928
17. Bekiari E, Kitsios K, Thabit H, et al. Artificial pancreas treatment for outpatients with type 1 diabetes: systematic review and meta-analysis. BMJ. 2018;361:k1310. Published 2018 Apr 18. doi:10.1136/bmj.k1310
18. American Diabetes Association. Addendum. 7. Diabetes technology: standards of medical care in diabetes-2020. Diabetes Care. 2020;43(suppl 1):S77-S88. Diabetes Care. 2020;43(8):1981. doi:10.2337/dc20-ad08c
19. Pease A, Zomer E, Liew D, et al. Cost-effectiveness analysis of a hybrid closed-loop system versus multiple daily injections and capillary glucose testing for adults with type 1 dabetes. Diabetes Technol Ther. 2020;22(11):812-821. doi:10.1089/dia.2020.0064
Impact of Diagnostic Testing on Pediatric Patients With Pharyngitis: Evidence From a Large Health Plan
From the Department of Pharmaceutical and Health Economics, University of Southern California, Los Angeles, CA, (Drs. Sangha and McCombs), Department of Pediatrics, Keck School of Medicine, and Department of Clinical Pharmacy, School of Pharmacy, University of Southern California, Los Angeles, CA, (Dr. Steinberg), and Leonard Schaeffer Center for Health Policy and Economics, University of Southern California, Los Angeles, CA (Dr. McCombs).
Objective: The recommended treatment for children and adolescents under 18 years of age who have a positive test for group A Streptococcus (GAS) are antibiotics using the “test and treat” strategy to detect and treat GAS for pediatric pharyngitis. This study used paid claims data to document the extent to which real-world treatment patterns are consistent with these recommendations. We document the factors correlated with testing and treatment, then examine the effects of receiving a GAS test and being treated with an antibiotic impact the likelihood of a revisit for an acute respiratory tract infection within 28 days.
Methods: This retrospective cohort study used Optum Insight Clinformatics data for medical and pharmacy claims from 2011-2013 to identify episodes of care for children and adolescents with pharyngitis around their index visit (± 6 months). The sample population included children and adolescents under 18 years of age with a diagnosis of pharyngitis. Multivariable logistic regression analyses were used to document factors associated with receipt of GAS test and antibiotic treatment. Next, we used logistic regression models to estimate the impact of test and treat recommendation on revisit risk.
Results: There were 24 685 treatment episodes for children and adolescents diagnosed with pharyngitis. Nearly 47% of these episodes included a GAS test and 48% of tested patients were prescribed an antibiotic prescription. Failing to perform a GAS test increased the risk of a revisit within 28 days by 44%. The use of antibiotics by tested and untested patients had no impact on revisit risk.
Conclusion: While the judicious use of antibiotics is important in managing pharyngitis infections and managing complications, the use of rapid diagnostic tools was found to be the determining factor in reducing revisits for pediatric patients with pharyngitis.
Keywords: pediatrics; pharyngitis; respiratory infections; acute infections; diagnostic tests; group A Streptococcus; antibiotics; revisits.
Acute pharyngitis is a common acute respiratory tract infection (ARTI) in children. Group A β-hemolytic streptococci (GABHS) is the most common bacterial etiology for pediatric pharyngitis, accounting for 15% to 30% of cases.1
Beyond clinical assessment, laboratory diagnostic testing generally plays a limited role in guiding appropriate antibiotic prescribing for patients with an ARTI.2,3 Most diagnostic tests require 2 or 3 days to result, incur additional costs, and may delay treatment.4 While these tests do not provide clear and timely guidance on which specific antibiotic is appropriate for ARTI patients, this is not the case for patients with pharyngitis.5,6,7 A rapid diagnostic test exists to identify pharyngitis patients with GABHS which accounts for 1 in 4 children with acute sore throat.1,4,6 Both the American Academy of Pediatrics and the Infectious Diseases Society of America recommend antibiotic treatment for children and adolescents under 18 years of age who have a positive test for group A Streptococcus (GAS).8,9 This “test and treat” protocol has been consistently included in the Healthcare Effectiveness Data and Information Set (HEDIS) standards over time for pediatric pharyngitis patients aged 3 to 18 years before dispensing an antibiotic.10
Sinusitis, pneumonia, and acute otitis media are considered ARTIs where antibiotic treatment is justified. Therefore, pharyngitis of unclear etiology seen with these comorbid infections may not always undergo GAS testing but move directly to the patient being prescribed antibiotics. This analysis enumerates ARTI-related comorbidities present together with the initial coded pharyngitis diagnosis to evaluate their impact on the provider’s decision to test and treat, and on revisit risk.
Antibiotic treatment for GAS patients is likely to eradicate the acute GABHS infection within 10 days. Penicillin and amoxicillin are commonly recommended because of their narrow spectrum of activity, few adverse effects, established efficacy, and modest cost. Alternative antibiotics for patients with penicillin allergy, or with polymicrobial infection seen on culture results, include a first-generation cephalosporin, clindamycin, clarithromycin (Biaxin), or azithromycin (Zithromax).1,8,11 However, while compliance with these HEDIS guidelines has been evaluated, the outcome effects of following the HEDIS “test and treat” recommendations for children with pharyngitis have not been adequately evaluated.
These outcome evaluations have increasing importance as the latest HEDIS survey has shown testing rates in commercial Preferred Provider Organizations (PPO) falling from 86.4% in 2018 to 75.9% in 2019, the lowest rate of testing since 2009, with similar reductions under 80% for Health Maintenance Organizations (HMO).10 While health plans may execute cost-benefit analyses and algorithms to forge best practices for GAS testing in children and adolescents presenting with symptoms of pharyngitis, it is important to regard the wasteful resource utilization and additional cost of revisits that may offset any gains accrued by more focused GAS testing outside the existing clinical guidelines and HEDIS measures. This may be of particular importance in documenting infection and sparing antibiotic therapy in toddlers and younger.
The objective of this study was to investigate the correlation between testing and antibiotic use on the likelihood of a revisit for an acute respiratory tract infection within 28 days. To achieve this objective, this investigation consists of 3 sequential analyses. First, we document the factors associated with the decision to test the patient for a GABHS infection using the GAS test. Next, we document the factors associated with the decision to use an antibiotic to treat the patient as a function of having tested the patient. Finally, we investigate the impact of the testing and treatment decisions on the likelihood of a revisit within 28 days.
Methods
Study design
This was a retrospective cohort study of episodes of treatment for pediatric patients with pharyngitis. Episodes were identified using data derived from the Optum Insight Clinformatics claims database provided to the University of Southern California to facilitate the training of graduate students. These data cover commercially insured patients with both medical and pharmacy benefits. Data were retrieved from the 3-year period spanning 2011-2013. An episode of care was identified based on date of the first (index) outpatient visit for a pharyngitis diagnosis (International Classification of Diseases, Ninth Revision [ICD-9]: 462, 463, 034.0). Outpatient visits were defined by visit setting: ambulatory clinics, physician offices, emergency rooms, and urgent care facilities. Each pharyngitis treatment episode was then screened for at least a 6-month enrollment in a health insurance plan prior and subsequent to the index visit using Optum enrollment data. Finally, eligible treatment episodes were restricted to children and adolescents under 18 years of age, who had an index outpatient visit for a primary diagnosis of acute pharyngitis.
A diagnostic profile was created for each episode using the diagnoses recorded for the index visit. Up to 3 diagnoses may be recorded for any outpatient visit and the first recorded diagnosis was assumed to be the primary diagnosis for that episode. Any secondary diagnoses recorded on the index visit were used to define comorbidities present at the index visit. ARTI-related comorbidities included: acute otitis media (AOM), bronchitis, sinusitis, pneumonia, and upper respiratory infection (URI). Other comorbid medical diagnoses were documented using diagnostic data from the pre-index period. Dichotomous variables for the following categories were created: mental disorders, nervous system disorders, respiratory symptoms, fever, injury and poisoning, other, or no diseases.
Prior visits for other respiratory infections in the previous 90 days were also identified for patients based on their index visit for pharyngitis. Similarly, any subsequent visits, within 28 days of the index visit, were also recorded to measure the health outcome for analysis. Practice settings include physician offices and federally qualified health centers, state and local health clinics, outpatient hospitals facilities, emergency departments, and other outpatient settings such as walk-in retail health clinic or ambulatory centers. Providers include primary care physicians (family practice, pediatricians, internal medicine), specialty care physicians (emergency medicine, preventive medicine), nonphysician providers (nurse practitioners, physician assistants) and other providers (urgent care, acute outpatient care, ambulatory care centers). Seasons of the year were determined based on the index date of the episode to account for possible seasonality in pharyngitis treatment. Lastly, a previous visits variable was created to identify whether the child had nonpharyngitis ARTI visits in the 3 months prior to the index visit.
Demographic variables were created based on enrollment and the socioeconomic data available in the Optum socioeconomic status file. These variables include patient age, race, sex, household income, geographic location, practice setting type, provider specialty, and type of insurance. An estimate of patient household income was based on algorithms using census block groups. Income categories were informed by the federal guidelines for a family of 4. A low-income family was defined as earning less than $50 000; a middle-income family earned between $50 000 and $75 000, and a high-income family earned $75 000 and above.12 Patient insurance type was categorized as HMO, Exclusive Provider Organization (EPO), Point of Service (POS), and PPO. Race was identified as White, Black, Hispanic, and Asian. Patient location was defined according to national census regions.
Outcomes
GAS test
The HEDIS measures for pharyngitis recommend using the GAS test to identify the bacterial etiology of the pharyngitis infection. Patients who received the test were identified based on Current Procedural Terminology (CPT) codes 87070-71, 87081, 87430, 87650-52, and 87880.10
Antibiotic treatment
The pharmacy administrative claims dataset was used to identify study patients who filled a prescription for an antibiotic during their pharyngitis treatment episode. Optum pharmacy data identify the medications received, specifies the date of prescription filling, National Drug Codes, and American Hospital Formulary Service (AHFS) Classification System codes for each medication. We used the AHFS Pharmacologic-Therapeutic classification of antibiotics to create dichotomous variables documenting the antibacterial used by each patient.13 These are categorized under antibacterial including penicillins, cephalosporins (first, second, third, fourth generation cephalosporins), macrolides (first generation and others), tetracyclines, sulfonamides, fluoroquinolones (ciprofloxacin, levofloxacin, moxifloxacin), cephamycin, carbapenems, and β-lactam antibiotics (amoxicillin, amoxicillin/clavulanate, cephalexin, cefuroxime, cefdinir).
Revisits to physician or other provider
Revisits within 28 days were used as the measure of patient outcomes related to testing and filling of an antibiotic prescription for acute pharyngitis. Revisits may also be due to a patient returning for a follow-up, alternative treatment, worsening pharyngitis, or for another ARTI. An ARTI-related revisit also increases total resources used to treat pediatric pharyngitis patients.
Statistical analysis
Logistic regression was used for all 3 analyses conducted in this study. First, we determined the patient and treating physician characteristics that impact the decision to use GAS testing for pharyngitis. Second, we identified those factors that impact the decision to use antibiotic prescriptions among children who were diagnosed with pharyngitis adding in the dichotomous variable indicating if the patient had received a GAS test. Third, we used a logit regression analysis to document if receiving a GAS test and/or an antibiotic impacted the likelihood of a revisit by comparing revisit risk. To estimate the effect of testing and/or antibiotic use, we divided patients into 4 groups based on whether the patient received a GAS test and/or an antibiotic prescription. This specification of the analysis of revisits as an outcome focuses on adherence to HEDIS “test and treat” guidelines10:
- Patients who were not tested yet filled an antibiotic prescription. This decision was likely based on the clinician’s judgment of the patient’s signs and symptoms, and confirmational testing not performed.
- Patients who were not tested and did not fill an antibiotic prescription. Apparently, in the clinician’s judgment the patient’s signs and symptoms were such that the infection did not warrant treatment and the clinical presentation did not necessitate the GAS test to confirm the recorded diagnosis of pharyngitis.
- Patients who were tested and received antibiotic prescription, likely because the test was positive for GABHS.
- Patients who were tested and did not receive antibiotic prescription.
We tested for statistically significant differences in baseline characteristics across these 4 patient groups using t tests for continuous variables and χ2 tests for categorical variables. Odds ratios (OR) and CI were computed for the influential variables included the regression analyses.
We conducted a sensitivity analysis using a model specification which included the dichotomous variables for testing and for treatment, and the interaction term between these variables to assess if treatment effects varied in tested and untested patients. We also estimated this model of revisit risk using revisits within 7 days as the outcome variable.
All analyses were completed using STATA/IC 13 (StataCorp, College Station, TX).
Results
There were 24 685 treatment episodes for children diagnosed with pharyngitis. Nearly 47% of these episodes included GAS testing and 47% of the tested patients filled an antibiotic prescription. Similarly, 53% of patients were not tested and 49% of untested patients filled an antibiotic prescription. As a result, the 4 groups identified for analysis were evenly distributed: untested and no prescription (26.9%), untested and prescription (26.3%), tested and prescription (21.9%), and tested and no prescription (24.9%) (Figure).
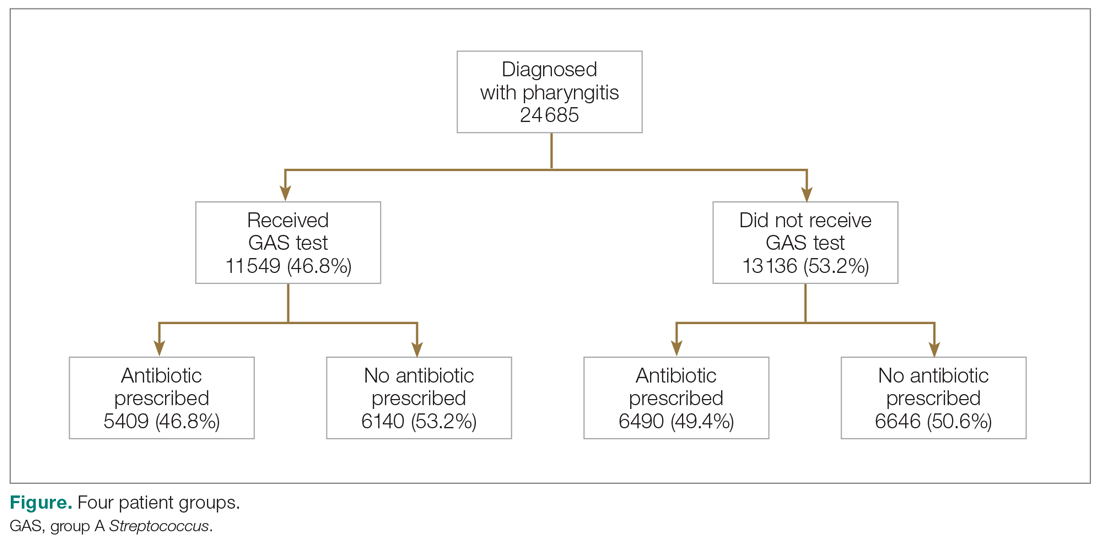
Table 1 presents the descriptive statistics for these 4 patient groups. Note first that the rate of revisits within 28 days is under 5% across all groups. Second, the 2 tested groups have a lower revisit rate than the untested groups: the tested and treated have a revisit rate of 3.3%, and the tested and untreated have a revisit rate of 2.4%, while both the untested groups have a revisit rate of nearly 5%. These small absolute differences in revisit rates across groups were statistically significant.
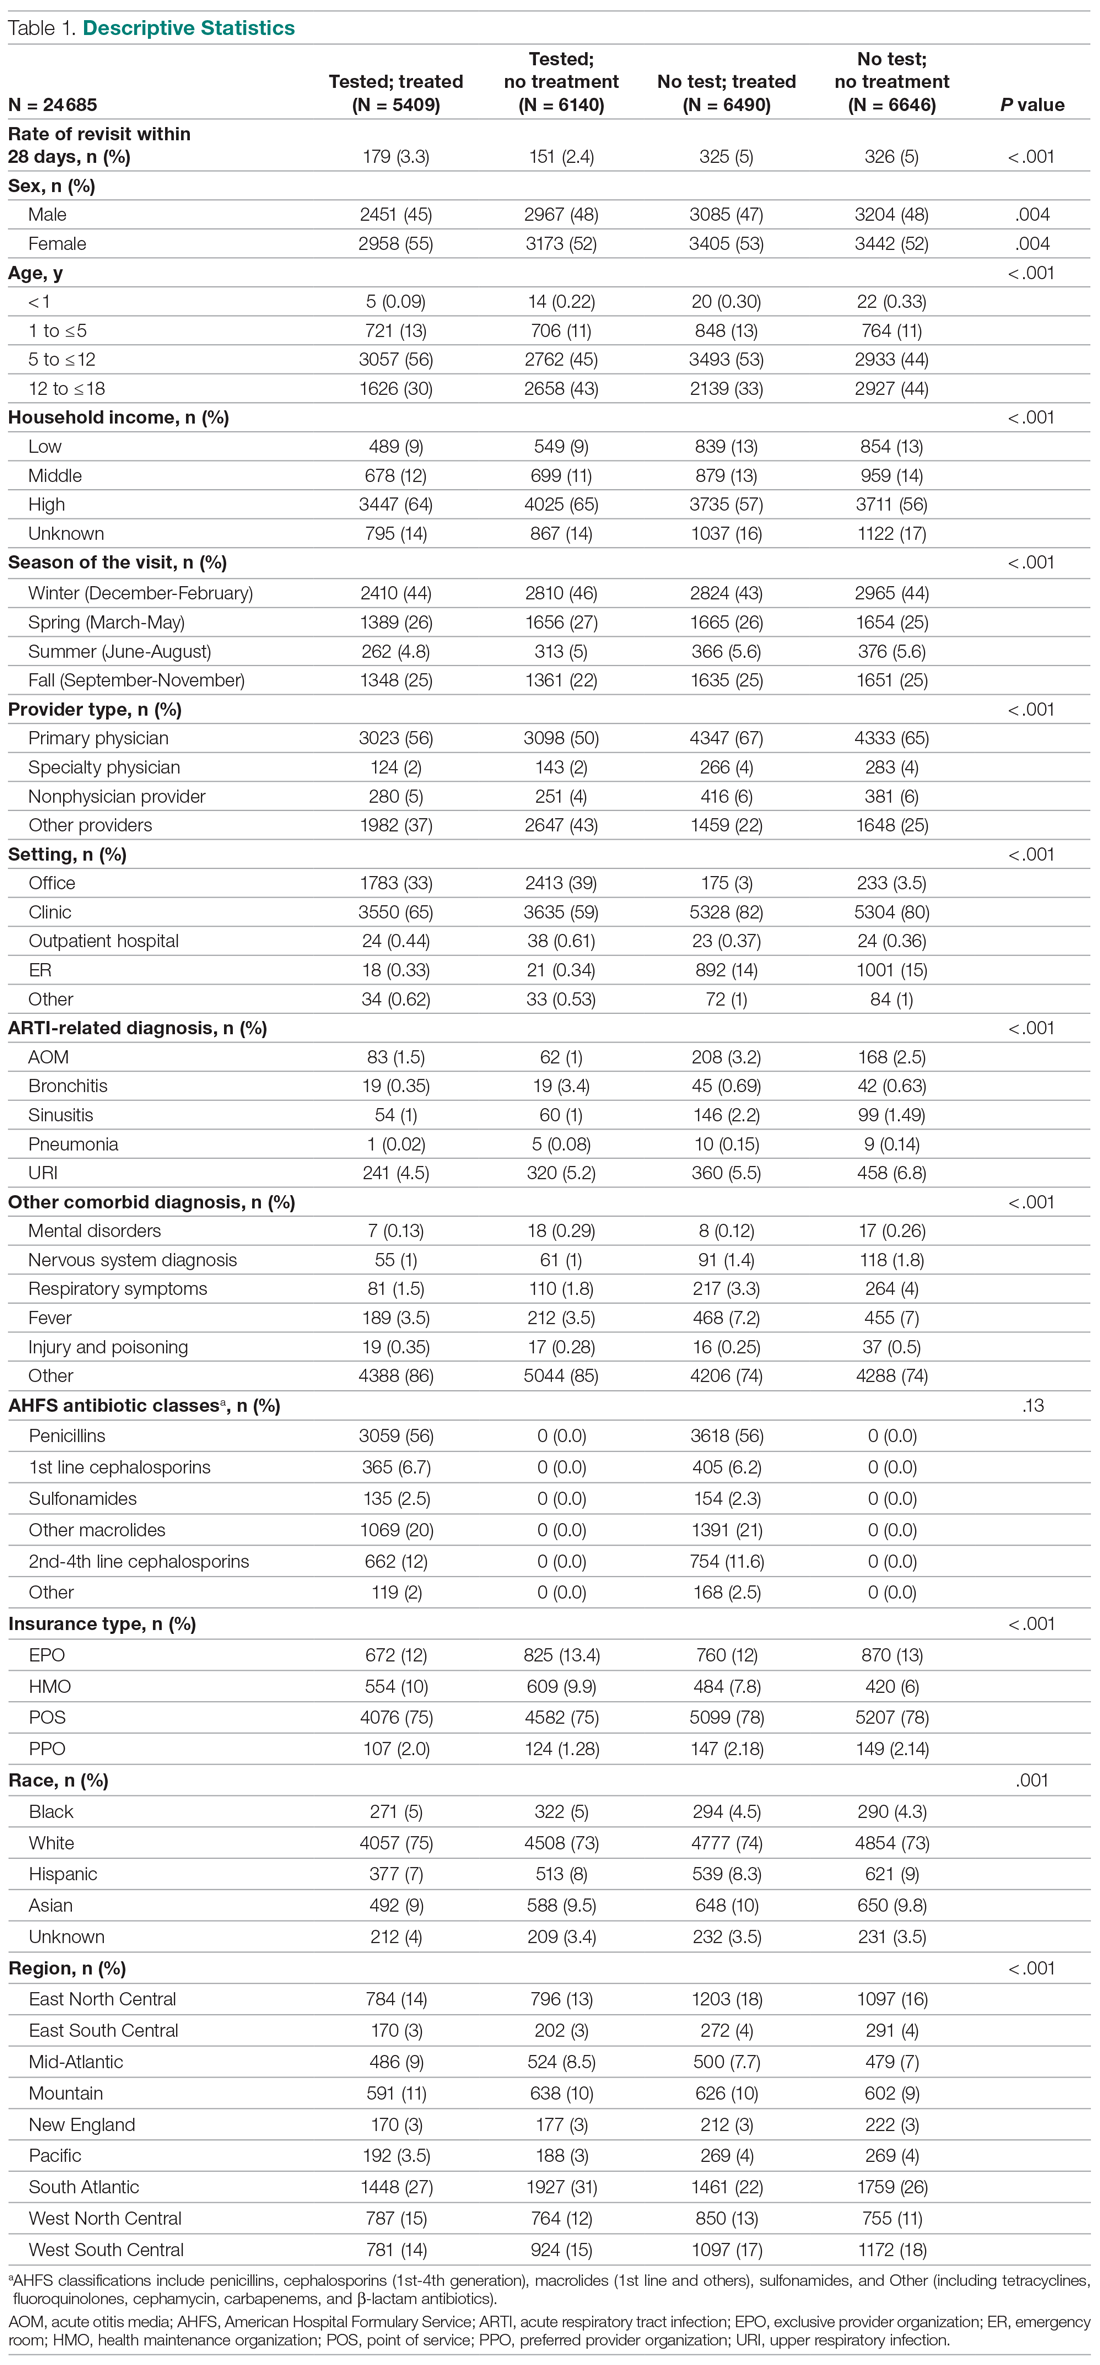
Factors associated with receiving GAS test
Several factors were found to impact the decision to test (Table 2). Only 9.7% of children were reported to have any ARTI coinfection. As expected, these comorbidities resulted in a significantly lower likelihood of receiving the GAS test: AOM, bronchitis, sinusitis, pneumonia, and URI as comorbid infections had a 48%, 41%, 37%, 63%, and 13% lower likelihood of receiving the GAS test, respectively, than those with no comorbidities. Similarly, children with fever and respiratory symptoms were 35% and 45% less likely to receiving the GAS test, respectively. This is consistent with our expectation that comorbid ARTI infections will lead many providers to forgo testing.
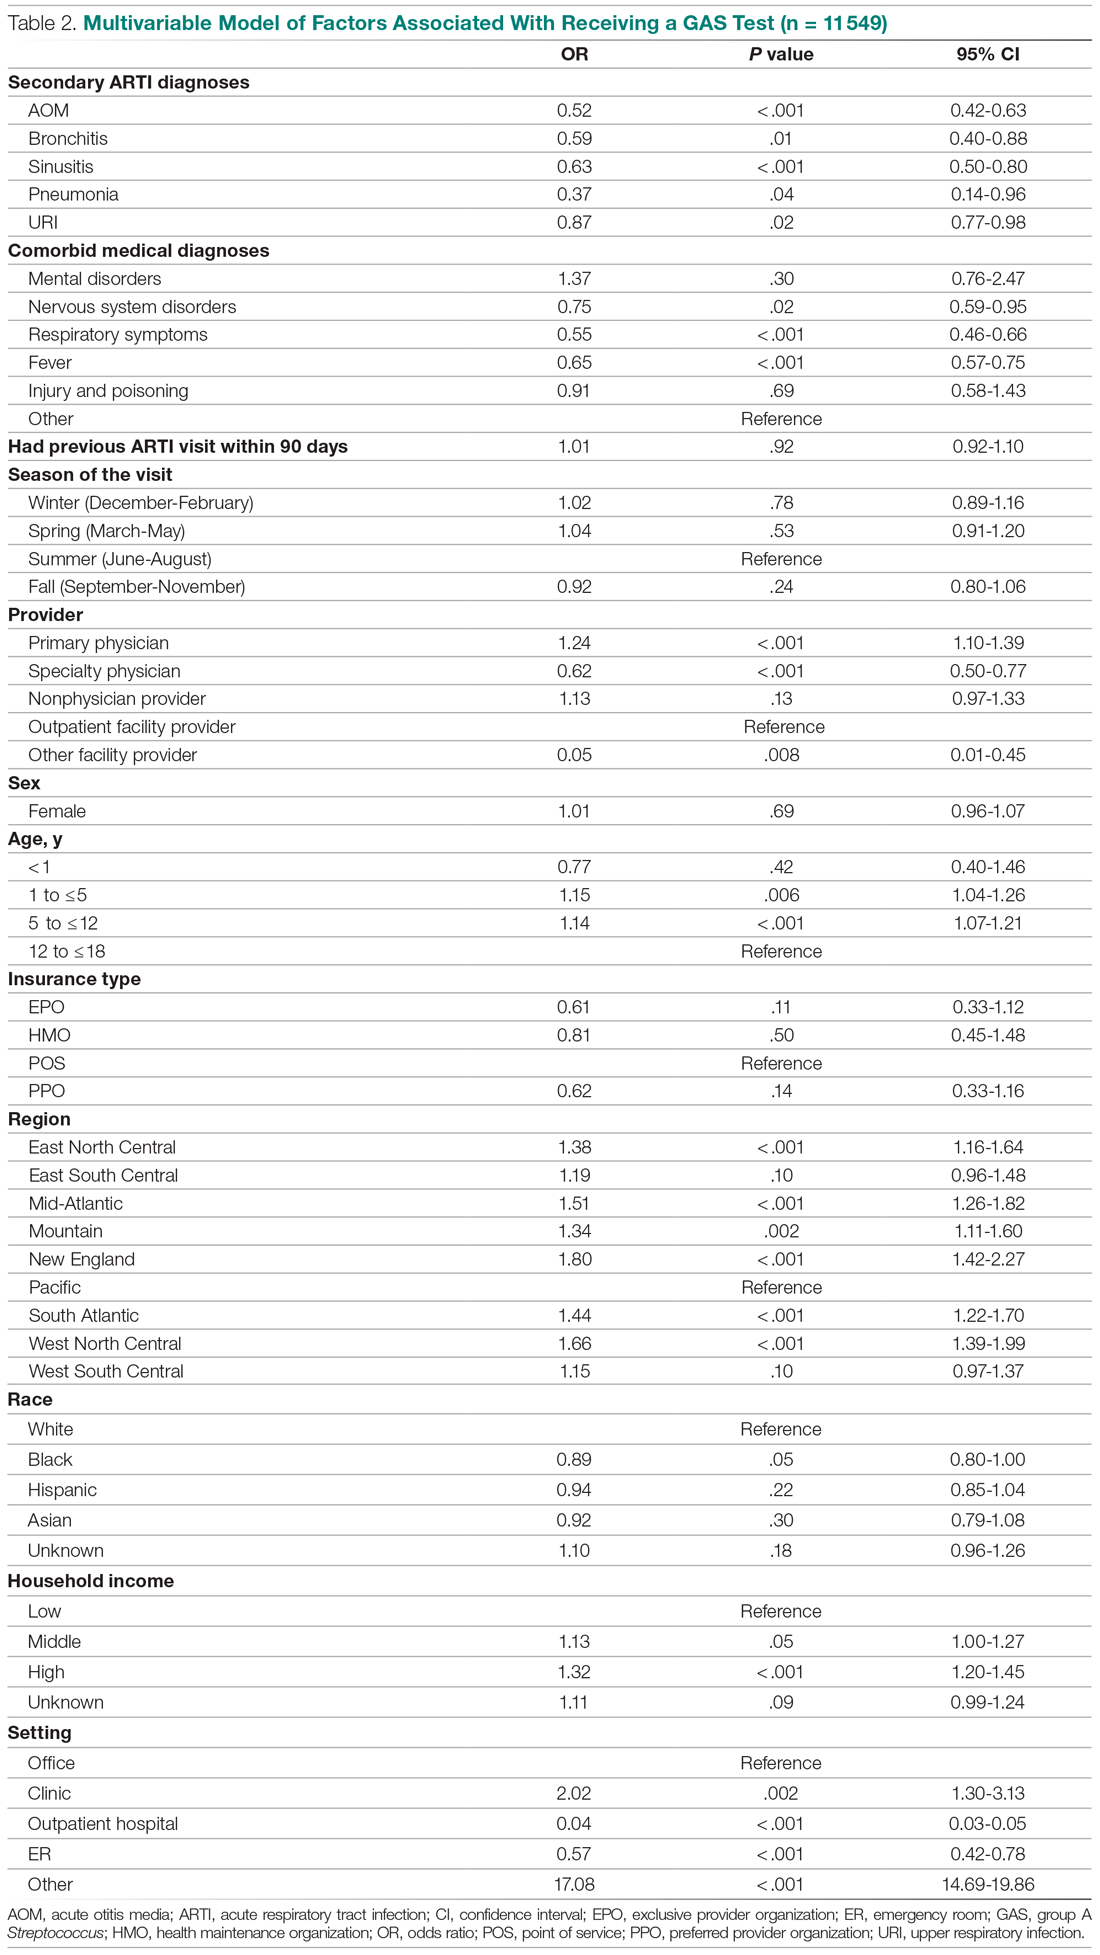
Provider type and patient age also plays a role in receipt of the GAS test. Relative to outpatient facility providers, primary care physicians were 24% more likely and specialty physicians were 38% less likely of employing the GAS test. The child’s age played a significant role in receipt of the GAS test. Children aged 1 to 5 years and 5 to 12 years were 15% and 14% more likely to receive the test compared to children older than 12 years.
Pharyngitis patients have disproportionately higher odds of receiving a GAS test in most regions of the country compared to the Pacific region. For instance, children in the Mid-Atlantic region have 51% higher odds of receiving a GAS test while children in New England have 80% higher odds of receiving the same test.
Black children have 11% lower odds of receiving the GAS test compared to White children. Both middle-income and high-income children have 12% and 32% higher odds of receiving the test compared to low-income children. Compared to office-based visits, children visiting a clinic were twice as likely to receive a GAS test while those seen in the emergency room have 43% lower odds of receiving a GAS test. Hospital outpatient departments, which account for less than 1% of all visits, rarely used a GAS test which could be a statistical artifact due to small sample size. Lastly, insurance and season of the year had no significant impact of receipt of a GAS test.
Factors associated with receiving antibiotic prescription
Surprisingly, receiving the GAS test has a small but insignificant impact on the likelihood that the patient will receive an antibiotic prescription (Table 3) (Adjusted OR = 1.055, P = .07). After controlling for receipt of a GAS test, children with AOM and sinusitis comorbidities have an increased likelihood of being prescribed an antibiotic. Children with URI have a lower likelihood of being prescribed an antibiotic. Additionally, relative to primary care physicians, children visiting nonphysician providers for pharyngitis were more likely to be prescribed an antibiotic.
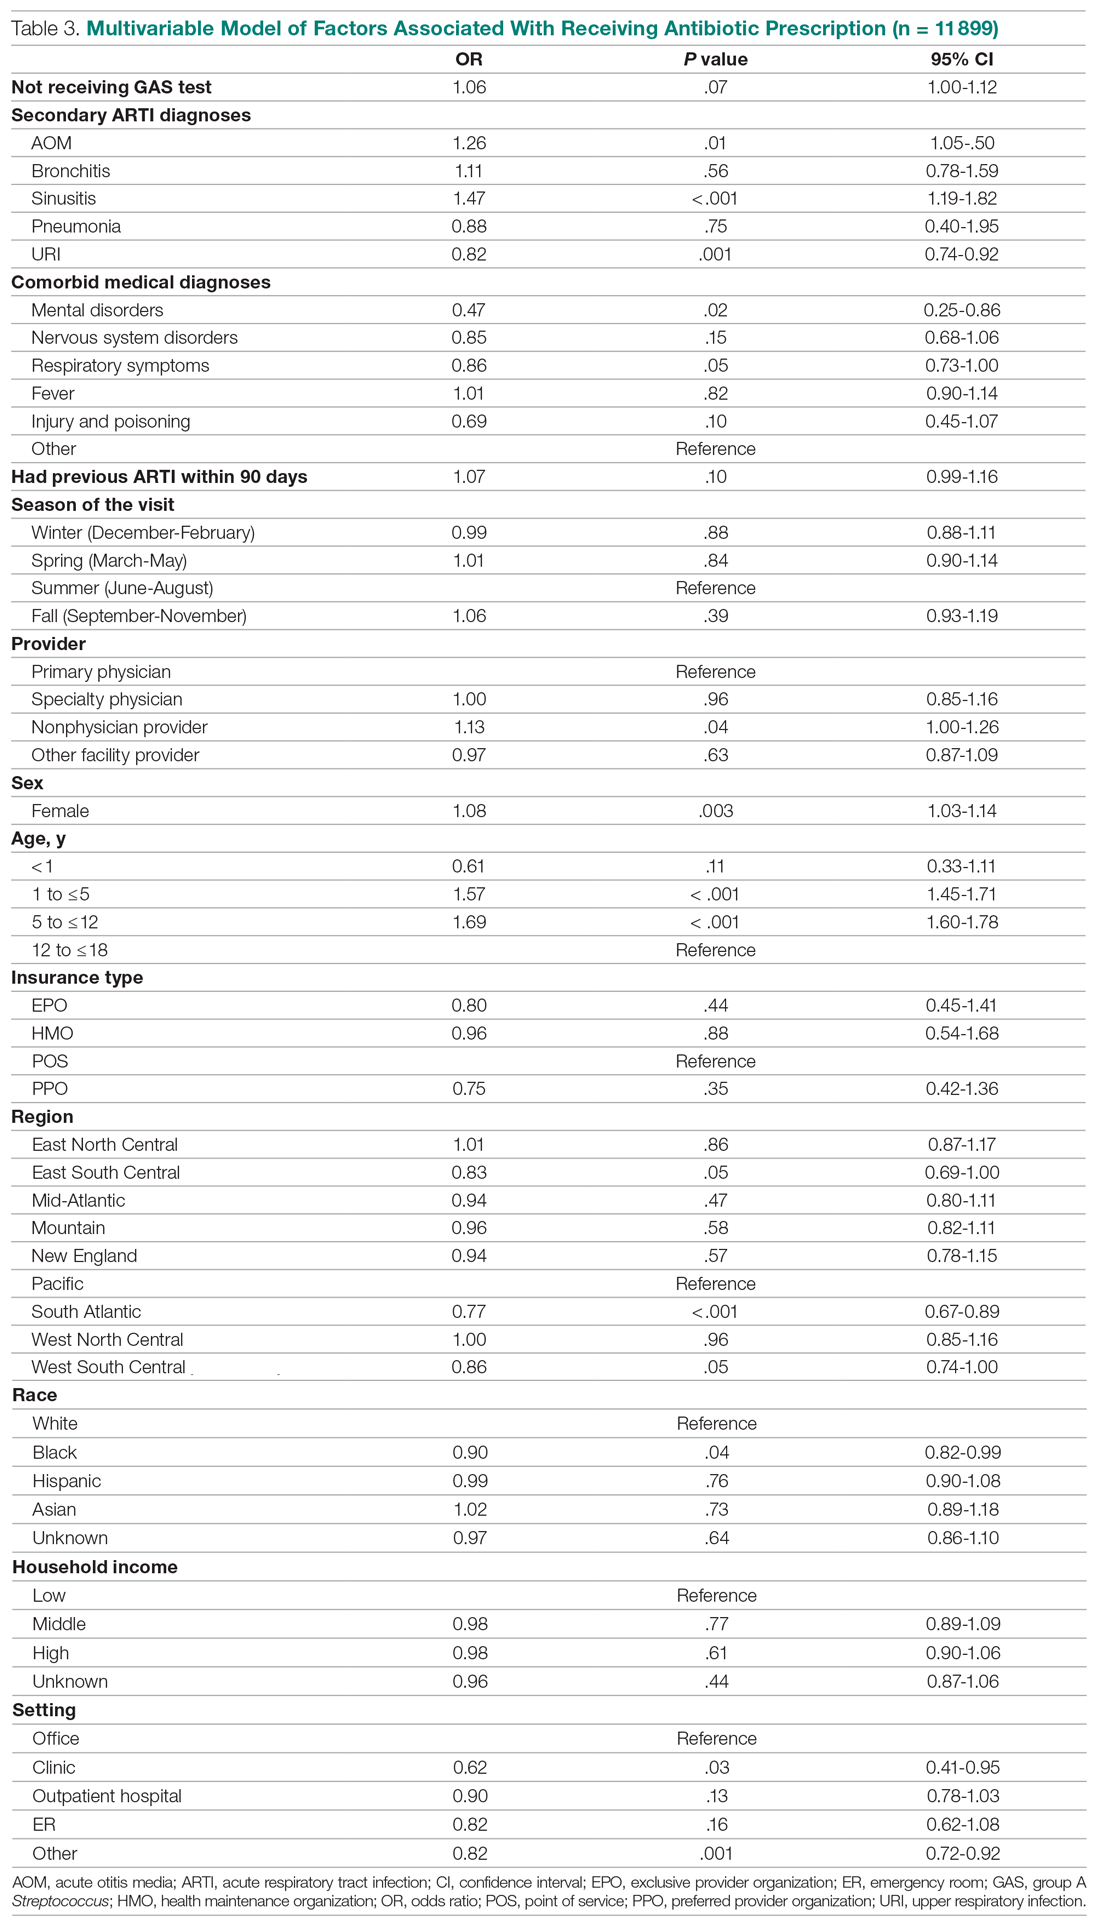
Children under 12 years of age were more likely to use an antibiotic compared to children 12 years and older. Geographically, there is some evidence of regional variation in antibiotic use as well. Children in the south Atlantic, west-south central, and southeast central regions had a significantly lower odds of being prescribed an antibiotic respectively than pharyngitis patients in the Pacific region. Black children had a 10% lower likelihood of being prescribed an antibiotic compared to White children, possibly related to their lower rate of GAS testing. Compared to office-based visits, children visiting a clinic were less likely to use an antibiotic. Household income, insurance type, and season had no significant impact on revisit risk.
Effects of GAS test and antibiotic prescriptions on likelihood of revisits
The multivariate analysis of the risk of a revisit within 28 days is presented in Table 4. Children with pharyngitis who tested and did not receive an antibiotic serve as the reference comparison group for this analysis to illustrate the impact of using the GAS test and treatment with an antibiotic. The results in Table 4 are quite clear: patients who receive the GAS test were significantly less likely to have a revisit within 28 days. Moreover, within the group of patients who were tested, those not receiving an antibiotic, presumedly because their GAS test was negative, experienced the lowest risk of a revisit. This result is consistent with the data in Table 1. Moreover, using an antibiotic had no impact on the likelihood of a revisit in patients not receiving the GAS test. This result is also consistent with Table 1.
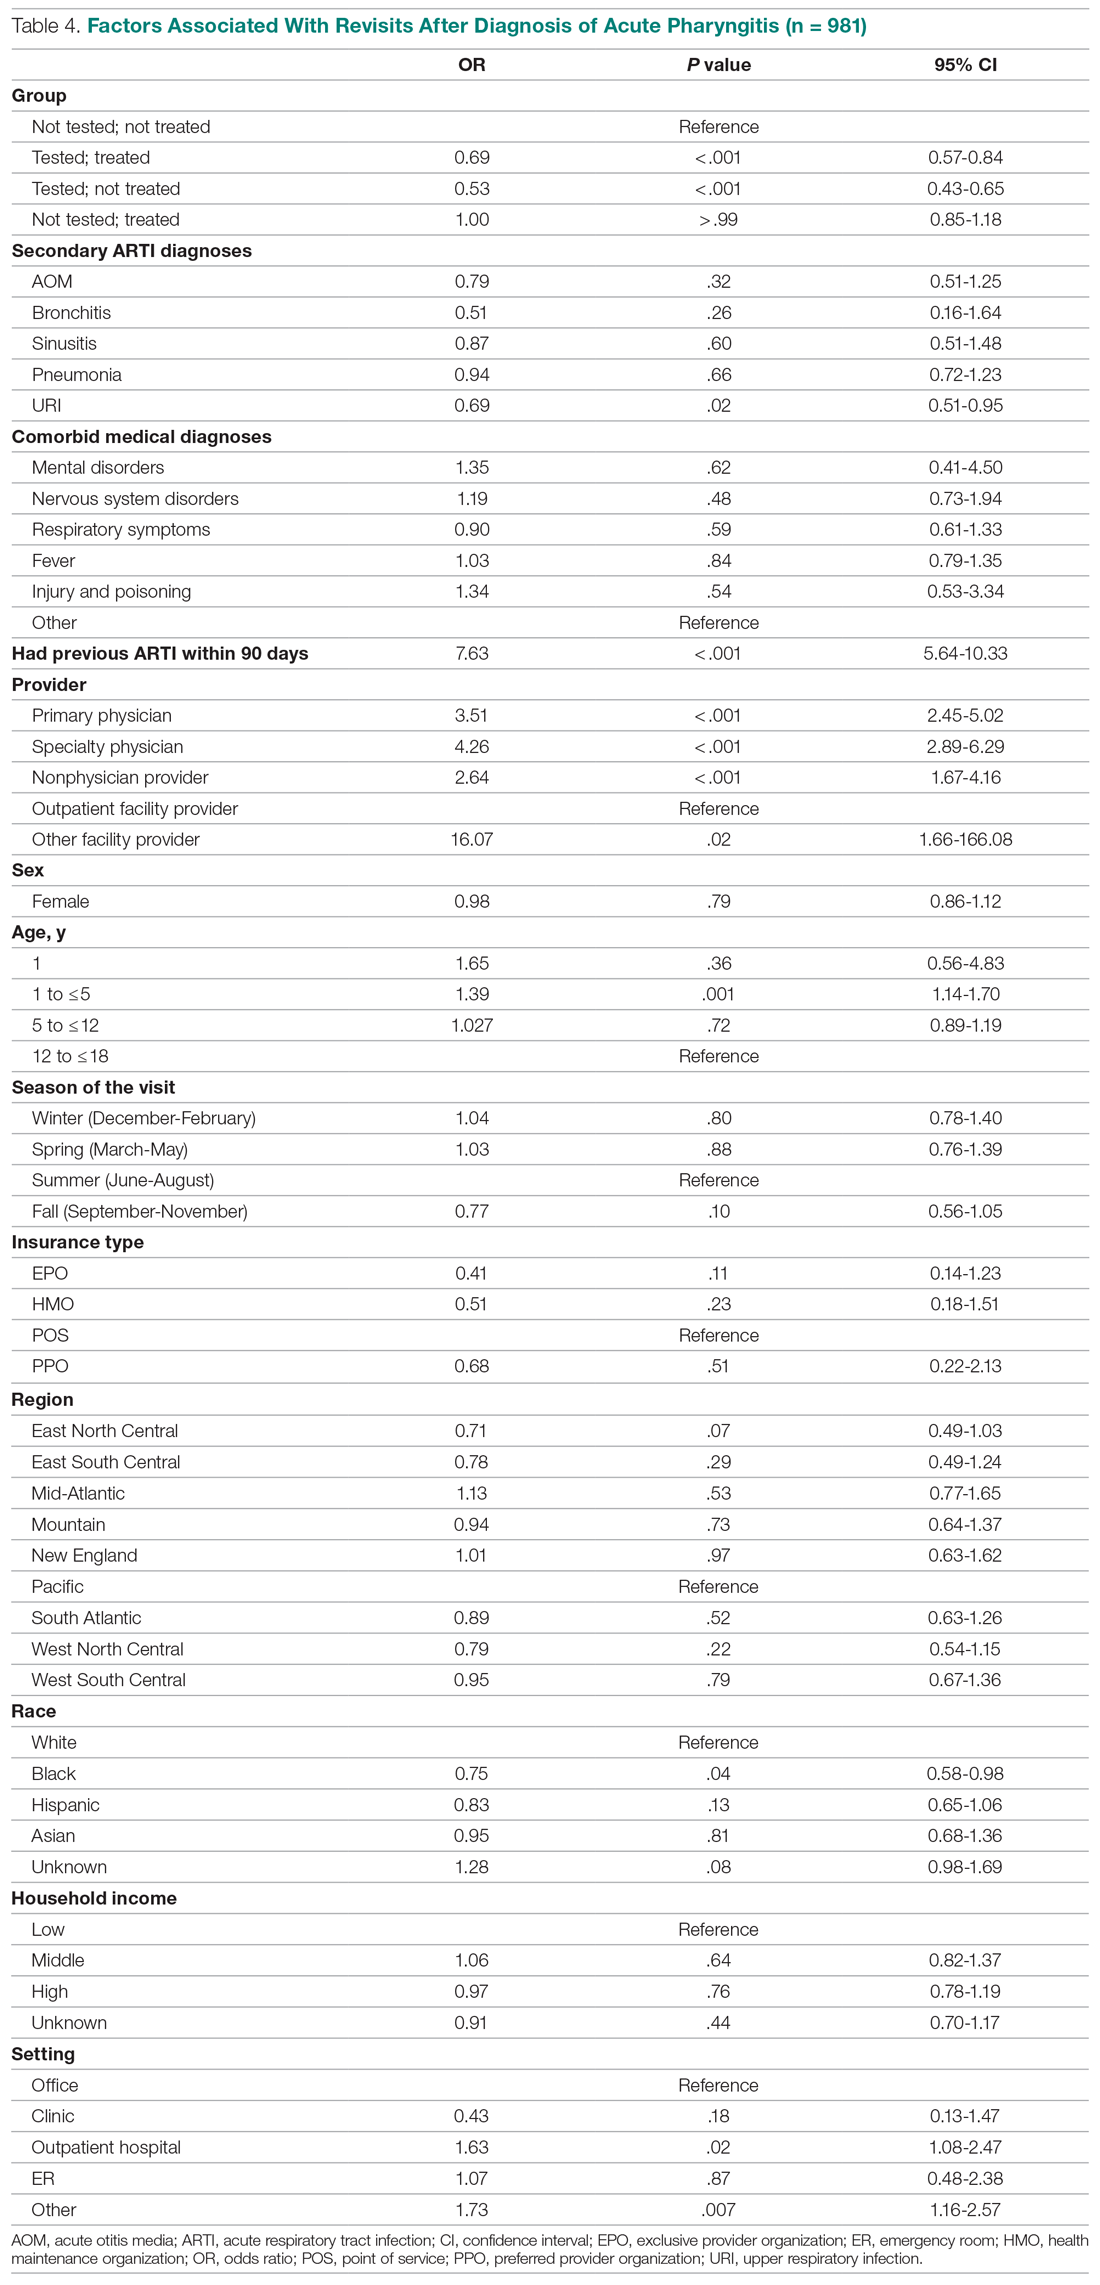
Other results from the analysis of revisit risk may be of interest to clinicians. Pharyngitis patients with a prior episode of treatment within 90 days for an acute respiratory tract infection were more than 7 times more likely to experience a revisit within 28 days of the pharyngitis diagnosis than patients without a history of recent ARTI infections. Age is also a risk factor in likelihood of initiating a revisit. Children under 1 year and children aged 1 to 5 years were more likely to have a revisit than children aged more than 12 years. Compared to White children, Black children were 25% (P = .04) less likely to have a revisit. The care setting also has a significant impact on revisit risk. Children visiting outpatient hospital and other care settings had a significantly higher revisit risk than those visiting a physician’s office. Lastly, household income, geographic region, season, medical comorbidities, gender, and insurance type have no significant impact on revisit risk.
Sensitivity analysis
The results from the analysis of 7-day and 28-day revisit risk are summarized in Table 5. These results indicate that patients who were tested had a more significant decrease in revisit risk at 7 days (72%) than was evident at 28 days (47% reduction). Receiving an antibiotic, with or without the test, had no impact on revisit risk.
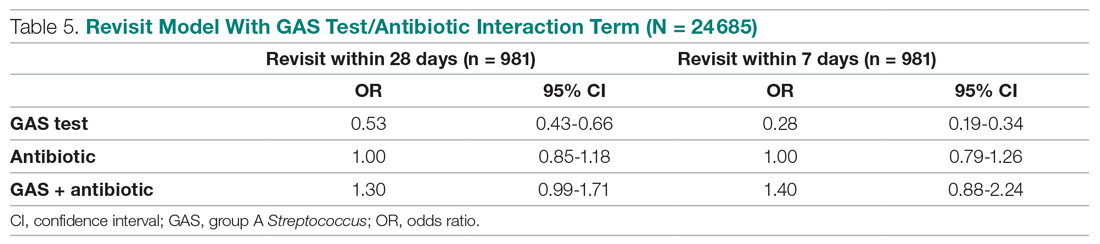
Discussion
Published data on revisits for pharyngitis are lacking with the concentration of prior research focused more on systemic complications of undertreated GABHS disease or on identifying carrier status. Our study results suggest that GAS testing is the most important factor in reducing revisit risk. Being prescribed an antibiotic, on its own, does not have a significant impact on the risk of a revisit. However, once the GAS test is used, the decision not to use an antibiotic was correlated with the lowest revisit rate, likely because the source of the pharyngitis infection was viral and more likely to resolve without a revisit. Prior studies have reported variable rates of testing among children with pharyngitis prescribed an antibiotic, ranging from 23% to 91%,14,15 with testing important toward more appropriate antibiotic use.16 More recently, among more than 67 000 patients aged 3 to 21 years presenting with sore throat and receiving a GAS test, 32.6% were positive.17
Our analysis found that more than 46% of pediatric pharyngitis patients were given the rapid GAS test. While this testing rate is substantially lower than HEDIS recommendations and lower than testing rates achieved by several health maintenance organizations,10 it is similar to the 53% of children receiving such testing in a recent National Ambulatory Medical Care Survey.18 Furthermore, we found that when antibiotics are prescribed following a GAS test, the revisit risk is not significantly reduced, possibly because antibiotics lower revisit risk when informed by diagnostic testing tools that determine the infectious organism. This is supported by a similar population analysis in which we observed reduced revisit rates in children with AOM managed with antibiotics within 3 days of index diagnosis.19
Several other factors also affect the likelihood of a child receiving the GAS test. Children aged 1 to 12 years were significantly more likely to receive the GAS test than children over the age of 12. This included children in the 1 to 5 years old bracket who had a 15% higher likelihood of undergoing a GAS test, despite children less than 3 years of age as not recommended targets for GAS testing.20 As expected, children with reported ARTI-associated comorbidities were also less likely to receive a GAS test. Additionally, specialty care physicians were less inclined to implement the GAS test, possibly because of diagnostic confidence without testing or referral after GAS was ruled out. Black and low-income children had statistically lower odds of receiving the test, even after controlling for other factors, and yet were less likely to consume a revisit. As the overall data suggested more revisits in those not tested, further study is needed to examine if race or income discrepancies are equity based. Finally, children in the Pacific region, compared to the rest of the nation, were the least likely to receive a GAS test and yet there were no significant differences in revisit rates by region. Regional differences in antibiotic use were also observed in our study, as has been seen by others.21
After statistically controlling for having received the diagnostic GAS test and filled a prescription for an antibiotic, there are multitude of factors that independently affect the revisit risk, the most important of which if which was a history of an ARTI infection in the prior 90 days. While prior visit history had no impact on the likelihood of being tested or filling an antibiotic, patients with prior visits were more than 7 times more likely to consume a revisit. This was not reflected in nor related to comorbid ARTIs as these patients did not have statistically higher revisits than those with pharyngitis as the sole-coded diagnosis. Moreover, speculation for bacterial etiology of primary or superinfection based on a recent history of ARTI accounting for revisits seems unlikely as it did not yield greater antibiotic use in that group. Further analysis is required to determine the clinical and behavioral factors that promote for prior ARTI history as a major factor in revisit risk after an index visit for pharyngitis.
Children aged between 1 and 5 years, though 15% more likely to be tested than those aged 12 through 17 years, were also 39% more likely to initiate a revisit compared to older children when statistically controlling for other covariates. This perhaps suggests longer illness, wrong diagnosis, delay in appropriate treatment, or more caution by parents and providers in this age group. Justification for testing children less than 3 years of age who are outside of the HEDIS suggested age group, when clinical judgement does not point to another infection source, can result in positivity rates between 22% and 30% as previously observed.22,23 Patients visiting nonphysician providers and outpatient facility providers were less likely to have a revisit than those visiting primary and specialty care physicians, though slightly higher propensity for antibiotic prescriptions was seen for nonphysician providers. Pediatricians have been noted to be less likely to prescribe antibiotics without GAS testing than nonpediatric providers, and more guidelines-compliant in prescribing.24
Recommendations to not test children under 3 years of age are based on the lack of acute rheumatic fever and other complications in this age group together with more frequent viral syndromes. Selectivity in applying clinical criteria to testing can be attempted to separate bacterial from viral illness. Postnasal drainage/rhinorrhea, hoarse voice, and cough have been used successfully to identify those with viral illness and less need for testing, with greater certainty of low risk for GABHS in those over 11 years of age without tonsillar exudates, cervical adenopathy, or fever.17 However, the marginal benefits of those who have all 3 features of viral illness versus none in identifying GAS positivity was 23.3% vs 37.6% - helpful, but certainly not diminishing the need for testing. These constitutional findings of viral URI also do not exclude the GAS carrier state that features these symptoms.25 Others have reinforced the doubt of pharyngeal exudates as the premier diagnostic finding for test-positive GAS.26
This study had several limitations. The Optum claims dataset only contains ICD-9 codes for diagnoses. It does not include data on infection severity and clinical findings related to symptoms, thus empiric treatment warranted based in clinical severity is not assessed. Antibiotics are commonly available as generics and very inexpensive. Patients may fill and pay for these prescriptions directly, in which case, a claim for payment may not be filed with Optum. This could result in an undercount of treated patients in our study.
There is no corresponding problem of missing medical claims for GAS testing which were obtained from the CPT codes within the Optum claims data set. However, we elected not to verify the test results due to these data being missing for 75% of the study population. Nevertheless, this study’s focus was less about justifying antibiotic treatment, but dealt with the outcomes generated by testing and treatment. Toward that end, we used CPT codes to identify a revisit, and while those can at times be affected by financial reimbursement incentives, differences related to revisits in the 4 patient groups should not be subject to bias.
Conclusion
This study used data from real world practices to document the patterns of GAS testing and antibiotic use in pediatric pharyngitis patients. Revisit rates were under 5% for all patient groups and the use of rapid diagnostic tools were found to be the determining factor in further reducing the risk of revisits. This supports the need for compliance with the HEDIS quality metric for pharyngitis to the recommended levels of rapid testing which have been falling in recent years. Use of more accurate antigen and newer molecular detection testing methods may help further delineate important factors in determining pediatric pharyngitis treatment and need for revisits.27
Corresponding author: Jeffrey McCombs, MD, University of Southern California School of Pharmacy, Department of Pharmaceutical and Health Economics, Leonard D. Schaeffer Center for Health Policy & Economics, 635 Downey Way, Verna & Peter Dauterive Hall 310, Los Angeles, CA 90089-3333; jmccombs@usc.edu.
Financial disclosures: None.
1. Choby BA. Diagnosis and treatment of streptococcal pharyngitis. Am Fam Physician. 2009;79(5):383-390.
2. Briel M, Schuetz P, Mueller B, et al. Procalcitonin-guided antibiotic use vs a standard approach for acute respiratory tract infections in primary care. Arch of Intern Med. 2008;168(18):2000-2008. doi: 10.1001/archinte.168.18.2000
3. Maltezou HC, Tsagris V, Antoniadou A, et al. Evaluation of a rapid antigen detection test in the diagnosis of streptococcal pharyngitis in children and its impact on antibiotic prescription. J Antimicrob Chemother. 2008;62(6):1407-1412. doi: 10.1093/jac/dkn376
4. Neuner JM, Hamel MB, Phillips RS, et al. Diagnosis and management of adults with pharyngitis: a cost-effectiveness analysis. Ann Intern Med. 2003;139(2):113-122. doi:10.7326/0003-4819-139-2-200307150-00011
5. Gerber MA, Baltimore RS, Eaton CB, et al. Prevention of rheumatic fever and diagnosis and treatment of acute Streptococcal pharyngitis: a scientific statement from the American Heart Association Rheumatic Fever, Endocarditis, and Kawasaki Disease Committee of the Council on Cardiovascular Disease in the Young, the Interdisciplinary Council on Functional Genomics and Translational Biology, and the Interdisciplinary Council on Quality of Care and Outcomes Research: endorsed by the American Academy of Pediatrics. Circulation. 2009;119(11):1541-1551. doi: 10.1161/CIRCULATIONAHA.109.191959
6. Gieseker KE, Roe MH, MacKenzie T, Todd JK. Evaluating the American Academy of Pediatrics diagnostic standard for Streptococcus pyogenes pharyngitis: backup culture versus repeat rapid antigen testing. Pediatrics. 2003;111(6):e666-e670. doi: 10.1542/peds.111.6.e666
7. Shapiro DJ, Lindgren CE, Neuman MI, Fine AM. Viral features and testing for Streptococcal pharyngitis. Pediatrics. 2017;139(5):e20163403. doi: 10.1542/peds.2016-3403
8. Shulman ST, Bisno AL, Clegg H, et al. Clinical practice guideline for the diagnosis and management of group A Streptococcal pharyngitis: 2012 update by the Infectious Diseases Society of America. Clin Infect Dis. 2012;55(10):e86–e102. doi: 10.1093/cid/cis629
9. Mangione-Smith R, McGlynn EA, Elliott MN, et al. Parent expectations for antibiotics, physician-parent communication, and satisfaction. Arch Pediatr Adolesc Med. 2001;155(7):800–806. doi: 10.1001/archpedi.155.7.800
10. Appropriate Testing for Children with Pharyngitis. HEDIS Measures and Technical Resources. National Committee for Quality Assurance. Accessed February 12, 2021. https://www.ncqa.org/hedis/measures/appropriate-testing-for-children-with-pharyngitis/
11. Linder JA, Bates DW, Lee GM, Finkelstein JA. Antibiotic treatment of children with sore throat. JAMA. 2005;294(18):2315-2322. doi: 10.1001/jama.294.18.2315
12. Crimmel BL. Health Insurance Coverage and Income Levels for the US Noninstitutionalized Population Under Age 65, 2001. Medical Expenditure Panel Survey, Agency for Healthcare Research and Quality. 2004. https://meps.ahrq.gov/data_files/publications/st40/stat40.pd
13. AHFS/ASHP. American Hospital Formulary Service Drug Information. 2012. AHFS drug information. 00--. Accessed January 4, 2021.
14. Mainous AG 3rd, Zoorob, RJ, Kohrs FP, Hagen MD. Streptococcal diagnostic testing and antibiotics prescribed for pediatric tonsillopharyngitis. Pediatr Infect Dis J. 1996;15(9):806-810. doi: 10.1097/00006454-199609000-00014
15. Benin AL, Vitkauskas G, Thornquist E, et al. Improving diagnostic testing and reducing overuse of antibiotics for children with pharyngitis: a useful role for the electronic medical record. Pediatr Infect Dis J. 2003;22(12):1043-1047. doi: 10.1097/01.inf.0000100577.76542.af
16. Luo R, Sickler J, Vahidnia F, et al. Diagnosis and Management of Group a Streptococcal Pharyngitis in the United States, 2011-2015. BMC Infect Dis. 2019;19(1):193-201. doi: 10.1186/s12879-019-3835-4
17. Shapiro DJ, Barak-Corren Y, Neuman MI, et al. Identifying Patients at Lowest Risk for Streptococcal Pharyngitis: A National Validation Study. J Pediatr. 2020;220:132-138.e2. doi: 10.1016/j.jpeds.2020.01.030. Epub 2020 Feb 14
18. Shapiro DJ, King LM, Fleming-Dutra KE, et al. Association between use of diagnostic tests and antibiotic prescribing for pharyngitis in the United States. Infect Control Hosp Epidemiol. 2020;41(4):479-481. doi: 10.1017/ice.2020.29
19. Sangha K, Steinberg I, McCombs JS. The impact of antibiotic treatment time and class of antibiotic for acute otitis media infections on the risk of revisits. Abs PDG4. Value in Health. 2019; 22:S163.
20. Ahluwalia T, Jain S, Norton L, Meade J, et al. Reducing Streptococcal Testing in Patients < 3 Years Old in an Emergency Department. Pediatrics. 2019;144(4):e20190174. doi: 10.1542/peds.2019-0174
21. McKay R, Mah A, Law MR, et al. Systematic Review of Factors Associated with Antibiotic Prescribing for Respiratory Tract Infections. Antimicrob Agents Chemother. 2016;60(7):4106-4118. doi: 10.1128/AAC.00209-16
22. Woods WA, Carter CT, Schlager TA. Detection of group A streptococci in children under 3 years of age with pharyngitis. Pediatr Emerg Care. 1999;15(5):338-340. doi: 10.1097/00006565-199910000-00011
23. Mendes N, Miguéis C, Lindo J, et al. Retrospective study of group A Streptococcus oropharyngeal infection diagnosis using a rapid antigenic detection test in a paediatric population from the central region of Portugal. Eur J Clin Microbiol Infect Dis. 2021;40(6):1235-1243. doi: 10.1007/s10096-021-04157-x
24. Frost HM, McLean HQ, Chow BDW. Variability in Antibiotic Prescribing for Upper Respiratory Illnesses by Provider Specialty. J Pediatr. 2018;203:76-85.e8. doi: 10.1016/j.jpeds.2018.07.044.
25. Rick AM, Zaheer HA, Martin JM. Clinical Features of Group A Streptococcus in Children With Pharyngitis: Carriers versus Acute Infection. Pediatr Infect Dis J. 2020;39(6):483-488. doi: 10.1097/INF.0000000000002602
26. Nadeau NL, Fine AM, Kimia A. Improving the prediction of streptococcal pharyngitis; time to move past exudate alone [published online ahead of print, 2020 Aug 16]. Am J Emerg Med. 2020;S0735-6757(20)30709-9. doi: 10.1016/j.ajem.2020.08.023
27. Mustafa Z, Ghaffari M. Diagnostic Methods, Clinical Guidelines, and Antibiotic Treatment for Group A Streptococcal Pharyngitis: A Narrative Review. Front Cell Infect Microbiol. 2020;10:563627. doi: 10.3389/fcimb.2020.563627
From the Department of Pharmaceutical and Health Economics, University of Southern California, Los Angeles, CA, (Drs. Sangha and McCombs), Department of Pediatrics, Keck School of Medicine, and Department of Clinical Pharmacy, School of Pharmacy, University of Southern California, Los Angeles, CA, (Dr. Steinberg), and Leonard Schaeffer Center for Health Policy and Economics, University of Southern California, Los Angeles, CA (Dr. McCombs).
Objective: The recommended treatment for children and adolescents under 18 years of age who have a positive test for group A Streptococcus (GAS) are antibiotics using the “test and treat” strategy to detect and treat GAS for pediatric pharyngitis. This study used paid claims data to document the extent to which real-world treatment patterns are consistent with these recommendations. We document the factors correlated with testing and treatment, then examine the effects of receiving a GAS test and being treated with an antibiotic impact the likelihood of a revisit for an acute respiratory tract infection within 28 days.
Methods: This retrospective cohort study used Optum Insight Clinformatics data for medical and pharmacy claims from 2011-2013 to identify episodes of care for children and adolescents with pharyngitis around their index visit (± 6 months). The sample population included children and adolescents under 18 years of age with a diagnosis of pharyngitis. Multivariable logistic regression analyses were used to document factors associated with receipt of GAS test and antibiotic treatment. Next, we used logistic regression models to estimate the impact of test and treat recommendation on revisit risk.
Results: There were 24 685 treatment episodes for children and adolescents diagnosed with pharyngitis. Nearly 47% of these episodes included a GAS test and 48% of tested patients were prescribed an antibiotic prescription. Failing to perform a GAS test increased the risk of a revisit within 28 days by 44%. The use of antibiotics by tested and untested patients had no impact on revisit risk.
Conclusion: While the judicious use of antibiotics is important in managing pharyngitis infections and managing complications, the use of rapid diagnostic tools was found to be the determining factor in reducing revisits for pediatric patients with pharyngitis.
Keywords: pediatrics; pharyngitis; respiratory infections; acute infections; diagnostic tests; group A Streptococcus; antibiotics; revisits.
Acute pharyngitis is a common acute respiratory tract infection (ARTI) in children. Group A β-hemolytic streptococci (GABHS) is the most common bacterial etiology for pediatric pharyngitis, accounting for 15% to 30% of cases.1
Beyond clinical assessment, laboratory diagnostic testing generally plays a limited role in guiding appropriate antibiotic prescribing for patients with an ARTI.2,3 Most diagnostic tests require 2 or 3 days to result, incur additional costs, and may delay treatment.4 While these tests do not provide clear and timely guidance on which specific antibiotic is appropriate for ARTI patients, this is not the case for patients with pharyngitis.5,6,7 A rapid diagnostic test exists to identify pharyngitis patients with GABHS which accounts for 1 in 4 children with acute sore throat.1,4,6 Both the American Academy of Pediatrics and the Infectious Diseases Society of America recommend antibiotic treatment for children and adolescents under 18 years of age who have a positive test for group A Streptococcus (GAS).8,9 This “test and treat” protocol has been consistently included in the Healthcare Effectiveness Data and Information Set (HEDIS) standards over time for pediatric pharyngitis patients aged 3 to 18 years before dispensing an antibiotic.10
Sinusitis, pneumonia, and acute otitis media are considered ARTIs where antibiotic treatment is justified. Therefore, pharyngitis of unclear etiology seen with these comorbid infections may not always undergo GAS testing but move directly to the patient being prescribed antibiotics. This analysis enumerates ARTI-related comorbidities present together with the initial coded pharyngitis diagnosis to evaluate their impact on the provider’s decision to test and treat, and on revisit risk.
Antibiotic treatment for GAS patients is likely to eradicate the acute GABHS infection within 10 days. Penicillin and amoxicillin are commonly recommended because of their narrow spectrum of activity, few adverse effects, established efficacy, and modest cost. Alternative antibiotics for patients with penicillin allergy, or with polymicrobial infection seen on culture results, include a first-generation cephalosporin, clindamycin, clarithromycin (Biaxin), or azithromycin (Zithromax).1,8,11 However, while compliance with these HEDIS guidelines has been evaluated, the outcome effects of following the HEDIS “test and treat” recommendations for children with pharyngitis have not been adequately evaluated.
These outcome evaluations have increasing importance as the latest HEDIS survey has shown testing rates in commercial Preferred Provider Organizations (PPO) falling from 86.4% in 2018 to 75.9% in 2019, the lowest rate of testing since 2009, with similar reductions under 80% for Health Maintenance Organizations (HMO).10 While health plans may execute cost-benefit analyses and algorithms to forge best practices for GAS testing in children and adolescents presenting with symptoms of pharyngitis, it is important to regard the wasteful resource utilization and additional cost of revisits that may offset any gains accrued by more focused GAS testing outside the existing clinical guidelines and HEDIS measures. This may be of particular importance in documenting infection and sparing antibiotic therapy in toddlers and younger.
The objective of this study was to investigate the correlation between testing and antibiotic use on the likelihood of a revisit for an acute respiratory tract infection within 28 days. To achieve this objective, this investigation consists of 3 sequential analyses. First, we document the factors associated with the decision to test the patient for a GABHS infection using the GAS test. Next, we document the factors associated with the decision to use an antibiotic to treat the patient as a function of having tested the patient. Finally, we investigate the impact of the testing and treatment decisions on the likelihood of a revisit within 28 days.
Methods
Study design
This was a retrospective cohort study of episodes of treatment for pediatric patients with pharyngitis. Episodes were identified using data derived from the Optum Insight Clinformatics claims database provided to the University of Southern California to facilitate the training of graduate students. These data cover commercially insured patients with both medical and pharmacy benefits. Data were retrieved from the 3-year period spanning 2011-2013. An episode of care was identified based on date of the first (index) outpatient visit for a pharyngitis diagnosis (International Classification of Diseases, Ninth Revision [ICD-9]: 462, 463, 034.0). Outpatient visits were defined by visit setting: ambulatory clinics, physician offices, emergency rooms, and urgent care facilities. Each pharyngitis treatment episode was then screened for at least a 6-month enrollment in a health insurance plan prior and subsequent to the index visit using Optum enrollment data. Finally, eligible treatment episodes were restricted to children and adolescents under 18 years of age, who had an index outpatient visit for a primary diagnosis of acute pharyngitis.
A diagnostic profile was created for each episode using the diagnoses recorded for the index visit. Up to 3 diagnoses may be recorded for any outpatient visit and the first recorded diagnosis was assumed to be the primary diagnosis for that episode. Any secondary diagnoses recorded on the index visit were used to define comorbidities present at the index visit. ARTI-related comorbidities included: acute otitis media (AOM), bronchitis, sinusitis, pneumonia, and upper respiratory infection (URI). Other comorbid medical diagnoses were documented using diagnostic data from the pre-index period. Dichotomous variables for the following categories were created: mental disorders, nervous system disorders, respiratory symptoms, fever, injury and poisoning, other, or no diseases.
Prior visits for other respiratory infections in the previous 90 days were also identified for patients based on their index visit for pharyngitis. Similarly, any subsequent visits, within 28 days of the index visit, were also recorded to measure the health outcome for analysis. Practice settings include physician offices and federally qualified health centers, state and local health clinics, outpatient hospitals facilities, emergency departments, and other outpatient settings such as walk-in retail health clinic or ambulatory centers. Providers include primary care physicians (family practice, pediatricians, internal medicine), specialty care physicians (emergency medicine, preventive medicine), nonphysician providers (nurse practitioners, physician assistants) and other providers (urgent care, acute outpatient care, ambulatory care centers). Seasons of the year were determined based on the index date of the episode to account for possible seasonality in pharyngitis treatment. Lastly, a previous visits variable was created to identify whether the child had nonpharyngitis ARTI visits in the 3 months prior to the index visit.
Demographic variables were created based on enrollment and the socioeconomic data available in the Optum socioeconomic status file. These variables include patient age, race, sex, household income, geographic location, practice setting type, provider specialty, and type of insurance. An estimate of patient household income was based on algorithms using census block groups. Income categories were informed by the federal guidelines for a family of 4. A low-income family was defined as earning less than $50 000; a middle-income family earned between $50 000 and $75 000, and a high-income family earned $75 000 and above.12 Patient insurance type was categorized as HMO, Exclusive Provider Organization (EPO), Point of Service (POS), and PPO. Race was identified as White, Black, Hispanic, and Asian. Patient location was defined according to national census regions.
Outcomes
GAS test
The HEDIS measures for pharyngitis recommend using the GAS test to identify the bacterial etiology of the pharyngitis infection. Patients who received the test were identified based on Current Procedural Terminology (CPT) codes 87070-71, 87081, 87430, 87650-52, and 87880.10
Antibiotic treatment
The pharmacy administrative claims dataset was used to identify study patients who filled a prescription for an antibiotic during their pharyngitis treatment episode. Optum pharmacy data identify the medications received, specifies the date of prescription filling, National Drug Codes, and American Hospital Formulary Service (AHFS) Classification System codes for each medication. We used the AHFS Pharmacologic-Therapeutic classification of antibiotics to create dichotomous variables documenting the antibacterial used by each patient.13 These are categorized under antibacterial including penicillins, cephalosporins (first, second, third, fourth generation cephalosporins), macrolides (first generation and others), tetracyclines, sulfonamides, fluoroquinolones (ciprofloxacin, levofloxacin, moxifloxacin), cephamycin, carbapenems, and β-lactam antibiotics (amoxicillin, amoxicillin/clavulanate, cephalexin, cefuroxime, cefdinir).
Revisits to physician or other provider
Revisits within 28 days were used as the measure of patient outcomes related to testing and filling of an antibiotic prescription for acute pharyngitis. Revisits may also be due to a patient returning for a follow-up, alternative treatment, worsening pharyngitis, or for another ARTI. An ARTI-related revisit also increases total resources used to treat pediatric pharyngitis patients.
Statistical analysis
Logistic regression was used for all 3 analyses conducted in this study. First, we determined the patient and treating physician characteristics that impact the decision to use GAS testing for pharyngitis. Second, we identified those factors that impact the decision to use antibiotic prescriptions among children who were diagnosed with pharyngitis adding in the dichotomous variable indicating if the patient had received a GAS test. Third, we used a logit regression analysis to document if receiving a GAS test and/or an antibiotic impacted the likelihood of a revisit by comparing revisit risk. To estimate the effect of testing and/or antibiotic use, we divided patients into 4 groups based on whether the patient received a GAS test and/or an antibiotic prescription. This specification of the analysis of revisits as an outcome focuses on adherence to HEDIS “test and treat” guidelines10:
- Patients who were not tested yet filled an antibiotic prescription. This decision was likely based on the clinician’s judgment of the patient’s signs and symptoms, and confirmational testing not performed.
- Patients who were not tested and did not fill an antibiotic prescription. Apparently, in the clinician’s judgment the patient’s signs and symptoms were such that the infection did not warrant treatment and the clinical presentation did not necessitate the GAS test to confirm the recorded diagnosis of pharyngitis.
- Patients who were tested and received antibiotic prescription, likely because the test was positive for GABHS.
- Patients who were tested and did not receive antibiotic prescription.
We tested for statistically significant differences in baseline characteristics across these 4 patient groups using t tests for continuous variables and χ2 tests for categorical variables. Odds ratios (OR) and CI were computed for the influential variables included the regression analyses.
We conducted a sensitivity analysis using a model specification which included the dichotomous variables for testing and for treatment, and the interaction term between these variables to assess if treatment effects varied in tested and untested patients. We also estimated this model of revisit risk using revisits within 7 days as the outcome variable.
All analyses were completed using STATA/IC 13 (StataCorp, College Station, TX).
Results
There were 24 685 treatment episodes for children diagnosed with pharyngitis. Nearly 47% of these episodes included GAS testing and 47% of the tested patients filled an antibiotic prescription. Similarly, 53% of patients were not tested and 49% of untested patients filled an antibiotic prescription. As a result, the 4 groups identified for analysis were evenly distributed: untested and no prescription (26.9%), untested and prescription (26.3%), tested and prescription (21.9%), and tested and no prescription (24.9%) (Figure).
Table 1 presents the descriptive statistics for these 4 patient groups. Note first that the rate of revisits within 28 days is under 5% across all groups. Second, the 2 tested groups have a lower revisit rate than the untested groups: the tested and treated have a revisit rate of 3.3%, and the tested and untreated have a revisit rate of 2.4%, while both the untested groups have a revisit rate of nearly 5%. These small absolute differences in revisit rates across groups were statistically significant.
Factors associated with receiving GAS test
Several factors were found to impact the decision to test (Table 2). Only 9.7% of children were reported to have any ARTI coinfection. As expected, these comorbidities resulted in a significantly lower likelihood of receiving the GAS test: AOM, bronchitis, sinusitis, pneumonia, and URI as comorbid infections had a 48%, 41%, 37%, 63%, and 13% lower likelihood of receiving the GAS test, respectively, than those with no comorbidities. Similarly, children with fever and respiratory symptoms were 35% and 45% less likely to receiving the GAS test, respectively. This is consistent with our expectation that comorbid ARTI infections will lead many providers to forgo testing.
Provider type and patient age also plays a role in receipt of the GAS test. Relative to outpatient facility providers, primary care physicians were 24% more likely and specialty physicians were 38% less likely of employing the GAS test. The child’s age played a significant role in receipt of the GAS test. Children aged 1 to 5 years and 5 to 12 years were 15% and 14% more likely to receive the test compared to children older than 12 years.
Pharyngitis patients have disproportionately higher odds of receiving a GAS test in most regions of the country compared to the Pacific region. For instance, children in the Mid-Atlantic region have 51% higher odds of receiving a GAS test while children in New England have 80% higher odds of receiving the same test.
Black children have 11% lower odds of receiving the GAS test compared to White children. Both middle-income and high-income children have 12% and 32% higher odds of receiving the test compared to low-income children. Compared to office-based visits, children visiting a clinic were twice as likely to receive a GAS test while those seen in the emergency room have 43% lower odds of receiving a GAS test. Hospital outpatient departments, which account for less than 1% of all visits, rarely used a GAS test which could be a statistical artifact due to small sample size. Lastly, insurance and season of the year had no significant impact of receipt of a GAS test.
Factors associated with receiving antibiotic prescription
Surprisingly, receiving the GAS test has a small but insignificant impact on the likelihood that the patient will receive an antibiotic prescription (Table 3) (Adjusted OR = 1.055, P = .07). After controlling for receipt of a GAS test, children with AOM and sinusitis comorbidities have an increased likelihood of being prescribed an antibiotic. Children with URI have a lower likelihood of being prescribed an antibiotic. Additionally, relative to primary care physicians, children visiting nonphysician providers for pharyngitis were more likely to be prescribed an antibiotic.
Children under 12 years of age were more likely to use an antibiotic compared to children 12 years and older. Geographically, there is some evidence of regional variation in antibiotic use as well. Children in the south Atlantic, west-south central, and southeast central regions had a significantly lower odds of being prescribed an antibiotic respectively than pharyngitis patients in the Pacific region. Black children had a 10% lower likelihood of being prescribed an antibiotic compared to White children, possibly related to their lower rate of GAS testing. Compared to office-based visits, children visiting a clinic were less likely to use an antibiotic. Household income, insurance type, and season had no significant impact on revisit risk.
Effects of GAS test and antibiotic prescriptions on likelihood of revisits
The multivariate analysis of the risk of a revisit within 28 days is presented in Table 4. Children with pharyngitis who tested and did not receive an antibiotic serve as the reference comparison group for this analysis to illustrate the impact of using the GAS test and treatment with an antibiotic. The results in Table 4 are quite clear: patients who receive the GAS test were significantly less likely to have a revisit within 28 days. Moreover, within the group of patients who were tested, those not receiving an antibiotic, presumedly because their GAS test was negative, experienced the lowest risk of a revisit. This result is consistent with the data in Table 1. Moreover, using an antibiotic had no impact on the likelihood of a revisit in patients not receiving the GAS test. This result is also consistent with Table 1.
Other results from the analysis of revisit risk may be of interest to clinicians. Pharyngitis patients with a prior episode of treatment within 90 days for an acute respiratory tract infection were more than 7 times more likely to experience a revisit within 28 days of the pharyngitis diagnosis than patients without a history of recent ARTI infections. Age is also a risk factor in likelihood of initiating a revisit. Children under 1 year and children aged 1 to 5 years were more likely to have a revisit than children aged more than 12 years. Compared to White children, Black children were 25% (P = .04) less likely to have a revisit. The care setting also has a significant impact on revisit risk. Children visiting outpatient hospital and other care settings had a significantly higher revisit risk than those visiting a physician’s office. Lastly, household income, geographic region, season, medical comorbidities, gender, and insurance type have no significant impact on revisit risk.
Sensitivity analysis
The results from the analysis of 7-day and 28-day revisit risk are summarized in Table 5. These results indicate that patients who were tested had a more significant decrease in revisit risk at 7 days (72%) than was evident at 28 days (47% reduction). Receiving an antibiotic, with or without the test, had no impact on revisit risk.
Discussion
Published data on revisits for pharyngitis are lacking with the concentration of prior research focused more on systemic complications of undertreated GABHS disease or on identifying carrier status. Our study results suggest that GAS testing is the most important factor in reducing revisit risk. Being prescribed an antibiotic, on its own, does not have a significant impact on the risk of a revisit. However, once the GAS test is used, the decision not to use an antibiotic was correlated with the lowest revisit rate, likely because the source of the pharyngitis infection was viral and more likely to resolve without a revisit. Prior studies have reported variable rates of testing among children with pharyngitis prescribed an antibiotic, ranging from 23% to 91%,14,15 with testing important toward more appropriate antibiotic use.16 More recently, among more than 67 000 patients aged 3 to 21 years presenting with sore throat and receiving a GAS test, 32.6% were positive.17
Our analysis found that more than 46% of pediatric pharyngitis patients were given the rapid GAS test. While this testing rate is substantially lower than HEDIS recommendations and lower than testing rates achieved by several health maintenance organizations,10 it is similar to the 53% of children receiving such testing in a recent National Ambulatory Medical Care Survey.18 Furthermore, we found that when antibiotics are prescribed following a GAS test, the revisit risk is not significantly reduced, possibly because antibiotics lower revisit risk when informed by diagnostic testing tools that determine the infectious organism. This is supported by a similar population analysis in which we observed reduced revisit rates in children with AOM managed with antibiotics within 3 days of index diagnosis.19
Several other factors also affect the likelihood of a child receiving the GAS test. Children aged 1 to 12 years were significantly more likely to receive the GAS test than children over the age of 12. This included children in the 1 to 5 years old bracket who had a 15% higher likelihood of undergoing a GAS test, despite children less than 3 years of age as not recommended targets for GAS testing.20 As expected, children with reported ARTI-associated comorbidities were also less likely to receive a GAS test. Additionally, specialty care physicians were less inclined to implement the GAS test, possibly because of diagnostic confidence without testing or referral after GAS was ruled out. Black and low-income children had statistically lower odds of receiving the test, even after controlling for other factors, and yet were less likely to consume a revisit. As the overall data suggested more revisits in those not tested, further study is needed to examine if race or income discrepancies are equity based. Finally, children in the Pacific region, compared to the rest of the nation, were the least likely to receive a GAS test and yet there were no significant differences in revisit rates by region. Regional differences in antibiotic use were also observed in our study, as has been seen by others.21
After statistically controlling for having received the diagnostic GAS test and filled a prescription for an antibiotic, there are multitude of factors that independently affect the revisit risk, the most important of which if which was a history of an ARTI infection in the prior 90 days. While prior visit history had no impact on the likelihood of being tested or filling an antibiotic, patients with prior visits were more than 7 times more likely to consume a revisit. This was not reflected in nor related to comorbid ARTIs as these patients did not have statistically higher revisits than those with pharyngitis as the sole-coded diagnosis. Moreover, speculation for bacterial etiology of primary or superinfection based on a recent history of ARTI accounting for revisits seems unlikely as it did not yield greater antibiotic use in that group. Further analysis is required to determine the clinical and behavioral factors that promote for prior ARTI history as a major factor in revisit risk after an index visit for pharyngitis.
Children aged between 1 and 5 years, though 15% more likely to be tested than those aged 12 through 17 years, were also 39% more likely to initiate a revisit compared to older children when statistically controlling for other covariates. This perhaps suggests longer illness, wrong diagnosis, delay in appropriate treatment, or more caution by parents and providers in this age group. Justification for testing children less than 3 years of age who are outside of the HEDIS suggested age group, when clinical judgement does not point to another infection source, can result in positivity rates between 22% and 30% as previously observed.22,23 Patients visiting nonphysician providers and outpatient facility providers were less likely to have a revisit than those visiting primary and specialty care physicians, though slightly higher propensity for antibiotic prescriptions was seen for nonphysician providers. Pediatricians have been noted to be less likely to prescribe antibiotics without GAS testing than nonpediatric providers, and more guidelines-compliant in prescribing.24
Recommendations to not test children under 3 years of age are based on the lack of acute rheumatic fever and other complications in this age group together with more frequent viral syndromes. Selectivity in applying clinical criteria to testing can be attempted to separate bacterial from viral illness. Postnasal drainage/rhinorrhea, hoarse voice, and cough have been used successfully to identify those with viral illness and less need for testing, with greater certainty of low risk for GABHS in those over 11 years of age without tonsillar exudates, cervical adenopathy, or fever.17 However, the marginal benefits of those who have all 3 features of viral illness versus none in identifying GAS positivity was 23.3% vs 37.6% - helpful, but certainly not diminishing the need for testing. These constitutional findings of viral URI also do not exclude the GAS carrier state that features these symptoms.25 Others have reinforced the doubt of pharyngeal exudates as the premier diagnostic finding for test-positive GAS.26
This study had several limitations. The Optum claims dataset only contains ICD-9 codes for diagnoses. It does not include data on infection severity and clinical findings related to symptoms, thus empiric treatment warranted based in clinical severity is not assessed. Antibiotics are commonly available as generics and very inexpensive. Patients may fill and pay for these prescriptions directly, in which case, a claim for payment may not be filed with Optum. This could result in an undercount of treated patients in our study.
There is no corresponding problem of missing medical claims for GAS testing which were obtained from the CPT codes within the Optum claims data set. However, we elected not to verify the test results due to these data being missing for 75% of the study population. Nevertheless, this study’s focus was less about justifying antibiotic treatment, but dealt with the outcomes generated by testing and treatment. Toward that end, we used CPT codes to identify a revisit, and while those can at times be affected by financial reimbursement incentives, differences related to revisits in the 4 patient groups should not be subject to bias.
Conclusion
This study used data from real world practices to document the patterns of GAS testing and antibiotic use in pediatric pharyngitis patients. Revisit rates were under 5% for all patient groups and the use of rapid diagnostic tools were found to be the determining factor in further reducing the risk of revisits. This supports the need for compliance with the HEDIS quality metric for pharyngitis to the recommended levels of rapid testing which have been falling in recent years. Use of more accurate antigen and newer molecular detection testing methods may help further delineate important factors in determining pediatric pharyngitis treatment and need for revisits.27
Corresponding author: Jeffrey McCombs, MD, University of Southern California School of Pharmacy, Department of Pharmaceutical and Health Economics, Leonard D. Schaeffer Center for Health Policy & Economics, 635 Downey Way, Verna & Peter Dauterive Hall 310, Los Angeles, CA 90089-3333; jmccombs@usc.edu.
Financial disclosures: None.
1. Choby BA. Diagnosis and treatment of streptococcal pharyngitis. Am Fam Physician. 2009;79(5):383-390.
2. Briel M, Schuetz P, Mueller B, et al. Procalcitonin-guided antibiotic use vs a standard approach for acute respiratory tract infections in primary care. Arch of Intern Med. 2008;168(18):2000-2008. doi: 10.1001/archinte.168.18.2000
3. Maltezou HC, Tsagris V, Antoniadou A, et al. Evaluation of a rapid antigen detection test in the diagnosis of streptococcal pharyngitis in children and its impact on antibiotic prescription. J Antimicrob Chemother. 2008;62(6):1407-1412. doi: 10.1093/jac/dkn376
4. Neuner JM, Hamel MB, Phillips RS, et al. Diagnosis and management of adults with pharyngitis: a cost-effectiveness analysis. Ann Intern Med. 2003;139(2):113-122. doi:10.7326/0003-4819-139-2-200307150-00011
5. Gerber MA, Baltimore RS, Eaton CB, et al. Prevention of rheumatic fever and diagnosis and treatment of acute Streptococcal pharyngitis: a scientific statement from the American Heart Association Rheumatic Fever, Endocarditis, and Kawasaki Disease Committee of the Council on Cardiovascular Disease in the Young, the Interdisciplinary Council on Functional Genomics and Translational Biology, and the Interdisciplinary Council on Quality of Care and Outcomes Research: endorsed by the American Academy of Pediatrics. Circulation. 2009;119(11):1541-1551. doi: 10.1161/CIRCULATIONAHA.109.191959
6. Gieseker KE, Roe MH, MacKenzie T, Todd JK. Evaluating the American Academy of Pediatrics diagnostic standard for Streptococcus pyogenes pharyngitis: backup culture versus repeat rapid antigen testing. Pediatrics. 2003;111(6):e666-e670. doi: 10.1542/peds.111.6.e666
7. Shapiro DJ, Lindgren CE, Neuman MI, Fine AM. Viral features and testing for Streptococcal pharyngitis. Pediatrics. 2017;139(5):e20163403. doi: 10.1542/peds.2016-3403
8. Shulman ST, Bisno AL, Clegg H, et al. Clinical practice guideline for the diagnosis and management of group A Streptococcal pharyngitis: 2012 update by the Infectious Diseases Society of America. Clin Infect Dis. 2012;55(10):e86–e102. doi: 10.1093/cid/cis629
9. Mangione-Smith R, McGlynn EA, Elliott MN, et al. Parent expectations for antibiotics, physician-parent communication, and satisfaction. Arch Pediatr Adolesc Med. 2001;155(7):800–806. doi: 10.1001/archpedi.155.7.800
10. Appropriate Testing for Children with Pharyngitis. HEDIS Measures and Technical Resources. National Committee for Quality Assurance. Accessed February 12, 2021. https://www.ncqa.org/hedis/measures/appropriate-testing-for-children-with-pharyngitis/
11. Linder JA, Bates DW, Lee GM, Finkelstein JA. Antibiotic treatment of children with sore throat. JAMA. 2005;294(18):2315-2322. doi: 10.1001/jama.294.18.2315
12. Crimmel BL. Health Insurance Coverage and Income Levels for the US Noninstitutionalized Population Under Age 65, 2001. Medical Expenditure Panel Survey, Agency for Healthcare Research and Quality. 2004. https://meps.ahrq.gov/data_files/publications/st40/stat40.pd
13. AHFS/ASHP. American Hospital Formulary Service Drug Information. 2012. AHFS drug information. 00--. Accessed January 4, 2021.
14. Mainous AG 3rd, Zoorob, RJ, Kohrs FP, Hagen MD. Streptococcal diagnostic testing and antibiotics prescribed for pediatric tonsillopharyngitis. Pediatr Infect Dis J. 1996;15(9):806-810. doi: 10.1097/00006454-199609000-00014
15. Benin AL, Vitkauskas G, Thornquist E, et al. Improving diagnostic testing and reducing overuse of antibiotics for children with pharyngitis: a useful role for the electronic medical record. Pediatr Infect Dis J. 2003;22(12):1043-1047. doi: 10.1097/01.inf.0000100577.76542.af
16. Luo R, Sickler J, Vahidnia F, et al. Diagnosis and Management of Group a Streptococcal Pharyngitis in the United States, 2011-2015. BMC Infect Dis. 2019;19(1):193-201. doi: 10.1186/s12879-019-3835-4
17. Shapiro DJ, Barak-Corren Y, Neuman MI, et al. Identifying Patients at Lowest Risk for Streptococcal Pharyngitis: A National Validation Study. J Pediatr. 2020;220:132-138.e2. doi: 10.1016/j.jpeds.2020.01.030. Epub 2020 Feb 14
18. Shapiro DJ, King LM, Fleming-Dutra KE, et al. Association between use of diagnostic tests and antibiotic prescribing for pharyngitis in the United States. Infect Control Hosp Epidemiol. 2020;41(4):479-481. doi: 10.1017/ice.2020.29
19. Sangha K, Steinberg I, McCombs JS. The impact of antibiotic treatment time and class of antibiotic for acute otitis media infections on the risk of revisits. Abs PDG4. Value in Health. 2019; 22:S163.
20. Ahluwalia T, Jain S, Norton L, Meade J, et al. Reducing Streptococcal Testing in Patients < 3 Years Old in an Emergency Department. Pediatrics. 2019;144(4):e20190174. doi: 10.1542/peds.2019-0174
21. McKay R, Mah A, Law MR, et al. Systematic Review of Factors Associated with Antibiotic Prescribing for Respiratory Tract Infections. Antimicrob Agents Chemother. 2016;60(7):4106-4118. doi: 10.1128/AAC.00209-16
22. Woods WA, Carter CT, Schlager TA. Detection of group A streptococci in children under 3 years of age with pharyngitis. Pediatr Emerg Care. 1999;15(5):338-340. doi: 10.1097/00006565-199910000-00011
23. Mendes N, Miguéis C, Lindo J, et al. Retrospective study of group A Streptococcus oropharyngeal infection diagnosis using a rapid antigenic detection test in a paediatric population from the central region of Portugal. Eur J Clin Microbiol Infect Dis. 2021;40(6):1235-1243. doi: 10.1007/s10096-021-04157-x
24. Frost HM, McLean HQ, Chow BDW. Variability in Antibiotic Prescribing for Upper Respiratory Illnesses by Provider Specialty. J Pediatr. 2018;203:76-85.e8. doi: 10.1016/j.jpeds.2018.07.044.
25. Rick AM, Zaheer HA, Martin JM. Clinical Features of Group A Streptococcus in Children With Pharyngitis: Carriers versus Acute Infection. Pediatr Infect Dis J. 2020;39(6):483-488. doi: 10.1097/INF.0000000000002602
26. Nadeau NL, Fine AM, Kimia A. Improving the prediction of streptococcal pharyngitis; time to move past exudate alone [published online ahead of print, 2020 Aug 16]. Am J Emerg Med. 2020;S0735-6757(20)30709-9. doi: 10.1016/j.ajem.2020.08.023
27. Mustafa Z, Ghaffari M. Diagnostic Methods, Clinical Guidelines, and Antibiotic Treatment for Group A Streptococcal Pharyngitis: A Narrative Review. Front Cell Infect Microbiol. 2020;10:563627. doi: 10.3389/fcimb.2020.563627
Cost Comparison of 2 Video Laryngoscopes in a Large Academic Center
From the Department of Anesthesiology, Thomas Jefferson University and Hospitals, Sidney Kimmel Medical College, Philadelphia, PA, and Sidney Kimmel Medical College at Thomas Jefferson University, Philadelphia, PA.
Objective: Retrospective study examining hospital cost information of patients requiring endotracheal intubation with video laryngoscopy. Provide a practical cost assessment on use of the McGRATH and GlideScope video laryngoscopes (VLs).
Methods: This study examined 52 hospital locations within a single, large university hospital, with most of those locations being hospital operating rooms. A total of 34 600 endotracheal intubations performed over 24 months, of which 11 345 were video laryngoscopies. Electronic medical records containing demographic data and information related to endotracheal intubation procedures, with monthly breakdowns between GlideScope and McGRATH intubations, were reviewed. Cost information calculated for equipment, blades, batteries, repairs, and subsequent analysis performed to determine cost differences between those 2 instruments during the COVID-19 period.
Results: A total of 5501 video laryngoscopy procedures were performed using the McGRATH VL and 5305 were performed using the GlideScope VL. Costs over 24 months were $181 093 lower (55.5%) for McGRATH compared to GlideScope. The mean (SD) monthly costs for GlideScope blades were $3837 ($1050) and $3236 ($538) for years 1 and 2, respectively, vs $1652 ($663) and $2933 ($585) for McGRATH blades (P < .001). Most total cost differences were attributed to equipment and blade purchases, which were $202 595 (65.0%) higher for GlideScope. During the COVID-19 period, the use of the McGRATH increased to 61% of all video laryngoscopy cases, compared to 37% for GlideScope (P < .001). Blade cost difference for the COVID-19 period was $128 higher for the McGRATH even though 293 more intubations were performed with that device.
Conclusions: Use of the McGRATH resulted in a cost savings of 55% compared to the GlideScope, and its use was highest during the COVID-19 period, which may be explained by its more portable and practical features.
Keywords: video laryngoscope; McGRATH; GlideScope; endotracheal intubation; hospital costs; COVID-19.
Hospitals have come to rely on video laryngoscopes (VLs) for tracheal intubation as necessary tools for better visualization of airways. Modern video laryngoscopy developed in the 2000s1 as a progression from direct laryngoscopy, which began in 1852 when Horace Green used a bent tongue spatula and sunlight to examine a child.2 VLs have seen many improvements and adaptations of their own, resulting in many different styles and types circulating around hospitals. The GlideScope (Verathon Inc, Bothell, WA) and the McGRATH (Medtronic, Minneapolis, MN) are examples of such instruments, which are now widely used in the US and are the 2 VLs of choice at our institution.
A few studies have compared VLs to direct laryngoscopes. In their systematic review, Lewis et al have shown the numerous benefits of using a VL over a direct laryngoscope. Some general conclusions were that the use of video laryngoscopy reduced the number of failed intubations, decreased laryngeal trauma, and provided improved visualizations.3 Other studies have compared the different types of VLs, including the McGRATH and the GlideScope, examining factors such as intubation time and display quality of the image. Two studies found that medical students were equally successful at using both the McGRATH and the GlideScope,4,5 while another study found that care providers using the GlideScope had quicker intubation times.6 Lastly, Savoldelli et al concluded that more providers preferred the McGRATH, which provided better laryngeal views,7 while their subsequent study showed more favorable learning curves of the Airtraq compared to the McGRATH and other VLs.8
Although there have been no reported differences in safety and effectiveness of the McGRATH and GlideScope devices, cost data on the use of these 2 popular laryngoscopes are lacking. Such information is important considering the increasing costs of medical technologies and the significant financial losses experienced by health care systems due to the COVID-19 crisis. The purpose of this retrospective cohort study was to compare the cost efficiency of the McGRATH MAC and GlideScope Core VLs at a large academic center.
Methods
This retrospective study was performed under exemption from the Thomas Jefferson University Institutional Review Board. The primary data sources consisted of hospital electronic patient records (EPIC) and cost information from the device manufacturers and hospital staff. The electronic patient data were provided by the EPIC Enterprise Analytics Business Intelligence group at Thomas Jefferson University Hospital (Center City Campus, Philadelphia, PA), while device costs were obtained from Verathon, Medtronic, and departmental staff responsible for purchasing equipment. Monthly data were obtained over a 24-month period (June 2018 through May 2020) when the McGRATH VL was placed into use in the department of anesthesiology. The 2 types of VLs were made available for use in a total of 52 locations, with the majority being hospital operating rooms.
The following variables were recorded: number of endotracheal intubations performed each month with breakdown between video laryngoscopy and flexible bronchoscopy airways, frequency of use for each type of laryngoscope, blades used, and equipment costs for use of each laryngoscope. Hospital cost estimates for both the McGRATH and GlideScope laryngoscopes included batteries, handles, blades, and the devices themselves. Cost data were also collected on frequency of device failure, maintenance, and replacement of parts and lost equipment.
Analysis
De-identified electronic medical records consisted of nominal and quantitative variables, with demographic data and information related to the endotracheal intubation procedure. All data were in chronological order and sorted by date after which coding was applied, to identify device type and allocate pertinent cost information. Descriptive statistics were reported as mean (SD) and sum for costs; frequency tables were generated for intubation procedures according to device type and time periods. Data were analyzed using the χ2 test, the student t test, and the Wilcoxon Mann-Whitney U test, with a P value set at .05 for statistical significance. SPSS version 26 and GraphPad Prism version 6 were used for all statistical analyses.
Results
A total of 34 600 endotracheal intubations were performed over the 24-month study period, and 11 345 (32.8%) were video laryngoscopy procedures. Out of all video laryngoscopy procedures, 5501 (48.5%) were performed using the McGRATH VL and 5305 (46.8%) were conducted using the GlideScope VL. The difference of 539 (4.8%) cases accounts for flexible bronchoscopy procedures and endotracheal intubations using other video laryngoscopy equipment. The mean (SD) monthly number of video laryngoscopy procedures for the 24 months was 221 (54) and 229 (89) for the GlideScope and McGRATH devices, respectively. Monthly endotracheal intubation distributions over 24 months trended upward for the McGRATH VL and downward for the GlideScope, but there was no statistically significant (P = .71) difference in overall use between the 2 instruments (Figure 1).
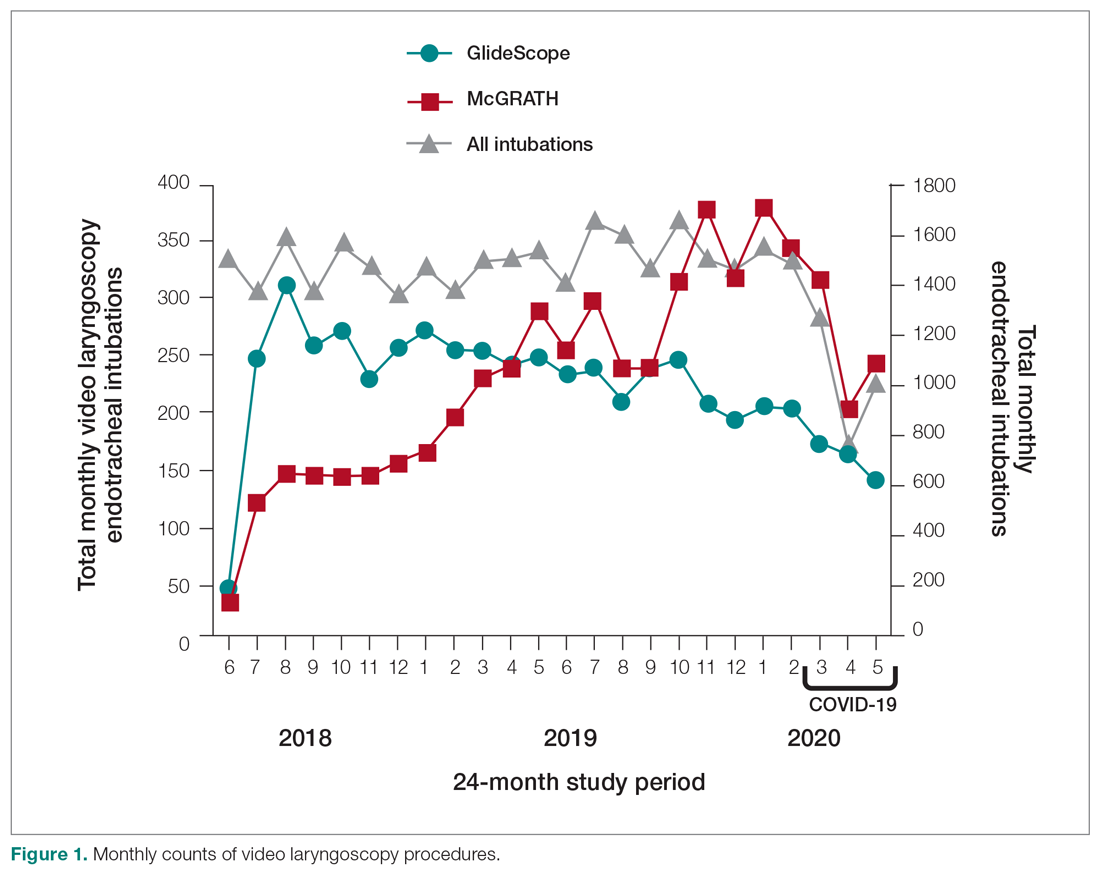
To examine the observed usage trends between the 2 VL during the first and last 12 months, a univariate ANOVA was conducted with the 2 time periods entered as predictors in the model. Video laryngoscopy intubations were performed (P = .001) more frequently with the GlideScope during the first 12 months; however, use of the McGRATH VL increased (P < .001) during the following 12 months compared to GlideScope. The GlideScope accounted for 54% of all VL intubations during the first 12 months, with the McGRATH accounting for 58% of all video laryngoscopy procedures for months 12 to 24. Additionally, the increase in video laryngoscopy procedures with the McGRATH during the last 3 months of the study period was despite an overall reduction in surgical volume due to the COVID-19 crisis, defined for this study as March 1, 2020, to May 31, 2020 (Figure 1). There was a statistically significant (P < .001) difference in the case distribution between use of the McGRATH and GlideScope VL for that period. The anesthesia personnel’s use of the McGRATH VL increased to 61% of all video laryngoscopy cases, compared to 37% for the GlideScope (Figure 2).
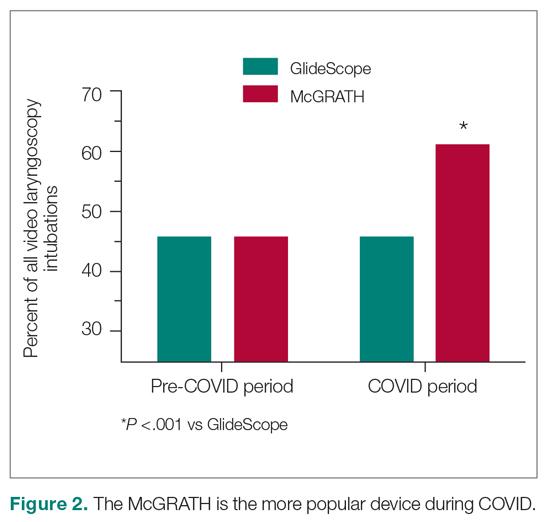
The total costs calculated for equipment, blades, and repairs are presented in Table 1 and yearly total costs are shown in Figure 3. Overall costs were $181 093 lower (55.5%) for the McGRATH VL compared to the GlideScope over the 24-month period. The mean (SD) monthly costs for GlideScope VL blades were $3837 ($1050) and $3236 ($538) for years 1 and 2, respectively, vs $1652 ($663) and $2933 ($585) for the McGRATH VL blades. Most of the total cost differences were attributed to equipment and blade purchases, which were $202 595 (65.0%) higher for the GlideScope compared to the McGRATH VL. The monthly blade costs alone were higher (P < .001) for the GlideScope over the 2-year period; however, the McGRATH VL required use of disposable stylets at a cost of $10 177 for all endotracheal intubations, compared to $700 for the GlideScope device.
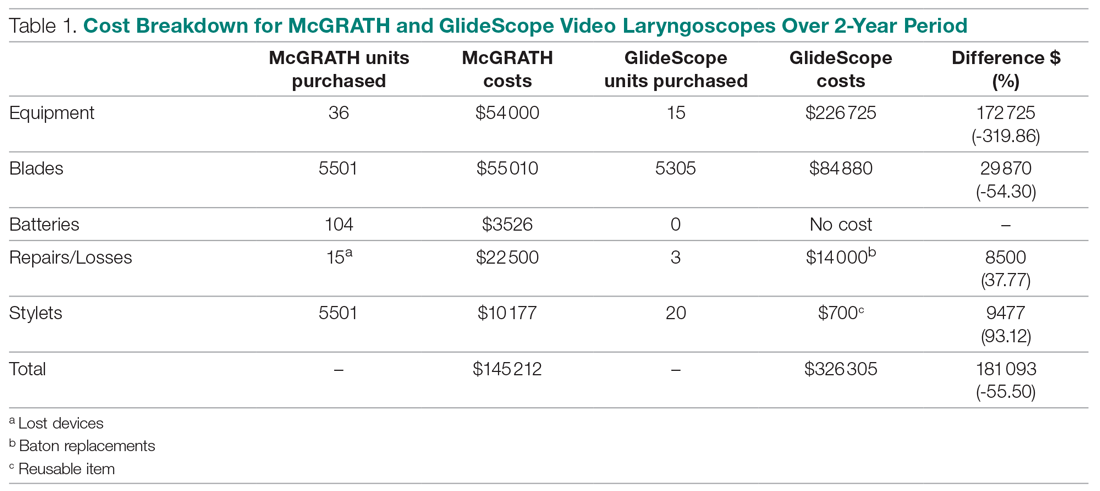
An analysis was performed to determine whether costs differed between those 2 instruments during the COVID-19 period. There was a statistically significant (P < .001) difference in the case distribution between use of the McGRATH and GlideScope VLs during that period. The calculated blade cost difference for the COVID period was $128 higher for the McGRATH even though 293 more intubations were performed with that device (Table 2).
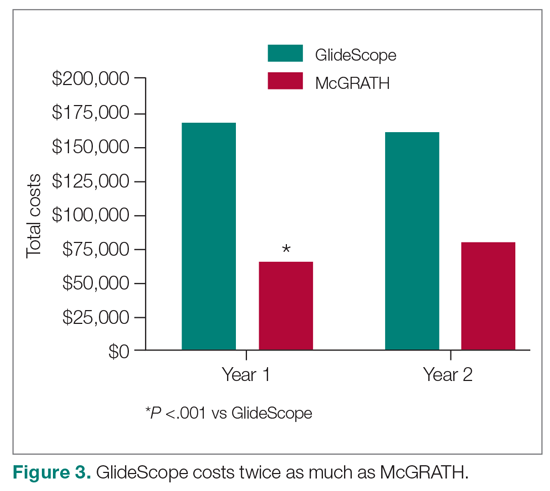
Discussion
We attempted to provide useful cost estimates by presenting pricing data reflecting the approximate cost that most large institutional anesthesia practices would incur for using those 2 specific devices and related peripherals. The main findings of our analysis showed that use of the McGRATH MAC VL resulted in a 55% cost savings compared to the GlideScope, with a similar number of cases performed with each device over the 24-month study period. We believe this represents a substantial savings to the department and institution, which has prompted internal review on the use of video laryngoscopy equipment. None of the McGRATH units failed; however, the GlideScope required 3 baton replacements.
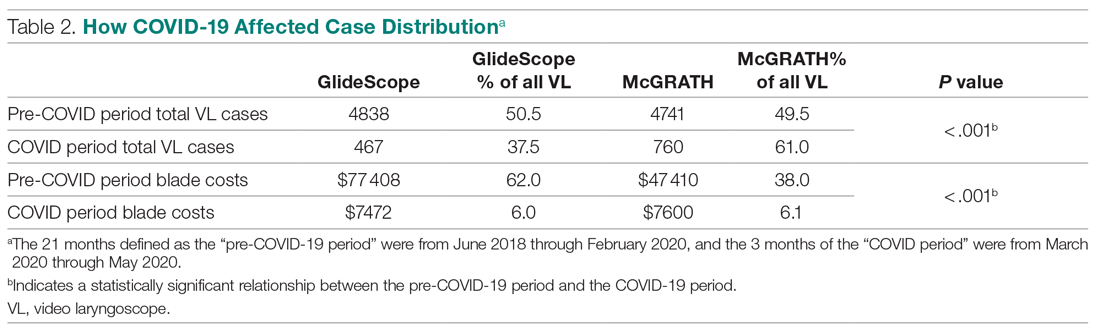
Of note, use of the McGRATH MAC increased during the COVID-19 period, which may be explained by the fact that the operators found it to be a more portable device. Several physicians in the department commented that its smaller size made the McGRATH MAC more practical during the time when a plexiglass box was being used around the patient’s head to shield the intubator from aerosolized viral particles.
Although this study demonstrated the cost-saving value of the McGRATH over the GlideScope, a suggested next step would be to examine resource utilization related to video laryngoscopy use. The more dynamic tracking of the use of these devices should facilitate the assessment of existing related resources and decision making, to optimize the benefits of this initiative. We would anticipate reduced use of anesthesia personnel, such as technicians to assist with the management of this device which could be significant. As new respiratory viruses are appearing each year, video laryngoscopy will continue to gain increasing use in operating rooms and acute care locations. The adding of protective barriers between patients and providers calls for use of the most practical and effective VL devices, to protect personnel who are at high risk of contamination from airway secretions and aerosolized particles.9,10
The COVID-19 pandemic has demonstrated the value of anesthesiology in regards to analyzing and finding solutions to effectively manage infected patients or those suspected of infection in the perioperative environment. Inexpensive products are often avoided because cheaper devices are associated with being of lower quality. However, the association with cost and quality—and the assumption that a higher price is positively correlated with higher quality—is overall inconsistent in the medical literature.11 A more effective or higher quality treatment does not necessarily cost more and may actually end up costing less,12 as was the case in this study. We have been able to directly cut departmental expenses by using a more efficient and cost-effective device for intubations, without compromising safety and efficacy. Future studies should determine whether this significant reduction in costs from video laryngoscopy intubations with the McGRATH VL will be sustained across anesthesiology departments in the Jefferson Health Enterprise Hospitals, or other health systems, as well as its impact on workflow and personnel resources.
This analysis was restricted to one of the campuses of the Jefferson Health Enterprise. However, this is the largest anesthesia practice, encompassing several locations, which should reflect the general practice patterns across other anesthesiology departments in this large institution. The costs for the devices and peripherals may vary across anesthesia practices depending on volume and contracts negotiated with the suppliers. It was not possible to estimate this variability, which could change the total costs by a few percentage points. We recognize that there may be other costs associated with securing the McGRATH VL to prevent loss from theft or misplacement, which were not included in the study. Lastly, the inability to obtain randomized samples for the 2 groups treated with each device opens up the possibility of selection bias. There were, however, multiple intubators who were free to select 1 of the devices for endotracheal intubation, which may have reduced the effect of selection bias.
Conclusion
This study demonstrated that over a 24-month period use of the McGRATH MAC VL resulted in a cost reduction of around 55% compared to using the GlideScope for endotracheal intubation procedures performed at a major academic center. Over the first 3 months of the COVID-19 crisis, which our study included, use of the McGRATH VL increased while GlideScope use decreased. This was most likely related to the portability and smaller size of the McGRATH, which better facilitated intubations of COVID-19 patients.
Acknowledgements: The authors thank Craig Smith, Senior Anesthesia Technician, for his assistance with the cost information and excellent record-keeping related to the use of video laryngoscopes.
Corresponding author: Marc C. Torjman, PhD, Professor, Department of Anesthesiology, Sidney Kimmel Medical College at Thomas Jefferson University, 111 South 11th St, Suite G-8290, Philadelphia, PA 19107; Marc.Torjman@Jefferson.edu.
Financial disclosures: Dr. Thaler has served as a consultant for Medtronic since September 2020. He has participated in 2 webinars on the routine use of video laryngoscopy.
Funding: This study was supported by the Department of Anesthesiology at Thomas Jefferson University.
1. Channa AB. Video laryngoscopes. Saudi J Anaesth. 2011;5(4):357-359.
2. Pieters BM, Eindhoven GB, Acott C, Van Zundert AAJ. Pioneers of laryngoscopy: indirect, direct and video laryngoscopy. Anaesth Intensive Care. 2015;43(suppl):4-11.
3. Lewis SR, Butler AR, Parker J, et al. Videolaryngoscopy versus direct laryngoscopy for adult patients requiring tracheal intubation. Cochrane Database Syst Rev. 2016;11(11):CD011136.
4. Kim W, Choi HJ, Lim T, Kang BS. Can the new McGrath laryngoscope rival the GlideScope Ranger portable video laryngoscope? A randomized manikin study. Am J Emerg Med. 2014;32(10):1225-1229.
5. Kim W, Choi HJ, Lim T, et al. Is McGrath MAC better than Glidescope Ranger for novice providers in the simulated difficult airway? A randomized manikin study. Resuscitation. 2014;85(suppl 1):S32.
6. Jeon WJ, Kim KH, Yeom JH, et al. A comparison of the Glidescope to the McGrath videolaryngoscope in patients. Korean J Anesthesiol. 2011;61(1):19-23.
7. Savoldelli GL, Schiffer E, Abegg C, et al. Comparison of the Glidescope, the McGrath, the Airtraq and the Macintosh laryngoscopes in simulated difficult airways. Anaesthesia. 2008;63(12):1358-1364.
8. Savoldelli GL, Schiffer E, Abegg C, et al. Learning curves of the Glidescope, the McGrath and the Airtraq laryngoscopes: a manikin study. Eur J Anaesthesiol. 2009;26(7):554-558.
9. Schumacher J, Arlidge J, Dudley D, et al. The impact of respiratory protective equipment on difficult airway management: a randomised, crossover, simulation study. Anaesthesia. 2020;75(10):1301-1306.
10. De Jong A, Pardo E, Rolle A, et al. Airway management for COVID-19: a move towards universal videolaryngoscope? Lancet Respir Med. 2020;8(6):555.
11. Hussey PS, Wertheimer S, Mehrotra A. The association between health care quality and cost: a systematic review. Ann Intern Med. 2013;158(1):27-34.
12. Mitton C, Dionne F, Peacock S, Sheps S. Quality and cost in healthcare: a relationship worth examining. Appl Health Econ Health Policy. 2006;5(4):201-208.
From the Department of Anesthesiology, Thomas Jefferson University and Hospitals, Sidney Kimmel Medical College, Philadelphia, PA, and Sidney Kimmel Medical College at Thomas Jefferson University, Philadelphia, PA.
Objective: Retrospective study examining hospital cost information of patients requiring endotracheal intubation with video laryngoscopy. Provide a practical cost assessment on use of the McGRATH and GlideScope video laryngoscopes (VLs).
Methods: This study examined 52 hospital locations within a single, large university hospital, with most of those locations being hospital operating rooms. A total of 34 600 endotracheal intubations performed over 24 months, of which 11 345 were video laryngoscopies. Electronic medical records containing demographic data and information related to endotracheal intubation procedures, with monthly breakdowns between GlideScope and McGRATH intubations, were reviewed. Cost information calculated for equipment, blades, batteries, repairs, and subsequent analysis performed to determine cost differences between those 2 instruments during the COVID-19 period.
Results: A total of 5501 video laryngoscopy procedures were performed using the McGRATH VL and 5305 were performed using the GlideScope VL. Costs over 24 months were $181 093 lower (55.5%) for McGRATH compared to GlideScope. The mean (SD) monthly costs for GlideScope blades were $3837 ($1050) and $3236 ($538) for years 1 and 2, respectively, vs $1652 ($663) and $2933 ($585) for McGRATH blades (P < .001). Most total cost differences were attributed to equipment and blade purchases, which were $202 595 (65.0%) higher for GlideScope. During the COVID-19 period, the use of the McGRATH increased to 61% of all video laryngoscopy cases, compared to 37% for GlideScope (P < .001). Blade cost difference for the COVID-19 period was $128 higher for the McGRATH even though 293 more intubations were performed with that device.
Conclusions: Use of the McGRATH resulted in a cost savings of 55% compared to the GlideScope, and its use was highest during the COVID-19 period, which may be explained by its more portable and practical features.
Keywords: video laryngoscope; McGRATH; GlideScope; endotracheal intubation; hospital costs; COVID-19.
Hospitals have come to rely on video laryngoscopes (VLs) for tracheal intubation as necessary tools for better visualization of airways. Modern video laryngoscopy developed in the 2000s1 as a progression from direct laryngoscopy, which began in 1852 when Horace Green used a bent tongue spatula and sunlight to examine a child.2 VLs have seen many improvements and adaptations of their own, resulting in many different styles and types circulating around hospitals. The GlideScope (Verathon Inc, Bothell, WA) and the McGRATH (Medtronic, Minneapolis, MN) are examples of such instruments, which are now widely used in the US and are the 2 VLs of choice at our institution.
A few studies have compared VLs to direct laryngoscopes. In their systematic review, Lewis et al have shown the numerous benefits of using a VL over a direct laryngoscope. Some general conclusions were that the use of video laryngoscopy reduced the number of failed intubations, decreased laryngeal trauma, and provided improved visualizations.3 Other studies have compared the different types of VLs, including the McGRATH and the GlideScope, examining factors such as intubation time and display quality of the image. Two studies found that medical students were equally successful at using both the McGRATH and the GlideScope,4,5 while another study found that care providers using the GlideScope had quicker intubation times.6 Lastly, Savoldelli et al concluded that more providers preferred the McGRATH, which provided better laryngeal views,7 while their subsequent study showed more favorable learning curves of the Airtraq compared to the McGRATH and other VLs.8
Although there have been no reported differences in safety and effectiveness of the McGRATH and GlideScope devices, cost data on the use of these 2 popular laryngoscopes are lacking. Such information is important considering the increasing costs of medical technologies and the significant financial losses experienced by health care systems due to the COVID-19 crisis. The purpose of this retrospective cohort study was to compare the cost efficiency of the McGRATH MAC and GlideScope Core VLs at a large academic center.
Methods
This retrospective study was performed under exemption from the Thomas Jefferson University Institutional Review Board. The primary data sources consisted of hospital electronic patient records (EPIC) and cost information from the device manufacturers and hospital staff. The electronic patient data were provided by the EPIC Enterprise Analytics Business Intelligence group at Thomas Jefferson University Hospital (Center City Campus, Philadelphia, PA), while device costs were obtained from Verathon, Medtronic, and departmental staff responsible for purchasing equipment. Monthly data were obtained over a 24-month period (June 2018 through May 2020) when the McGRATH VL was placed into use in the department of anesthesiology. The 2 types of VLs were made available for use in a total of 52 locations, with the majority being hospital operating rooms.
The following variables were recorded: number of endotracheal intubations performed each month with breakdown between video laryngoscopy and flexible bronchoscopy airways, frequency of use for each type of laryngoscope, blades used, and equipment costs for use of each laryngoscope. Hospital cost estimates for both the McGRATH and GlideScope laryngoscopes included batteries, handles, blades, and the devices themselves. Cost data were also collected on frequency of device failure, maintenance, and replacement of parts and lost equipment.
Analysis
De-identified electronic medical records consisted of nominal and quantitative variables, with demographic data and information related to the endotracheal intubation procedure. All data were in chronological order and sorted by date after which coding was applied, to identify device type and allocate pertinent cost information. Descriptive statistics were reported as mean (SD) and sum for costs; frequency tables were generated for intubation procedures according to device type and time periods. Data were analyzed using the χ2 test, the student t test, and the Wilcoxon Mann-Whitney U test, with a P value set at .05 for statistical significance. SPSS version 26 and GraphPad Prism version 6 were used for all statistical analyses.
Results
A total of 34 600 endotracheal intubations were performed over the 24-month study period, and 11 345 (32.8%) were video laryngoscopy procedures. Out of all video laryngoscopy procedures, 5501 (48.5%) were performed using the McGRATH VL and 5305 (46.8%) were conducted using the GlideScope VL. The difference of 539 (4.8%) cases accounts for flexible bronchoscopy procedures and endotracheal intubations using other video laryngoscopy equipment. The mean (SD) monthly number of video laryngoscopy procedures for the 24 months was 221 (54) and 229 (89) for the GlideScope and McGRATH devices, respectively. Monthly endotracheal intubation distributions over 24 months trended upward for the McGRATH VL and downward for the GlideScope, but there was no statistically significant (P = .71) difference in overall use between the 2 instruments (Figure 1).
To examine the observed usage trends between the 2 VL during the first and last 12 months, a univariate ANOVA was conducted with the 2 time periods entered as predictors in the model. Video laryngoscopy intubations were performed (P = .001) more frequently with the GlideScope during the first 12 months; however, use of the McGRATH VL increased (P < .001) during the following 12 months compared to GlideScope. The GlideScope accounted for 54% of all VL intubations during the first 12 months, with the McGRATH accounting for 58% of all video laryngoscopy procedures for months 12 to 24. Additionally, the increase in video laryngoscopy procedures with the McGRATH during the last 3 months of the study period was despite an overall reduction in surgical volume due to the COVID-19 crisis, defined for this study as March 1, 2020, to May 31, 2020 (Figure 1). There was a statistically significant (P < .001) difference in the case distribution between use of the McGRATH and GlideScope VL for that period. The anesthesia personnel’s use of the McGRATH VL increased to 61% of all video laryngoscopy cases, compared to 37% for the GlideScope (Figure 2).
The total costs calculated for equipment, blades, and repairs are presented in Table 1 and yearly total costs are shown in Figure 3. Overall costs were $181 093 lower (55.5%) for the McGRATH VL compared to the GlideScope over the 24-month period. The mean (SD) monthly costs for GlideScope VL blades were $3837 ($1050) and $3236 ($538) for years 1 and 2, respectively, vs $1652 ($663) and $2933 ($585) for the McGRATH VL blades. Most of the total cost differences were attributed to equipment and blade purchases, which were $202 595 (65.0%) higher for the GlideScope compared to the McGRATH VL. The monthly blade costs alone were higher (P < .001) for the GlideScope over the 2-year period; however, the McGRATH VL required use of disposable stylets at a cost of $10 177 for all endotracheal intubations, compared to $700 for the GlideScope device.
An analysis was performed to determine whether costs differed between those 2 instruments during the COVID-19 period. There was a statistically significant (P < .001) difference in the case distribution between use of the McGRATH and GlideScope VLs during that period. The calculated blade cost difference for the COVID period was $128 higher for the McGRATH even though 293 more intubations were performed with that device (Table 2).
Discussion
We attempted to provide useful cost estimates by presenting pricing data reflecting the approximate cost that most large institutional anesthesia practices would incur for using those 2 specific devices and related peripherals. The main findings of our analysis showed that use of the McGRATH MAC VL resulted in a 55% cost savings compared to the GlideScope, with a similar number of cases performed with each device over the 24-month study period. We believe this represents a substantial savings to the department and institution, which has prompted internal review on the use of video laryngoscopy equipment. None of the McGRATH units failed; however, the GlideScope required 3 baton replacements.
Of note, use of the McGRATH MAC increased during the COVID-19 period, which may be explained by the fact that the operators found it to be a more portable device. Several physicians in the department commented that its smaller size made the McGRATH MAC more practical during the time when a plexiglass box was being used around the patient’s head to shield the intubator from aerosolized viral particles.
Although this study demonstrated the cost-saving value of the McGRATH over the GlideScope, a suggested next step would be to examine resource utilization related to video laryngoscopy use. The more dynamic tracking of the use of these devices should facilitate the assessment of existing related resources and decision making, to optimize the benefits of this initiative. We would anticipate reduced use of anesthesia personnel, such as technicians to assist with the management of this device which could be significant. As new respiratory viruses are appearing each year, video laryngoscopy will continue to gain increasing use in operating rooms and acute care locations. The adding of protective barriers between patients and providers calls for use of the most practical and effective VL devices, to protect personnel who are at high risk of contamination from airway secretions and aerosolized particles.9,10
The COVID-19 pandemic has demonstrated the value of anesthesiology in regards to analyzing and finding solutions to effectively manage infected patients or those suspected of infection in the perioperative environment. Inexpensive products are often avoided because cheaper devices are associated with being of lower quality. However, the association with cost and quality—and the assumption that a higher price is positively correlated with higher quality—is overall inconsistent in the medical literature.11 A more effective or higher quality treatment does not necessarily cost more and may actually end up costing less,12 as was the case in this study. We have been able to directly cut departmental expenses by using a more efficient and cost-effective device for intubations, without compromising safety and efficacy. Future studies should determine whether this significant reduction in costs from video laryngoscopy intubations with the McGRATH VL will be sustained across anesthesiology departments in the Jefferson Health Enterprise Hospitals, or other health systems, as well as its impact on workflow and personnel resources.
This analysis was restricted to one of the campuses of the Jefferson Health Enterprise. However, this is the largest anesthesia practice, encompassing several locations, which should reflect the general practice patterns across other anesthesiology departments in this large institution. The costs for the devices and peripherals may vary across anesthesia practices depending on volume and contracts negotiated with the suppliers. It was not possible to estimate this variability, which could change the total costs by a few percentage points. We recognize that there may be other costs associated with securing the McGRATH VL to prevent loss from theft or misplacement, which were not included in the study. Lastly, the inability to obtain randomized samples for the 2 groups treated with each device opens up the possibility of selection bias. There were, however, multiple intubators who were free to select 1 of the devices for endotracheal intubation, which may have reduced the effect of selection bias.
Conclusion
This study demonstrated that over a 24-month period use of the McGRATH MAC VL resulted in a cost reduction of around 55% compared to using the GlideScope for endotracheal intubation procedures performed at a major academic center. Over the first 3 months of the COVID-19 crisis, which our study included, use of the McGRATH VL increased while GlideScope use decreased. This was most likely related to the portability and smaller size of the McGRATH, which better facilitated intubations of COVID-19 patients.
Acknowledgements: The authors thank Craig Smith, Senior Anesthesia Technician, for his assistance with the cost information and excellent record-keeping related to the use of video laryngoscopes.
Corresponding author: Marc C. Torjman, PhD, Professor, Department of Anesthesiology, Sidney Kimmel Medical College at Thomas Jefferson University, 111 South 11th St, Suite G-8290, Philadelphia, PA 19107; Marc.Torjman@Jefferson.edu.
Financial disclosures: Dr. Thaler has served as a consultant for Medtronic since September 2020. He has participated in 2 webinars on the routine use of video laryngoscopy.
Funding: This study was supported by the Department of Anesthesiology at Thomas Jefferson University.
1. Channa AB. Video laryngoscopes. Saudi J Anaesth. 2011;5(4):357-359.
2. Pieters BM, Eindhoven GB, Acott C, Van Zundert AAJ. Pioneers of laryngoscopy: indirect, direct and video laryngoscopy. Anaesth Intensive Care. 2015;43(suppl):4-11.
3. Lewis SR, Butler AR, Parker J, et al. Videolaryngoscopy versus direct laryngoscopy for adult patients requiring tracheal intubation. Cochrane Database Syst Rev. 2016;11(11):CD011136.
4. Kim W, Choi HJ, Lim T, Kang BS. Can the new McGrath laryngoscope rival the GlideScope Ranger portable video laryngoscope? A randomized manikin study. Am J Emerg Med. 2014;32(10):1225-1229.
5. Kim W, Choi HJ, Lim T, et al. Is McGrath MAC better than Glidescope Ranger for novice providers in the simulated difficult airway? A randomized manikin study. Resuscitation. 2014;85(suppl 1):S32.
6. Jeon WJ, Kim KH, Yeom JH, et al. A comparison of the Glidescope to the McGrath videolaryngoscope in patients. Korean J Anesthesiol. 2011;61(1):19-23.
7. Savoldelli GL, Schiffer E, Abegg C, et al. Comparison of the Glidescope, the McGrath, the Airtraq and the Macintosh laryngoscopes in simulated difficult airways. Anaesthesia. 2008;63(12):1358-1364.
8. Savoldelli GL, Schiffer E, Abegg C, et al. Learning curves of the Glidescope, the McGrath and the Airtraq laryngoscopes: a manikin study. Eur J Anaesthesiol. 2009;26(7):554-558.
9. Schumacher J, Arlidge J, Dudley D, et al. The impact of respiratory protective equipment on difficult airway management: a randomised, crossover, simulation study. Anaesthesia. 2020;75(10):1301-1306.
10. De Jong A, Pardo E, Rolle A, et al. Airway management for COVID-19: a move towards universal videolaryngoscope? Lancet Respir Med. 2020;8(6):555.
11. Hussey PS, Wertheimer S, Mehrotra A. The association between health care quality and cost: a systematic review. Ann Intern Med. 2013;158(1):27-34.
12. Mitton C, Dionne F, Peacock S, Sheps S. Quality and cost in healthcare: a relationship worth examining. Appl Health Econ Health Policy. 2006;5(4):201-208.
Phototherapy: Safe and Effective for Challenging Skin Conditions in Older Adults
Identifying safe, effective, and affordable evidence-based dermatologic treatments for older adults can be challenging because of age-related changes in the skin, comorbidities, polypharmacy, mobility issues, and cognitive changes. Phototherapy has been shown to be an effective nonpharmacologic treatment option for multiple challenging dermatologic conditions1-8; however, few studies have specifically examined its effectiveness in older adults. The challenge for older patients with psoriasis and dermatitis is that the conditions can be difficult to control and often require multiple treatment modalities.9,10 Patients with psoriasis also have a higher risk for diabetes, dyslipidemia, and cardiovascular disease compared to other older patients,11,12 which poses treatment challenges and makes nonpharmacologic treatments even more appealing.
Recent studies show that phototherapy can help decrease the use of dermatologic medications. Foerster and colleagues2 found that adults with psoriasis who were treated with phototherapy significantly decreased their use of topical steroids (24.5% fewer patients required steroid creams and 31.1% fewer patients required psoriasis-specific topicals)(P<.01) while their use of non–psoriasis-specific medications did not change. Click and colleagues13 identified a decrease in medication costs, health care utilization, and risk for immunosuppression in patients treated with phototherapy when compared to those treated with biologics and apremilast. Methotrexate is a common dermatologic medication that is highly associated with increased risks in elderly patients because of impaired immune system function and the presence of comorbidities (eg, kidney disease, obesity, diabetes, fatty liver),14 which increase in prevalence with age. Combining phototherapy with methotrexate can substantially decrease the amount of methotrexate needed to achieve disease control,15 thereby decreasing the methotrexate-associated risks. Findings from these studies suggest that a safe, effective, cost-effective, and well-tolerated nonpharmacologic alternative, such as phototherapy, is highly desirable and should be optimized. Unfortunately, most studies that report the effectiveness of phototherapy are in younger populations.
This retrospective study aimed to (1) identify the most common dermatologic conditions treated with phototherapy in older adults, (2) examine the effectiveness and safety of phototherapy in older adults
Methods
Design, Setting, Sample, and Statistical Analysis
The institutional review boards of Kaiser Permanente Washington Health Research Institute, Seattle, and the University of Washington, Seattle, approved this study. It was conducted in a large US multispecialty health care system (Group Health, Seattle, Washington [now Kaiser Permanente Washington]) serving approximately 600,000 patients, using billing records to identify all patients treated with phototherapy between January 1, 2015, and December 31, 2015, all who received narrowband UVB (NB-UVB) phototherapy. All adults 65 years and older who received phototherapy treatment during the 12-month study period were included. Patients were included regardless of comorbidities and other dermatologic treatments to maintain as much uniformity as possible between the present study and 2 prior studies examining phototherapy in older adult populations in the United Kingdom16 and Turkey.17 Demographic and clinical factors were presented using frequencies (percentages) or means and medians as appropriate. Comparisons of dermatologic conditions and clearance levels used a Fisher exact test. The number of phototherapy treatments to clearance and total number of treatments were compared between groups of patients using independent sample t tests.
Phototherapy Protocol
All patients received treatments administered by specially trained phototherapy nurses using a Daavlin UV Series (The Daavlin Company) or an Ultralite unit (Ultralite Enterprises, Inc), both with 48 lamps. All phototherapy nurses had been previously trained to provide treatments based on standardized protocols (Table 1) and to determine the patient’s level of disease clearance using a high to low clearance scale (Table 2). Daavlin’s treatment protocols were built into the software that accompanied the units and were developed based on the American Academy of Dermatology guidelines. The starting dose for an individual patient was determined based on the estimated
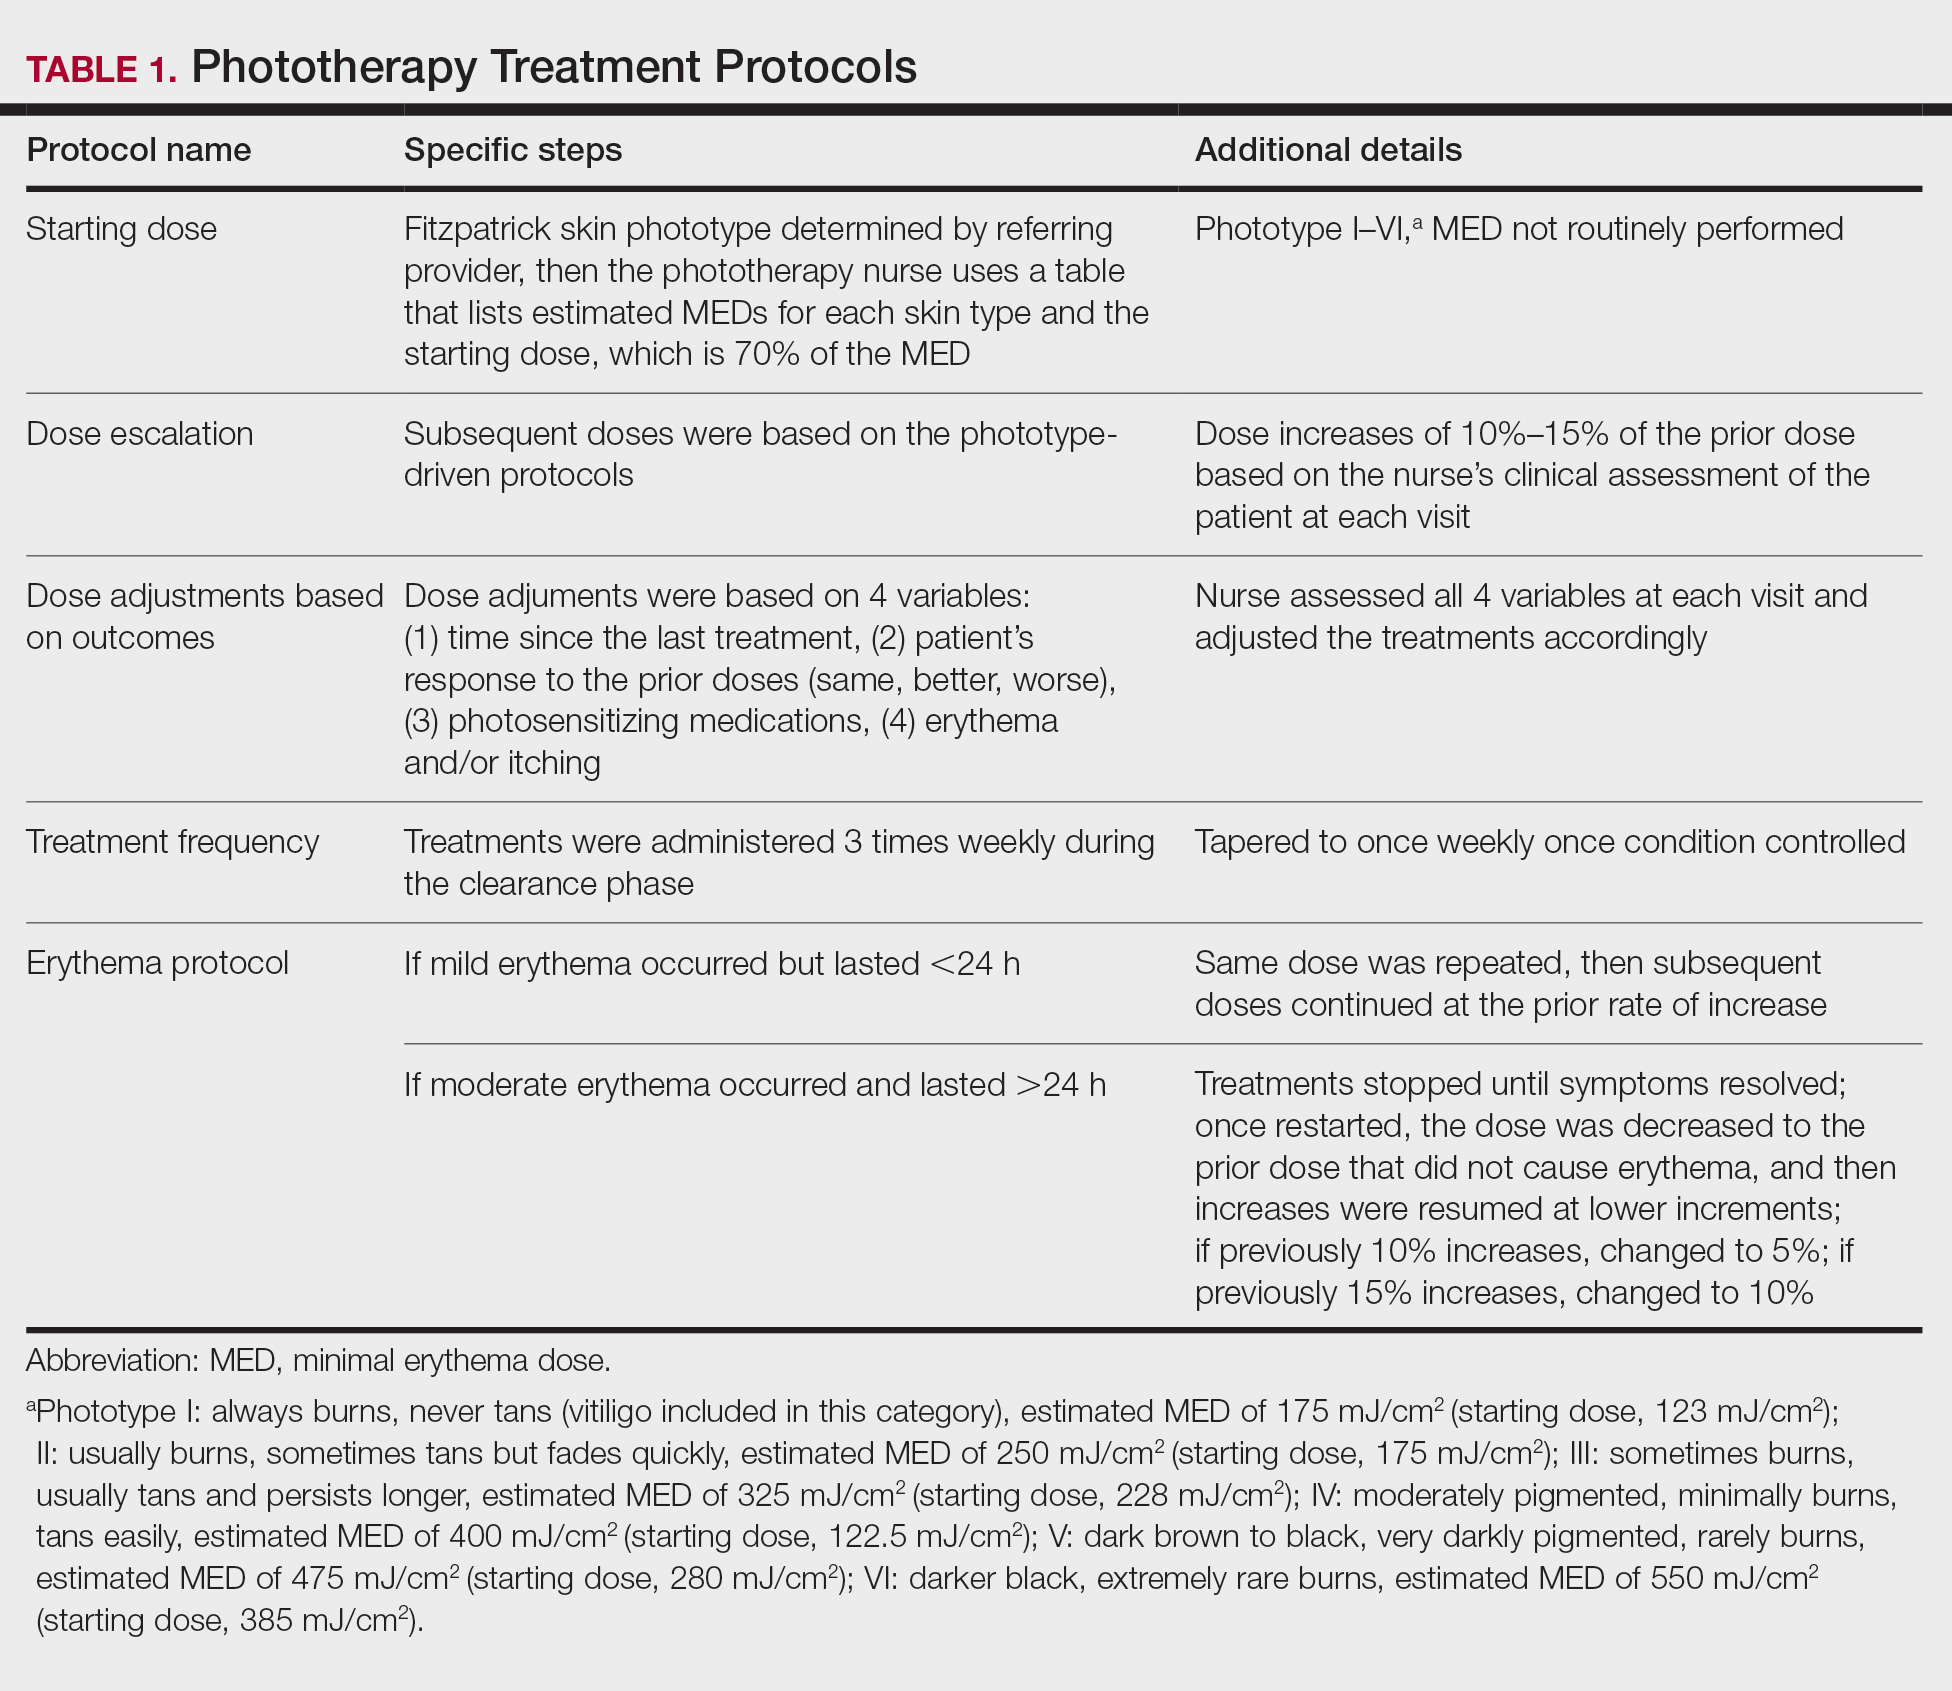
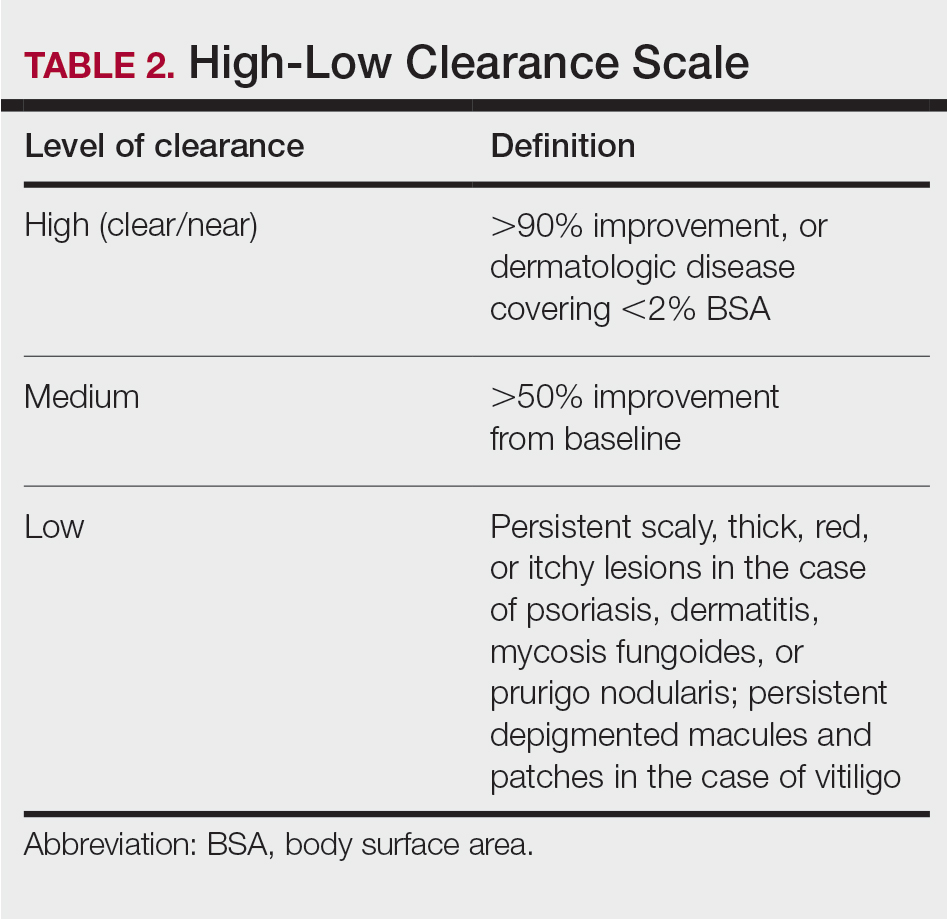
Results
Patients
Billing records identified 229 total patients who received phototherapy in 2015, of whom 52 (22.7%) were at least 65 years old. The median age was 70 years (range, 65–91 years). Twenty-nine (56%) were men and 35 (67%) had previously received phototherapy treatments.
Dermatologic Conditions Treated With Phototherapy
Our primary aim was to identify the most common dermatologic conditions treated with phototherapy in older adults. Psoriasis and dermatitis were the most common conditions treated in the sample (50% [26/52] and 21% [11/52], respectively), with mycosis fungoides being the third most common (10% [5/52]) and vitiligo tied with prurigo nodularis as fourth most common (6% [3/52])(Figure 1).

Effectiveness and Safety of Phototherapy
Our secondary aim was to examine the effectiveness and safety of phototherapy in older adults. Phototherapy was effective in this population, with 50 of 52 patients (96%) achieving a high or medium level of clearance. The degree of clearance for each of the dermatologic conditions is shown in Figure 2. Psoriasis and dermatitis achieved high clearance rates in 81% (21/26) and 82% (9/11) of patients, respectively. Overall, conditions did not have significant differences in clearances rates (Fisher exact test, P=.10). On average, it took patients 33 treatments to achieve medium or high rates of clearance. Psoriasis cleared more quickly, with an average of 30.4 treatments vs 36.1 treatments for other conditions, but the difference was not significant (t test, P=.26). Patients received an average of 98 total phototherapy treatments; the median number of treatments was 81 due to many being on maintenance therapy over several months. There was no relationship between a history of treatment with phototherapy and the total number of treatments needed to achieve clearance (t test, P=.40), but interestingly, those who had a history of phototherapy took approximately 5 more treatments to achieve clearance. The present study found that a slightly larger number of men were being treated for psoriasis (15 men vs 11 women), but there was no significant difference in response rate based on gender.
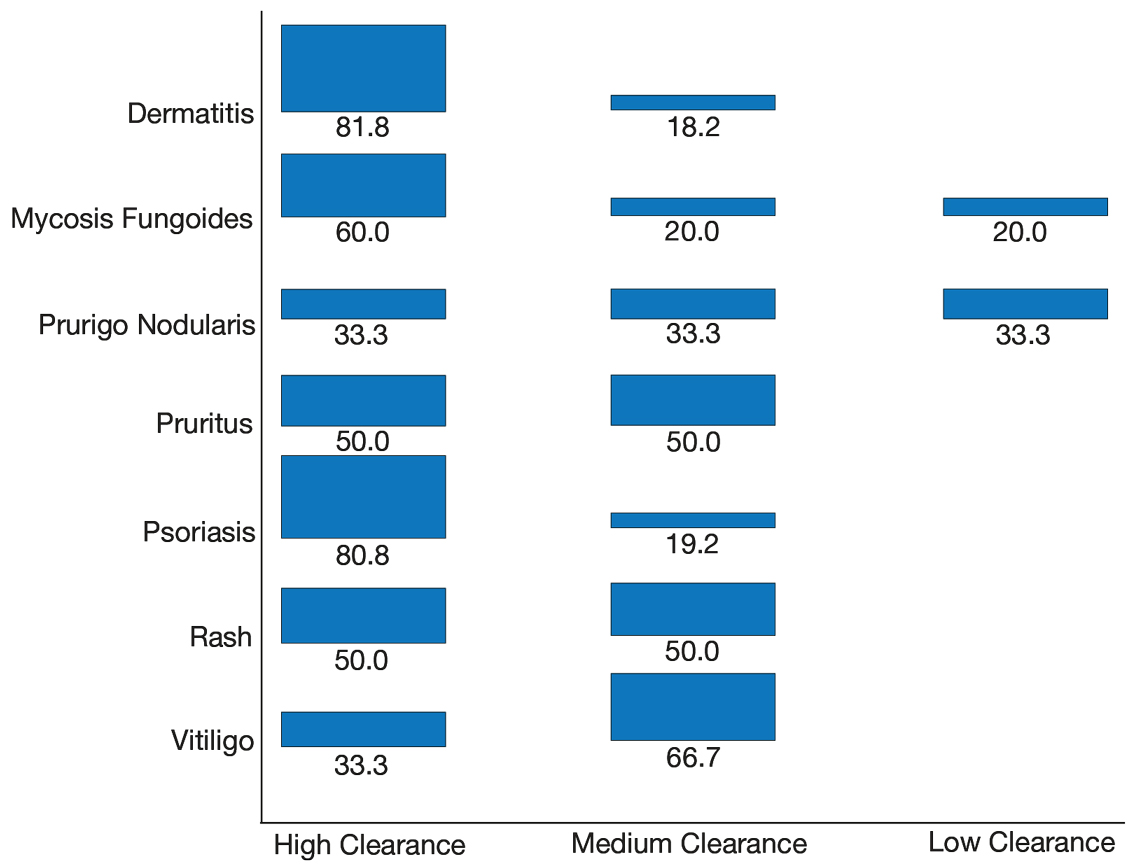
Side effects from phototherapy were minimal; 24 patients (46%) experienced grade 1 (mild) erythema at some point during their treatment course. Thirteen (25%) patients experienced grade 2 erythema, but this was a rare event for most patients. Only 1 (2%) patient experienced grade 3 erythema 1 time. Three patients experienced increased itching (6%). Thirteen (25%) patients had no side effects. None developed severe erythema or blisters, and none discontinued phototherapy because of side effects. Over the course of the study year, we found a high degree of acceptance of phototherapy treatments by older patients: 22 (42%) completed therapy after achieving clearance, 10 (19%) were continuing ongoing treatments (maintenance), and 15 (29%) stopped because of life circumstances (eg, other health issues, moving out of the area). Only 4 (8%) stopped because of a lack of effectiveness, and 1 (2%) patient because the treatments were burdensome.
Comparison of Outcomes
Our third aim was to compare the outcomes with similar studies in the United Kingdom16 and Turkey.17 This study confirmed that phototherapy is being used in older adults (22.7% of this study’s total patients) and is an effective treatment for older patients experiencing a range of challenging inflammatory and proliferative skin diseases similar to studies in the general population. Prior phototherapy studies in elderly patients also found psoriasis to be the most common skin condition treated, with 1 study finding that 51% (19/37) of older phototherapy patients had psoriasis,16 while another reported 58% (37/95) of older phototherapy patients had psoriasis.17 These numbers are similar to those in our study, which showed 50% (26/52) of elderly phototherapy patients had psoriasis. Psoriasis is the main indication for treatment with NB-UVB phototherapy in the general population,19 and because the risk for psoriasis increases with age,20 it is not surprising that all 3 studies found psoriasis to be the most common indication in elderly phototherapy patients. Table 3 provides further details on conditions treated in all 3 studies.
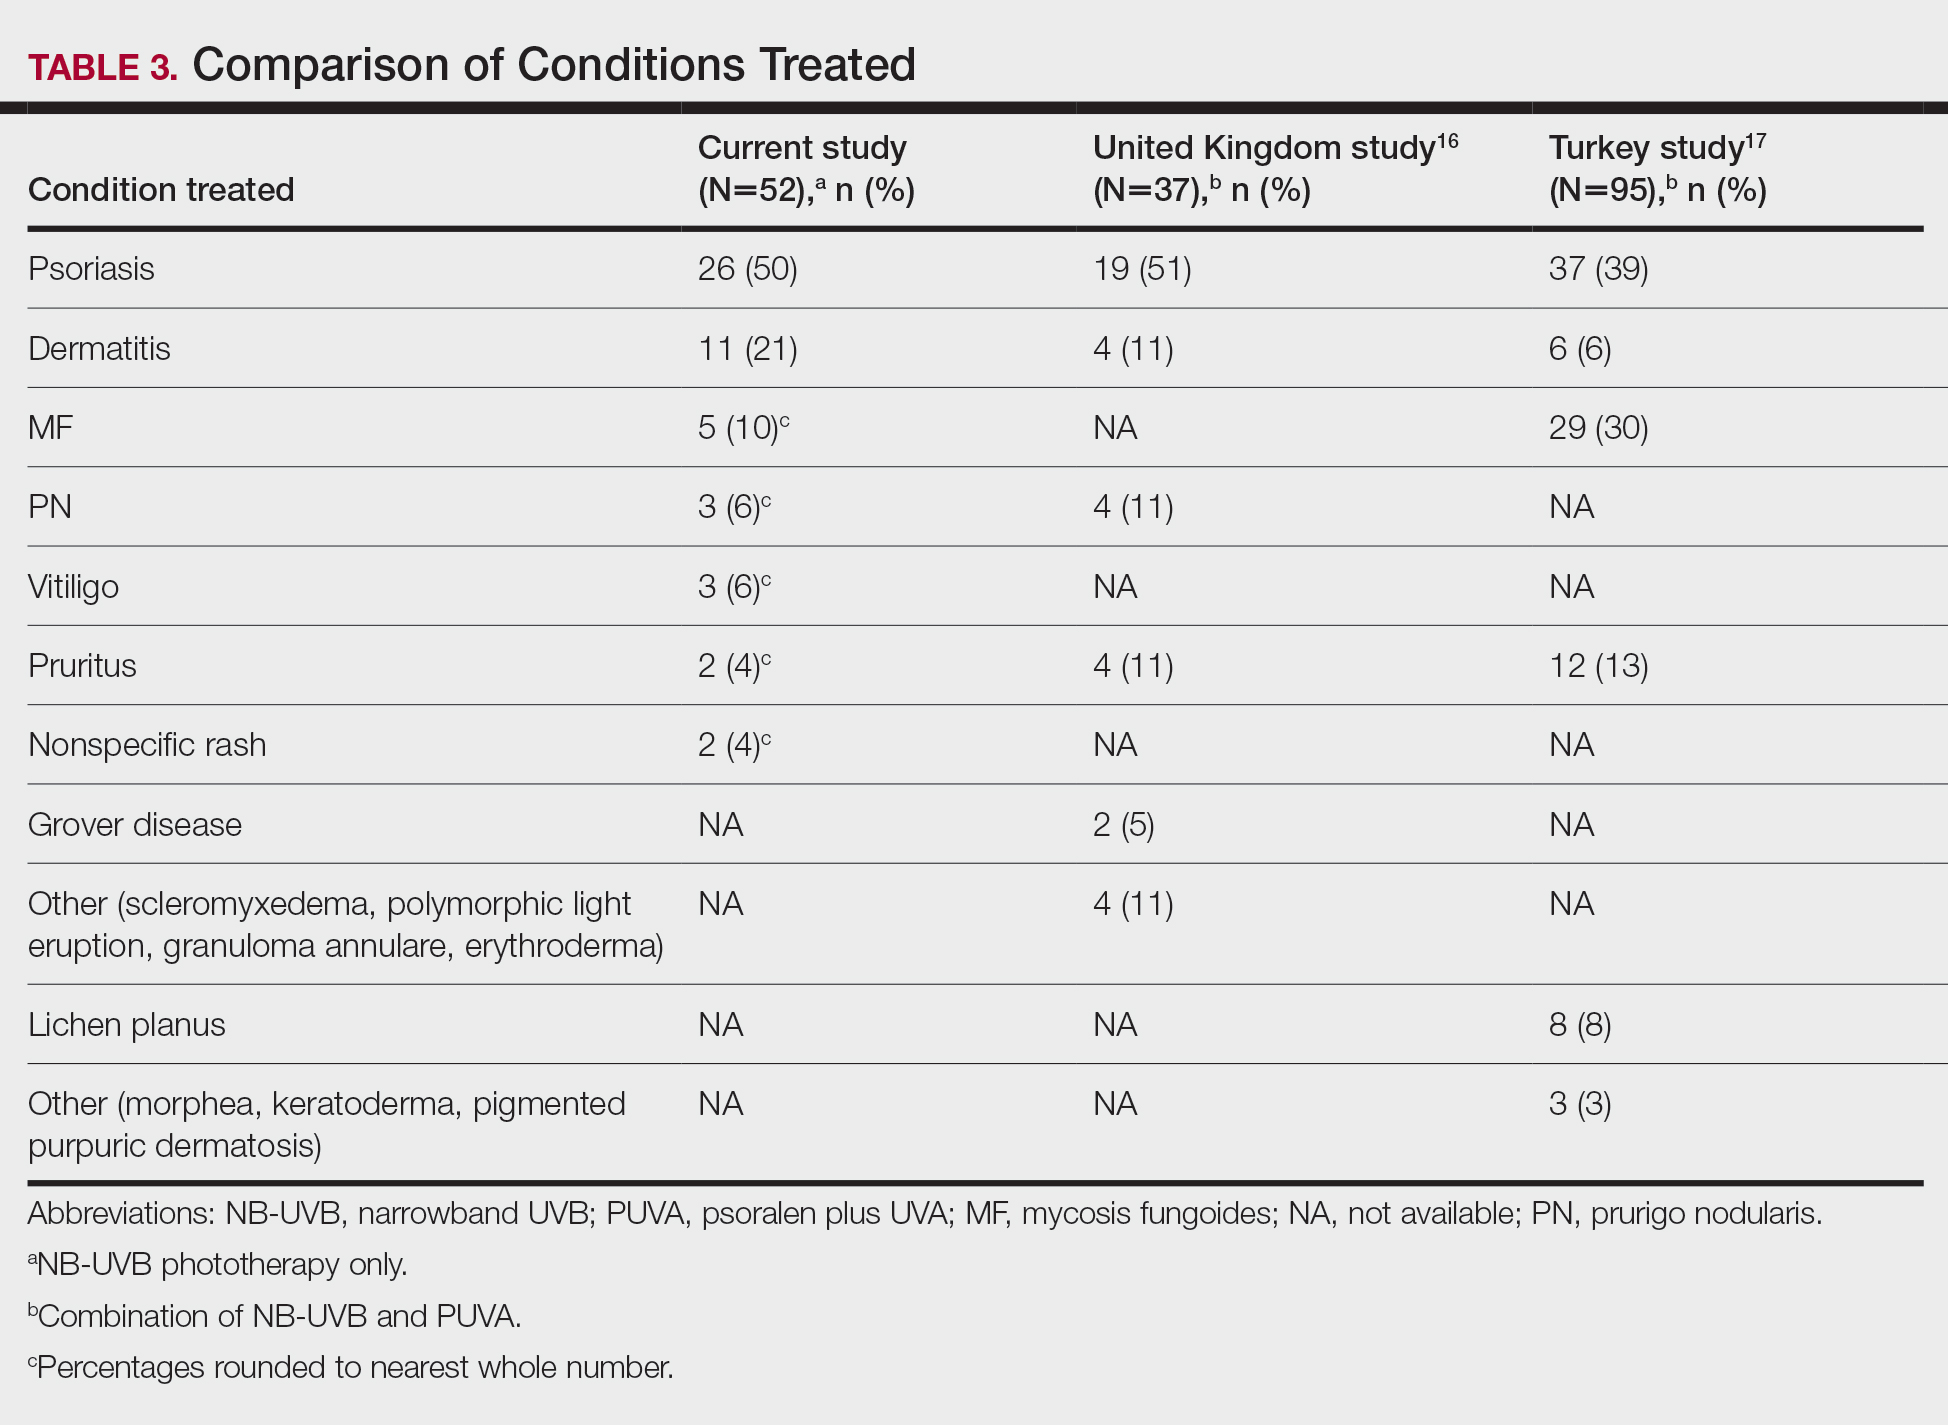
Comment
Our study found that 94% of patients with psoriasis achieved clearance with an average of 30.4 treatments, which is comparable to the reported 91% response rate with an average of 30 treatments in the United Kingdom.16 The other similar study in Turkey17 reported 73.7% of psoriasis patients achieved a 75% or more improvement from baseline with an average of 42 treatments, which may reflect underlying differences in regional skin type. Of note, the scatter chart (Figure 3) shows that several patients in the present study’s analysis are listed as not clear, but many of those patients had low treatment numbers below the mean time to clearance. Thus, the present study’s response rate may have been underestimated.
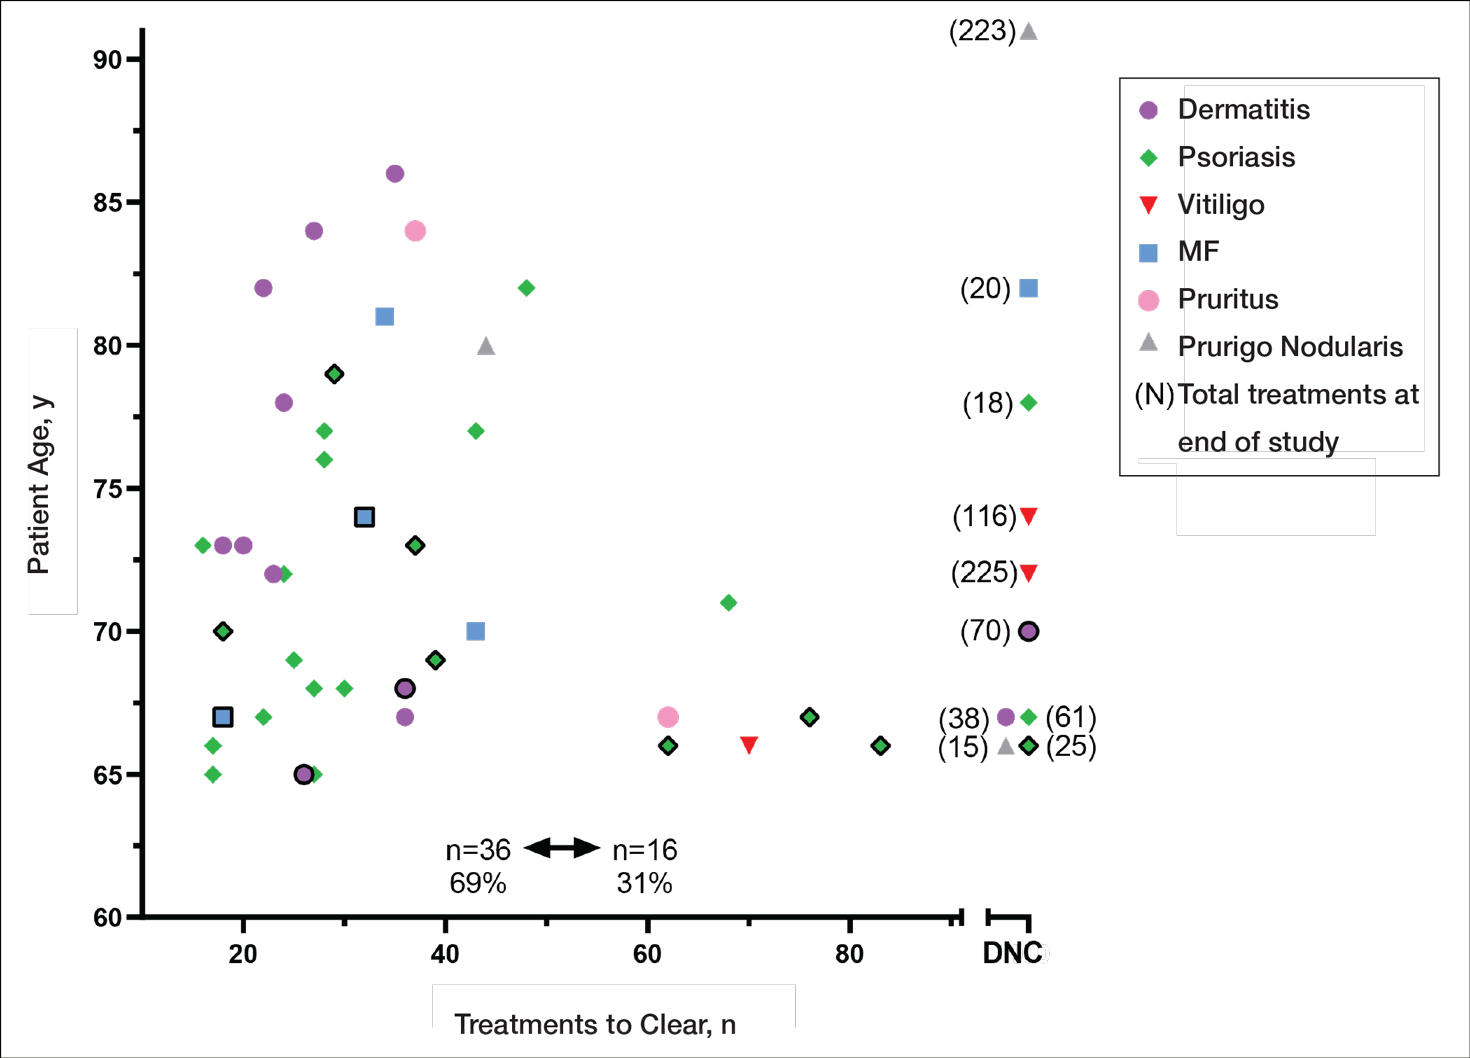
In the general population, studies show that psoriasis treated with standardized phototherapy protocols typically clears with an average of 20.6 treatments.21 The levels of clearance were similar in our study’s older population, but more treatments were required to achieve those results, with an average of 10 more treatments needed (an additional 3.3 weeks). Similar results were found in this sample for dermatitis and mycosis fungoides, indicating comparable clearance rates and levels but a need for more treatments to achieve similar results compared to the general population.
Additionally, in the current study more patients experienced grade 1 (mild) erythema (46%) and grade 2 erythema (25%) at some point in their treatment compared with the United Kingdom16 (1.89%) and Turkey17 (35%) studies, though these side effects did not impact the clearance rate. Interestingly, the current study’s scatter chart (Figure 3) illustrates that this side effect did not seem to increase with aging in this population. If anything, the erythema response was more prevalent in the median or younger patients in the sample. Erythema may have been due to the frequent use of photosensitizing medications in older adults in the United States, some of which typically get discontinued in patients 75 years and older (eg, statins). Other potential causes might include the use of phototype vs minimal erythema dose–driven protocols, the standard utilization of protocols originally designed for psoriasis vs other condition-specific protocols, missed treatments leading to increased sensitivity, or possibly shielding mishaps (eg, not wearing a prescribed face shield). Given the number of potential causes and the possibility of overlapping factors, careful analysis is important. With NB-UVB phototherapy, near-erythemogenic doses are optimal to achieve effective treatments, but this delicate balance may be more problematic for older adults. Future studies are needed to fully determine the factors at play for this population. In the interim, it is important for phototherapy-trained nurses to consider this risk carefully in the older population. They must follow the prescribed protocols that guide them to query patients about their responses to the prior treatment (eg, erythema, tenderness, itching), photosensitizing medications, missed treatments, and placement of shielding, and then adjust the treatment dosing accordingly.
Limitations
This study had several limitations. Although clinical outcomes were recorded prospectively, the analysis was retrospective, unblinded, and not placebo controlled. It was conducted in a single organization (Group Health [now Kaiser Permanente Washington]) but did analyze data from 4 medical centers in different cities with diverse demographics and a variety of nursing staff providing the treatments. Although the vitiligo treatment protocol likely slowed the response rate for those patients with vitiligo, the numbers were small (ie, only 3 of 52 patients), so the researchers chose to include them in the current study. The sample population was relatively small, but when these data are evaluated alongside the studies in the United Kingdom16 and Turkey,17 they show a consistent picture illustrating the effectiveness and safety of phototherapy in the older population. Further epidemiologic studies could be helpful to further describe the usefulness of this modality compared with other treatments for a variety of dermatoses in this age group. Supplementary analysis specifically examining the relationship between the number and type of photosensitizing medications, frequency of erythema, and time to clearance also could be useful.
Conclusion
Older adults with a variety of dermatoses respond well to phototherapy and should have the opportunity to use it, particularly considering the potential for increased complications and costs from other treatment modalities, such as commonly used immunosuppressive pharmaceuticals. However, the current study and the comparison studies indicate that it is important to carefully consider the slower clearance rates and the potential risk for increased erythema in this population and adjust patient education and treatment dosing accordingly.
Unfortunately, many dermatology centers do not offer phototherapy because of infrastructure limitations such as space and specially trained nursing staff. Increasing accessibility of phototherapy for older adults through home treatments may be an alternative, given its effectiveness in the general population.22,23 In addition, home phototherapy may be worth pursuing for the older population considering the challenges they may face with transportation to the clinic setting and their increased risk for serious illness if exposed to infections such as COVID-19. The COVID-19 pandemic has brought to light the need for reliable, safe, and effective treatments that can be utilized in the safety of patients’ homes and should therefore be considered as an option for older adults. Issues such as mobility and cognitive decline could pose some complicating factors, but with the help of a well-trained family member or caregiver, home phototherapy could be a viable option that improves accessibility for older patients. Future research opportunities include further examination of the slower but ultimately equivalent response to phototherapy in the older population, the influence of photosensitizing medications on phototherapy effects, and the impact of phototherapy on utilization of immunosuppressive pharmaceuticals in older adults.
- British Photodermatology Group. An appraisal of narrowband (TL-01) UVB phototherapy. British Photodermatology Group Workshop Report (April 1996). Br J Dermatol. 1997;137:327-330.
Foerster J, Boswell K, West J, et al. Narrowband UVB treatment is highly effective and causes a strong reduction in the use of steroid and other creams in psoriasis patients in clinical practice. PLoS ONE. 2017;12:e0181813. doi:10.1371/journal.pone.0181813 - Fernández-Guarino M, Aboin-Gonzalez S, Barchino L, et al. Treatment of moderate and severe adult chronic atopic dermatitis with narrow-band UVB and the combination of narrow-band UVB/UVA phototherapy. Dermatol Ther. 2015;29:19-23.
- Ryu HH, Choe YS, Jo S, et al. Remission period in psoriasis after multiple cycles of narrowband ultraviolet B phototherapy. J Dermatol. 2014;41:622-627.
Tintle S, Shemer A, Suárez-Fariñas M, et al. Reversal of atopic dermatitis with narrow-band UVB phototherapy and biomarkers for therapeutic response. J Allergy Clin Immunol. 2011;128:583-593. - Gambichler T, Breuckmann F, Boms S, et al. Narrowband UVB phototherapy in skin conditions beyond psoriasis. J Am Acad Dermatol. 2005;52:660-670.
- Schneider LA, Hinrichs R, Scharffetter-Kochanek K. Phototherapy and photochemotherapy. Clin Dermatol. 2008;26:464-476.
- Martin JA, Laube S, Edwards C, et al. Rate of acute adverse events for narrow-band UVB and psoralen-UVA phototherapy. Photodermatol Photoimmunol Photomed. 2007;23:68-72.
- Mokos ZB, Jovic A, Ceovic R, et al. Therapeutic challenges in the mature patient. Clin Dermatol. 2018;36:128-139.
- Di Lernia V, Goldust M. An overview of the efficacy and safety of systemic treatments for psoriasis in the elderly. Exp Opin Biol Ther. 2018;18:897-903.
- Napolitano M, Balato N, Ayala F, et al. Psoriasis in elderly and non-elderly population: clinical and molecular features. G Ital Dermatol Venereol. 2016;151:587-595.
- Grozdev IS, Van Voorhees AS, Gottlieb AB, et al. Psoriasis in the elderly: from the Medical Board of the National Psoriasis Foundation. J Am Acad Dermatol. 2011;65:537-545.
- Click J, Alabaster A, Postlethwaite D, et al. Effect of availability of at-home phototherapy on the use of systemic medications for psoriasis.
Photodermatol Photoimmunol Photomed. 2017;33:345-346. - Piaserico S, Conti A, Lo Console F, et al.
Efficacy and safety of systemic treatments for psoriasis in elderly. Acta Derm Venereol. 2014;94:293-297. - Soliman A, Nofal E, Nofal A, et al. Combination therapy of methotrexate plus NB-UVB phototherapy is more effective than methotrexate monotherapy in the treatment of chronic plaque psoriasis. J Dermatol Treat. 2015;26:528-534.
- Powell JB, Gach JE. Phototherapy in the elderly. Clin Exp Dermatol. 2015;40:605-610.
- Bulur I, Erdogan HK, Aksu AE, et al. The efficacy and safety of phototherapy in geriatric patients: a retrospective study. An Bras Dermatol. 2018;93:33-38.
- Madigan LM, Al-Jamal M, Hamzavi I. Exploring the gaps in the evidence-based application of narrowband UVB for the treatment of vitiligo. Photodermatol Photoimmunol Photomed. 2016;32:66-80.
- Ibbotson SH. A perspective on the use of NB-UVB phototherapy vs. PUVA photochemotherapy. Front Med (Lausanne). 2018;5:184.
- Bell LM, Sedlack R, Beard CM, et al. Incidence of psoriasis in Rochester, Minn, 1980-1983. Arch Dermatol. 1991;127:1184-1187.
- Totonchy MB, Chiu MW. UV-based therapy. Dermatol Clin. 2014;32:399-413.
- Cameron H, Yule S, Dawe RS, et al. Review of an established UK home phototherapy service 1998-2011: improving access to a cost-effective treatment for chronic skin disease. Public Health. 2014;128:317-324.
- Matthews SW, Simmer M, Williams L, et al. Transition of patients with psoriasis from office-based phototherapy to nurse-supported home phototherapy: a pilot study. JDNA. 2018;10:29-41.
Identifying safe, effective, and affordable evidence-based dermatologic treatments for older adults can be challenging because of age-related changes in the skin, comorbidities, polypharmacy, mobility issues, and cognitive changes. Phototherapy has been shown to be an effective nonpharmacologic treatment option for multiple challenging dermatologic conditions1-8; however, few studies have specifically examined its effectiveness in older adults. The challenge for older patients with psoriasis and dermatitis is that the conditions can be difficult to control and often require multiple treatment modalities.9,10 Patients with psoriasis also have a higher risk for diabetes, dyslipidemia, and cardiovascular disease compared to other older patients,11,12 which poses treatment challenges and makes nonpharmacologic treatments even more appealing.
Recent studies show that phototherapy can help decrease the use of dermatologic medications. Foerster and colleagues2 found that adults with psoriasis who were treated with phototherapy significantly decreased their use of topical steroids (24.5% fewer patients required steroid creams and 31.1% fewer patients required psoriasis-specific topicals)(P<.01) while their use of non–psoriasis-specific medications did not change. Click and colleagues13 identified a decrease in medication costs, health care utilization, and risk for immunosuppression in patients treated with phototherapy when compared to those treated with biologics and apremilast. Methotrexate is a common dermatologic medication that is highly associated with increased risks in elderly patients because of impaired immune system function and the presence of comorbidities (eg, kidney disease, obesity, diabetes, fatty liver),14 which increase in prevalence with age. Combining phototherapy with methotrexate can substantially decrease the amount of methotrexate needed to achieve disease control,15 thereby decreasing the methotrexate-associated risks. Findings from these studies suggest that a safe, effective, cost-effective, and well-tolerated nonpharmacologic alternative, such as phototherapy, is highly desirable and should be optimized. Unfortunately, most studies that report the effectiveness of phototherapy are in younger populations.
This retrospective study aimed to (1) identify the most common dermatologic conditions treated with phototherapy in older adults, (2) examine the effectiveness and safety of phototherapy in older adults
Methods
Design, Setting, Sample, and Statistical Analysis
The institutional review boards of Kaiser Permanente Washington Health Research Institute, Seattle, and the University of Washington, Seattle, approved this study. It was conducted in a large US multispecialty health care system (Group Health, Seattle, Washington [now Kaiser Permanente Washington]) serving approximately 600,000 patients, using billing records to identify all patients treated with phototherapy between January 1, 2015, and December 31, 2015, all who received narrowband UVB (NB-UVB) phototherapy. All adults 65 years and older who received phototherapy treatment during the 12-month study period were included. Patients were included regardless of comorbidities and other dermatologic treatments to maintain as much uniformity as possible between the present study and 2 prior studies examining phototherapy in older adult populations in the United Kingdom16 and Turkey.17 Demographic and clinical factors were presented using frequencies (percentages) or means and medians as appropriate. Comparisons of dermatologic conditions and clearance levels used a Fisher exact test. The number of phototherapy treatments to clearance and total number of treatments were compared between groups of patients using independent sample t tests.
Phototherapy Protocol
All patients received treatments administered by specially trained phototherapy nurses using a Daavlin UV Series (The Daavlin Company) or an Ultralite unit (Ultralite Enterprises, Inc), both with 48 lamps. All phototherapy nurses had been previously trained to provide treatments based on standardized protocols (Table 1) and to determine the patient’s level of disease clearance using a high to low clearance scale (Table 2). Daavlin’s treatment protocols were built into the software that accompanied the units and were developed based on the American Academy of Dermatology guidelines. The starting dose for an individual patient was determined based on the estimated
Results
Patients
Billing records identified 229 total patients who received phototherapy in 2015, of whom 52 (22.7%) were at least 65 years old. The median age was 70 years (range, 65–91 years). Twenty-nine (56%) were men and 35 (67%) had previously received phototherapy treatments.
Dermatologic Conditions Treated With Phototherapy
Our primary aim was to identify the most common dermatologic conditions treated with phototherapy in older adults. Psoriasis and dermatitis were the most common conditions treated in the sample (50% [26/52] and 21% [11/52], respectively), with mycosis fungoides being the third most common (10% [5/52]) and vitiligo tied with prurigo nodularis as fourth most common (6% [3/52])(Figure 1).
Effectiveness and Safety of Phototherapy
Our secondary aim was to examine the effectiveness and safety of phototherapy in older adults. Phototherapy was effective in this population, with 50 of 52 patients (96%) achieving a high or medium level of clearance. The degree of clearance for each of the dermatologic conditions is shown in Figure 2. Psoriasis and dermatitis achieved high clearance rates in 81% (21/26) and 82% (9/11) of patients, respectively. Overall, conditions did not have significant differences in clearances rates (Fisher exact test, P=.10). On average, it took patients 33 treatments to achieve medium or high rates of clearance. Psoriasis cleared more quickly, with an average of 30.4 treatments vs 36.1 treatments for other conditions, but the difference was not significant (t test, P=.26). Patients received an average of 98 total phototherapy treatments; the median number of treatments was 81 due to many being on maintenance therapy over several months. There was no relationship between a history of treatment with phototherapy and the total number of treatments needed to achieve clearance (t test, P=.40), but interestingly, those who had a history of phototherapy took approximately 5 more treatments to achieve clearance. The present study found that a slightly larger number of men were being treated for psoriasis (15 men vs 11 women), but there was no significant difference in response rate based on gender.
Side effects from phototherapy were minimal; 24 patients (46%) experienced grade 1 (mild) erythema at some point during their treatment course. Thirteen (25%) patients experienced grade 2 erythema, but this was a rare event for most patients. Only 1 (2%) patient experienced grade 3 erythema 1 time. Three patients experienced increased itching (6%). Thirteen (25%) patients had no side effects. None developed severe erythema or blisters, and none discontinued phototherapy because of side effects. Over the course of the study year, we found a high degree of acceptance of phototherapy treatments by older patients: 22 (42%) completed therapy after achieving clearance, 10 (19%) were continuing ongoing treatments (maintenance), and 15 (29%) stopped because of life circumstances (eg, other health issues, moving out of the area). Only 4 (8%) stopped because of a lack of effectiveness, and 1 (2%) patient because the treatments were burdensome.
Comparison of Outcomes
Our third aim was to compare the outcomes with similar studies in the United Kingdom16 and Turkey.17 This study confirmed that phototherapy is being used in older adults (22.7% of this study’s total patients) and is an effective treatment for older patients experiencing a range of challenging inflammatory and proliferative skin diseases similar to studies in the general population. Prior phototherapy studies in elderly patients also found psoriasis to be the most common skin condition treated, with 1 study finding that 51% (19/37) of older phototherapy patients had psoriasis,16 while another reported 58% (37/95) of older phototherapy patients had psoriasis.17 These numbers are similar to those in our study, which showed 50% (26/52) of elderly phototherapy patients had psoriasis. Psoriasis is the main indication for treatment with NB-UVB phototherapy in the general population,19 and because the risk for psoriasis increases with age,20 it is not surprising that all 3 studies found psoriasis to be the most common indication in elderly phototherapy patients. Table 3 provides further details on conditions treated in all 3 studies.
Comment
Our study found that 94% of patients with psoriasis achieved clearance with an average of 30.4 treatments, which is comparable to the reported 91% response rate with an average of 30 treatments in the United Kingdom.16 The other similar study in Turkey17 reported 73.7% of psoriasis patients achieved a 75% or more improvement from baseline with an average of 42 treatments, which may reflect underlying differences in regional skin type. Of note, the scatter chart (Figure 3) shows that several patients in the present study’s analysis are listed as not clear, but many of those patients had low treatment numbers below the mean time to clearance. Thus, the present study’s response rate may have been underestimated.
In the general population, studies show that psoriasis treated with standardized phototherapy protocols typically clears with an average of 20.6 treatments.21 The levels of clearance were similar in our study’s older population, but more treatments were required to achieve those results, with an average of 10 more treatments needed (an additional 3.3 weeks). Similar results were found in this sample for dermatitis and mycosis fungoides, indicating comparable clearance rates and levels but a need for more treatments to achieve similar results compared to the general population.
Additionally, in the current study more patients experienced grade 1 (mild) erythema (46%) and grade 2 erythema (25%) at some point in their treatment compared with the United Kingdom16 (1.89%) and Turkey17 (35%) studies, though these side effects did not impact the clearance rate. Interestingly, the current study’s scatter chart (Figure 3) illustrates that this side effect did not seem to increase with aging in this population. If anything, the erythema response was more prevalent in the median or younger patients in the sample. Erythema may have been due to the frequent use of photosensitizing medications in older adults in the United States, some of which typically get discontinued in patients 75 years and older (eg, statins). Other potential causes might include the use of phototype vs minimal erythema dose–driven protocols, the standard utilization of protocols originally designed for psoriasis vs other condition-specific protocols, missed treatments leading to increased sensitivity, or possibly shielding mishaps (eg, not wearing a prescribed face shield). Given the number of potential causes and the possibility of overlapping factors, careful analysis is important. With NB-UVB phototherapy, near-erythemogenic doses are optimal to achieve effective treatments, but this delicate balance may be more problematic for older adults. Future studies are needed to fully determine the factors at play for this population. In the interim, it is important for phototherapy-trained nurses to consider this risk carefully in the older population. They must follow the prescribed protocols that guide them to query patients about their responses to the prior treatment (eg, erythema, tenderness, itching), photosensitizing medications, missed treatments, and placement of shielding, and then adjust the treatment dosing accordingly.
Limitations
This study had several limitations. Although clinical outcomes were recorded prospectively, the analysis was retrospective, unblinded, and not placebo controlled. It was conducted in a single organization (Group Health [now Kaiser Permanente Washington]) but did analyze data from 4 medical centers in different cities with diverse demographics and a variety of nursing staff providing the treatments. Although the vitiligo treatment protocol likely slowed the response rate for those patients with vitiligo, the numbers were small (ie, only 3 of 52 patients), so the researchers chose to include them in the current study. The sample population was relatively small, but when these data are evaluated alongside the studies in the United Kingdom16 and Turkey,17 they show a consistent picture illustrating the effectiveness and safety of phototherapy in the older population. Further epidemiologic studies could be helpful to further describe the usefulness of this modality compared with other treatments for a variety of dermatoses in this age group. Supplementary analysis specifically examining the relationship between the number and type of photosensitizing medications, frequency of erythema, and time to clearance also could be useful.
Conclusion
Older adults with a variety of dermatoses respond well to phototherapy and should have the opportunity to use it, particularly considering the potential for increased complications and costs from other treatment modalities, such as commonly used immunosuppressive pharmaceuticals. However, the current study and the comparison studies indicate that it is important to carefully consider the slower clearance rates and the potential risk for increased erythema in this population and adjust patient education and treatment dosing accordingly.
Unfortunately, many dermatology centers do not offer phototherapy because of infrastructure limitations such as space and specially trained nursing staff. Increasing accessibility of phototherapy for older adults through home treatments may be an alternative, given its effectiveness in the general population.22,23 In addition, home phototherapy may be worth pursuing for the older population considering the challenges they may face with transportation to the clinic setting and their increased risk for serious illness if exposed to infections such as COVID-19. The COVID-19 pandemic has brought to light the need for reliable, safe, and effective treatments that can be utilized in the safety of patients’ homes and should therefore be considered as an option for older adults. Issues such as mobility and cognitive decline could pose some complicating factors, but with the help of a well-trained family member or caregiver, home phototherapy could be a viable option that improves accessibility for older patients. Future research opportunities include further examination of the slower but ultimately equivalent response to phototherapy in the older population, the influence of photosensitizing medications on phototherapy effects, and the impact of phototherapy on utilization of immunosuppressive pharmaceuticals in older adults.
- British Photodermatology Group. An appraisal of narrowband (TL-01) UVB phototherapy. British Photodermatology Group Workshop Report (April 1996). Br J Dermatol. 1997;137:327-330.
Foerster J, Boswell K, West J, et al. Narrowband UVB treatment is highly effective and causes a strong reduction in the use of steroid and other creams in psoriasis patients in clinical practice. PLoS ONE. 2017;12:e0181813. doi:10.1371/journal.pone.0181813 - Fernández-Guarino M, Aboin-Gonzalez S, Barchino L, et al. Treatment of moderate and severe adult chronic atopic dermatitis with narrow-band UVB and the combination of narrow-band UVB/UVA phototherapy. Dermatol Ther. 2015;29:19-23.
- Ryu HH, Choe YS, Jo S, et al. Remission period in psoriasis after multiple cycles of narrowband ultraviolet B phototherapy. J Dermatol. 2014;41:622-627.
Tintle S, Shemer A, Suárez-Fariñas M, et al. Reversal of atopic dermatitis with narrow-band UVB phototherapy and biomarkers for therapeutic response. J Allergy Clin Immunol. 2011;128:583-593. - Gambichler T, Breuckmann F, Boms S, et al. Narrowband UVB phototherapy in skin conditions beyond psoriasis. J Am Acad Dermatol. 2005;52:660-670.
- Schneider LA, Hinrichs R, Scharffetter-Kochanek K. Phototherapy and photochemotherapy. Clin Dermatol. 2008;26:464-476.
- Martin JA, Laube S, Edwards C, et al. Rate of acute adverse events for narrow-band UVB and psoralen-UVA phototherapy. Photodermatol Photoimmunol Photomed. 2007;23:68-72.
- Mokos ZB, Jovic A, Ceovic R, et al. Therapeutic challenges in the mature patient. Clin Dermatol. 2018;36:128-139.
- Di Lernia V, Goldust M. An overview of the efficacy and safety of systemic treatments for psoriasis in the elderly. Exp Opin Biol Ther. 2018;18:897-903.
- Napolitano M, Balato N, Ayala F, et al. Psoriasis in elderly and non-elderly population: clinical and molecular features. G Ital Dermatol Venereol. 2016;151:587-595.
- Grozdev IS, Van Voorhees AS, Gottlieb AB, et al. Psoriasis in the elderly: from the Medical Board of the National Psoriasis Foundation. J Am Acad Dermatol. 2011;65:537-545.
- Click J, Alabaster A, Postlethwaite D, et al. Effect of availability of at-home phototherapy on the use of systemic medications for psoriasis.
Photodermatol Photoimmunol Photomed. 2017;33:345-346. - Piaserico S, Conti A, Lo Console F, et al.
Efficacy and safety of systemic treatments for psoriasis in elderly. Acta Derm Venereol. 2014;94:293-297. - Soliman A, Nofal E, Nofal A, et al. Combination therapy of methotrexate plus NB-UVB phototherapy is more effective than methotrexate monotherapy in the treatment of chronic plaque psoriasis. J Dermatol Treat. 2015;26:528-534.
- Powell JB, Gach JE. Phototherapy in the elderly. Clin Exp Dermatol. 2015;40:605-610.
- Bulur I, Erdogan HK, Aksu AE, et al. The efficacy and safety of phototherapy in geriatric patients: a retrospective study. An Bras Dermatol. 2018;93:33-38.
- Madigan LM, Al-Jamal M, Hamzavi I. Exploring the gaps in the evidence-based application of narrowband UVB for the treatment of vitiligo. Photodermatol Photoimmunol Photomed. 2016;32:66-80.
- Ibbotson SH. A perspective on the use of NB-UVB phototherapy vs. PUVA photochemotherapy. Front Med (Lausanne). 2018;5:184.
- Bell LM, Sedlack R, Beard CM, et al. Incidence of psoriasis in Rochester, Minn, 1980-1983. Arch Dermatol. 1991;127:1184-1187.
- Totonchy MB, Chiu MW. UV-based therapy. Dermatol Clin. 2014;32:399-413.
- Cameron H, Yule S, Dawe RS, et al. Review of an established UK home phototherapy service 1998-2011: improving access to a cost-effective treatment for chronic skin disease. Public Health. 2014;128:317-324.
- Matthews SW, Simmer M, Williams L, et al. Transition of patients with psoriasis from office-based phototherapy to nurse-supported home phototherapy: a pilot study. JDNA. 2018;10:29-41.
Practice Points
- With appropriate nursing care, phototherapy can be safe and effective for a variety of conditions in elderly patients.
- Compared to younger patients, elderly patients may need more sessions to achieve comparable clearance rates.
- The increased prevalence of photosensitizing medications in the elderly population will require careful adjustments in dosing.
A Longitudinal Analysis of Functional Disability, Recovery, and Nursing Home Utilization After Hospitalization for Ambulatory Care Sensitive Conditions Among Community-Living Older Persons
Acute illnesses requiring hospitalization serve as a sentinel event, with many older adults requiring assistance with activities of daily living (ADLs) upon discharge.1-3 Older adults who are frail experience even higher rates of hospital-associated disability, and rates of recovery to baseline functional status have varied.4,5 Loss of independence in ADLs has been associated with nursing home (NH) utilization, caregiver burden, and mortality.6
To date, studies have characterized functional trajectories before and after hospitalization in older persons for broad medical conditions, noting persistence of disability and incomplete recovery to baseline functional status.7 Prior evaluations have also noted the long-term disabling impact of critical conditions such as acute myocardial infarction, stroke, and sepsis,8,9 but a knowledge gap exists regarding the subsequent functional disability, recovery, and incident NH admission among older persons who are hospitalized for ambulatory care sensitive conditions (ACSCs). Often considered potentially preventable with optimal ambulatory care,10,11 ACSCs represent acute, chronic, and vaccine-preventable conditions, including urinary tract infection, congestive heart failure, diabetes mellitus, and pneumonia. Investigating the aforementioned patient-centered measures post hospitalization could provide valuable supporting evidence for the continued recognition of ACSC-related hospitalizations in national quality payment programs set forth by the Centers for Medicare & Medicaid Services (CMS).12 Demonstrating adverse outcomes after ACSC-related hospitalizations may help support interventions that target potentially preventable ACSC-related hospitalizations, such as home-based care or telehealth, with the goal of improving functional outcomes and reducing NH admission in older persons.
To address these gaps, we evaluated ACSC-related hospitalizations among participants of the Precipitating Events Project (PEP), a 19-year longitudinal study of community-living persons who were initially nondisabled in their basic functional activities. In the 6 months following an ACSC-related hospitalization, our objectives were to describe: (1) the 6-month course of postdischarge functional disability, (2) the cumulative monthly probability of functional recovery, and (3) the cumulative monthly probability of incident NH admission.
METHODS
Study Population
Participants were drawn from the PEP study, an ongoing, prospective, longitudinal study of 754 community-dwelling persons aged 70 years or older.13 Potential participants were members of a large health plan in greater New Haven, Connecticut, and were enrolled from March 1998 through October 1999. As previously described,14 persons were oversampled if they were physically frail, as denoted by a timed score >10 seconds on the rapid gait test. Exclusion criteria included significant cognitive impairment with no available proxy, life expectancy less than 12 months, plans to leave the area, and inability to speak English. Participants were initially required to be nondisabled in four basic activities of daily living (bathing, dressing, walking across a room, and transferring from a chair). Eligibility was determined during a screening telephone interview and was confirmed during an in-home assessment. Of the eligible members, 75.2% agreed to participate in the project, and persons who declined to participate did not significantly differ in age or sex from those who were enrolled. The Yale Human Investigation Committee approved the study protocol, and all participants provided verbal informed consent.
Data Collection
From 1998 to 2017, comprehensive home-based assessments were completed by trained research nurses at baseline and at 18-month intervals over 234 months (except at 126 months), and telephone interviews were completed monthly through June 2018, to obtain information on disability over time. For participants who had significant cognitive impairment or who were unavailable, we interviewed a proxy informant using a rigorous protocol with demonstrated reliability and validity.14 All incident NH admissions, including both short- and long-term stays, were identified using the CMS Skilled Nursing Facility claims file and Long Term Care Minimum Data Set. Deaths were ascertained by review of obituaries and/or from a proxy informant, with a completion rate of 100%. A total of 688 participants (91.2%) had died after a median follow-up of 108 months, while 43 participants (5.7%) dropped out of the study after a median follow-up of 27 months. Among all participants, data were otherwise available for 99.2% of 85,531 monthly telephone interviews.
Assembly of Analytic Sample
PEP participants were considered for inclusion in the analytic sample if they had a hospitalization with an ACSC as the primary diagnosis on linked Medicare claims data. The complete list of ACSCs was defined using specifications from the Agency for Healthcare Research and Quality,15 and was assembled using the International Classification of Disease, Ninth Revision, Clinical Modification (ICD-9-CM) classification prior to October 1, 2015, and ICD Tenth Revision, Clinical Modification (ICD-10-CM) classification after October 1, 2015 (Appendix Table 1). Examples of ACSCs include congestive heart failure, dehydration, urinary tract infection, and angina without procedure. As performed previously,16,17 two ACSCs (low birthweight; asthma in younger adults 18-39 years) were not included in this analysis because they were not based on full adult populations.
ACSC-related hospitalizations were included through December 2017. Participants could contribute more than one ACSC-related hospitalization over the course of the study based on the following criteria: (1) participant did not have a prior non-ACSC-related hospitalization within an 18-month interval; (2) participant did not have a prior ACSC-related hospitalization or treat-and-release emergency department (ED) visit within an 18-month interval (to ensure independence of observations if the participant was still recovering from the prior event and because some of the characteristics within Table 1 are susceptible to change in the setting of an intervening event and, hence, would not accurately reflect the status of the participant prior to ACSC-related hospitalization); (3) participant was not admitted from a NH; (4) participant did not have an in-hospital intensive care unit (ICU) stay (because persons with critical illness are a distinct population with frequent disability and prolonged recovery, as previously described18), in-hospital death, or death before first follow-up interview (because our aim was to evaluate disability and recovery after the hospitalization7).

Assembly of the primary analytic sample is depicted in the Appendix Figure. Of the 814 patients who were identified with ACSC-related hospitalizations, 107 had a prior non-ACSC-related hospitalization and 275 had a prior ACSC-related hospitalization or a treat-and-release ED visit within an 18-month interval. Of the remaining 432 ACSC-related hospitalizations, 181 were excluded: 114 patients were admitted from a NH, 38 had an in-hospital ICU stay, 3 died in the hospital, 11 died before their first follow-up interview, and 15 had withdrawn from the study. The primary analytic sample included the remaining 251 ACSC-related hospitalizations, contributed by 196 participants. Specifically, nine participants contributed three ACSC-related hospitalizations each, 37 participants contributed two hospitalizations each, and the remaining 150 participants contributed one hospitalization each. During the 6-month follow-up period, 40 participants contributing ACSC-related hospitalizations died after a median (interquartile range [IQR]) of 4 (2-5) months, and 1 person refused continued participation.
Comprehensive Assessments
During the comprehensive in-home assessments, data were obtained on demographic characteristics. Age was measured in years at the time of the ACSC-related hospitalization. In addition, we describe factors from the comprehensive assessment immediately prior to the ACSC-related hospitalization, grouped into two additional domains related to disability19: health-related and cognitive-psychosocial. The health-related factors included nine self-reported, physician-diagnosed chronic conditions and frailty. The cognitive-psychosocial factors included social support, cognitive impairment, and depressive symptoms.
Assessment of Disability
Complete details about the assessment of disability have been previously described.13,14,19,20 Briefly, disability was assessed during the monthly telephone interviews, and included four basic activities (bathing, dressing, walking across a room, and transferring from a chair), five instrumental activities (shopping, housework, meal preparation, taking medications, and managing finances), and three mobility activities (walking a quarter mile, climbing a flight of stairs, and lifting or carrying 10 lb). Participants were asked, “At the present time, do you need help from another person to [complete the task]?” Disability was operationalized as the need for personal assistance or an inability to perform the task. Participants were also asked about a fourth mobility activity, “Have you driven a car during the past month?” Those who responded no were classified as being disabled in driving.19
The number of disabilities overall and for each functional domain (basic, instrumental, and mobility) was summed. Possible disability scores ranged from 0 to 13, with a score of 0 indicating complete independence in all of the items, and a score of 13 indicating complete dependence. Worse postdischarge disability was defined as a total disability score (0-13) at the first telephone interview after an ACSC-related hospitalization that was greater than the total disability score from the telephone interview immediately preceding hospitalization.
Outcome Measures
The primary outcome was the number of disabilities in all 13 basic, instrumental, and mobility activities in each of the 6 months following discharge from an ACSC-related hospitalization. To determine whether our findings were consistent across the three functional domains, we also evaluated the number of disabilities in the four basic, five instrumental, and four mobility activities separately. As secondary outcomes, we evaluated: (1) the cumulative probability of recovery within the 6-month follow-up time frame after an ACSC-related hospitalization, with “recovery” defined as return to the participant’s pre-ACSC-related hospitalization total disability score, and (2) the cumulative probability of incident NH admission within the 6 months after an ACSC-related hospitalization. Aligned with CMS and prior literature,21,22 we defined a short-term NH stay as ≤100 days and a long-term NH stay as >100 days.
Statistical Analysis
Pre-ACSC-related hospitalization characteristics were summarized by means (SDs) and frequencies with proportions. We determined the mean number of disabilities in each of the 6 months following hospital discharge, with the prehospitalization value included as a reference point. We also determined the mean (SD) number of disabilities for the three subscales of disability (basic activities of daily living [BADLs], instrumental activities of daily living [IADLs], and mobility activities). We calculated the cumulative probability of recovery within 6 months of hospital discharge. Finally, we determined the cumulative probability of incident NH admission during the 6 months after hospital discharge.
To test the robustness of our main results, we conducted a sensitivity analysis assessing disability scores of the 150 participants that contributed only one ACSC-related hospitalization. All analyses were performed using Stata, version 16.0, statistical software (StataCorp).
RESULTS
Table 1 shows the characteristics of the 251 ACSC-related hospitalizations immediately prior to hospitalization. Participants’ mean (SD) age was 85.1 (6.0) years, and the mean total disability score was 5.4. The majority were female, non-Hispanic White, frail, and lived alone. As shown in Appendix Table 2, the three most common reasons for ACSC-related hospitalizations were congestive heart failure (n = 69), bacterial pneumonia (n = 53), and dehydration (n = 44).
The Figure shows the disability scores during the 6-month follow-up period for total, basic, instrumental, and mobility activities, in panels A, B, C, and D, respectively. The exact values are provided in Appendix Table 3. After hospitalization, disability scores for total, basic, instrumental, and mobility activities peaked at month 1 and tended to improve modestly over the next 5 months, but remained greater, on average, than pre-hospitalization scores. Of the 40 participants who died within the 6-month follow-up period, 36 (90%) had worse disability scores in their last month of life than in the month prior to their ACSC-related hospitalization.
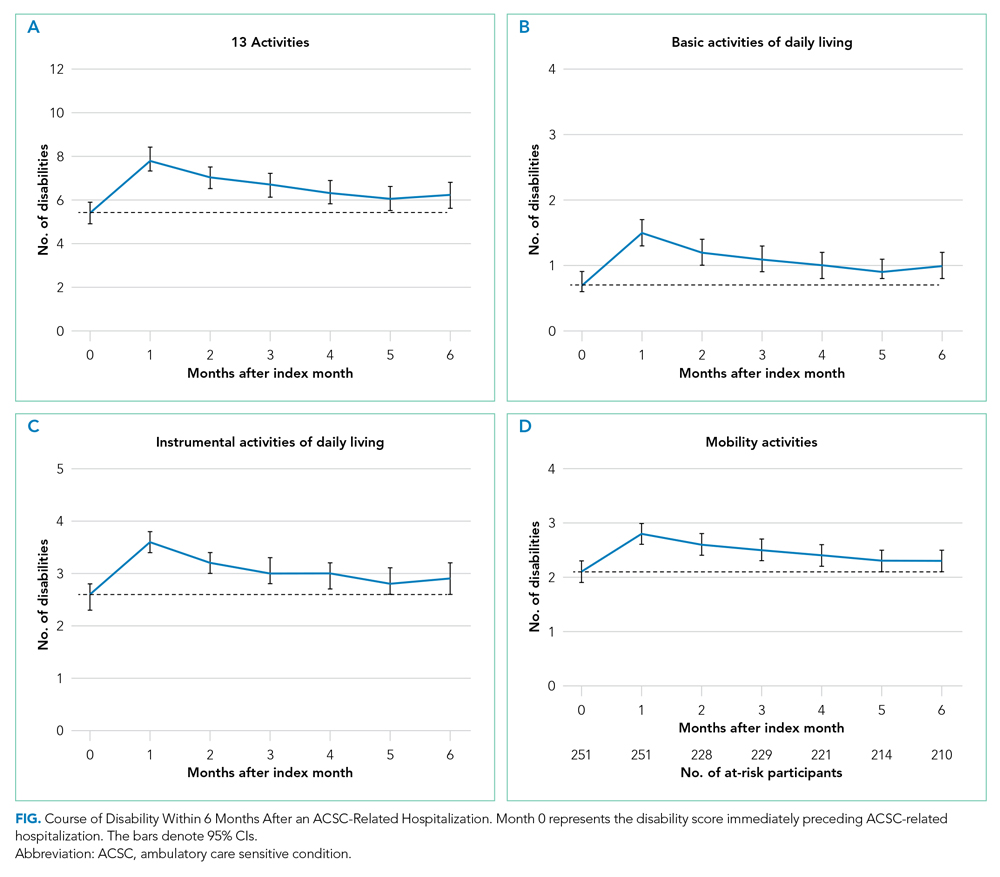
Table 2 shows the cumulative probability of functional recovery after ACSC-related hospitalizations. Recovery was incomplete, with only 70% (95% CI, 64%-76%) of hospitalizations achieving a return to the pre-hospitalization total disability score within 6 months of hospitalization.

Table 3 shows the cumulative probability of incident NH admission after an ACSC-related hospitalization. Of the 251 ACSC-related hospitalizations, incident NH admission was experienced by 38% (95% CI, 32%-44%) within 1 month and 50% (95% CI, 43%-56%) within 6 months of discharge. Short-term NH stays accounted for 90 (75.6%) of the 119 incident NH admissions within the 6 months after ACSC-related hospitalizations. Sensitivity analyses yielded comparable disability scores, shown in Appendix Table 4.
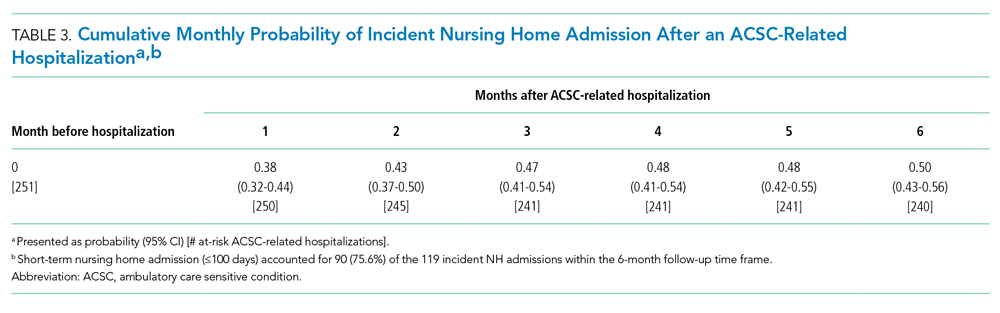
DISCUSSION
In this longitudinal study of community-living older persons, we evaluated functional disability, recovery, and incident NH admission within 6 months of hospitalization for an ACSC. Our study has three major findings. First, disability scores for total, basic, instrumental, and mobility activities at months 1 to 6 of follow-up were greater on average than pre-hospitalization scores. Second, functional recovery was not achieved by 3 of 10 participants after an ACSC-related hospitalization. Third, half of them experienced an incident NH admission within 6 months of discharge from an ACSC-related hospitalization, although about three-quarters of these were short-term stays. Our findings provide evidence that older persons experience clinically meaningful adverse patient-reported outcomes after ACSC-related hospitalizations.
Prior research involving ACSCs has focused largely on rates of hospitalization as a measure of access to primary care and the associated factors predictive of ACSC-related hospitalizations,23-26 and has not addressed subsequent patient-reported outcomes. The findings in this analysis highlight that older persons experience worsening disability immediately after an ACSC-related hospitalization, which persists for prolonged periods and often results in incomplete recovery. Prior research has assessed pre-hospitalization functional status through retrospective recall approaches,2 included only older adults discharged with incident disability,3 and examined functional status after all-cause medical illness hospitalizations.5 Our prospective analysis extends the literature by reliably capturing pre-hospital disability scores and uniquely assessing the cohort of older persons hospitalized with ACSCs.
Our work is relevant to the continued evaluation of ACSC-related hospitalizations in national quality measurement and payment initiatives among Medicare beneficiaries. In prior evaluations of ACSC-related quality measures, stakeholders have criticized the measures for limited validity due to a lack of evidence linking each utilization outcome to other patient-centered outcomes.10,27 Our work addresses this gap by demonstrating that ACSC-related hospitalizations are linked to persistent disability, incomplete functional recovery, and incident NH admissions. Given the large body of evidence demonstrating the priority older persons place on these patient-reported outcomes,28,29 our work should reassure policymakers seeking to transform quality measurement programs into a more patient-oriented enterprise.
Our findings have several clinical practice, research, and policy implications. First, more-effective clinical strategies to minimize the level of care required for acute exacerbations of ACSC-related illnesses may include: (1) substituting home-based care30 and telehealth interventions31 for traditional inpatient hospitalization, (2) making in-ED resources (ie, case management services, geriatric-focused advanced practice providers) more accessible for older persons with ACSC-related illnesses, thereby enhancing care transitions and follow-up to avoid potential current and subsequent hospitalizations, and (3) ensuring adequate ambulatory care access to all older persons, as prior work has shown variation in ACSC hospital admission rates dependent on population factors such as high-poverty neighborhoods,16 insurance status,16,32 and race/ethnicity.33
Clinical strategies have been narrow and not holistic for ACSCs; for example, many institutions have focused on pneumonia vaccinations to reduce hospitalizations, but our work supports the need to further evaluate the impact of preventing ACSC-related hospitalizations and their associated disabling consequences. For patients admitted to the hospital, clinical strategies, such as in-hospital or post-hospital mobility and activity programs, have been shown to be protective against hospital-associated disability.34,35 Furthermore, hospital discharge planning could include preparing older persons for anticipated functional disabilities, associated recoveries, and NH admission after ACSC-related hospitalizations. Risk factors contributing to post-hospitalization functional disability and recovery have been identified,19,20,36 but future work is needed to: (1) identify target populations (including those most likely to worsen) so that interventions can be offered earlier in the course of care to those who would benefit most, and (2) identify and learn from those who are resilient and have recovered, to better understand factors contributing to their success.
Our study has several strengths. First, the study is unique due to its longitudinal design, with monthly assessments of functional status. Since functional status was assessed prospectively before the ACSC-related hospitalization, we also have avoided any potential concern for recall bias that may be present if assessed after the hospitalization. Additionally, through the use of Medicare claims and the Minimum Data Set, the ascertainment of hospitalizations and NH admissions was likely complete for the studied population.
However, the study has limitations. First, functional measures were based on self-reports rather than objective measurements. Nevertheless, the self-report function is often used to guide coverage determinations in the Medicare program, as it has been shown to be associated with poor health outcomes.37 Second, we are unable to comment on the rate of functional decline or NH admission when an older person was not hospitalized in relation to an ACSC. Future analyses may benefit from using a control group (eg, older adults without an ACSC hospitalization or older adults with a non-ACSC hospitalization). Third, we used strict exclusion criteria to identify a population of older adults without recent hospitalizations to determine the isolated impact of ACSC hospitalization on disability, incident NH admission, and functional recovery. Considering this potential selection bias, our findings are likely conservative estimates of the patient-centered outcomes evaluated. Fourth, participants were not asked about feeding and toileting. However, the incidence of disability in these ADLs is low among nondisabled, community-living older persons, and it is highly uncommon for disability to develop in these ADLs without concurrent disability in the ADLs within this analysis.14,38
Finally, because our study participants were members of a single health plan in a small urban area and included nondisabled older persons living in the community, our findings may not be generalizable to geriatric patients in other settings. Nonetheless, the demographics of our cohort reflect those of older persons in New Haven County, Connecticut, which are similar to the demographics of the US population, with the exception of race and ethnicity. In addition, the generalizability of our results are strengthened by the study’s high participation rate and minimal attrition.
CONCLUSION
Within 6 months of ACSC-related hospitalizations, community-living older persons exhibited greater total disability scores than those immediately preceding hospitalization. In the same time frame, 3 of 10 older persons did not achieve functional recovery, and half experienced incident NH admission. These results provide evidence regarding the continued recognition of ACSC-related hospitalizations in federal quality measurement and payment programs and suggests the need for preventive and comprehensive interventions to meaningfully improve longitudinal outcomes.
Acknowledgments
We thank Denise Shepard, BSN, MBA, Andrea Benjamin, BSN, Barbara Foster, and Amy Shelton, MPH, for assistance with data collection; Geraldine Hawthorne, BS, for assistance with data entry and management; Peter Charpentier, MPH, for design and development of the study database and participant tracking system; and Joanne McGloin, MDiv, MBA, for leadership and advice as the Project Director. Each of these persons were paid employees of Yale School of Medicine during the conduct of this study.
1. Covinsky KE, Pierluissi E, Johnston CB. Hospitalization-associated disability: “She was probably able to ambulate, but I’m not sure” JAMA. 2011;306(16):1782-1793. https://doi.org/10.1001/jama.2011.1556
2. Covinsky KE, Palmer RM, Fortinsky RH, et al. Loss of independence in activities of daily living in older adults hospitalized with medical illnesses: increased vulnerability with age. J Am Geriatr Soc. 2003;51(4):451-458. https://doi.org/10.1046/j.1532-5415.2003.51152.x
3. Barnes DE, Mehta KM, Boscardin WJ, et al. Prediction of recovery, dependence or death in elders who become disabled during hospitalization. J Gen Intern Med. 2013;28(2):261-268. https://doi.org/10.1007/s11606-012-2226-y
4. Gill TM, Allore HG, Gahbauer EA, Murphy TE. Change in disability after hospitalization or restricted activity in older persons. JAMA. 2010;304(17):1919-1928. https://doi.org/10.1001/jama.2010.1568
5. Boyd CM, Landefeld CS, Counsell SR, et al. Recovery of activities of daily living in older adults after hospitalization for acute medical illness. J Am Geriatr Soc. 2008;56(12):2171-2179. https://doi.org/10.1111/j.1532-5415.2008.02023.x
6. Loyd C, Markland AD, Zhang Y, et al. Prevalence of hospital-associated disability in older adults: a meta-analysis. J Am Med Dir Assoc. 2020;21(4):455-461. https://doi.org/10.1016/j.jamda.2019.09.015
7. Dharmarajan K, Han L, Gahbauer EA, Leo-Summers LS, Gill TM. Disability and recovery after hospitalization for medical illness among community-living older persons: a prospective cohort study. J Am Geriatr Soc. 2020;68(3):486-495. https://doi.org/10.1111/jgs.16350
8. Levine DA, Davydow DS, Hough CL, Langa KM, Rogers MAM, Iwashyna TJ. Functional disability and cognitive impairment after hospitalization for myocardial infarction and stroke. Circ Cardiovasc Qual Outcomes. 2014;7(6):863-871. https://doi.org/10.1161/HCQ.0000000000000008
9. Iwashyna TJ, Ely EW, Smith DM, Langa KM. Long-term cognitive impairment and functional disability among survivors of severe sepsis. JAMA. 2010;304(16):1787-1794. https://doi.org/10.1001/jama.2010.1553
10. Hodgson K, Deeny SR, Steventon A. Ambulatory care-sensitive conditions: their potential uses and limitations. BMJ Qual Saf. 2019;28(6):429-433. https://doi.org/10.1136/bmjqs-2018-008820
11. Agency for Healthcare Research and Quality (AHRQ). Quality Indicator User Guide: Prevention Quality Indicators (PQI) Composite Measures. Version 2020. Accessed November 10, 2020. https://www.qualityindicators.ahrq.gov/modules/pqi_resources.aspx.
12. Centers for Medicare & Medicaid Services. 2016 Measure information about the hospital admissions for acute and chronic ambulatory care-sensitive condition (ACSC) composite measures, calculated for the 2018 value-based payment modified program. Accessed November 24, 2020. https://www.cms.gov/Medicare/Medicare-Fee-for-Service-Payment/PhysicianFeedbackProgram/Downloads/2016-ACSC-MIF.pdf.
13. Gill TM, Desai MM, Gahbauer EA, Holford TR, Williams CS. Restricted activity among community-living older persons: incidence, precipitants, and health care utilization. Ann Intern Med. 2001;135(5):313-321. https://doi.org/10.7326/0003-4819-135-5-200109040-00007
14. Gill TM, Hardy SE, Williams CS. Underestimation of disability in community-living older persons. J Am Geriatr Soc. 2002;50(9):1492-1497. https://doi.org/10.1046/j.1532-5415.2002.50403.x
15. Agency for Healthcare Research and Quality. Prevention Quality Indicators Technical Specifications Updates—Version v2018 and 2018.0.1 (ICD 10-CM/PCS), June 2018. Accessed February 4, 2020. https://www.qualityindicators.ahrq.gov/Modules/PQI_TechSpec_ICD10_v2018.aspx.
16. Johnson PJ, Ghildayal N, Ward AC, Westgard BC, Boland LL, Hokanson JS. Disparities in potentially avoidable emergency department (ED) care: ED visits for ambulatory care sensitive conditions. Med Care. 2012;50(12):1020-1028. https://doi.org/10.1097/MLR.0b013e318270bad4
17. Galarraga JE, Mutter R, Pines JM. Costs associated with ambulatory care sensitive conditions across hospital-based settings. Acad Emerg Med. 2015;22(2):172-181. https://doi.org/10.1111/acem.12579
18. Ferrante LE, Pisani MA, Murphy TE, Gahbauer EA, Leo-Summers LS, Gill TM. Functional trajectories among older persons before and after critical illness. JAMA Intern Med. 2015;175(4):523-529. https://doi.org/10.1001/jamainternmed.2014.7889
19. Gill TM, Gahbauer EA, Murphy TE, Han L, Allore HG. Risk factors and precipitants of long-term disability in community mobility: a cohort study of older persons. Ann Intern Med. 2012;156(2):131-140. https://doi.org/10.7326/0003-4819-156-2-201201170-00009
20. Hardy SE, Gill TM. Factors associated with recovery of independence among newly disabled older persons. Arch Intern Med. 2005;165(1):106-112. https://doi.org/10.1001/archinte.165.1.106
21. Centers for Medicare & Medicaid Services. Nursing Home Quality Initiative—Quality Measures. Accessed June 13, 2021. https://www.cms.gov/Medicare/Quality-Initiatives-Patient-Assessment-Instruments/NursingHomeQualityInits/NHQIQualityMeasures
22. Goodwin JS, Li S, Zhou J, Graham JE, Karmarkar A, Ottenbacher K. Comparison of methods to identify long term care nursing home residence with administrative data. BMC Health Serv Res. 2017;17(1):376. https://doi.org/10.1186/s12913-017-2318-9
23. Laditka, JN, Laditka SB, Probst JC. More may be better: evidence of a negative relationship between physician supply and hospitalization for ambulatory care sensitive conditions. Health Serv Res. 2005;40(4):1148-1166. https://doi.org/10.1111/j.1475-6773.2005.00403.x
24. Ansar Z, Laditka JN, Laditka SB. Access to health care and hospitalization for ambulatory care sensitive conditions. Med Care Res Rev. 2006;63(6):719-741. https://doi.org/10.1177/1077558706293637
25. Mackinko J, de Oliveira VB, Turci MA, Guanais FC, Bonolo PF, Lima-Costa MF. The influence of primary care and hospital supply on ambulatory care-sensitive hospitalizations among adults in Brazil, 1999-2007. Am J Public Health. 2011;101(10):1963-1970. https://doi.org/10.2105/AJPH.2010.198887
26. Gibson OR, Segal L, McDermott RA. A systematic review of evidence on the association between hospitalisation for chronic disease related ambulatory care sensitive conditions and primary health care resourcing. BMC Health Serv Res. 2013;13:336. https://doi.org/10.1186/1472-6963-13-336
27. Vuik SI, Fontana G, Mayer E, Darzi A. Do hospitalisations for ambulatory care sensitive conditions reflect low access to primary care? An observational cohort study of primary care usage prior to hospitalisation. BMJ Open. 2017;7(8):e015704. https://doi.org/10.1136/bmjopen-2016-015704
28. Fried TR, Tinetti M, Agostini J, Iannone L, Towle V. Health outcome prioritization to elicit preferences of older persons with multiple health conditions. Patient Educ Couns. 2011;83(2):278-282. https://doi.org/10.1016/j.pec.2010.04.032
29. Reuben DB, Tinetti ME. Goal-oriented patient care—an alternative health outcomes paradigm. N Engl J Med. 2012;366(9):777-779. https://doi.org/10.1056/NEJMp1113631
30. Federman AD, Soones T, DeCherrie LV, Leff B, Siu AL. Association of a bundled hospital-at-home and 30-day postacute transitional care program with clinical outcomes and patient experiences. JAMA Intern Med. 2018;178(8):1033-1040. https://doi.org/10.1001/jamainternmed.2018.2562
31. Shah MN, Wasserman EB, Gillespie SM, et al. High-intensity telemedicine decreases emergency department use for ambulatory care sensitive conditions by older adult senior living community residents. J Am Med Dir Assoc. 2015;16(12):1077-1081. https://doi.org/10.1016/j.jamda.2015.07.009
32. Oster A, Bindman AB. Emergency department visits for ambulatory care sensitive conditions: insights into preventable hospitalizations. Med Care. 2003;41(2):198-207. https://doi.org/10.1097/01.MLR.0000045021.70297.9F
33. O’Neil SS, Lake T, Merrill A, Wilson A, Mann DA, Bartnyska LM. Racial disparities in hospitalizations for ambulatory care-sensitive conditions. Am J Prev Med. 2010;38(4):381-388. https://doi.org/10.1016/j.amepre.2009.12.026
34. Pavon JM, Sloane RJ, Pieper RF, et al. Accelerometer-measured hospital physical activity and hospital-acquired disability in older adults. J Am Geriatr Soc. 2020;68:261-265. https://doi.org/10.1111/jgs.16231
35. Sunde S, Hesseberg K, Skelton DA, et al. Effects of a multicomponent high intensity exercise program on physical function and health-related quality of life in older adults with or at risk of mobility disability after discharge from hospital: a randomised controlled trial. BMC Geriatr. 2020;20(1):464. https://doi.org/10.1186/s12877-020-01829-9
36. Hardy SE, Gill TM. Recovery from disability among community-dwelling older persons. JAMA. 2004;291(13):1596-1602. https://doi.org/10.1001/jama.291.13.1596
37. Rotenberg J, Kinosian B, Boling P, Taler G, Independence at Home Learning Collaborative Writing Group. Home-based primary care: beyond extension of the independence at home demonstration. J Am Geriatr Soc. 2018;66(4):812-817. https://doi.org/10.1111/jgs.15314
38. Rodgers W, Miller B. A comparative analysis of ADL questions in surveys of older people. J Gerontol B Psychol Sci Soc Sci. 1997;52:21-36. https://doi.org/10.1093/geronb/52b.special_issue.21
Acute illnesses requiring hospitalization serve as a sentinel event, with many older adults requiring assistance with activities of daily living (ADLs) upon discharge.1-3 Older adults who are frail experience even higher rates of hospital-associated disability, and rates of recovery to baseline functional status have varied.4,5 Loss of independence in ADLs has been associated with nursing home (NH) utilization, caregiver burden, and mortality.6
To date, studies have characterized functional trajectories before and after hospitalization in older persons for broad medical conditions, noting persistence of disability and incomplete recovery to baseline functional status.7 Prior evaluations have also noted the long-term disabling impact of critical conditions such as acute myocardial infarction, stroke, and sepsis,8,9 but a knowledge gap exists regarding the subsequent functional disability, recovery, and incident NH admission among older persons who are hospitalized for ambulatory care sensitive conditions (ACSCs). Often considered potentially preventable with optimal ambulatory care,10,11 ACSCs represent acute, chronic, and vaccine-preventable conditions, including urinary tract infection, congestive heart failure, diabetes mellitus, and pneumonia. Investigating the aforementioned patient-centered measures post hospitalization could provide valuable supporting evidence for the continued recognition of ACSC-related hospitalizations in national quality payment programs set forth by the Centers for Medicare & Medicaid Services (CMS).12 Demonstrating adverse outcomes after ACSC-related hospitalizations may help support interventions that target potentially preventable ACSC-related hospitalizations, such as home-based care or telehealth, with the goal of improving functional outcomes and reducing NH admission in older persons.
To address these gaps, we evaluated ACSC-related hospitalizations among participants of the Precipitating Events Project (PEP), a 19-year longitudinal study of community-living persons who were initially nondisabled in their basic functional activities. In the 6 months following an ACSC-related hospitalization, our objectives were to describe: (1) the 6-month course of postdischarge functional disability, (2) the cumulative monthly probability of functional recovery, and (3) the cumulative monthly probability of incident NH admission.
METHODS
Study Population
Participants were drawn from the PEP study, an ongoing, prospective, longitudinal study of 754 community-dwelling persons aged 70 years or older.13 Potential participants were members of a large health plan in greater New Haven, Connecticut, and were enrolled from March 1998 through October 1999. As previously described,14 persons were oversampled if they were physically frail, as denoted by a timed score >10 seconds on the rapid gait test. Exclusion criteria included significant cognitive impairment with no available proxy, life expectancy less than 12 months, plans to leave the area, and inability to speak English. Participants were initially required to be nondisabled in four basic activities of daily living (bathing, dressing, walking across a room, and transferring from a chair). Eligibility was determined during a screening telephone interview and was confirmed during an in-home assessment. Of the eligible members, 75.2% agreed to participate in the project, and persons who declined to participate did not significantly differ in age or sex from those who were enrolled. The Yale Human Investigation Committee approved the study protocol, and all participants provided verbal informed consent.
Data Collection
From 1998 to 2017, comprehensive home-based assessments were completed by trained research nurses at baseline and at 18-month intervals over 234 months (except at 126 months), and telephone interviews were completed monthly through June 2018, to obtain information on disability over time. For participants who had significant cognitive impairment or who were unavailable, we interviewed a proxy informant using a rigorous protocol with demonstrated reliability and validity.14 All incident NH admissions, including both short- and long-term stays, were identified using the CMS Skilled Nursing Facility claims file and Long Term Care Minimum Data Set. Deaths were ascertained by review of obituaries and/or from a proxy informant, with a completion rate of 100%. A total of 688 participants (91.2%) had died after a median follow-up of 108 months, while 43 participants (5.7%) dropped out of the study after a median follow-up of 27 months. Among all participants, data were otherwise available for 99.2% of 85,531 monthly telephone interviews.
Assembly of Analytic Sample
PEP participants were considered for inclusion in the analytic sample if they had a hospitalization with an ACSC as the primary diagnosis on linked Medicare claims data. The complete list of ACSCs was defined using specifications from the Agency for Healthcare Research and Quality,15 and was assembled using the International Classification of Disease, Ninth Revision, Clinical Modification (ICD-9-CM) classification prior to October 1, 2015, and ICD Tenth Revision, Clinical Modification (ICD-10-CM) classification after October 1, 2015 (Appendix Table 1). Examples of ACSCs include congestive heart failure, dehydration, urinary tract infection, and angina without procedure. As performed previously,16,17 two ACSCs (low birthweight; asthma in younger adults 18-39 years) were not included in this analysis because they were not based on full adult populations.
ACSC-related hospitalizations were included through December 2017. Participants could contribute more than one ACSC-related hospitalization over the course of the study based on the following criteria: (1) participant did not have a prior non-ACSC-related hospitalization within an 18-month interval; (2) participant did not have a prior ACSC-related hospitalization or treat-and-release emergency department (ED) visit within an 18-month interval (to ensure independence of observations if the participant was still recovering from the prior event and because some of the characteristics within Table 1 are susceptible to change in the setting of an intervening event and, hence, would not accurately reflect the status of the participant prior to ACSC-related hospitalization); (3) participant was not admitted from a NH; (4) participant did not have an in-hospital intensive care unit (ICU) stay (because persons with critical illness are a distinct population with frequent disability and prolonged recovery, as previously described18), in-hospital death, or death before first follow-up interview (because our aim was to evaluate disability and recovery after the hospitalization7).
Assembly of the primary analytic sample is depicted in the Appendix Figure. Of the 814 patients who were identified with ACSC-related hospitalizations, 107 had a prior non-ACSC-related hospitalization and 275 had a prior ACSC-related hospitalization or a treat-and-release ED visit within an 18-month interval. Of the remaining 432 ACSC-related hospitalizations, 181 were excluded: 114 patients were admitted from a NH, 38 had an in-hospital ICU stay, 3 died in the hospital, 11 died before their first follow-up interview, and 15 had withdrawn from the study. The primary analytic sample included the remaining 251 ACSC-related hospitalizations, contributed by 196 participants. Specifically, nine participants contributed three ACSC-related hospitalizations each, 37 participants contributed two hospitalizations each, and the remaining 150 participants contributed one hospitalization each. During the 6-month follow-up period, 40 participants contributing ACSC-related hospitalizations died after a median (interquartile range [IQR]) of 4 (2-5) months, and 1 person refused continued participation.
Comprehensive Assessments
During the comprehensive in-home assessments, data were obtained on demographic characteristics. Age was measured in years at the time of the ACSC-related hospitalization. In addition, we describe factors from the comprehensive assessment immediately prior to the ACSC-related hospitalization, grouped into two additional domains related to disability19: health-related and cognitive-psychosocial. The health-related factors included nine self-reported, physician-diagnosed chronic conditions and frailty. The cognitive-psychosocial factors included social support, cognitive impairment, and depressive symptoms.
Assessment of Disability
Complete details about the assessment of disability have been previously described.13,14,19,20 Briefly, disability was assessed during the monthly telephone interviews, and included four basic activities (bathing, dressing, walking across a room, and transferring from a chair), five instrumental activities (shopping, housework, meal preparation, taking medications, and managing finances), and three mobility activities (walking a quarter mile, climbing a flight of stairs, and lifting or carrying 10 lb). Participants were asked, “At the present time, do you need help from another person to [complete the task]?” Disability was operationalized as the need for personal assistance or an inability to perform the task. Participants were also asked about a fourth mobility activity, “Have you driven a car during the past month?” Those who responded no were classified as being disabled in driving.19
The number of disabilities overall and for each functional domain (basic, instrumental, and mobility) was summed. Possible disability scores ranged from 0 to 13, with a score of 0 indicating complete independence in all of the items, and a score of 13 indicating complete dependence. Worse postdischarge disability was defined as a total disability score (0-13) at the first telephone interview after an ACSC-related hospitalization that was greater than the total disability score from the telephone interview immediately preceding hospitalization.
Outcome Measures
The primary outcome was the number of disabilities in all 13 basic, instrumental, and mobility activities in each of the 6 months following discharge from an ACSC-related hospitalization. To determine whether our findings were consistent across the three functional domains, we also evaluated the number of disabilities in the four basic, five instrumental, and four mobility activities separately. As secondary outcomes, we evaluated: (1) the cumulative probability of recovery within the 6-month follow-up time frame after an ACSC-related hospitalization, with “recovery” defined as return to the participant’s pre-ACSC-related hospitalization total disability score, and (2) the cumulative probability of incident NH admission within the 6 months after an ACSC-related hospitalization. Aligned with CMS and prior literature,21,22 we defined a short-term NH stay as ≤100 days and a long-term NH stay as >100 days.
Statistical Analysis
Pre-ACSC-related hospitalization characteristics were summarized by means (SDs) and frequencies with proportions. We determined the mean number of disabilities in each of the 6 months following hospital discharge, with the prehospitalization value included as a reference point. We also determined the mean (SD) number of disabilities for the three subscales of disability (basic activities of daily living [BADLs], instrumental activities of daily living [IADLs], and mobility activities). We calculated the cumulative probability of recovery within 6 months of hospital discharge. Finally, we determined the cumulative probability of incident NH admission during the 6 months after hospital discharge.
To test the robustness of our main results, we conducted a sensitivity analysis assessing disability scores of the 150 participants that contributed only one ACSC-related hospitalization. All analyses were performed using Stata, version 16.0, statistical software (StataCorp).
RESULTS
Table 1 shows the characteristics of the 251 ACSC-related hospitalizations immediately prior to hospitalization. Participants’ mean (SD) age was 85.1 (6.0) years, and the mean total disability score was 5.4. The majority were female, non-Hispanic White, frail, and lived alone. As shown in Appendix Table 2, the three most common reasons for ACSC-related hospitalizations were congestive heart failure (n = 69), bacterial pneumonia (n = 53), and dehydration (n = 44).
The Figure shows the disability scores during the 6-month follow-up period for total, basic, instrumental, and mobility activities, in panels A, B, C, and D, respectively. The exact values are provided in Appendix Table 3. After hospitalization, disability scores for total, basic, instrumental, and mobility activities peaked at month 1 and tended to improve modestly over the next 5 months, but remained greater, on average, than pre-hospitalization scores. Of the 40 participants who died within the 6-month follow-up period, 36 (90%) had worse disability scores in their last month of life than in the month prior to their ACSC-related hospitalization.
Table 2 shows the cumulative probability of functional recovery after ACSC-related hospitalizations. Recovery was incomplete, with only 70% (95% CI, 64%-76%) of hospitalizations achieving a return to the pre-hospitalization total disability score within 6 months of hospitalization.
Table 3 shows the cumulative probability of incident NH admission after an ACSC-related hospitalization. Of the 251 ACSC-related hospitalizations, incident NH admission was experienced by 38% (95% CI, 32%-44%) within 1 month and 50% (95% CI, 43%-56%) within 6 months of discharge. Short-term NH stays accounted for 90 (75.6%) of the 119 incident NH admissions within the 6 months after ACSC-related hospitalizations. Sensitivity analyses yielded comparable disability scores, shown in Appendix Table 4.
DISCUSSION
In this longitudinal study of community-living older persons, we evaluated functional disability, recovery, and incident NH admission within 6 months of hospitalization for an ACSC. Our study has three major findings. First, disability scores for total, basic, instrumental, and mobility activities at months 1 to 6 of follow-up were greater on average than pre-hospitalization scores. Second, functional recovery was not achieved by 3 of 10 participants after an ACSC-related hospitalization. Third, half of them experienced an incident NH admission within 6 months of discharge from an ACSC-related hospitalization, although about three-quarters of these were short-term stays. Our findings provide evidence that older persons experience clinically meaningful adverse patient-reported outcomes after ACSC-related hospitalizations.
Prior research involving ACSCs has focused largely on rates of hospitalization as a measure of access to primary care and the associated factors predictive of ACSC-related hospitalizations,23-26 and has not addressed subsequent patient-reported outcomes. The findings in this analysis highlight that older persons experience worsening disability immediately after an ACSC-related hospitalization, which persists for prolonged periods and often results in incomplete recovery. Prior research has assessed pre-hospitalization functional status through retrospective recall approaches,2 included only older adults discharged with incident disability,3 and examined functional status after all-cause medical illness hospitalizations.5 Our prospective analysis extends the literature by reliably capturing pre-hospital disability scores and uniquely assessing the cohort of older persons hospitalized with ACSCs.
Our work is relevant to the continued evaluation of ACSC-related hospitalizations in national quality measurement and payment initiatives among Medicare beneficiaries. In prior evaluations of ACSC-related quality measures, stakeholders have criticized the measures for limited validity due to a lack of evidence linking each utilization outcome to other patient-centered outcomes.10,27 Our work addresses this gap by demonstrating that ACSC-related hospitalizations are linked to persistent disability, incomplete functional recovery, and incident NH admissions. Given the large body of evidence demonstrating the priority older persons place on these patient-reported outcomes,28,29 our work should reassure policymakers seeking to transform quality measurement programs into a more patient-oriented enterprise.
Our findings have several clinical practice, research, and policy implications. First, more-effective clinical strategies to minimize the level of care required for acute exacerbations of ACSC-related illnesses may include: (1) substituting home-based care30 and telehealth interventions31 for traditional inpatient hospitalization, (2) making in-ED resources (ie, case management services, geriatric-focused advanced practice providers) more accessible for older persons with ACSC-related illnesses, thereby enhancing care transitions and follow-up to avoid potential current and subsequent hospitalizations, and (3) ensuring adequate ambulatory care access to all older persons, as prior work has shown variation in ACSC hospital admission rates dependent on population factors such as high-poverty neighborhoods,16 insurance status,16,32 and race/ethnicity.33
Clinical strategies have been narrow and not holistic for ACSCs; for example, many institutions have focused on pneumonia vaccinations to reduce hospitalizations, but our work supports the need to further evaluate the impact of preventing ACSC-related hospitalizations and their associated disabling consequences. For patients admitted to the hospital, clinical strategies, such as in-hospital or post-hospital mobility and activity programs, have been shown to be protective against hospital-associated disability.34,35 Furthermore, hospital discharge planning could include preparing older persons for anticipated functional disabilities, associated recoveries, and NH admission after ACSC-related hospitalizations. Risk factors contributing to post-hospitalization functional disability and recovery have been identified,19,20,36 but future work is needed to: (1) identify target populations (including those most likely to worsen) so that interventions can be offered earlier in the course of care to those who would benefit most, and (2) identify and learn from those who are resilient and have recovered, to better understand factors contributing to their success.
Our study has several strengths. First, the study is unique due to its longitudinal design, with monthly assessments of functional status. Since functional status was assessed prospectively before the ACSC-related hospitalization, we also have avoided any potential concern for recall bias that may be present if assessed after the hospitalization. Additionally, through the use of Medicare claims and the Minimum Data Set, the ascertainment of hospitalizations and NH admissions was likely complete for the studied population.
However, the study has limitations. First, functional measures were based on self-reports rather than objective measurements. Nevertheless, the self-report function is often used to guide coverage determinations in the Medicare program, as it has been shown to be associated with poor health outcomes.37 Second, we are unable to comment on the rate of functional decline or NH admission when an older person was not hospitalized in relation to an ACSC. Future analyses may benefit from using a control group (eg, older adults without an ACSC hospitalization or older adults with a non-ACSC hospitalization). Third, we used strict exclusion criteria to identify a population of older adults without recent hospitalizations to determine the isolated impact of ACSC hospitalization on disability, incident NH admission, and functional recovery. Considering this potential selection bias, our findings are likely conservative estimates of the patient-centered outcomes evaluated. Fourth, participants were not asked about feeding and toileting. However, the incidence of disability in these ADLs is low among nondisabled, community-living older persons, and it is highly uncommon for disability to develop in these ADLs without concurrent disability in the ADLs within this analysis.14,38
Finally, because our study participants were members of a single health plan in a small urban area and included nondisabled older persons living in the community, our findings may not be generalizable to geriatric patients in other settings. Nonetheless, the demographics of our cohort reflect those of older persons in New Haven County, Connecticut, which are similar to the demographics of the US population, with the exception of race and ethnicity. In addition, the generalizability of our results are strengthened by the study’s high participation rate and minimal attrition.
CONCLUSION
Within 6 months of ACSC-related hospitalizations, community-living older persons exhibited greater total disability scores than those immediately preceding hospitalization. In the same time frame, 3 of 10 older persons did not achieve functional recovery, and half experienced incident NH admission. These results provide evidence regarding the continued recognition of ACSC-related hospitalizations in federal quality measurement and payment programs and suggests the need for preventive and comprehensive interventions to meaningfully improve longitudinal outcomes.
Acknowledgments
We thank Denise Shepard, BSN, MBA, Andrea Benjamin, BSN, Barbara Foster, and Amy Shelton, MPH, for assistance with data collection; Geraldine Hawthorne, BS, for assistance with data entry and management; Peter Charpentier, MPH, for design and development of the study database and participant tracking system; and Joanne McGloin, MDiv, MBA, for leadership and advice as the Project Director. Each of these persons were paid employees of Yale School of Medicine during the conduct of this study.
1. Covinsky KE, Pierluissi E, Johnston CB. Hospitalization-associated disability: “She was probably able to ambulate, but I’m not sure” JAMA. 2011;306(16):1782-1793. https://doi.org/10.1001/jama.2011.1556
2. Covinsky KE, Palmer RM, Fortinsky RH, et al. Loss of independence in activities of daily living in older adults hospitalized with medical illnesses: increased vulnerability with age. J Am Geriatr Soc. 2003;51(4):451-458. https://doi.org/10.1046/j.1532-5415.2003.51152.x
3. Barnes DE, Mehta KM, Boscardin WJ, et al. Prediction of recovery, dependence or death in elders who become disabled during hospitalization. J Gen Intern Med. 2013;28(2):261-268. https://doi.org/10.1007/s11606-012-2226-y
4. Gill TM, Allore HG, Gahbauer EA, Murphy TE. Change in disability after hospitalization or restricted activity in older persons. JAMA. 2010;304(17):1919-1928. https://doi.org/10.1001/jama.2010.1568
5. Boyd CM, Landefeld CS, Counsell SR, et al. Recovery of activities of daily living in older adults after hospitalization for acute medical illness. J Am Geriatr Soc. 2008;56(12):2171-2179. https://doi.org/10.1111/j.1532-5415.2008.02023.x
6. Loyd C, Markland AD, Zhang Y, et al. Prevalence of hospital-associated disability in older adults: a meta-analysis. J Am Med Dir Assoc. 2020;21(4):455-461. https://doi.org/10.1016/j.jamda.2019.09.015
7. Dharmarajan K, Han L, Gahbauer EA, Leo-Summers LS, Gill TM. Disability and recovery after hospitalization for medical illness among community-living older persons: a prospective cohort study. J Am Geriatr Soc. 2020;68(3):486-495. https://doi.org/10.1111/jgs.16350
8. Levine DA, Davydow DS, Hough CL, Langa KM, Rogers MAM, Iwashyna TJ. Functional disability and cognitive impairment after hospitalization for myocardial infarction and stroke. Circ Cardiovasc Qual Outcomes. 2014;7(6):863-871. https://doi.org/10.1161/HCQ.0000000000000008
9. Iwashyna TJ, Ely EW, Smith DM, Langa KM. Long-term cognitive impairment and functional disability among survivors of severe sepsis. JAMA. 2010;304(16):1787-1794. https://doi.org/10.1001/jama.2010.1553
10. Hodgson K, Deeny SR, Steventon A. Ambulatory care-sensitive conditions: their potential uses and limitations. BMJ Qual Saf. 2019;28(6):429-433. https://doi.org/10.1136/bmjqs-2018-008820
11. Agency for Healthcare Research and Quality (AHRQ). Quality Indicator User Guide: Prevention Quality Indicators (PQI) Composite Measures. Version 2020. Accessed November 10, 2020. https://www.qualityindicators.ahrq.gov/modules/pqi_resources.aspx.
12. Centers for Medicare & Medicaid Services. 2016 Measure information about the hospital admissions for acute and chronic ambulatory care-sensitive condition (ACSC) composite measures, calculated for the 2018 value-based payment modified program. Accessed November 24, 2020. https://www.cms.gov/Medicare/Medicare-Fee-for-Service-Payment/PhysicianFeedbackProgram/Downloads/2016-ACSC-MIF.pdf.
13. Gill TM, Desai MM, Gahbauer EA, Holford TR, Williams CS. Restricted activity among community-living older persons: incidence, precipitants, and health care utilization. Ann Intern Med. 2001;135(5):313-321. https://doi.org/10.7326/0003-4819-135-5-200109040-00007
14. Gill TM, Hardy SE, Williams CS. Underestimation of disability in community-living older persons. J Am Geriatr Soc. 2002;50(9):1492-1497. https://doi.org/10.1046/j.1532-5415.2002.50403.x
15. Agency for Healthcare Research and Quality. Prevention Quality Indicators Technical Specifications Updates—Version v2018 and 2018.0.1 (ICD 10-CM/PCS), June 2018. Accessed February 4, 2020. https://www.qualityindicators.ahrq.gov/Modules/PQI_TechSpec_ICD10_v2018.aspx.
16. Johnson PJ, Ghildayal N, Ward AC, Westgard BC, Boland LL, Hokanson JS. Disparities in potentially avoidable emergency department (ED) care: ED visits for ambulatory care sensitive conditions. Med Care. 2012;50(12):1020-1028. https://doi.org/10.1097/MLR.0b013e318270bad4
17. Galarraga JE, Mutter R, Pines JM. Costs associated with ambulatory care sensitive conditions across hospital-based settings. Acad Emerg Med. 2015;22(2):172-181. https://doi.org/10.1111/acem.12579
18. Ferrante LE, Pisani MA, Murphy TE, Gahbauer EA, Leo-Summers LS, Gill TM. Functional trajectories among older persons before and after critical illness. JAMA Intern Med. 2015;175(4):523-529. https://doi.org/10.1001/jamainternmed.2014.7889
19. Gill TM, Gahbauer EA, Murphy TE, Han L, Allore HG. Risk factors and precipitants of long-term disability in community mobility: a cohort study of older persons. Ann Intern Med. 2012;156(2):131-140. https://doi.org/10.7326/0003-4819-156-2-201201170-00009
20. Hardy SE, Gill TM. Factors associated with recovery of independence among newly disabled older persons. Arch Intern Med. 2005;165(1):106-112. https://doi.org/10.1001/archinte.165.1.106
21. Centers for Medicare & Medicaid Services. Nursing Home Quality Initiative—Quality Measures. Accessed June 13, 2021. https://www.cms.gov/Medicare/Quality-Initiatives-Patient-Assessment-Instruments/NursingHomeQualityInits/NHQIQualityMeasures
22. Goodwin JS, Li S, Zhou J, Graham JE, Karmarkar A, Ottenbacher K. Comparison of methods to identify long term care nursing home residence with administrative data. BMC Health Serv Res. 2017;17(1):376. https://doi.org/10.1186/s12913-017-2318-9
23. Laditka, JN, Laditka SB, Probst JC. More may be better: evidence of a negative relationship between physician supply and hospitalization for ambulatory care sensitive conditions. Health Serv Res. 2005;40(4):1148-1166. https://doi.org/10.1111/j.1475-6773.2005.00403.x
24. Ansar Z, Laditka JN, Laditka SB. Access to health care and hospitalization for ambulatory care sensitive conditions. Med Care Res Rev. 2006;63(6):719-741. https://doi.org/10.1177/1077558706293637
25. Mackinko J, de Oliveira VB, Turci MA, Guanais FC, Bonolo PF, Lima-Costa MF. The influence of primary care and hospital supply on ambulatory care-sensitive hospitalizations among adults in Brazil, 1999-2007. Am J Public Health. 2011;101(10):1963-1970. https://doi.org/10.2105/AJPH.2010.198887
26. Gibson OR, Segal L, McDermott RA. A systematic review of evidence on the association between hospitalisation for chronic disease related ambulatory care sensitive conditions and primary health care resourcing. BMC Health Serv Res. 2013;13:336. https://doi.org/10.1186/1472-6963-13-336
27. Vuik SI, Fontana G, Mayer E, Darzi A. Do hospitalisations for ambulatory care sensitive conditions reflect low access to primary care? An observational cohort study of primary care usage prior to hospitalisation. BMJ Open. 2017;7(8):e015704. https://doi.org/10.1136/bmjopen-2016-015704
28. Fried TR, Tinetti M, Agostini J, Iannone L, Towle V. Health outcome prioritization to elicit preferences of older persons with multiple health conditions. Patient Educ Couns. 2011;83(2):278-282. https://doi.org/10.1016/j.pec.2010.04.032
29. Reuben DB, Tinetti ME. Goal-oriented patient care—an alternative health outcomes paradigm. N Engl J Med. 2012;366(9):777-779. https://doi.org/10.1056/NEJMp1113631
30. Federman AD, Soones T, DeCherrie LV, Leff B, Siu AL. Association of a bundled hospital-at-home and 30-day postacute transitional care program with clinical outcomes and patient experiences. JAMA Intern Med. 2018;178(8):1033-1040. https://doi.org/10.1001/jamainternmed.2018.2562
31. Shah MN, Wasserman EB, Gillespie SM, et al. High-intensity telemedicine decreases emergency department use for ambulatory care sensitive conditions by older adult senior living community residents. J Am Med Dir Assoc. 2015;16(12):1077-1081. https://doi.org/10.1016/j.jamda.2015.07.009
32. Oster A, Bindman AB. Emergency department visits for ambulatory care sensitive conditions: insights into preventable hospitalizations. Med Care. 2003;41(2):198-207. https://doi.org/10.1097/01.MLR.0000045021.70297.9F
33. O’Neil SS, Lake T, Merrill A, Wilson A, Mann DA, Bartnyska LM. Racial disparities in hospitalizations for ambulatory care-sensitive conditions. Am J Prev Med. 2010;38(4):381-388. https://doi.org/10.1016/j.amepre.2009.12.026
34. Pavon JM, Sloane RJ, Pieper RF, et al. Accelerometer-measured hospital physical activity and hospital-acquired disability in older adults. J Am Geriatr Soc. 2020;68:261-265. https://doi.org/10.1111/jgs.16231
35. Sunde S, Hesseberg K, Skelton DA, et al. Effects of a multicomponent high intensity exercise program on physical function and health-related quality of life in older adults with or at risk of mobility disability after discharge from hospital: a randomised controlled trial. BMC Geriatr. 2020;20(1):464. https://doi.org/10.1186/s12877-020-01829-9
36. Hardy SE, Gill TM. Recovery from disability among community-dwelling older persons. JAMA. 2004;291(13):1596-1602. https://doi.org/10.1001/jama.291.13.1596
37. Rotenberg J, Kinosian B, Boling P, Taler G, Independence at Home Learning Collaborative Writing Group. Home-based primary care: beyond extension of the independence at home demonstration. J Am Geriatr Soc. 2018;66(4):812-817. https://doi.org/10.1111/jgs.15314
38. Rodgers W, Miller B. A comparative analysis of ADL questions in surveys of older people. J Gerontol B Psychol Sci Soc Sci. 1997;52:21-36. https://doi.org/10.1093/geronb/52b.special_issue.21
© 2021 Society of Hospital Medicine