User login
Cardiovascular Effects of Tyrosine Kinase Inhibitors in Patients With Advanced Renal Cell Carcinoma at the VA San Diego Healthcare System (FULL)
Patients who have or are at high risk for developing cardiovascular disease and who are taking tyrosine kinase inhibitors for renal cell carcinoma should receive routine cardiovascular event monitoring during the first 4 months of therapy.
Targeted therapies have transformed the treatment of many malignant diseases by inhibiting molecular pathways involved in tumor growth and oncogenesis. Although these therapies can prevent disease progression, toxicities often result. Renal cell carcinoma (RCC) is one of many cancers that responds well to these therapies.
RCC accounts for 2% to 3% of all malignancies in adults worldwide. About 30% of patients with RCC present with metastatic or advanced disease.1 Cytokine therapy was the standard of care until multitargeted tyrosine kinase inhibitors (TKIs) were developed. Over the past 12 years, the US Food and Drug Administration (FDA) has approved 6 TKIs for the treatment of RCC: axitinib, cabozantinib, lenvatinib, pazopanib, sorafenib, and sunitinib. Vascular endothelial growth factor receptor (VEGFR) is one of many tyrosine kinase receptors targeted by these medications. This mechanism prevents angiogenesis and consequently increases the risk for hypertension, bleeding, and clot formation.
Given these risks, many patients were excluded from the initial clinical trials of these medications if they had a history of uncontrolled hypertension, advanced heart failure (HF), or a significant cardiovascular (CV) event within 6 months prior to study enrollment. Many of these studies did not report the incidence of CV events (other than hypertension) that occurred during the early trials.2 The recommended monitoring for TKI therapies is focused mainly on blood pressure. For patients on pazopanib and sunitinib therapy, baseline and periodic electrocardiograms (ECGs) are recommended; echocardiograms are recommended only for patients with a history of cardiac disease.3,4 In patients on sorafenib therapy, ECG is recommended for those at risk for corrected QT (QTc) intervalprolongation.5
According to a meta-analysis of the literature published between 1966 and 2013,many studies reported a CV toxicity risk associated with the TKIs used in RCC treatment.6 However, some studies have found modest, not clinically significant changes in cardiac function in patients with advanced disease. In 2013, Hall and colleagues found 73% of patients they studied experienced some type of CV toxicity, whereas only 33% of patients had CV toxicity when hypertension was excluded.7 Interestingly, Rini and colleagues found that RCC patients receiving sunitinib had better response rates and progression-free survival when they developed hypertension compared with those who did not develop hypertension.8
A review of several studies revealed similar numbers in patients on TKI therapy presenting with symptomatic HF, but Hall and colleagues found that 27% of patients developed asymptomatic left ventricular dysfunction.7,9,10 These results suggest routine monitoring may allow for appropriate preventive interventions. In patients receiving TKI therapy, CV events, including QTc prolongation, left ventricular HF, myocardial infarction (MI), hypertension, pulmonary hypertension, and stroke, were commonly reported by investigators.7,9,10 Currently, there are no studies of the incidence of CV events for the 5 TKIs (axitinib, cabozantinib, pazopanib, sorafenib, sunitinib) in this patient population.
TKI therapy may require cardiac monitoring of all patients, as studies have associated TKIs with CV toxicity in varying degrees. Therefore, the authors set out to determine the incidence of CV events as well as time to first CV event in patients with and without a history of CV disease (CVD) who received a TKI for advanced RCC. More frequent monitoring for CV toxicity may present opportunities for clinical interventions for all patients on TKI therapy—especially for those with HF or other diseases in which the goal of therapy is to prevent disease progression. As TKIs have emerged as the standard treatment option for advanced RCC, many patients will continue therapy until disease progression or intolerable toxicity. Identifying and using appropriate monitoring parameters can lead to preventive interventions that allow patients to benefit from TKI therapy longer. At the US Department of Veterans Affairs (VA) San Diego Healthcare System (VASDHS), patients undergo routine cardiac monitoring at the discretion of the provider.
In this retrospective study, the authors wanted to determine the incidence of CV events in patients with and without a history of CVD who were receiving TKIs for advanced RCC. The authors also wanted to evaluate time to CV event from start of therapy in order to determine how often monitoring may be needed. The outcomes of this study may lead to a change in practice and development of monitoring parameters to ensure appropriate and adequate management of TKI therapy in RCC.
Methods
Each year, the VASDHS oncology team diagnose 5 to 10 patients with RCC who begin TKI therapy. When sorafenib was approved by the FDA in 2005, VASDHS estimated that about 100 of its patients had an RCC diagnosis and would be treated with a TKI between December 2005 and July 2017.
The authors identified VASDHS patients with a diagnosis of advanced RCC who received axitinib, cabozantinib, pazopanib, sorafenib, or sunitinib between December 1, 2005 and July 31, 2017. Patients were included if they had been on therapy for at least 30 days. The VASDHS pharmacy informatics team assisted in extracting a list of patients with an ICD-9 or ICD-10 diagnosis of RCC and using prescription fills for any of the 5 TKIs previously noted. Medical records were reviewed for frequency of prescription fills, age, sex, Eastern Cooperative Oncology Group (ECOG) performance status, TKI treatment duration, previous history of CVD, ethnicity, and smoking status. If documented, the incidence of CV events was reviewed for each patient at 0, 1, 3, 6, and 12 months. Patients who received medications (Appendix) for their CVD were assessed for adherence based on history of prescription refills from their medical records. Adherence was evaluated for the duration that patients were concurrently taking an oral TKI. The institutional review board at VASDHS approved the study design.
All patients included in this study started TKI therapy since the December 2005 FDA approval of sorafenib, the first oral TKI for treatment of RCC. Each new start was recorded as a separate event, regardless of previous oral TKI therapy. Albiges and colleagues found that the approximate median time from starting TKI therapy to complete response was 12.6 months, and the median duration of TKI therapy after complete response was 10.3 months.11 Based on these results, the follow-up period for patients in this study was 2 years after the start of each TKI therapy. For data analysis, patients were stratified by CVD history (yes or no). In addition, composite outcomes were evaluated to identify a potential cumulative increased risk for CV events for patients who had been on multiple TKI therapies.
For this study, CV toxicities were characterized using Common Terminology Criteria for Adverse Events (CTCAE) version 4.03; severity of adverse events (AEs) was graded 1 to 5. CTCAE commonly has been used to assess AEs in oncology clinical trials. The CV AEs selected for this study included QTc prolongation, hypertension, left ventricular dysfunction, stroke, myocardial infarction (MI), and pulmonary arterial hypertension.
Primary outcomes included incidence of CV events and time to first CV event after initiation of TKI therapy. Secondary outcomes included changes in ECG or echocardiogram results at 0, 1, 3, 6, and 12 months. Secondary outcomes at scheduled time points were not readily available for every patient, but any available time points were gathered to aid in identifying an optimal period for cardiac monitoring. In addition, patients with a history of CVD were evaluated for adherence to common first-line therapies for each disease.
A Fischer exact test was used to compare the incidence of CV events in patients with and without a history of CVD (significance level, α = 0.05). A subgroup analysis was used to compare the incidence of CV events in patients who experienced a CV event (significance level, α = 0.05). A Kaplan-Meier survival curve was used to determine time to first CV event. A log-rank test with significance level set at α = 0.05 also was used.
Results
An initial database search identified 134 patients who received TKI therapy at VASDHS between December 1, 2005 and July 31, 2017. According to retrospective chart review, 54 patients met the inclusion criteria for the study (Table 1). 
Patients without a history of CVD (17%) did not experience any CV events while on TKI therapy. Of the patients with a history of CVD, 9 (20%) experienced ≥ 1 CV event. Fifty-five percent of the events experienced were hypertension. One patient experienced QTc prolongation, and 2 patients experienced MI. As already noted, each new start of TKI was recorded as a separate event, regardless of previous TKI therapy. Among patients with a history of CVD, 2 experienced 2 CV events. Overall, 11 CV events occurred among patients who received ≥ 1 TKI, corresponding to an overall incidence of 24% (Table 2). 


Of the 13 patients who were exposed to ≥ 2 TKI therapies, 2 experienced a CV event. Both patients were started on sunitinib and were switched to sorafenib. One of these used sunitinib for 7 months, experienced a partial response and was switched to sorafenib (with a 3-month break between therapies). The second patient was on sunitinib for 24 months, with multiple doses held because of low blood counts and diarrhea. While on sunitinib, this patient experienced a HF exacerbation, determined to be caused by the underlying disease. This event occurred 17 months after sunitinib was started, and therapy was continued for another 7 months. The patient was switched to sorafenib because of poor tolerability and disease progression. While on sorafenib, this patient experienced grade 1 QTc prolongation.
Discussion
Of the available oral TKI therapies for RCC, sunitinib and sorafenib have the most data associated with nonhypertensive CV toxicity.2,7-10,12 Instudies, the percentage of patients who experienced CV toxicity while on sunitinib or sorafenib has ranged widely, from 2.7% to 33.8%; the variance may be attributable to differences in how institutions report CV toxicities.7-9
According to the prescribing information for TKIs, hypertension is frequently reported as an AE for all 5 TKIs, and BP monitoring is recommended.3,4 However, the development of hypertension with these TKIs has been associated with response to therapy.7 With pazopanib, sorafenib, and sunitinib, there is a higher incidence of other AEs: edema, HF, MI, and QTc prolongation. Baseline ECG is recommended for all patients started on pazopanib and sunitinib and for patients with a history of CVD who are started on sorafenib. An ECG is recommended for patients with a history of CVD who are started on pazopanib and sunitinib.
Even with the medication prescribing information recommendations, it is unclear how frequently patients should be monitored. At VASDHS, CV monitoring for any patient started on a TKI remains at the discretion of the oncologist. There are concerns that ordering cardiac monitoring tests, which might be unnecessary, will change or guide therapy. In this study, data evaluation revealed 1 patient who experienced a CV event had a CVD history that was not documented in the patient’s medical history. It is important that providers obtain a detailed clinical assessment of patients CV history during each visit to determine whether CV monitoring should be considered. Patients also may benefit from additional counseling to emphasize the importance of adherence to CV medication therapy to reduce the incidence of these events.
Data from this study indicate that routine CV monitoring should be considered in patients with CVD, in keeping with current medication prescribing information recommendations. Of the patients who had a CV event, 54% experienced hypertension, 18% MI, and 28% stroke, QTc prolongation, or congestive HF. 
Limitations
This retrospective study had several limitations. Many patients did not have a baseline cardiac monitoring test or any monitoring during therapy. Often, a cardiac test was performed only when the patient was symptomatic or experiencing a CV event. In addition, because of intolerance or nonadherence to therapy, many patients discontinued treatment early, before completing 30 days. That axitinib and cabozantinib are newer therapies and not first-line at VASDHS during the data collection period accounts for the small number of patients on these therapies. Therapy was shorter for patients started on pazopanib, axitinib, and cabozantinib than it was for patients on sunitinib and sorafenib. Duration of therapy may affect treatment-related events, but the majority of patients in this study experienced an event within 4 months of therapy. About half of the patients who experienced an event were nonadherent to their CV medication regimen. Another potential limitation is that this study was conducted at VASDHS, where most patients are male (RCC incidence is 2:1 male:female).
Conclusion
In this study, CV events occurred in 24% of patients with a history of CVD; 11% of these events were nonhypertensive. Baseline cardiac monitoring was not performed for most patients started on TKI therapy, but tests were performed once patients became symptomatic. The study results suggest that high-risk patients should undergo routine cardiac monitoring during the first 4 months of TKI therapy, in keeping with medication package insert monitoring recommendations. Cardiac monitoring of high-risk patients will allow for earlier identification of cardiac decline and offer opportunities for interventions, such as pharmacist-driven protocols to start CV medications. Implementation of this study’s recommendations should be evaluated to determine whether outcomes improve with routine cardiac monitoring in these high-risk patients.

Author disclosures
The authors report no actual or potential conflicts of interest with regard to this article.
Disclaimer
The opinions expressed herein are those of the authors and do not necessarily reflect those of Federal Practitioner, FrontlineMedical Communications Inc., the US Government, or any of its agencies. This article may discuss unlabeled or investigational use of certain drugs. Please review the complete prescribing information for specific drugs or drug combinations—including indications, contraindications, warnings, and adverse effects— before administering pharmacologic therapy to patients.
1. Rini, BI, Escudier B, Tomczak P, et al. Comparative effectiveness of axitinib versus sorafenib in advanced renal cell carcinoma (AXIS): a randomised phase 3 trial. Lancet. 2011;378(9807):1931-1939.
2. Tolcher AW, Appleman LJ, Shapiro GI, et al. A phase I open-label study evaluating the cardiovascular safety of sorafenib in patients with advanced cancer. Cancer Chemother Pharmacol. 2011;67(4):751-764.
3. Votrient [package insert]. Research Triangle Park, NC: GlaxoSmithKline; 2017.
4. Sutent [package insert]. New York, NY: Pfizer Labs; 2018.
5. Nexavar [package insert]. Wayne, NJ; Bayer HealthCare Pharmaceuticals Inc; 2018.
6. Ghatalia P, Morgan CJ, Je Y, et al. Congestive heart failure with vascular endothelial growth factor receptor tyrosine kinase inhibitors. Crit Rev Oncol Hematol 2015;94:228–237.
7. Hall PS, Harshman LC, Srinivas S, Witteles RM. The frequency and severity of cardiovascular toxicity from targeted therapy in advanced renal cell carcinoma patients. JACC Heart Fail. 2013;1(1):72-78.
8. Rini BI, Cohen DP, Lu DR, et al. Hypertension as a biomarker of efficacy in patients with metastatic renal cell carcinoma treated with sunitinib. J Natl Cancer Inst. 2011;103(9):763-773.
9. Richards CJ, Je Y, Schutz FA, et al. Incidence and risk of congestive heart failure in patients with renal and nonrenal cell carcinoma treated with sunitinib. J Clin Oncol. 2011;29(25):3450-3456.
10. Schmidinger M, Zielinski CC, Vogl UM, et al. Cardiac toxicity of sunitinib and sorafenib in patients with metastatic renal cell carcinoma. J Clin Oncol. 2008;26(32):5204-5212.
11. Albiges L, Oudard S, Negrier S, et al. Complete remission with tyrosine kinase inhibitors in renal cell carcinoma. J Clin Oncol. 2012;30(5):482-487.
12. Jang S, Zheng C, Tsai HT, et al. Cardiovascular toxicity after antiangiogenic therapy in persons older than 65 years with advanced renal cell carcinoma. Cancer. 2016;122(1):124-130
13. James PA, Oparil S, Carter BL, et al. 2014 evidence-based guideline for the management of high blood pressure in adults: report from the panel members appointed to the eighth Joint National Committee (JNC 8). JAMA. 2014;311(5):507-520.
14. Yancy CW, Jessup M, Bozkurt B, et al. ACC/AHA/HFSA Focused Update of the 2013 ACCF/AHA Guideline for the Management of Heart Failure: A Report of the American College of Cardiology/American Heart Association Task Force on Clinical Practice Guidelines and the Heart Failure Society of America. JACC. 2017;70(6):776-803.
15. Kernan WN, Ovbiagele B, Black HR, et al; American Heart Association Stroke Council, Council on Cardiovascular and Stroke Nursing, Council on Clinical Cardiology, and Council on Peripheral Vascular Disease. Guidelines for the prevention of stroke in patients with stroke and transient ischemic attack: a guideline for healthcare professionals from the American Heart Association/American Stroke Association. Stroke. 2014;45(7):2160-2236.
16. O’Gara PT, Kushner FG, Ascheim DD, et al; American College of Cardiology Foundation/American Heart Association Task Force on Practice Guidelines. 2013 ACCF/AHA guideline for the management of ST-elevation myocardial infarction: a report of the American College of Cardiology Foundation/American Heart Association Task Force on Practice Guidelines. JACC. 2013;61(4):e78-e140.
17. Amsterdam EA, Wenger NK, Brindis RG, et al. 2014 AHA/ACC guideline for the management of patients with non–ST-elevation acute coronary syndromes: a report of the American College of Cardiology/American Heart Association Task Force on Practice Guidelines. J Am Coll Cardiol. 2014;64(24):e139-e228.
18. Galiè N, Humbert M, Vachiery JL, et al; ESC Scientific Document Group. 2015 ESC/ERS guidelines for the diagnosis and treatment of pulmonary hypertension: the Joint Task Force for the Diagnosis and Treatment of Pulmonary Hypertension of the European Society of Cardiology (ESC) and the European Respiratory Society (ERS): endorsed by: Association for European Paediatric and Congenital Cardiology (AEPC), International Society for Heart and Lung Transplantation (ISHLT). Eur Heart J. 2016;37(1):67-119.
Patients who have or are at high risk for developing cardiovascular disease and who are taking tyrosine kinase inhibitors for renal cell carcinoma should receive routine cardiovascular event monitoring during the first 4 months of therapy.
Patients who have or are at high risk for developing cardiovascular disease and who are taking tyrosine kinase inhibitors for renal cell carcinoma should receive routine cardiovascular event monitoring during the first 4 months of therapy.
Targeted therapies have transformed the treatment of many malignant diseases by inhibiting molecular pathways involved in tumor growth and oncogenesis. Although these therapies can prevent disease progression, toxicities often result. Renal cell carcinoma (RCC) is one of many cancers that responds well to these therapies.
RCC accounts for 2% to 3% of all malignancies in adults worldwide. About 30% of patients with RCC present with metastatic or advanced disease.1 Cytokine therapy was the standard of care until multitargeted tyrosine kinase inhibitors (TKIs) were developed. Over the past 12 years, the US Food and Drug Administration (FDA) has approved 6 TKIs for the treatment of RCC: axitinib, cabozantinib, lenvatinib, pazopanib, sorafenib, and sunitinib. Vascular endothelial growth factor receptor (VEGFR) is one of many tyrosine kinase receptors targeted by these medications. This mechanism prevents angiogenesis and consequently increases the risk for hypertension, bleeding, and clot formation.
Given these risks, many patients were excluded from the initial clinical trials of these medications if they had a history of uncontrolled hypertension, advanced heart failure (HF), or a significant cardiovascular (CV) event within 6 months prior to study enrollment. Many of these studies did not report the incidence of CV events (other than hypertension) that occurred during the early trials.2 The recommended monitoring for TKI therapies is focused mainly on blood pressure. For patients on pazopanib and sunitinib therapy, baseline and periodic electrocardiograms (ECGs) are recommended; echocardiograms are recommended only for patients with a history of cardiac disease.3,4 In patients on sorafenib therapy, ECG is recommended for those at risk for corrected QT (QTc) intervalprolongation.5
According to a meta-analysis of the literature published between 1966 and 2013,many studies reported a CV toxicity risk associated with the TKIs used in RCC treatment.6 However, some studies have found modest, not clinically significant changes in cardiac function in patients with advanced disease. In 2013, Hall and colleagues found 73% of patients they studied experienced some type of CV toxicity, whereas only 33% of patients had CV toxicity when hypertension was excluded.7 Interestingly, Rini and colleagues found that RCC patients receiving sunitinib had better response rates and progression-free survival when they developed hypertension compared with those who did not develop hypertension.8
A review of several studies revealed similar numbers in patients on TKI therapy presenting with symptomatic HF, but Hall and colleagues found that 27% of patients developed asymptomatic left ventricular dysfunction.7,9,10 These results suggest routine monitoring may allow for appropriate preventive interventions. In patients receiving TKI therapy, CV events, including QTc prolongation, left ventricular HF, myocardial infarction (MI), hypertension, pulmonary hypertension, and stroke, were commonly reported by investigators.7,9,10 Currently, there are no studies of the incidence of CV events for the 5 TKIs (axitinib, cabozantinib, pazopanib, sorafenib, sunitinib) in this patient population.
TKI therapy may require cardiac monitoring of all patients, as studies have associated TKIs with CV toxicity in varying degrees. Therefore, the authors set out to determine the incidence of CV events as well as time to first CV event in patients with and without a history of CV disease (CVD) who received a TKI for advanced RCC. More frequent monitoring for CV toxicity may present opportunities for clinical interventions for all patients on TKI therapy—especially for those with HF or other diseases in which the goal of therapy is to prevent disease progression. As TKIs have emerged as the standard treatment option for advanced RCC, many patients will continue therapy until disease progression or intolerable toxicity. Identifying and using appropriate monitoring parameters can lead to preventive interventions that allow patients to benefit from TKI therapy longer. At the US Department of Veterans Affairs (VA) San Diego Healthcare System (VASDHS), patients undergo routine cardiac monitoring at the discretion of the provider.
In this retrospective study, the authors wanted to determine the incidence of CV events in patients with and without a history of CVD who were receiving TKIs for advanced RCC. The authors also wanted to evaluate time to CV event from start of therapy in order to determine how often monitoring may be needed. The outcomes of this study may lead to a change in practice and development of monitoring parameters to ensure appropriate and adequate management of TKI therapy in RCC.
Methods
Each year, the VASDHS oncology team diagnose 5 to 10 patients with RCC who begin TKI therapy. When sorafenib was approved by the FDA in 2005, VASDHS estimated that about 100 of its patients had an RCC diagnosis and would be treated with a TKI between December 2005 and July 2017.
The authors identified VASDHS patients with a diagnosis of advanced RCC who received axitinib, cabozantinib, pazopanib, sorafenib, or sunitinib between December 1, 2005 and July 31, 2017. Patients were included if they had been on therapy for at least 30 days. The VASDHS pharmacy informatics team assisted in extracting a list of patients with an ICD-9 or ICD-10 diagnosis of RCC and using prescription fills for any of the 5 TKIs previously noted. Medical records were reviewed for frequency of prescription fills, age, sex, Eastern Cooperative Oncology Group (ECOG) performance status, TKI treatment duration, previous history of CVD, ethnicity, and smoking status. If documented, the incidence of CV events was reviewed for each patient at 0, 1, 3, 6, and 12 months. Patients who received medications (Appendix) for their CVD were assessed for adherence based on history of prescription refills from their medical records. Adherence was evaluated for the duration that patients were concurrently taking an oral TKI. The institutional review board at VASDHS approved the study design.
All patients included in this study started TKI therapy since the December 2005 FDA approval of sorafenib, the first oral TKI for treatment of RCC. Each new start was recorded as a separate event, regardless of previous oral TKI therapy. Albiges and colleagues found that the approximate median time from starting TKI therapy to complete response was 12.6 months, and the median duration of TKI therapy after complete response was 10.3 months.11 Based on these results, the follow-up period for patients in this study was 2 years after the start of each TKI therapy. For data analysis, patients were stratified by CVD history (yes or no). In addition, composite outcomes were evaluated to identify a potential cumulative increased risk for CV events for patients who had been on multiple TKI therapies.
For this study, CV toxicities were characterized using Common Terminology Criteria for Adverse Events (CTCAE) version 4.03; severity of adverse events (AEs) was graded 1 to 5. CTCAE commonly has been used to assess AEs in oncology clinical trials. The CV AEs selected for this study included QTc prolongation, hypertension, left ventricular dysfunction, stroke, myocardial infarction (MI), and pulmonary arterial hypertension.
Primary outcomes included incidence of CV events and time to first CV event after initiation of TKI therapy. Secondary outcomes included changes in ECG or echocardiogram results at 0, 1, 3, 6, and 12 months. Secondary outcomes at scheduled time points were not readily available for every patient, but any available time points were gathered to aid in identifying an optimal period for cardiac monitoring. In addition, patients with a history of CVD were evaluated for adherence to common first-line therapies for each disease.
A Fischer exact test was used to compare the incidence of CV events in patients with and without a history of CVD (significance level, α = 0.05). A subgroup analysis was used to compare the incidence of CV events in patients who experienced a CV event (significance level, α = 0.05). A Kaplan-Meier survival curve was used to determine time to first CV event. A log-rank test with significance level set at α = 0.05 also was used.
Results
An initial database search identified 134 patients who received TKI therapy at VASDHS between December 1, 2005 and July 31, 2017. According to retrospective chart review, 54 patients met the inclusion criteria for the study (Table 1).
Patients without a history of CVD (17%) did not experience any CV events while on TKI therapy. Of the patients with a history of CVD, 9 (20%) experienced ≥ 1 CV event. Fifty-five percent of the events experienced were hypertension. One patient experienced QTc prolongation, and 2 patients experienced MI. As already noted, each new start of TKI was recorded as a separate event, regardless of previous TKI therapy. Among patients with a history of CVD, 2 experienced 2 CV events. Overall, 11 CV events occurred among patients who received ≥ 1 TKI, corresponding to an overall incidence of 24% (Table 2).
Of the 13 patients who were exposed to ≥ 2 TKI therapies, 2 experienced a CV event. Both patients were started on sunitinib and were switched to sorafenib. One of these used sunitinib for 7 months, experienced a partial response and was switched to sorafenib (with a 3-month break between therapies). The second patient was on sunitinib for 24 months, with multiple doses held because of low blood counts and diarrhea. While on sunitinib, this patient experienced a HF exacerbation, determined to be caused by the underlying disease. This event occurred 17 months after sunitinib was started, and therapy was continued for another 7 months. The patient was switched to sorafenib because of poor tolerability and disease progression. While on sorafenib, this patient experienced grade 1 QTc prolongation.
Discussion
Of the available oral TKI therapies for RCC, sunitinib and sorafenib have the most data associated with nonhypertensive CV toxicity.2,7-10,12 Instudies, the percentage of patients who experienced CV toxicity while on sunitinib or sorafenib has ranged widely, from 2.7% to 33.8%; the variance may be attributable to differences in how institutions report CV toxicities.7-9
According to the prescribing information for TKIs, hypertension is frequently reported as an AE for all 5 TKIs, and BP monitoring is recommended.3,4 However, the development of hypertension with these TKIs has been associated with response to therapy.7 With pazopanib, sorafenib, and sunitinib, there is a higher incidence of other AEs: edema, HF, MI, and QTc prolongation. Baseline ECG is recommended for all patients started on pazopanib and sunitinib and for patients with a history of CVD who are started on sorafenib. An ECG is recommended for patients with a history of CVD who are started on pazopanib and sunitinib.
Even with the medication prescribing information recommendations, it is unclear how frequently patients should be monitored. At VASDHS, CV monitoring for any patient started on a TKI remains at the discretion of the oncologist. There are concerns that ordering cardiac monitoring tests, which might be unnecessary, will change or guide therapy. In this study, data evaluation revealed 1 patient who experienced a CV event had a CVD history that was not documented in the patient’s medical history. It is important that providers obtain a detailed clinical assessment of patients CV history during each visit to determine whether CV monitoring should be considered. Patients also may benefit from additional counseling to emphasize the importance of adherence to CV medication therapy to reduce the incidence of these events.
Data from this study indicate that routine CV monitoring should be considered in patients with CVD, in keeping with current medication prescribing information recommendations. Of the patients who had a CV event, 54% experienced hypertension, 18% MI, and 28% stroke, QTc prolongation, or congestive HF.
Limitations
This retrospective study had several limitations. Many patients did not have a baseline cardiac monitoring test or any monitoring during therapy. Often, a cardiac test was performed only when the patient was symptomatic or experiencing a CV event. In addition, because of intolerance or nonadherence to therapy, many patients discontinued treatment early, before completing 30 days. That axitinib and cabozantinib are newer therapies and not first-line at VASDHS during the data collection period accounts for the small number of patients on these therapies. Therapy was shorter for patients started on pazopanib, axitinib, and cabozantinib than it was for patients on sunitinib and sorafenib. Duration of therapy may affect treatment-related events, but the majority of patients in this study experienced an event within 4 months of therapy. About half of the patients who experienced an event were nonadherent to their CV medication regimen. Another potential limitation is that this study was conducted at VASDHS, where most patients are male (RCC incidence is 2:1 male:female).
Conclusion
In this study, CV events occurred in 24% of patients with a history of CVD; 11% of these events were nonhypertensive. Baseline cardiac monitoring was not performed for most patients started on TKI therapy, but tests were performed once patients became symptomatic. The study results suggest that high-risk patients should undergo routine cardiac monitoring during the first 4 months of TKI therapy, in keeping with medication package insert monitoring recommendations. Cardiac monitoring of high-risk patients will allow for earlier identification of cardiac decline and offer opportunities for interventions, such as pharmacist-driven protocols to start CV medications. Implementation of this study’s recommendations should be evaluated to determine whether outcomes improve with routine cardiac monitoring in these high-risk patients.
Author disclosures
The authors report no actual or potential conflicts of interest with regard to this article.
Disclaimer
The opinions expressed herein are those of the authors and do not necessarily reflect those of Federal Practitioner, FrontlineMedical Communications Inc., the US Government, or any of its agencies. This article may discuss unlabeled or investigational use of certain drugs. Please review the complete prescribing information for specific drugs or drug combinations—including indications, contraindications, warnings, and adverse effects— before administering pharmacologic therapy to patients.
1. Rini, BI, Escudier B, Tomczak P, et al. Comparative effectiveness of axitinib versus sorafenib in advanced renal cell carcinoma (AXIS): a randomised phase 3 trial. Lancet. 2011;378(9807):1931-1939.
2. Tolcher AW, Appleman LJ, Shapiro GI, et al. A phase I open-label study evaluating the cardiovascular safety of sorafenib in patients with advanced cancer. Cancer Chemother Pharmacol. 2011;67(4):751-764.
3. Votrient [package insert]. Research Triangle Park, NC: GlaxoSmithKline; 2017.
4. Sutent [package insert]. New York, NY: Pfizer Labs; 2018.
5. Nexavar [package insert]. Wayne, NJ; Bayer HealthCare Pharmaceuticals Inc; 2018.
6. Ghatalia P, Morgan CJ, Je Y, et al. Congestive heart failure with vascular endothelial growth factor receptor tyrosine kinase inhibitors. Crit Rev Oncol Hematol 2015;94:228–237.
7. Hall PS, Harshman LC, Srinivas S, Witteles RM. The frequency and severity of cardiovascular toxicity from targeted therapy in advanced renal cell carcinoma patients. JACC Heart Fail. 2013;1(1):72-78.
8. Rini BI, Cohen DP, Lu DR, et al. Hypertension as a biomarker of efficacy in patients with metastatic renal cell carcinoma treated with sunitinib. J Natl Cancer Inst. 2011;103(9):763-773.
9. Richards CJ, Je Y, Schutz FA, et al. Incidence and risk of congestive heart failure in patients with renal and nonrenal cell carcinoma treated with sunitinib. J Clin Oncol. 2011;29(25):3450-3456.
10. Schmidinger M, Zielinski CC, Vogl UM, et al. Cardiac toxicity of sunitinib and sorafenib in patients with metastatic renal cell carcinoma. J Clin Oncol. 2008;26(32):5204-5212.
11. Albiges L, Oudard S, Negrier S, et al. Complete remission with tyrosine kinase inhibitors in renal cell carcinoma. J Clin Oncol. 2012;30(5):482-487.
12. Jang S, Zheng C, Tsai HT, et al. Cardiovascular toxicity after antiangiogenic therapy in persons older than 65 years with advanced renal cell carcinoma. Cancer. 2016;122(1):124-130
13. James PA, Oparil S, Carter BL, et al. 2014 evidence-based guideline for the management of high blood pressure in adults: report from the panel members appointed to the eighth Joint National Committee (JNC 8). JAMA. 2014;311(5):507-520.
14. Yancy CW, Jessup M, Bozkurt B, et al. ACC/AHA/HFSA Focused Update of the 2013 ACCF/AHA Guideline for the Management of Heart Failure: A Report of the American College of Cardiology/American Heart Association Task Force on Clinical Practice Guidelines and the Heart Failure Society of America. JACC. 2017;70(6):776-803.
15. Kernan WN, Ovbiagele B, Black HR, et al; American Heart Association Stroke Council, Council on Cardiovascular and Stroke Nursing, Council on Clinical Cardiology, and Council on Peripheral Vascular Disease. Guidelines for the prevention of stroke in patients with stroke and transient ischemic attack: a guideline for healthcare professionals from the American Heart Association/American Stroke Association. Stroke. 2014;45(7):2160-2236.
16. O’Gara PT, Kushner FG, Ascheim DD, et al; American College of Cardiology Foundation/American Heart Association Task Force on Practice Guidelines. 2013 ACCF/AHA guideline for the management of ST-elevation myocardial infarction: a report of the American College of Cardiology Foundation/American Heart Association Task Force on Practice Guidelines. JACC. 2013;61(4):e78-e140.
17. Amsterdam EA, Wenger NK, Brindis RG, et al. 2014 AHA/ACC guideline for the management of patients with non–ST-elevation acute coronary syndromes: a report of the American College of Cardiology/American Heart Association Task Force on Practice Guidelines. J Am Coll Cardiol. 2014;64(24):e139-e228.
18. Galiè N, Humbert M, Vachiery JL, et al; ESC Scientific Document Group. 2015 ESC/ERS guidelines for the diagnosis and treatment of pulmonary hypertension: the Joint Task Force for the Diagnosis and Treatment of Pulmonary Hypertension of the European Society of Cardiology (ESC) and the European Respiratory Society (ERS): endorsed by: Association for European Paediatric and Congenital Cardiology (AEPC), International Society for Heart and Lung Transplantation (ISHLT). Eur Heart J. 2016;37(1):67-119.
Sharing Cancer Care Information Across VA Health Care Systems (FULL)
A telementoring program based on the Specialty Care Access Network Extension for Community Healthcare Outcomes model shared information about cancer care across VA health Care systems.
In 2016, the Cancer Care Coordinator at the US Department of Veterans Affairs (VA) Connecticut Healthcare System (VACT) in West Haven partnered with the VA New England Healthcare System to use its telementoring program. The VA Specialty Care Access Network Extension for Community Healthcare Outcomes (VA ECHO) was used to present a series of educational conferences on cancer care. This article describes our experience implementing the program and reviews participant feedback gathered from voluntary surveys.
Background
In 2011, the Veterans Health Administration (VHA) Office of Healthcare Transformation launched VA ECHO, a telementoring program for primary care providers (PCPs) and patient-aligned care team staff. VACT was selected as 1 of 7 hub sites across the US. The VA ECHO system uses video and online technology to provide PCPs with case-based specialist consultation and didactic education. The system enables providers at any VA location to participate in online and telephone conferences in real time. The presentations are recorded and made available online to VA providers through a secure site.
VA ECHO is based on the highly successful Project ECHO model established by Sanjeev Arora and the University of New Mexico in 2007.1 The rationale for Project ECHO was that patient care could be improved by increasing the competence of PCPs in the management of complex diseases by providing access to disease specialists through a case-based learning approach that used technology, which it termed knowledge networks, to connect the PCPs to specialists.
The original model addressed management of hepatitis C in a medically underserved area where half of the population was widely geographically dispersed, making the provision of specialty care challenging. Developers identified 6 characteristics that make a disease appropriate for treatment using the Project ECHO knowledge network model:
- The disease is common;
- Management of the disease is complex;
- Treatment for the disease is evolving;
- The disease has a high societal impact;
- There are serious outcomes if the disease is not treated; and
- Disease management improves outcomes.1
VA ECHO conferences are available to all VA personnel. Staff can subscribe to an e-mail group list to be alerted to conference times and topics. Participants can connect directly to the conference using Microsoft Outlook Lync or Skype (Redmond, WA) and see the slides in real time on their computer as they listen to the presentation. The presentations are recorded, and the slides with audio can be accessed easily on the VA ECHO SharePoint site for download, enabling VA staff to listen to conferences at their convenience (Figure). 
VA Cancer ECHO
The impetus to create a series of talks related to cancer care using VA ECHO was the frequent and often time-consuming requests we received from colleagues at other VA sites for information about areas of cancer care, such as survivorship and cancer care coordination. It was felt that presenting cancer care information as a VA ECHO series would make this information available to a large group of providers at one time, making the method more time effective than sharing the information via one-on-one conversations.
The cancer care coordinator originally conceived this as a 3-part, 1-time series to present work done at VACT in the areas of survivorship, psychosocial distress monitoring, and coordination of cancer care using the VA Cancer Care Tracking System, an online tracking tool. Information about the series was disseminated via VA group e-mail lists for oncology providers and via the existing VA ECHO subscriber invitation process. The 3-presentation series garnered positive feedback and had attendance that ranged from 49 to 75 participants (mean, 60). Participants expressed enthusiasm for the format via e-mail and phone feedback directly to the West Haven staff.
Expansion
The success of this original 3-part series led to a trial of an ongoing Cancer Care Conference series (Conference) using VA ECHO. This was a novel use of VA ECHO and was outside its traditional format, which is geared to discussion of individual cases and clinical knowledge. Nevertheless, this new style of communication has been embraced by a wide range of VA cancer care professionals.
One reason we considered expanding the program was that oncology fit the framework of the original Project ECHO knowledge network model. Cancer is common at the VA, which cares for 175,000 patients with cancer annually.2 The management of cancer is complex involving many disciplines working together, and treatments are constantly changing. In addition, cancer has a high societal impact; there are serious outcomes both in terms of patient survival and patient symptom burden. And lastly, outcomes are improved with proactive disease management that is informed by the most current, evidence-based medicine.
The Conference was conceived as a forum for providers across disciplines to share best practices and discuss common challenges in caring for veterans with cancer. We invited participants to submit proposals for presentations related to cancer care initiatives at their VA sites. Potential speakers across all areas of care for veterans with cancer were invited to submit possible topics for the conference. The submissions were reviewed by the moderators in an effort to create a series of talks on a variety of topics across all aspects of care for oncology patients in the VA. This process of effectively crowd-sourcing educational content inspires providers to think more creatively about their practice and quality improvement projects and has sparked an ongoing dialogue about quality initiatives among VA oncology providers across disciplines and geographic locations. As a result, this approach also has enabled participants to learn from colleagues who work at a wide range of rural and urban VA locations throughout the country and to network with colleagues who are working on similar quality initiatives and challenges related to caring for veterans with cancer.
Program
The first Conference talk was in October 2016. It encompassed ten 1-hour talks during the 2016 to 2017 academic year. Speakers were recruited from the VACT West Haven campus and from several other VA sites nationwide. Topics included survivorship, psychosocial distress, palliative care, cancer navigation, and establishing a clinical trials program.
In its first year, the Conference series had 260 unique attendees representing such disciplines as medicine, nursing, social work, pharmacy, psychology, and clinic administration and representing all 21 Veterans Integrated Services Networks (VISNs). Speakers including oncologists, hepatologists, cancer care coordinators, health psychologists, and a research coordinator gave presentations on psychosocial distress screening and issues, cognitive behavioral therapy for cancer pain, cancer navigation, cancer case tracking, VISN-based liver cancer tumor tracker and liver tumor board, starting a VA-based clinical trial, palliative care, and survivorship.
The Conference accounted for 508 continuing medical education (CME) hours, which accounted for one-third of the total CME hours generated by the VACT West Haven VA ECHO program. Highlights of the talks were presented at the 2017 Association of VA Hematology/Oncology annual meeting in Denver, Colorado.
During the second year of the Conference, speakers were recruited to address new American College of Surgeons Commission on Cancer (CoC) requirements regarding survivorship treatment summaries for a subset of cancer survivors.3 The focus on survivorship was driven by ongoing feedback from participants who were working on initiatives to implement this process at their VA sites and wanted to learn from peers involved in this process throughout the VA system. Several speakers gave talks on implementing survivorship care at their VA and specifically on the use of computerized patient record system templates to create survivorship treatment summaries for veterans in accordance with CoC standards.
Since the first Conference in 2016, the number of unique attendees grew by 20% to 327 in 2018. During its first 2 years, participants have earned a total of 1,095 CME credits through Yale University CME. Conferences are usually broadcast at noon eastern time so that providers can take advantage of sessions during lunch breaks.
Participant Surveys
Attendees were invited to participate in voluntary, anonymous surveys to obtain feedback on and to receive input on topics of interest for future talks. Participants also were asked to comment on resources that they utilized to be updated on practice changes (Table 1). 
The Conference has led to increased awareness of other continuing education opportunities available through VA ECHO-Connecticut. Of survey participants, 20% reported that they had attended other VA ECHO conferences.
The survey samples are self-selecting and may not necessarily be representative of the Conference participants or of the VA oncology interdisciplinary team as a whole; however, the relatively large number of survey participants provides some confidence that these survey results can help inform future planning for this and other continuing education opportunities for VA oncology providers.
An additional online survey was designed to elucidate whether participants were incorporating knowledge gained from the Conference in their cancer care practice. Half of the 32 participants strongly agreed with the following statement: “Participation in the VA Cancer Care Conference has added to my knowledge of information relevant to my practice,” and 13 more agreed with the statement for a total of 90.6% of those surveyed responding affirmatively. Only 3 participants neither agreed nor disagreed, and none disagreed with the statement. More than half of the participants reported that they made changes to their practice or plan to make changes as a result of the Conference.
Conculsion
The VA ECHO program established at the VACT West Haven campus in 2012 now offers regular monthly or bimonthly conferences in 9 specialties: pain, liver/hepatitis C, neurology, nephrology, cardiology, diabetes/endocrinology, mental health and addiction, nursing grand rounds, and cancer care. The VACT ECHO program is led by a medical director, and each specialty has a clinical director who conducts sessions and recruits other specialists from their department.
Teleconferencing can provide opportunities for colleagues living in distant locations to connect; share best practices, common goals, and challenges; and initiate ongoing and lasting relationships. The Conference draws the most diverse audience by discipline of all the VA ECHO conferences hosted at VACT (Table 2). 
Traditionally, the national VA ECHO program has been a forum for specialists to discuss clinical case presentations for the benefit of primary care providers and to deliver didactics about chronic clinical conditions. Our Cancer Care Management VA ECHO has explored new ground by discussing material that has helped sites set up and enhance cancer care clinics and disseminate best practices for cancer survivorship and other aspects of cancer care. As a result, this conference has attracted and provided a forum for the most diverse audience of staff among VA ECHO clinics, with participation from clinic administrators to social workers to primary care providers to tumor registrars.
Through the creation of the Conference, > 300 individuals who care for veterans with cancer have been provided with a regular forum at which to connect with colleagues, receive updates on new treatment options for their patients, and learn about and share best practices specific to VA oncology patients. The VA ECHO technology creates a resource that can be accessed by all VA staff from their desktop computer. The VA ECHO SharePoint saves the slides of the Conference presentations both with and without audio to enable staff who can’t participate in real time to access the information at their convenience.
The Conference has facilitated networking among VA oncology providers who have common interests. Conference participants also have participated in other VA ECHO conferences in disciplines beyond oncology. Participants in the Conference also are encouraged to participate as speakers by presenting quality improvement initiatives at their VA site. This novel approach to generating content for this educational series has led to a dynamic interchange of ideas and increased networking among VA providers related to their practice and quality improvement initiatives at their VA sites. The Conference provides a regular forum for VA staff across a wide range of disciplines to share personal experiences, successes, and frustrations and to get feedback from colleagues.
The Conference combines a structured approach to presenting VA-specific educational content related to cancer care and multiple mechanisms that encourage staff to participate in an ongoing dialogue related to quality initiatives both on the phone during the Conference, online using Outlook LYNC or Skype to ask questions during the Conference, and during conversations on group e-mail. The Conference promotes staff engagement at little or no extra cost to the VA. For more information about the VA ECHO Cancer Care Conference or to submit a presentation for consideration for a future session, please contact julie.beck@va.gov or pradeep.mutalik@va.gov.
1. Arora S, Geppert CM, Kalishman S, et al. Academic health center management of chronic diseases through knowledge networks: Project ECHO. Acad Med. 2007;82(2):154-160.
2. Hematology and oncology federal health care data trends. Fed Pract. 2017;33(suppl 5):S12-S15.
3. American College of Surgeons Commission on Cancer. Cancer Program Standards: Ensuring Patient Centered Care, 2016 Edition. https://www.facs.org/quality-programs/cancer/coc/standards. Accessed March 14, 2018.
A telementoring program based on the Specialty Care Access Network Extension for Community Healthcare Outcomes model shared information about cancer care across VA health Care systems.
A telementoring program based on the Specialty Care Access Network Extension for Community Healthcare Outcomes model shared information about cancer care across VA health Care systems.
In 2016, the Cancer Care Coordinator at the US Department of Veterans Affairs (VA) Connecticut Healthcare System (VACT) in West Haven partnered with the VA New England Healthcare System to use its telementoring program. The VA Specialty Care Access Network Extension for Community Healthcare Outcomes (VA ECHO) was used to present a series of educational conferences on cancer care. This article describes our experience implementing the program and reviews participant feedback gathered from voluntary surveys.
Background
In 2011, the Veterans Health Administration (VHA) Office of Healthcare Transformation launched VA ECHO, a telementoring program for primary care providers (PCPs) and patient-aligned care team staff. VACT was selected as 1 of 7 hub sites across the US. The VA ECHO system uses video and online technology to provide PCPs with case-based specialist consultation and didactic education. The system enables providers at any VA location to participate in online and telephone conferences in real time. The presentations are recorded and made available online to VA providers through a secure site.
VA ECHO is based on the highly successful Project ECHO model established by Sanjeev Arora and the University of New Mexico in 2007.1 The rationale for Project ECHO was that patient care could be improved by increasing the competence of PCPs in the management of complex diseases by providing access to disease specialists through a case-based learning approach that used technology, which it termed knowledge networks, to connect the PCPs to specialists.
The original model addressed management of hepatitis C in a medically underserved area where half of the population was widely geographically dispersed, making the provision of specialty care challenging. Developers identified 6 characteristics that make a disease appropriate for treatment using the Project ECHO knowledge network model:
- The disease is common;
- Management of the disease is complex;
- Treatment for the disease is evolving;
- The disease has a high societal impact;
- There are serious outcomes if the disease is not treated; and
- Disease management improves outcomes.1
VA ECHO conferences are available to all VA personnel. Staff can subscribe to an e-mail group list to be alerted to conference times and topics. Participants can connect directly to the conference using Microsoft Outlook Lync or Skype (Redmond, WA) and see the slides in real time on their computer as they listen to the presentation. The presentations are recorded, and the slides with audio can be accessed easily on the VA ECHO SharePoint site for download, enabling VA staff to listen to conferences at their convenience (Figure).
VA Cancer ECHO
The impetus to create a series of talks related to cancer care using VA ECHO was the frequent and often time-consuming requests we received from colleagues at other VA sites for information about areas of cancer care, such as survivorship and cancer care coordination. It was felt that presenting cancer care information as a VA ECHO series would make this information available to a large group of providers at one time, making the method more time effective than sharing the information via one-on-one conversations.
The cancer care coordinator originally conceived this as a 3-part, 1-time series to present work done at VACT in the areas of survivorship, psychosocial distress monitoring, and coordination of cancer care using the VA Cancer Care Tracking System, an online tracking tool. Information about the series was disseminated via VA group e-mail lists for oncology providers and via the existing VA ECHO subscriber invitation process. The 3-presentation series garnered positive feedback and had attendance that ranged from 49 to 75 participants (mean, 60). Participants expressed enthusiasm for the format via e-mail and phone feedback directly to the West Haven staff.
Expansion
The success of this original 3-part series led to a trial of an ongoing Cancer Care Conference series (Conference) using VA ECHO. This was a novel use of VA ECHO and was outside its traditional format, which is geared to discussion of individual cases and clinical knowledge. Nevertheless, this new style of communication has been embraced by a wide range of VA cancer care professionals.
One reason we considered expanding the program was that oncology fit the framework of the original Project ECHO knowledge network model. Cancer is common at the VA, which cares for 175,000 patients with cancer annually.2 The management of cancer is complex involving many disciplines working together, and treatments are constantly changing. In addition, cancer has a high societal impact; there are serious outcomes both in terms of patient survival and patient symptom burden. And lastly, outcomes are improved with proactive disease management that is informed by the most current, evidence-based medicine.
The Conference was conceived as a forum for providers across disciplines to share best practices and discuss common challenges in caring for veterans with cancer. We invited participants to submit proposals for presentations related to cancer care initiatives at their VA sites. Potential speakers across all areas of care for veterans with cancer were invited to submit possible topics for the conference. The submissions were reviewed by the moderators in an effort to create a series of talks on a variety of topics across all aspects of care for oncology patients in the VA. This process of effectively crowd-sourcing educational content inspires providers to think more creatively about their practice and quality improvement projects and has sparked an ongoing dialogue about quality initiatives among VA oncology providers across disciplines and geographic locations. As a result, this approach also has enabled participants to learn from colleagues who work at a wide range of rural and urban VA locations throughout the country and to network with colleagues who are working on similar quality initiatives and challenges related to caring for veterans with cancer.
Program
The first Conference talk was in October 2016. It encompassed ten 1-hour talks during the 2016 to 2017 academic year. Speakers were recruited from the VACT West Haven campus and from several other VA sites nationwide. Topics included survivorship, psychosocial distress, palliative care, cancer navigation, and establishing a clinical trials program.
In its first year, the Conference series had 260 unique attendees representing such disciplines as medicine, nursing, social work, pharmacy, psychology, and clinic administration and representing all 21 Veterans Integrated Services Networks (VISNs). Speakers including oncologists, hepatologists, cancer care coordinators, health psychologists, and a research coordinator gave presentations on psychosocial distress screening and issues, cognitive behavioral therapy for cancer pain, cancer navigation, cancer case tracking, VISN-based liver cancer tumor tracker and liver tumor board, starting a VA-based clinical trial, palliative care, and survivorship.
The Conference accounted for 508 continuing medical education (CME) hours, which accounted for one-third of the total CME hours generated by the VACT West Haven VA ECHO program. Highlights of the talks were presented at the 2017 Association of VA Hematology/Oncology annual meeting in Denver, Colorado.
During the second year of the Conference, speakers were recruited to address new American College of Surgeons Commission on Cancer (CoC) requirements regarding survivorship treatment summaries for a subset of cancer survivors.3 The focus on survivorship was driven by ongoing feedback from participants who were working on initiatives to implement this process at their VA sites and wanted to learn from peers involved in this process throughout the VA system. Several speakers gave talks on implementing survivorship care at their VA and specifically on the use of computerized patient record system templates to create survivorship treatment summaries for veterans in accordance with CoC standards.
Since the first Conference in 2016, the number of unique attendees grew by 20% to 327 in 2018. During its first 2 years, participants have earned a total of 1,095 CME credits through Yale University CME. Conferences are usually broadcast at noon eastern time so that providers can take advantage of sessions during lunch breaks.
Participant Surveys
Attendees were invited to participate in voluntary, anonymous surveys to obtain feedback on and to receive input on topics of interest for future talks. Participants also were asked to comment on resources that they utilized to be updated on practice changes (Table 1).
The Conference has led to increased awareness of other continuing education opportunities available through VA ECHO-Connecticut. Of survey participants, 20% reported that they had attended other VA ECHO conferences.
The survey samples are self-selecting and may not necessarily be representative of the Conference participants or of the VA oncology interdisciplinary team as a whole; however, the relatively large number of survey participants provides some confidence that these survey results can help inform future planning for this and other continuing education opportunities for VA oncology providers.
An additional online survey was designed to elucidate whether participants were incorporating knowledge gained from the Conference in their cancer care practice. Half of the 32 participants strongly agreed with the following statement: “Participation in the VA Cancer Care Conference has added to my knowledge of information relevant to my practice,” and 13 more agreed with the statement for a total of 90.6% of those surveyed responding affirmatively. Only 3 participants neither agreed nor disagreed, and none disagreed with the statement. More than half of the participants reported that they made changes to their practice or plan to make changes as a result of the Conference.
Conculsion
The VA ECHO program established at the VACT West Haven campus in 2012 now offers regular monthly or bimonthly conferences in 9 specialties: pain, liver/hepatitis C, neurology, nephrology, cardiology, diabetes/endocrinology, mental health and addiction, nursing grand rounds, and cancer care. The VACT ECHO program is led by a medical director, and each specialty has a clinical director who conducts sessions and recruits other specialists from their department.
Teleconferencing can provide opportunities for colleagues living in distant locations to connect; share best practices, common goals, and challenges; and initiate ongoing and lasting relationships. The Conference draws the most diverse audience by discipline of all the VA ECHO conferences hosted at VACT (Table 2).
Traditionally, the national VA ECHO program has been a forum for specialists to discuss clinical case presentations for the benefit of primary care providers and to deliver didactics about chronic clinical conditions. Our Cancer Care Management VA ECHO has explored new ground by discussing material that has helped sites set up and enhance cancer care clinics and disseminate best practices for cancer survivorship and other aspects of cancer care. As a result, this conference has attracted and provided a forum for the most diverse audience of staff among VA ECHO clinics, with participation from clinic administrators to social workers to primary care providers to tumor registrars.
Through the creation of the Conference, > 300 individuals who care for veterans with cancer have been provided with a regular forum at which to connect with colleagues, receive updates on new treatment options for their patients, and learn about and share best practices specific to VA oncology patients. The VA ECHO technology creates a resource that can be accessed by all VA staff from their desktop computer. The VA ECHO SharePoint saves the slides of the Conference presentations both with and without audio to enable staff who can’t participate in real time to access the information at their convenience.
The Conference has facilitated networking among VA oncology providers who have common interests. Conference participants also have participated in other VA ECHO conferences in disciplines beyond oncology. Participants in the Conference also are encouraged to participate as speakers by presenting quality improvement initiatives at their VA site. This novel approach to generating content for this educational series has led to a dynamic interchange of ideas and increased networking among VA providers related to their practice and quality improvement initiatives at their VA sites. The Conference provides a regular forum for VA staff across a wide range of disciplines to share personal experiences, successes, and frustrations and to get feedback from colleagues.
The Conference combines a structured approach to presenting VA-specific educational content related to cancer care and multiple mechanisms that encourage staff to participate in an ongoing dialogue related to quality initiatives both on the phone during the Conference, online using Outlook LYNC or Skype to ask questions during the Conference, and during conversations on group e-mail. The Conference promotes staff engagement at little or no extra cost to the VA. For more information about the VA ECHO Cancer Care Conference or to submit a presentation for consideration for a future session, please contact julie.beck@va.gov or pradeep.mutalik@va.gov.
1. Arora S, Geppert CM, Kalishman S, et al. Academic health center management of chronic diseases through knowledge networks: Project ECHO. Acad Med. 2007;82(2):154-160.
2. Hematology and oncology federal health care data trends. Fed Pract. 2017;33(suppl 5):S12-S15.
3. American College of Surgeons Commission on Cancer. Cancer Program Standards: Ensuring Patient Centered Care, 2016 Edition. https://www.facs.org/quality-programs/cancer/coc/standards. Accessed March 14, 2018.
Liver Imaging Reporting and Data System in Patients at High Risk for Hepatocellular Carcinoma in the Memphis Veterans Affairs Population (FULL)
Although hepatocellular carcinoma can be difficult to detect, use of the LI-RADS algorithm could lead to earlier identification in at-risk patients.
Hepatocellular carcinoma (HCC) is the third most common cause of death from cancer worldwide.1 Liver cancer is the fifth most common cancer in men and the seventh in women.2 The highest incidence rates are in sub-Saharan Africa and Southeast Asia where hepatitis B virus is endemic. The incidence of HCC in western countries is increasing, particularly due to the rise of hepatitis C virus (HCV) as well as alcoholic liver disease and nonalcoholic fatty liver disease. The incidence of HCC has tripled in the US in the past 2 decades.1-3
HCC can be diagnosed by radiographic images without the need for biopsy if the typical imaging features are present.3 The European Association for the Study of Liver Disease (EASL) and the American Association for the Study of Liver Diseases (AASLD) recommend screening abdominal ultrasonography at 6-month intervals for high-risk patients.3,4 High-risk patients include patients with cirrhosis, especially those with hepatitis B or C.3
If screening ultrasonography detects a nodule, size determines whether a follow-up ultrasound is needed vs obtaining a contrast-enhanced dynamic computed tomography (CT) scan or a magnetic resonance image (MRI).3 If ultrasonography detects a nodule > 1 cm in diameter, then a dynamic CT or MRI is performed. Characteristic hyperenhancement during later arterial phase and washout during the venous or delayed phase is associated with a nearly 100% specificity for HCC diagnosis.5 Arterial-enhancing contrast is required when using CT and MRI because HCC is a hypervascular lesion.6 The portal venous blood dilutes the majority of the liver’s arterial blood; therefore, the liver does not enhance during the arterial phase, while HCC will show maximum enhancement.7 Furthermore, HCC should demonstrate a “washout” of contrast during the venous phase on CT and MRI.4 Standard imaging protocol dictates that 4 phases are needed to properly diagnose HCC including unenhanced, arterial, venous, and delayed.4
Regular surveillance increases the likelihood of detecting HCC before the presentation of clinical symptoms and facilitates receipt of curative therapy.8-10 Patients with viral hepatitis and cirrhosis with HCC found on screening are more likely to have earlier-stage disease and survive longer from the time of diagnosis.11 Furthermore, it has been observed that HCC detected by surveillance is significantly more likely to undergo curative therapy compared with incidental or symptomatic detection of HCC.9
Technical improvements in imaging techniques include advancement in contrast agents, multidetector row helical CT, and the flexibility/range of pulse sequences available in MRI.7 Even with technical improvements in all modalities used in HCC imaging, detecting HCC remains difficult, especially when detecting the small (< 2 cm) lesions in a cirrhotic liver.7 Interpretation of imaging also remains a challenge as HCC does not always fit strict criteria: lack of “washout” in a hypervascular lesion, determining small HCC lesions from benign nodules, and hypovascular/isovascular HCC.5 Radiologic differentials in the diagnosis of HCC include transient hepatic intensity difference (THID)/transient hepatic attenuation difference (THAD), arterio-portal shunt, and regenerative nodules.12 In the common clinical setting, patients undergo multiple imaging studies that are interpreted by multiple radiologists, which can add to the difficulty in the diagnosis of HCC.13
The radiology community recognized the inconsistencies and complexities of HCC imaging. Therefore, the American College of Radiology endorsed the Liver Imaging Reporting and Data System (LI-RADS), which had the goal of reducing variability in lesion interpretation through standardization and improving communication with clinicians.14 LI-RADS uses a diagnostic algorithm for CT and MRI that categorizes observed liver findings in high-risk individuals based on the probability or relative risk of HCC without assigning a formal diagnosis.14 LI-RADS takes into account arterial phase enhancement, tumor size, washout appearance, the presence and nature of a capsule, and threshold growth.15 LI-RADS categorizes an observed liver finding on a scale of 1 to 5, with 1 corresponding to a definitely benign finding and 5 with definitive HCC.14 Furthermore, LI-RADS sought to limit the technical variabilities among institutions.
LI-RADS was launched in 2011 and has been utilized by many clinical practices while continuing to be expanded and updated.16 Recent studies examined the specificity of LI-RADS as well as interreader variability.17,18 For nodules viewed on MRI, both LI-RADS categories 4 and 5 had high specificity for HCC.17 When looking at interreader repeatability, LI-RADS showed moderate agreement among experts using the diagnostic algorithm.19 Further studies have compared LI-RADS with the AASLD guidelines and the Organ Procurement and Transplantation Network (OPTN) guidelines.16 When compared with other guidelines, LI-RADS expands the definition of indeterminate findings into probably benign, intermediate probability of HCC, and probably HCC, which corresponds to LI-RADS categories 2, 3, and 4.16
We looked retrospectively at a group of patients previously diagnosed with HCC to see whether utilizing the LI-RADS scoring system within our screening system might have allowed an earlier prediction of HCC and a timelier intervention. Prior to this investigation the LI-RADS system was not used for HCC screening at our US Department of Veterans Affairs (VA) facility. We examined screened patients at the Memphis VA Medical Center (MVAMC) in Tennessee who were subsequently diagnosed with HCC to see which LI-RADS category the last surveillance CT prior to diagnosis would fall into, 6 months to a year prior to the diagnosis of HCC. Our control population was a group of patients screened with CT for their liver nodules who were found not to have HCC.
Methods
Patients at MVAMC with cirrhosis and patients with chronic hepatitis B are routinely screened with ultrasound, CT, or MRI in accordance with the AASLD, EASL, and VA guidelines. Of 303 patients with HCV and cirrhosis under care in 2015, 242 (81%) received imaging to screen for HCC according to the VA National Hepatitis C Registry 2015 (Personal Communication, Population Health Service, Office of Patient Care Services).The LI-RADS scoring system was not applied as a standard screening methodology.
Under an institutional review board-approved protocol, we reviewed the charts of all patients diagnosed with HCC at MVAMC from 2009 to 2014, utilizing ICD-9 code of 155.0 for HCC. We identified within these charts patients who had a surveillance CT image performed within a 6- to 13-month period prior to the CTs that diagnosed HCC (prediagnostic HCC CT). Furthermore, we reviewed the charts of all patients diagnosed with benign liver nodules at MVAMC from 2009 to 2014, utilizing the ICD-9 code of 573.8 for other specified disorders of the liver.
Within these charts, we found patients who had a surveillance CT image performed and who were followed after that image with additional imaging for ≥ 2 years or who had a liver biopsy negative for HCC (benign surveillance CT). We compared these 2 sets of CTs utilizing LI-RADS criteria. Once these patients were identified, a list of the CTs to be examined were given to 2 MVAMC radiologists who specialize in CT.
No identifying information of the patients was included, and a 13-digit number unique to each CT exam identified the CTs to be reviewed. Radiologist 1 and 2 examined the CTs on the MVAMC Picture Archiving and Communication System (PACS). Both radiologists were asked to give each nodule a score according to LI-RADS v2014 diagnostic algorithm (Figure).
We hypothesized that the prediagnostic CT images of patients eventually determined to have HCC would have a LI-RADS score of 4 (LR4) or LR5. Furthermore, we hypothesized that the CT images of the benign liver nodule patients would have a score ≤ LR3. If there was a disagreement between the radiologists in terms of a malignant score (LR4 or LR5) vs a benign score (≤ LR3), then a third radiologist (radiologist 3) provided a score for these nodules. The third, tiebreaker radiologist was given the scores of both prior radiologists and asked to choose which score was correct.
Statistical analysis was then applied to the data to determine the sensitivity, specificity, and diagnostic accuracy in diagnosing eventual HCC, as well as the false-negative and false-positive rates of radiologists 1 and 2. Raw data also were used to determine the agreement between raters by calculating the κ statistic with a 95% CI.
Results
A total of 70 nodules were examined by radiologists 1 and 2 with 42 of the nodules in the prediagnostic HCC CTs and 28 of the nodules in the benign surveillance CTs. 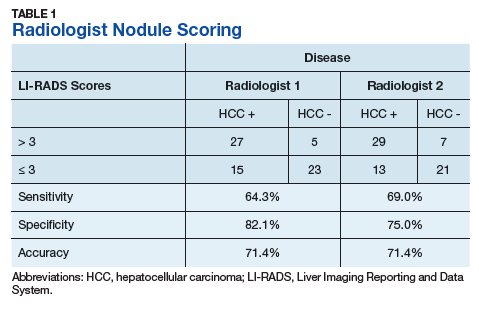
Radiologist 1 identified 11 patients with LR4 and 21 patients with LR5. His scores showed a sensitivity of 64.3% and specificity of 82.1% with accuracy of 71.4% for LI-RADS in identifying eventual HCC. The false-negative rate of the LI-RADS diagnostic algorithm for radiologist 1 was 35.7% and the false-positive rate was 17.9%. Radiologist 2 identified 17 patients LR4 and 19 patients with LR5. Radiologist 2’s scores showed a sensitivity of 69.0% and specificity of 75.0% with accuracy of 71.4% for LI-RADS in identifying eventual HCC.The false-negative rate of the LI-RADS diagnostic algorithm for radiologist 2 was 31.0% and false-positive rate of 25.0%. The κ statistic was calculated to determine the interrater agreement. The radiologists agreed on 58 of 70 samples; 15 without HCC and 43 with HCC. The κ statistic was 0.592, which indicates moderate agreement (Table 2). 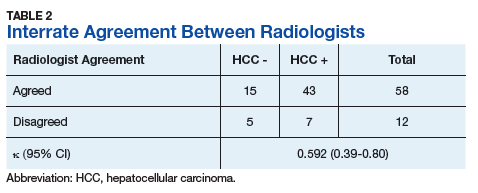
Discussion
If HCC is diagnosed late in the disease process based on symptomatology and not on surveillance imaging, the likelihood of receiving early and potential curative therapy greatly declines as was shown in a systemic literature review.9 Surveillance imaging and lesion interpretation by various radiologists has been difficult to standardize as new technologic advances continue to occur in the imaging of HCC.14 LI-RADS was initiated to help standardize CT and MRI interpretation and reporting of hepatic nodules. As a dynamic algorithm, it continues to adjust with new advances in imaging techniques with the most recent updates being made to the algorithm in 2014.14,19 LI-RADS applies to patients at high risk for HCC most often who are already enrolled in a surveillance program.19 The MVAMC has a high incidence of patients with cirrhosis who are at risk for HCC, which is why we chose it as our study population.
LI-RADS can be applied to both MRI and CT imaging. Much of the recent literature have looked at LI-RADS in terms of MRI. A group in China looked at 100 pathologically confirmed patients and assigned a LI-RADS score to the MRI at the time of diagnosis and showed that MRI LI-RADS scoring was highly sensitive and specific in the diagnosis of HCC.20 This study did note a numeric difference in the specificity of LI-RADS algorithm depending on how LR3 scores were viewed. If a LR3 score was considered negative rather than positive for HCC, then the specificity increased by almost 20%.20
Another study looked at patients with liver nodules ≤ 20 mm found on ultrasound and obtained MRIs and biopsies on these patients, assigning the MRI a LI-RADs score.17 Darnell and colleagues found that MRI LR4 and LR5 have a high specificity for HCC. However, 29 of the 42 LR3 lesions examined were found to be HCC.17 Furthermore, Choi and colleagues retrospectively looked at patients in a HCC surveillance program who had undergone MRI as part of the program and assigned LI-RADS scores to these MRIs.21 Their study showed that LR5 criteria on gadoxetate disodium-enhanced MRI has excellent positive predictive value (PPV) for diagnosing HCC, and LR4 showed good PPV.21
In our study, we chose to look at LI-RADS in terms of surveillance CT scans 6 to 13 months prior to the diagnosis of HCC to see whether this method would allow us to intervene earlier with more aggressive diagnostics or therapy in those suspected of having HCC. Although Choi and colleagues looked retrospectively at MRI surveillance imaging, most of the prior studies have looked at LI-RADS scoring in imaging at the time of diagnosis.17,20,21 By looking at surveillance CT scans, we sought to determine LI-RADS sensitivity, specificity, and diagnostic accuracy as a screening tool compared with CT evaluations without LI-RADS scoring.
We also chose to look at CT scans since most of the prior studies have looked at the more detailed and often more expensive MRIs. For both radiologists 1 and 2, the sensitivity was > 60% and specificity was > 70% with a diagnostic accuracy of 71.4% in predicting a diagnosis of HCC in future scans. Although there was high false negative of > 30% for both radiologists, we did consider LR3 as negative for HCC. As Darnell and colleagues’ study of MRI LI-RADS shows, LR3 may need to be revised in the future as its ambiguity can lead to false-negatives.17 Our results also showed moderate interreader agreement, which has been seen in previous studies with LI-RADS.18
Some studies have compared MRI with CT imaging in terms of LI-RADs classification of hepatic nodules to find out whether concordance was seen.22,23 Both studies found that there was substantial discordance between MRI and CT with CT often underscoring hepatic nodules.22,23 In Zhang and colleagues, interclass agreement between CT and MRI varied the most in terms of arterial enhancement with CT producing false-negative findings.22 CT also underestimated LI-RADS score by 16.9% for LR3, 37.3% for LR4, and 8.5% for LR5 in this study.22 Furthermore, Corwin and colleagues found a significant upgrade in terms of LI-RADS categorization with MRI for 42.5% of observations.23 In this study, upgraded LI-RADS scores on MRI included 2 upgraded to LR5V (Figure), 15 upgraded to LR5, and 12 upgraded to LR4.23 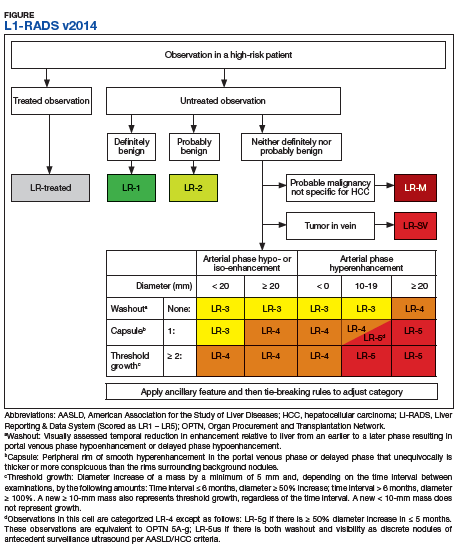
Our study shows that the LI-RADS algorithm has a good sensitivity, specificity, and diagnostic accuracy as a screening tool, predicting HCC in scans earlier than standard CT evaluation. In our study, the patients with HCC were shown to have higher LI-RADS scores on prediagnostic imaging, while the benign liver nodule patients were shown to have lower LI-RADS scores. This data would suggest that a LI-RADS score given to surveillance CT of LR4 or higher should recommend either a biopsy or follow-up imaging after a short interval. If LI-RADS is applied to surveillance CTs in patients at risk for HCC, a diagnosis of HCC may be arrived at earlier as compared with not using the LI-RADS algorithm. Earlier detection may lead to earlier intervention and improved treatment outcomes.
Limitations
Limitations to our study occurred because radiologist 3 did not review all of the images nor score them. Radiologist 3 was limited to 12 images where there was disagreement and was limited to 2 scores to choose from for each image. Further limitations include that this study was performed at a single center. Our study focused on one imaging modality and did not include ultrasounds or MRIs. We did not compare the demographics of our patients with those of other VA hospitals. The radiologists interpreted the images individually, and their subjectivity was another limitation.
Conclusion
In the MVAMC population, LI-RADS showed a good sensitivity, specificity, and diagnostic accuracy for CT surveillance scans in patient at high risk for HCC at an earlier time point than did standard evaluation by very experienced CT radiologists. Higher LI-RADS scores on surveillance CTs had good diagnostic accuracy for the probable future diagnosis of HCC, whereas lower LI-RADS scores had a good diagnostic accuracy for probable benign nodules. Utilizing the LI-RADS algorithm on all surveillance CTs in patients at high risk for HCC may lead to obtaining MRIs or follow-up CTs sooner for suspicious nodules, leading to an earlier diagnosis of HCC and possible earlier and more effective intervention.
1. El–Serag HB, Rudolph KL. Hepatocellular carcinoma: epidemiology and molecular carcinogenesis. Gastroenterology. 2007;132(7):2557-2576.
2. El-Serag HB. Hepatocellular carcinoma. N Engl J Med. 2011;365(12):1118-1127.
3. Bruix J, Sherman M; American Association for the Study of Liver Diseases. Management of hepatocellular carcinoma: an update. Hepatology. 2011;53(3):1020-1022.
4. Selvapatt N, House H, Brown A. Hepatocellular carcinoma surveillance: are we utilizing it? J Clin Gastroenterol. 2016;50(1):e8-e12.
5. Lee JM, Yoon JH, Joo I, Woo HS. Recent advances in CT and MR imaging for evaluation of hepatocellular carcinoma. Liver Cancer. 2012;1(1):22-40.
6. Chou R, Cuevas C, Fu R, et al. Imaging techniques for the diagnosis of hepatocellular carcinoma: a systemic review and meta-analysis. Ann Intern Med. 2015;162(10):697-711.
7. Ariff B, Lloyd CR, Khan S, et al. Imaging of liver cancer. World J Gastroenterol. 2009;15(11):1289-1300.
8. Yuen MF, Cheng CC, Lauder IJ, Lam SK, Ooi CG, Lai CL. Early detection of hepatocellular carcinoma increases the chance of treatment: Hong Kong experience. Hepatology. 2000;31(2):330-335.
9. Singal AG, Pillai A, Tiro J. Early detection, curative treatment, and survival rates for hepatocellular carcinoma surveillance in patients with cirrhosis: a meta-analysis. PLoS Med. 2014;11(4):e1001624.
10. Nusbaum, JD, Smirniotopoulos J, Wright HC, et al. The effect of hepatocellular carcinoma surveillance in an urban population with liver cirrhosis. J Clin Gastroenterol. 2015;49(10):e91-e95.
11. Kansagara D, Papak J, Pasha AS, et al. Screening for hepatocellular carcinoma in chronic liver disease: a systemic review. Ann Intern Med. 2014;161(4):261-269.
12. Shah S, Shukla A, Paunipagar B. Radiological features of hepatocellular carcinoma. J Clin Exp Hepatol. 2014;4(suppl 3):S63-S66.
13. You MW, Kim SY, Kim KW, et al. Recent advances in the imaging of hepatocellular carcinoma. Clin Mol Hepatol. 2015;21(1):95-103.
14. American College of Radiology. Liver reporting and data system (LI-RADS). https://www.acr.org/Clinical-Resources/Reporting-and-Data-Systems/LI-RADS. Accessed April 10, 2018.
15. Anis M. Imaging of hepatocellular carcinoma: new approaches to diagnosis. Clin Liver Dis. 2015;19(2):325-340.
16. Mitchell D, Bruix J, Sherman M, Sirlin CB. LI-RADS (Liver Imaging Reporting and Data System): summary, discussion, and consensus of the LI-RADS Management Working Group and future directions. Hepatology. 2015;61(3):1056-1065.
17. Darnell A, Forner A, Rimola J, et al. Liver imaging reporting and data system with MR imaging: evaluation in nodules 20 mm or smaller detected in cirrhosis at screening US. Radiology. 2015; 275(3):698-707.
18. Davenport MS, Khalatbari S, Liu PS, et al. Repeatability of diagnostic features and scoring systems for hepatocellular carcinoma by using MR imaging. Radiology. 2014;272(1):132-142.
19. An C, Rakhmonova G, Choi JY, Kim MJ. Liver imaging reporting and data system (LI-RADS) version 2014: understanding and application of the diagnostic algorithm. Clin Mol Hepatol. 2016;22(2):296-307.
20. Zhao W, Li W, Yi X, et al. [Diagnostic value of liver imaging reporting and data system on primary hepatocellular carcinoma] [in Chinese]. Zhong Nan Da Xue Xue Bao Yi Xue Ban. 2016;41(4):380-387.
21. Choi SH, Byun JH, Kim SY, et al. Liver imaging reporting and data system v2014 with gadoxetate disodium-enhanced magnetic resonance imaging: validation of LIRADS category 4 and 5 criteria. Invest Radiol. 2016;51(8):483-490.
22. Zhang YD, Zhu FP, Xu X, et al. Liver imaging reporting and data system: substantial discordance between CT and MR for imaging classification of hepatic nodules. Acad Radiol. 2016;23(3):344-352.
23. Corwin MT, Fananapazir G, Jin M, Lamba R, Bashir MR. Difference in liver imaging and reporting data system categorization between MRI and CT. Am J Roentgenol. 2016;206(2):307-312.
Although hepatocellular carcinoma can be difficult to detect, use of the LI-RADS algorithm could lead to earlier identification in at-risk patients.
Although hepatocellular carcinoma can be difficult to detect, use of the LI-RADS algorithm could lead to earlier identification in at-risk patients.
Hepatocellular carcinoma (HCC) is the third most common cause of death from cancer worldwide.1 Liver cancer is the fifth most common cancer in men and the seventh in women.2 The highest incidence rates are in sub-Saharan Africa and Southeast Asia where hepatitis B virus is endemic. The incidence of HCC in western countries is increasing, particularly due to the rise of hepatitis C virus (HCV) as well as alcoholic liver disease and nonalcoholic fatty liver disease. The incidence of HCC has tripled in the US in the past 2 decades.1-3
HCC can be diagnosed by radiographic images without the need for biopsy if the typical imaging features are present.3 The European Association for the Study of Liver Disease (EASL) and the American Association for the Study of Liver Diseases (AASLD) recommend screening abdominal ultrasonography at 6-month intervals for high-risk patients.3,4 High-risk patients include patients with cirrhosis, especially those with hepatitis B or C.3
If screening ultrasonography detects a nodule, size determines whether a follow-up ultrasound is needed vs obtaining a contrast-enhanced dynamic computed tomography (CT) scan or a magnetic resonance image (MRI).3 If ultrasonography detects a nodule > 1 cm in diameter, then a dynamic CT or MRI is performed. Characteristic hyperenhancement during later arterial phase and washout during the venous or delayed phase is associated with a nearly 100% specificity for HCC diagnosis.5 Arterial-enhancing contrast is required when using CT and MRI because HCC is a hypervascular lesion.6 The portal venous blood dilutes the majority of the liver’s arterial blood; therefore, the liver does not enhance during the arterial phase, while HCC will show maximum enhancement.7 Furthermore, HCC should demonstrate a “washout” of contrast during the venous phase on CT and MRI.4 Standard imaging protocol dictates that 4 phases are needed to properly diagnose HCC including unenhanced, arterial, venous, and delayed.4
Regular surveillance increases the likelihood of detecting HCC before the presentation of clinical symptoms and facilitates receipt of curative therapy.8-10 Patients with viral hepatitis and cirrhosis with HCC found on screening are more likely to have earlier-stage disease and survive longer from the time of diagnosis.11 Furthermore, it has been observed that HCC detected by surveillance is significantly more likely to undergo curative therapy compared with incidental or symptomatic detection of HCC.9
Technical improvements in imaging techniques include advancement in contrast agents, multidetector row helical CT, and the flexibility/range of pulse sequences available in MRI.7 Even with technical improvements in all modalities used in HCC imaging, detecting HCC remains difficult, especially when detecting the small (< 2 cm) lesions in a cirrhotic liver.7 Interpretation of imaging also remains a challenge as HCC does not always fit strict criteria: lack of “washout” in a hypervascular lesion, determining small HCC lesions from benign nodules, and hypovascular/isovascular HCC.5 Radiologic differentials in the diagnosis of HCC include transient hepatic intensity difference (THID)/transient hepatic attenuation difference (THAD), arterio-portal shunt, and regenerative nodules.12 In the common clinical setting, patients undergo multiple imaging studies that are interpreted by multiple radiologists, which can add to the difficulty in the diagnosis of HCC.13
The radiology community recognized the inconsistencies and complexities of HCC imaging. Therefore, the American College of Radiology endorsed the Liver Imaging Reporting and Data System (LI-RADS), which had the goal of reducing variability in lesion interpretation through standardization and improving communication with clinicians.14 LI-RADS uses a diagnostic algorithm for CT and MRI that categorizes observed liver findings in high-risk individuals based on the probability or relative risk of HCC without assigning a formal diagnosis.14 LI-RADS takes into account arterial phase enhancement, tumor size, washout appearance, the presence and nature of a capsule, and threshold growth.15 LI-RADS categorizes an observed liver finding on a scale of 1 to 5, with 1 corresponding to a definitely benign finding and 5 with definitive HCC.14 Furthermore, LI-RADS sought to limit the technical variabilities among institutions.
LI-RADS was launched in 2011 and has been utilized by many clinical practices while continuing to be expanded and updated.16 Recent studies examined the specificity of LI-RADS as well as interreader variability.17,18 For nodules viewed on MRI, both LI-RADS categories 4 and 5 had high specificity for HCC.17 When looking at interreader repeatability, LI-RADS showed moderate agreement among experts using the diagnostic algorithm.19 Further studies have compared LI-RADS with the AASLD guidelines and the Organ Procurement and Transplantation Network (OPTN) guidelines.16 When compared with other guidelines, LI-RADS expands the definition of indeterminate findings into probably benign, intermediate probability of HCC, and probably HCC, which corresponds to LI-RADS categories 2, 3, and 4.16
We looked retrospectively at a group of patients previously diagnosed with HCC to see whether utilizing the LI-RADS scoring system within our screening system might have allowed an earlier prediction of HCC and a timelier intervention. Prior to this investigation the LI-RADS system was not used for HCC screening at our US Department of Veterans Affairs (VA) facility. We examined screened patients at the Memphis VA Medical Center (MVAMC) in Tennessee who were subsequently diagnosed with HCC to see which LI-RADS category the last surveillance CT prior to diagnosis would fall into, 6 months to a year prior to the diagnosis of HCC. Our control population was a group of patients screened with CT for their liver nodules who were found not to have HCC.
Methods
Patients at MVAMC with cirrhosis and patients with chronic hepatitis B are routinely screened with ultrasound, CT, or MRI in accordance with the AASLD, EASL, and VA guidelines. Of 303 patients with HCV and cirrhosis under care in 2015, 242 (81%) received imaging to screen for HCC according to the VA National Hepatitis C Registry 2015 (Personal Communication, Population Health Service, Office of Patient Care Services).The LI-RADS scoring system was not applied as a standard screening methodology.
Under an institutional review board-approved protocol, we reviewed the charts of all patients diagnosed with HCC at MVAMC from 2009 to 2014, utilizing ICD-9 code of 155.0 for HCC. We identified within these charts patients who had a surveillance CT image performed within a 6- to 13-month period prior to the CTs that diagnosed HCC (prediagnostic HCC CT). Furthermore, we reviewed the charts of all patients diagnosed with benign liver nodules at MVAMC from 2009 to 2014, utilizing the ICD-9 code of 573.8 for other specified disorders of the liver.
Within these charts, we found patients who had a surveillance CT image performed and who were followed after that image with additional imaging for ≥ 2 years or who had a liver biopsy negative for HCC (benign surveillance CT). We compared these 2 sets of CTs utilizing LI-RADS criteria. Once these patients were identified, a list of the CTs to be examined were given to 2 MVAMC radiologists who specialize in CT.
No identifying information of the patients was included, and a 13-digit number unique to each CT exam identified the CTs to be reviewed. Radiologist 1 and 2 examined the CTs on the MVAMC Picture Archiving and Communication System (PACS). Both radiologists were asked to give each nodule a score according to LI-RADS v2014 diagnostic algorithm (Figure).
We hypothesized that the prediagnostic CT images of patients eventually determined to have HCC would have a LI-RADS score of 4 (LR4) or LR5. Furthermore, we hypothesized that the CT images of the benign liver nodule patients would have a score ≤ LR3. If there was a disagreement between the radiologists in terms of a malignant score (LR4 or LR5) vs a benign score (≤ LR3), then a third radiologist (radiologist 3) provided a score for these nodules. The third, tiebreaker radiologist was given the scores of both prior radiologists and asked to choose which score was correct.
Statistical analysis was then applied to the data to determine the sensitivity, specificity, and diagnostic accuracy in diagnosing eventual HCC, as well as the false-negative and false-positive rates of radiologists 1 and 2. Raw data also were used to determine the agreement between raters by calculating the κ statistic with a 95% CI.
Results
A total of 70 nodules were examined by radiologists 1 and 2 with 42 of the nodules in the prediagnostic HCC CTs and 28 of the nodules in the benign surveillance CTs.
Radiologist 1 identified 11 patients with LR4 and 21 patients with LR5. His scores showed a sensitivity of 64.3% and specificity of 82.1% with accuracy of 71.4% for LI-RADS in identifying eventual HCC. The false-negative rate of the LI-RADS diagnostic algorithm for radiologist 1 was 35.7% and the false-positive rate was 17.9%. Radiologist 2 identified 17 patients LR4 and 19 patients with LR5. Radiologist 2’s scores showed a sensitivity of 69.0% and specificity of 75.0% with accuracy of 71.4% for LI-RADS in identifying eventual HCC.The false-negative rate of the LI-RADS diagnostic algorithm for radiologist 2 was 31.0% and false-positive rate of 25.0%. The κ statistic was calculated to determine the interrater agreement. The radiologists agreed on 58 of 70 samples; 15 without HCC and 43 with HCC. The κ statistic was 0.592, which indicates moderate agreement (Table 2).
Discussion
If HCC is diagnosed late in the disease process based on symptomatology and not on surveillance imaging, the likelihood of receiving early and potential curative therapy greatly declines as was shown in a systemic literature review.9 Surveillance imaging and lesion interpretation by various radiologists has been difficult to standardize as new technologic advances continue to occur in the imaging of HCC.14 LI-RADS was initiated to help standardize CT and MRI interpretation and reporting of hepatic nodules. As a dynamic algorithm, it continues to adjust with new advances in imaging techniques with the most recent updates being made to the algorithm in 2014.14,19 LI-RADS applies to patients at high risk for HCC most often who are already enrolled in a surveillance program.19 The MVAMC has a high incidence of patients with cirrhosis who are at risk for HCC, which is why we chose it as our study population.
LI-RADS can be applied to both MRI and CT imaging. Much of the recent literature have looked at LI-RADS in terms of MRI. A group in China looked at 100 pathologically confirmed patients and assigned a LI-RADS score to the MRI at the time of diagnosis and showed that MRI LI-RADS scoring was highly sensitive and specific in the diagnosis of HCC.20 This study did note a numeric difference in the specificity of LI-RADS algorithm depending on how LR3 scores were viewed. If a LR3 score was considered negative rather than positive for HCC, then the specificity increased by almost 20%.20
Another study looked at patients with liver nodules ≤ 20 mm found on ultrasound and obtained MRIs and biopsies on these patients, assigning the MRI a LI-RADs score.17 Darnell and colleagues found that MRI LR4 and LR5 have a high specificity for HCC. However, 29 of the 42 LR3 lesions examined were found to be HCC.17 Furthermore, Choi and colleagues retrospectively looked at patients in a HCC surveillance program who had undergone MRI as part of the program and assigned LI-RADS scores to these MRIs.21 Their study showed that LR5 criteria on gadoxetate disodium-enhanced MRI has excellent positive predictive value (PPV) for diagnosing HCC, and LR4 showed good PPV.21
In our study, we chose to look at LI-RADS in terms of surveillance CT scans 6 to 13 months prior to the diagnosis of HCC to see whether this method would allow us to intervene earlier with more aggressive diagnostics or therapy in those suspected of having HCC. Although Choi and colleagues looked retrospectively at MRI surveillance imaging, most of the prior studies have looked at LI-RADS scoring in imaging at the time of diagnosis.17,20,21 By looking at surveillance CT scans, we sought to determine LI-RADS sensitivity, specificity, and diagnostic accuracy as a screening tool compared with CT evaluations without LI-RADS scoring.
We also chose to look at CT scans since most of the prior studies have looked at the more detailed and often more expensive MRIs. For both radiologists 1 and 2, the sensitivity was > 60% and specificity was > 70% with a diagnostic accuracy of 71.4% in predicting a diagnosis of HCC in future scans. Although there was high false negative of > 30% for both radiologists, we did consider LR3 as negative for HCC. As Darnell and colleagues’ study of MRI LI-RADS shows, LR3 may need to be revised in the future as its ambiguity can lead to false-negatives.17 Our results also showed moderate interreader agreement, which has been seen in previous studies with LI-RADS.18
Some studies have compared MRI with CT imaging in terms of LI-RADs classification of hepatic nodules to find out whether concordance was seen.22,23 Both studies found that there was substantial discordance between MRI and CT with CT often underscoring hepatic nodules.22,23 In Zhang and colleagues, interclass agreement between CT and MRI varied the most in terms of arterial enhancement with CT producing false-negative findings.22 CT also underestimated LI-RADS score by 16.9% for LR3, 37.3% for LR4, and 8.5% for LR5 in this study.22 Furthermore, Corwin and colleagues found a significant upgrade in terms of LI-RADS categorization with MRI for 42.5% of observations.23 In this study, upgraded LI-RADS scores on MRI included 2 upgraded to LR5V (Figure), 15 upgraded to LR5, and 12 upgraded to LR4.23
Our study shows that the LI-RADS algorithm has a good sensitivity, specificity, and diagnostic accuracy as a screening tool, predicting HCC in scans earlier than standard CT evaluation. In our study, the patients with HCC were shown to have higher LI-RADS scores on prediagnostic imaging, while the benign liver nodule patients were shown to have lower LI-RADS scores. This data would suggest that a LI-RADS score given to surveillance CT of LR4 or higher should recommend either a biopsy or follow-up imaging after a short interval. If LI-RADS is applied to surveillance CTs in patients at risk for HCC, a diagnosis of HCC may be arrived at earlier as compared with not using the LI-RADS algorithm. Earlier detection may lead to earlier intervention and improved treatment outcomes.
Limitations
Limitations to our study occurred because radiologist 3 did not review all of the images nor score them. Radiologist 3 was limited to 12 images where there was disagreement and was limited to 2 scores to choose from for each image. Further limitations include that this study was performed at a single center. Our study focused on one imaging modality and did not include ultrasounds or MRIs. We did not compare the demographics of our patients with those of other VA hospitals. The radiologists interpreted the images individually, and their subjectivity was another limitation.
Conclusion
In the MVAMC population, LI-RADS showed a good sensitivity, specificity, and diagnostic accuracy for CT surveillance scans in patient at high risk for HCC at an earlier time point than did standard evaluation by very experienced CT radiologists. Higher LI-RADS scores on surveillance CTs had good diagnostic accuracy for the probable future diagnosis of HCC, whereas lower LI-RADS scores had a good diagnostic accuracy for probable benign nodules. Utilizing the LI-RADS algorithm on all surveillance CTs in patients at high risk for HCC may lead to obtaining MRIs or follow-up CTs sooner for suspicious nodules, leading to an earlier diagnosis of HCC and possible earlier and more effective intervention.
1. El–Serag HB, Rudolph KL. Hepatocellular carcinoma: epidemiology and molecular carcinogenesis. Gastroenterology. 2007;132(7):2557-2576.
2. El-Serag HB. Hepatocellular carcinoma. N Engl J Med. 2011;365(12):1118-1127.
3. Bruix J, Sherman M; American Association for the Study of Liver Diseases. Management of hepatocellular carcinoma: an update. Hepatology. 2011;53(3):1020-1022.
4. Selvapatt N, House H, Brown A. Hepatocellular carcinoma surveillance: are we utilizing it? J Clin Gastroenterol. 2016;50(1):e8-e12.
5. Lee JM, Yoon JH, Joo I, Woo HS. Recent advances in CT and MR imaging for evaluation of hepatocellular carcinoma. Liver Cancer. 2012;1(1):22-40.
6. Chou R, Cuevas C, Fu R, et al. Imaging techniques for the diagnosis of hepatocellular carcinoma: a systemic review and meta-analysis. Ann Intern Med. 2015;162(10):697-711.
7. Ariff B, Lloyd CR, Khan S, et al. Imaging of liver cancer. World J Gastroenterol. 2009;15(11):1289-1300.
8. Yuen MF, Cheng CC, Lauder IJ, Lam SK, Ooi CG, Lai CL. Early detection of hepatocellular carcinoma increases the chance of treatment: Hong Kong experience. Hepatology. 2000;31(2):330-335.
9. Singal AG, Pillai A, Tiro J. Early detection, curative treatment, and survival rates for hepatocellular carcinoma surveillance in patients with cirrhosis: a meta-analysis. PLoS Med. 2014;11(4):e1001624.
10. Nusbaum, JD, Smirniotopoulos J, Wright HC, et al. The effect of hepatocellular carcinoma surveillance in an urban population with liver cirrhosis. J Clin Gastroenterol. 2015;49(10):e91-e95.
11. Kansagara D, Papak J, Pasha AS, et al. Screening for hepatocellular carcinoma in chronic liver disease: a systemic review. Ann Intern Med. 2014;161(4):261-269.
12. Shah S, Shukla A, Paunipagar B. Radiological features of hepatocellular carcinoma. J Clin Exp Hepatol. 2014;4(suppl 3):S63-S66.
13. You MW, Kim SY, Kim KW, et al. Recent advances in the imaging of hepatocellular carcinoma. Clin Mol Hepatol. 2015;21(1):95-103.
14. American College of Radiology. Liver reporting and data system (LI-RADS). https://www.acr.org/Clinical-Resources/Reporting-and-Data-Systems/LI-RADS. Accessed April 10, 2018.
15. Anis M. Imaging of hepatocellular carcinoma: new approaches to diagnosis. Clin Liver Dis. 2015;19(2):325-340.
16. Mitchell D, Bruix J, Sherman M, Sirlin CB. LI-RADS (Liver Imaging Reporting and Data System): summary, discussion, and consensus of the LI-RADS Management Working Group and future directions. Hepatology. 2015;61(3):1056-1065.
17. Darnell A, Forner A, Rimola J, et al. Liver imaging reporting and data system with MR imaging: evaluation in nodules 20 mm or smaller detected in cirrhosis at screening US. Radiology. 2015; 275(3):698-707.
18. Davenport MS, Khalatbari S, Liu PS, et al. Repeatability of diagnostic features and scoring systems for hepatocellular carcinoma by using MR imaging. Radiology. 2014;272(1):132-142.
19. An C, Rakhmonova G, Choi JY, Kim MJ. Liver imaging reporting and data system (LI-RADS) version 2014: understanding and application of the diagnostic algorithm. Clin Mol Hepatol. 2016;22(2):296-307.
20. Zhao W, Li W, Yi X, et al. [Diagnostic value of liver imaging reporting and data system on primary hepatocellular carcinoma] [in Chinese]. Zhong Nan Da Xue Xue Bao Yi Xue Ban. 2016;41(4):380-387.
21. Choi SH, Byun JH, Kim SY, et al. Liver imaging reporting and data system v2014 with gadoxetate disodium-enhanced magnetic resonance imaging: validation of LIRADS category 4 and 5 criteria. Invest Radiol. 2016;51(8):483-490.
22. Zhang YD, Zhu FP, Xu X, et al. Liver imaging reporting and data system: substantial discordance between CT and MR for imaging classification of hepatic nodules. Acad Radiol. 2016;23(3):344-352.
23. Corwin MT, Fananapazir G, Jin M, Lamba R, Bashir MR. Difference in liver imaging and reporting data system categorization between MRI and CT. Am J Roentgenol. 2016;206(2):307-312.
Improving Hand Hygiene Adherence in Healthcare Workers Before Patient Contact: A Multimodal Intervention in Four Tertiary Care Hospitals in Japan
In the era of multidrug resistant organisms spreading to healthcare facilities, as well as in the community, prevention of healthcare-associated infections (HAIs) has become one of the most important issues in the world. HAIs impact morbidity and mortality of patients, increase healthcare costs,1,2 and are associated with a longer length of stay in the hospital.3,4 In Japan, HAIs are a salient problem; more than 9% of patients admitted to the intensive care unit (ICU) developed an infection during their ICU stay,5 and the numbers of multidrug resistant organism isolates causing HAIs have been increasing annually.6
Hand hygiene is the most important strategy for preventing the spread of MDROs and reducing HAIs.7 Heightened attention to hand hygiene has occurred because of the recent global outbreak of coronavirus disease 2019 (COVID-19), which first appeared in Wuhan, China.8 Because no proven antiviral or vaccine is currently available for the disease, hand hygiene, appropriate cough etiquette, and physical distancing, including school closures, are the only way to prevent spread of the illness.9,10 The virus appears to be highly contagious and spread by droplet or contact routes. The spread of COVID-19 in healthcare facilities has been significant,11 and it could be a source of further spread of the disease in the community.
Unfortunately, hand hygiene adherence remains low in most settings.12 The World Health Organization (WHO) created a strategy to improve hand hygiene adherence,13 which has been implemented in many countries.14 This strategy consists of five key components: (1) system change, (2) training/education, (3) evaluation and feedback, (4) reminders in the workplace, and (5) institutional safety climate.13 Implementing a multimodal intervention including these five elements has increased hand hygiene adherence among healthcare workers (HCWs) and appears to reduce HAIs in different locations.15-17 Improving hand hygiene practice among HCWs is considered one of the most important ways to decrease the incidence of HAIs.15,18,19
There are two types of practice for hand hygiene: either hand washing with soap and water or using alcohol-based hand rub (AHR). The former requires water, soap, a sink, and paper towels, whereas the latter requires only hand rub, which is easy to use and requires one-third the length of time as the former.20 Therefore, AHR is strongly recommended, especially in acute and intensive care settings in hospitals, which require urgent care of patients. Importantly, previous studies demonstrated that greater use of AHR resulted in significant reductions in HAIs.7,14
In Japan, the data related to hand hygiene adherence is limited. Previous studies at four hospitals in different regions of Japan demonstrated that hand hygiene rates were suboptimal21 and lower than reported adherence rates from other international studies.14 One study at three hospitals showed rates could be improved by a multimodal intervention tailored by each institution.22 A 5-year follow-up study demonstrated the sustainability of the multimodal intervention23; however, hand hygiene adherence rates remained low at approximately 32%.
We hypothesized that perhaps focusing attention on just one single region (or prefecture) could boost hand hygiene rates. Niigata prefecture is located 200 miles north of Tokyo and is the largest prefecture facing the Japan Sea. There are five major tertiary hospitals in Niigata, and they communicate frequently and discuss infection control issues as a group. To investigate hand hygiene adherence before touching patients, and to evaluate the improvement of hand hygiene adherence induced by a multimodal intervention, we performed a pre- and postintervention study among HCWs at four of these tertiary care hospitals in Niigata.
METHODS
Participating hospitals
Four tertiary care hospitals in Niigata, Japan, volunteered to participate in the study. The characteristics of the four participating hospitals are summarized in Table 1. All hospitals are public or community based. Hospital A included two units, consisting of a cardiovascular-cerebral ICU and an emergency department (ED), and Hospitals B, C, and D included various units containing surgical or medical wards, an ICU, or an ED. All four hospitals have at least one designated infection-prevention nurse and an infection-prevention department. In addition, there is an infection control network system among the hospitals, and they communicate well to update the information related to local, domestic, or global infectious diseases through regular seminars and by distributing and exchanging electronic communication.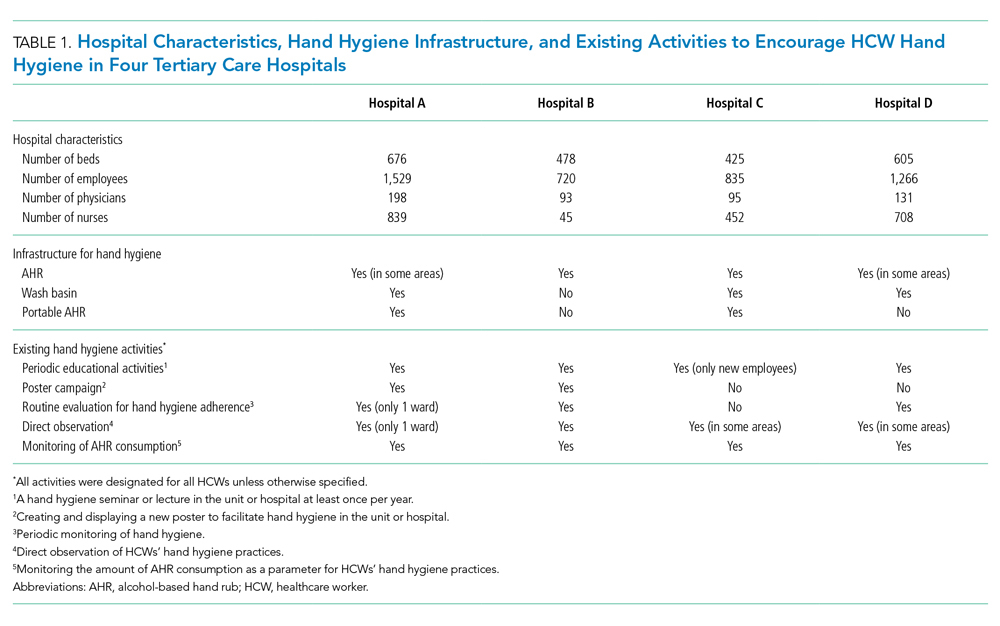
Preintervention
The preintervention infrastructure and existing activities to improve HCW hand hygiene in each hospital are summarized in Table 1. These activities were developed by each individual hospital and had been in place for at least 6 months before the study intervention. All hospitals used AHR and did direct observation for hand washing in designated wards or units and monitoring of AHR consumption; however, Hospital B did not have a wash basin in each room and no use of portable AHR. Preintervention hand hygiene data were collected from June to August 2018.
Intervention
To improve hand hygiene adherence, we initiated a multimodal intervention from September 2018 to February 2019 based on WHO recommendations13 and the findings from prior hand hygiene studies.22 Each facility was provided the same guidance on how to improve hand hygiene adherence and was asked to tailor their intervention to their settings (Table 2 and Appendix Figure). Suggested interventions included feedback regarding hand hygiene adherence observed during the preintervention period, interventions related to AHR, direct observation of and feedback regarding hand hygiene, new posters promoting hand hygiene in the workplace, a 1-month campaign for hand hygiene, seminars for HCWs related to hand hygiene, creation of a handbook for education/training, feedback regarding hand hygiene adherence during the intervention period, and others. The infection control team at each hospital designed the plans and strategies to improve hand hygiene adherence. Postintervention data were collected from February 2019 to March 2019.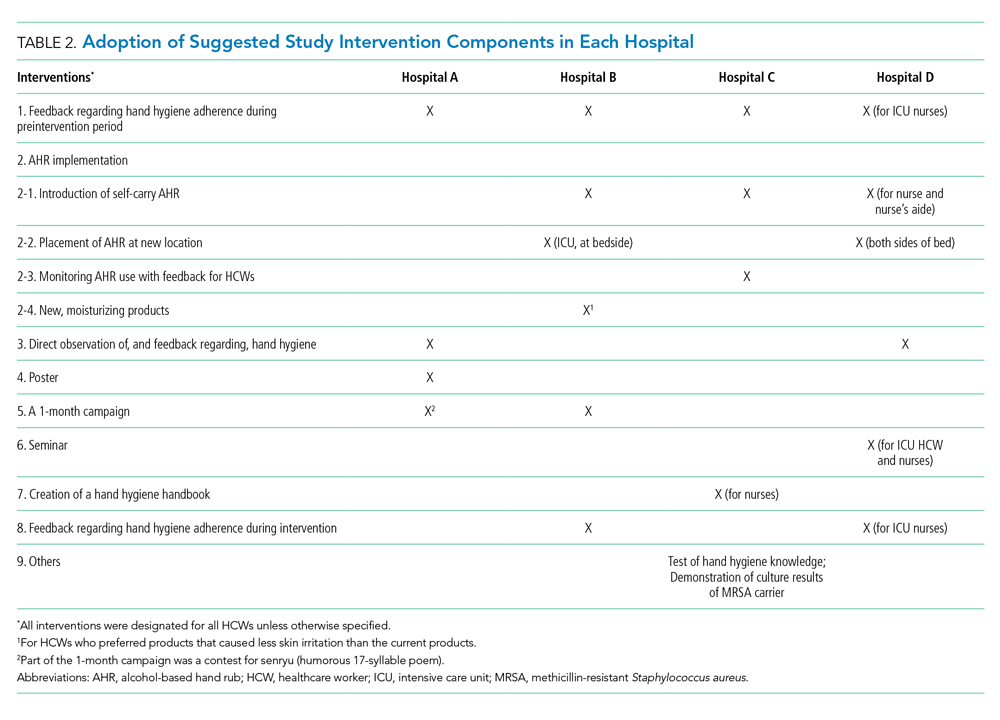
Observation of Hand Hygiene Adherence
Hand hygiene adherence before patient contact was evaluated by board-certified infection control nurses. To reduce observation bias, external nurses from other participating hospitals conducted the observations. To minimize intraobserver variation, the same training as the previous study in Japan21 was provided. Hand hygiene observations were usually performed during the day Monday to Friday from 8
Use of either AHR or soap and water before patient contact was defined as appropriate hand hygiene.24,25 Hand hygiene adherence before patient contact for each provider-patient encounter was observed and recorded using a data collection form used in the previous studies.19,26 The following information was obtained: unit name, time of initiation and completion of observations, HCW type (physician or nurse), and the type of hand hygiene (ie, AHR, hand washing with soap and water, or none). The observers kept an appropriate distance from the observed HCWs to avoid interfering with their regular clinical practice. In addition, we informed HCWs in the hospital that their clinical practices were going to be observed; however, they were not informed their hand hygiene adherence was going to be monitored.
Statistical Analysis
Overall hand hygiene adherence rates from the pre- and postintervention periods were compared based on hospitals and HCW subgroups. The Pearson’s chi-square test was used for the comparison of hand hygiene adherence rates between pre- and postintervention periods, and 95% CIs were estimated using binomial distribution. Poisson regression was used to look at changes in hand hygiene adherence with adjustment for HCW type. A two-tailed P value of <.05 was considered statistically significant. The study protocol was reviewed and approved by the ethics committees at all participating hospitals.
RESULTS
Overall Changes
In total, there were 2,018 and 1,630 observations of hand hygiene during the preintervention and postintervention periods, respectively. Most observations were of nurses: 1,643 of the 2,018 preintervention observations (81.4%) and 1,245 of the 1,630 postintervention observations (76.4%).
Findings from the HCW observations are summarized in Figure A. The overall postintervention hand hygiene adherence rate (548 of 1,630 observations; 33.6%; 95% CI, 31.3%-35.9%) was significantly higher than the preintervention rate (453 of 2,018 observations; 22.4%; 95% CI, 20.6%-24.3%; P < .001). This finding persisted after adjustment for the type of HCW (nurse vs physician), with proper hand hygiene adherence occurring 1.55 times more often after the intervention than before (95% CI, 1.37-1.76; P < .001). The overall improvement in hand hygiene adherence rates in the postintervention period was seen in all four hospitals (Figure B). However, the hand hygiene adherence rates of nurses in Hospitals C and D were lower than those in Hospitals A and B both before and after the intervention.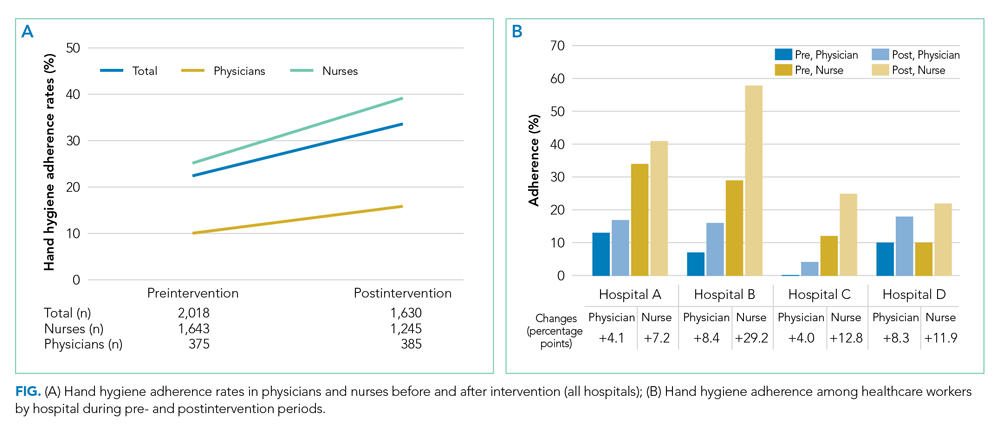
Use of AHR was the dominant appropriate hand hygiene practice vs hand washing with soap and water. Of those that practiced appropriate hand hygiene, the rate of AHR use was high and unchanged between preintervention (424 of 453; 93.6%) and postintervention periods (513 of 548; 93.6%; P = .99).
Changes by HCW Type
The rates of hand hygiene adherence in both physicians and nurses were higher in the postintervention period than in the preintervention period. However, the improvement of hand hygiene adherence among nurses—from 415 of 1,643 (25.2%) to 487 of 1,245 (39.1%) for an increase of 13.9 percentage points (95% CI,10.4-17.3)—was greater than that in physicians—from 38 of 375 (10.1%) to 61 of 385 (15.8%) for an increase of 5.7 percentage points (95% CI, 1.0-8.1; P < .001; Figure B). In general, nurse hand hygiene adherence was higher than that in physicians both in the preintervention period, with nurses at 25.2% (95% CI, 23.2%-27.4%) vs physicians at 10.1% (95% CI, 7.1%-13.2%; P < .001), and in the postintervention period, with nurses at 39.1% (95% CI, 36.4%-41.8%) vs physicians at 15.8% (95% CI, 12.2%-19.5%; P < .001).
Changes by Hospital
Overall, improvement of hand hygiene adherence was observed in all hospitals. However, the improvement rates differed in each hospital: They were 6.5 percentage points in Hospital A, 11.3 percentage points in Hospital C, 11.4 percentage points in Hospital D, and 18.4 percentage points in Hospital B. Hospital B achieved the highest postintervention adherence rates (42.6%), along with the highest improvement. The improvements of hand hygiene adherence in physicians were higher in Hospitals B (8.4 percentage points) and D (8.3 percentage points) than they were in Hospitals A (4.1 percentage points) and C (4.0 percentage points).
Interventions performed at each hospital to improve hand hygiene adherence are summarized in Table 2 and the Appendix Figure. All hospitals performed feedback of hand hygiene adherence after the preintervention period. Interventions related to AHR were frequently initiated; self-carry AHR was provided in two hospitals (Hospitals C and D), and location of AHR was moved (Hospitals B and D). In addition, new AHR products that caused less skin irritation were introduced in Hospital B. Direct observation by hospital staff (separate from our study observers) was also done as part of Hospital A and D’s improvement efforts. Other interventions included a 1-month campaign for hand hygiene including a contest for senryu (humorous 17-syllable poems; Table 2; Appendix Table), posters, seminars, and creation of a handbook related to hand hygiene. Posters emphasizing the importance of hand hygiene created by the local hospital infection control teams were put on the wall in several locations near wash basins. Seminars (1-hour lectures to emphasize the importance of hand hygiene) were provided to nurses. A 10-page hand hygiene handbook was created by one local infection control team and provided to nurses.
DISCUSSION
Our study demonstrated that the overall rate of hand hygiene adherence improved from 22.4% to 33.6% after multimodal intervention; however, the adherence rates even after intervention were suboptimal. The results were comparable with those of a previous study in Japan,22 which underscores how suboptimal HCW hand hygiene in Japan threatens patient safety. Hand hygiene among HCWs is one of the most important methods to prevent HAIs and to reduce spread of multidrug resistant organisms. High adherence has proven challenging because it requires behavior modification. We implemented WHO hand hygiene adherence strategies27 and evaluated the efficacy of a multimodal intervention in hopes of finding the specific factors that could be related to behavior modification for HCWs.
We observed several important relationships between the intervention components and their improvement in hand hygiene adherence. Among the four participating hospitals, Hospital B was the most successful with improvement of hand hygiene adherence from 24.2% to 42.6%. One unique intervention for Hospital B was the introduction of new AHR products for the people who had felt uncomfortable with current products. Frequent hand washing or the use of certain AHR products could irritate skin causing dry or rough hands, which could reduce hand hygiene practices. In Japan, there are several AHR products available. Among them, a few products contain skin moisturizing elements; these products are 10%-20% higher in cost than nonmoisturizing products. The HCWs in our study stated that the new products were more comfortable to use, and they requested to introduce them as daily use products. Thus, use of a product containing a hand moisturizer may reduce some factors negatively affecting hand hygiene practice and improve adherence rates.
Although this study was unable to determine which components are definitively associated with improving hand hygiene adherence, the findings suggest initiation of multiple intervention components simultaneously may provide more motivation for change than initiating only one or two components at a time. It is also possible that certain intervention components were more beneficial than others. Consistent with a previous study, improving hand hygiene adherence cannot be simply achieved by improving infrastructure (eg, introducing portable AHR) alone, but rather depends on altering the behavior of physicians and nurses.
This study was performed at four tertiary care hospitals in Niigata that are affiliated with Niigata University. They are located closely in the region, within 100 km, have quarterly conferences, and use a mutual monitoring system related to infection prevention. The members of infection control communicate regularly, which we thought would optimize improvements in hand hygiene adherence, compared with the circumstances of previous studies. In this setting, HCWs have similar education and share knowledge related to infection control, and the effects of interventions in each hospital were equally evaluated if similar interventions were implemented. In the current study, the interventions at each hospital were similar, and there was limited variety; therefore, specific, novel interventions that could affect hand hygiene adherence significantly were difficult to find.
There are a few possible reasons why hand hygiene adherence rates were low in the current study. First, part of this study was conducted during the summer so that the consciousness and caution for hand hygiene might be lower, compared with that in winter. In general, HCWs become more cautious for hand hygiene practice when they take care of patients diagnosed with influenza or respiratory syncytial virus infection. Second, the infrastructure for hand hygiene practice in the hospitals in Japan is inadequate and not well designed. Because of safety reasons, a single dispenser of AHR is placed at the entrance of each room in general and not at each bedside. The number of private rooms is limited, and most of the rooms in wards have multiple beds per room, with no access to AHR within the room. In fact, the interventions at all four hospitals included a change in the location and/or access of AHR. Easier access to AHR is likely a key step to improving hand hygiene adherence rates. Finally, there was not an active intervention to include hospital or unit leaders. This is important given the involvement of leaders in hand hygiene practice significantly changed the hand adherence rates in a previous study.19
Given the suboptimal hand hygiene adherence rates in Japan noted in this and previous Japanese studies,21,22 the spread of COVID-19 within the hospital setting is a concern. Transmission of COVID-19 by asymptomatic carriers has been suggested,11 which emphasizes the importance of regular standard precautions with good hand hygiene practice to prevent further transmission.
Although the hand hygiene rate was suboptimal, we were able to achieve a few sustainable, structural modifications in the clinical environment after the intervention. These include adding AHR in new locations, changing the location of existing AHR to more appropriate locations, and introducing new products. These will remain in the clinical environment and will contribute to hand hygiene adherence in the future.
This study has several limitations. First, the presence of external observers in their clinical settings might have affected the behavior of HCWs.28 Although they were not informed that their hand hygiene adherence was going to be monitored, the existence of an external observer in their clinical setting might have changed normal behavior. Second, the infrastructure and interventions for hand hygiene adherence before the intervention were different in each hospital, so there is a possibility that hospitals with less infrastructure for hand hygiene adherence had more room for improvement with the interventions. Third, we included observations at different units at each hospital, which might affect the results of the study because of the inclusion of different medical settings and HCWs. Fourth, the number of physician hand hygiene observations was limited: We conducted our observations between 8
In conclusion, a multimodal intervention to improve hand hygiene adherence successfully improved HCWs’ hand hygiene adherence in Niigata, Japan; however, the adherence rates are still relatively low compared with those reported from other countries. Further intervention is required to improve hand hygiene adherence.
1. Zimlichman E, Henderson D, Tamir O, et al. Health care-associated infections: a meta-analysis of costs and financial impact on the US health care system. JAMA Intern Med. 2013;173(22):2039-2046. https://doi.org/10.1001/jamainternmed.2013.9763.
2. Cassini A, Plachouras D, Eckmanns T, et al. Burden of six healthcare-associated infections on European population health: estimating incidence-based disability-adjusted life years through a population prevalence-based modelling study. PLoS Med. 2016;13(10):e1002150. https://doi.org/10.1371/journal.pmed.1002150.
3. Vrijens F, Hulstaert F, Van de Sande S, Devriese S, Morales I, Parmentier Y. Hospital-acquired, laboratory-confirmed bloodstream infections: linking national surveillance data to clinical and financial hospital data to estimate increased length of stay and healthcare costs. J Hosp Infect. 2010;75(3):158-162. https://doi.org/10.1016/j.jhin.2009.12.006.
4. de Lissovoy G, Fraeman K, Hutchins V, Murphy D, Song D, Vaughn BB. Surgical site infection: incidence and impact on hospital utilization and treatment costs. Am J Infect Control. 2009;37(5):387-397. https://doi.org/10.1016/j.ajic.2008.12.010.
5. Suka M, Yoshida K, Takezawa J. Epidemiological approach to nosocomial infection surveillance data: the Japanese Nosocomial Infection Surveillance System. Environ Health Prev Med. 2008;13(1):30-35. https:// doi.org/10.1007/s12199-007-0004-y.
6. Japan Nosocomial Infection Surveillance. JANIS Open Report. 2018. https://janis.mhlw.go.jp/english/report/open_report/2018/3/1/ken_Open_Report_Eng_201800_clsi2012.pdf. Accessed April 2, 2020.
7. Allegranzi B, Pittet D. Role of hand hygiene in healthcare-associated infection prevention. J Hosp Infect. 2009;73(4):305-315. https://doi.org/10.1016/j.jhin.2009.04.019.
8. Zhu N, Zhang D, Wang W, et al. A novel coronavirus from patients with pneumonia in China, 2019. N Engl J Med. 2020;382(8):727-733. https://doi.org/10.1056/NEJMoa2001017.
9. World Health Organization. Coronavirus disease (COVID-19) advice for the public. 2020. https://www.who.int/emergencies/diseases/novel-coronavirus-2019/advice-for-public. Accessed February 28, 2020.
10. Centers for Disease Control and Prevention. Interim Guidance for Preventing the Spread of Coronavirus Disease 2019 (COVID-19) in Homes and Residential Communities. 2020. https://www.cdc.gov/coronavirus/2019-ncov/hcp/guidance-prevent-spread.html. Accessed February 28, 2020.
11. Bai Y, Yao L, Wei T, et al. Presumed asymptomatic carrier transmission of COVID-19. JAMA. 2020;323(14):1406-1407. https://doi.org/10.1001/jama.2020.2565.
12. Burke JP. Infection control - a problem for patient safety. N Engl J Med. 2003;348(7):651-656. https://doi.org/10.1056/NEJMhpr020557.
13. World Health Organization. A Guide to the Implementation of the WHO Multimodal Hand Hygiene Improvement Strategy. 2013. https://www.who.int/gpsc/5may/Guide_to_Implementation.pdf. Accessed February 28, 2020.
14. Allegranzi B, Gayet-Ageron A, Damani N, et al. Global implementation of WHO’s multimodal strategy for improvement of hand hygiene: a quasi-experimental study. Lancet Infect Dis. 2013;13(10):843-851. https://doi.org/10.1016/S1473-3099(13)70163-4.
15. Pittet D, Hugonnet S, Harbarth S, et al. Effectiveness of a hospital-wide programme to improve compliance with hand hygiene. Infection Control Programme. Lancet. 2000;356(9238):1307-1312. https://doi.org/10.1016/s0140-6736(00)02814-2.
16. Rosenthal VD, Pawar M, Leblebicioglu H, et al. Impact of the International Nosocomial Infection Control Consortium (INICC) multidimensional hand hygiene approach over 13 years in 51 cities of 19 limited-resource countries from Latin America, Asia, the Middle East, and Europe. Infect Control Hosp Epidemiol. 2013;34(4):415-423. https://doi.org/10.1086/669860.
17. Pincock T, Bernstein P, Warthman S, Holst E. Bundling hand hygiene interventions and measurement to decrease health care-associated infections. Am J Infect Control. 2012;40(4 Suppl 1):S18-S27. https://doi.org/10.1016/j.ajic.2012.02.008.
18. Larson EL. APIC guideline for handwashing and hand antisepsis in health care settings. Am J Infect Control. 1995;23(4):251-269. https://doi.org/10.1016/0196-6553(95)90070-5.
19. Saint S, Conti A, Bartoloni A, et al. Improving healthcare worker hand hygiene adherence before patient contact: a before-and-after five-unit multimodal intervention in Tuscany. Qual Saf Health Care. 2009;18(6):429-433. https://doi.org/10.1136/qshc.2009.032771.
20. Bolon MK. Hand hygiene: an update. Infect Dis Clin North Am. 2016;30(3):591-607. https://doi.org/10.1016/j.idc.2016.04.007.
21. Sakihama T, Honda H, Saint S, et al. Hand hygiene adherence among health care workers at Japanese hospitals: a multicenter observational study in Japan. J Patient Saf. 2016;12(1):11-17. https://doi.org/10.1097/PTS.0000000000000108.
22. Sakihama T, Honda H, Saint S, et al. Improving healthcare worker hand hygiene adherence before patient contact: a multimodal intervention of hand hygiene practice in three Japanese tertiary care centers. J Hosp Med. 2016;11(3):199-205. https://doi.org/10.1002/jhm.2491.
23. Sakihama T, Kayauchi N, Kamiya T, et al. Assessing sustainability of hand hygiene adherence 5 years after a contest-based intervention in 3 Japanese hospitals. Am J Infect Control. 2020;48(1):77-81. https://doi.org/10.1016/j.ajic.2019.06.017.
24. World Health Organization. My 5 Moments for Hand Hygiene. https://www.who.int/infection-prevention/campaigns/clean-hands/5moments/en/. Accessed April 2, 2020.
25. World Health Organization. WHO Guidelines on Hand Hygiene in Health Care. 2009. https://www.who.int/gpsc/5may/tools/9789241597906/en/. Accessed February 28, 2020.
26. Saint S, Bartoloni A, Virgili G, et al. Marked variability in adherence to hand hygiene: a 5-unit observational study in Tuscany. Am J Infect Control. 2009;37(4):306-310. https://doi.org/10.1016/j.ajic.2008.08.004.
27. World Health Organization. WHO Guidelines on Hand Hygiene in Health Care: First Global Patient Safety Challenge Clean Care Is Safer Care. Geneva: World Health Organization; 2009. https://www.ncbi.nlm.nih.gov/books/NBK144013/pdf/Bookshelf_NBK144013.pdf. Accessed February 28, 2020.
28. Pan SC, Tien KL, Hung IC, et al. Compliance of health care workers with hand hygiene practices: independent advantages of overt and covert observers. PLoS One. 2013;8(1):e53746. https://doi.org/10.1371/journal.pone.0053746.
In the era of multidrug resistant organisms spreading to healthcare facilities, as well as in the community, prevention of healthcare-associated infections (HAIs) has become one of the most important issues in the world. HAIs impact morbidity and mortality of patients, increase healthcare costs,1,2 and are associated with a longer length of stay in the hospital.3,4 In Japan, HAIs are a salient problem; more than 9% of patients admitted to the intensive care unit (ICU) developed an infection during their ICU stay,5 and the numbers of multidrug resistant organism isolates causing HAIs have been increasing annually.6
Hand hygiene is the most important strategy for preventing the spread of MDROs and reducing HAIs.7 Heightened attention to hand hygiene has occurred because of the recent global outbreak of coronavirus disease 2019 (COVID-19), which first appeared in Wuhan, China.8 Because no proven antiviral or vaccine is currently available for the disease, hand hygiene, appropriate cough etiquette, and physical distancing, including school closures, are the only way to prevent spread of the illness.9,10 The virus appears to be highly contagious and spread by droplet or contact routes. The spread of COVID-19 in healthcare facilities has been significant,11 and it could be a source of further spread of the disease in the community.
Unfortunately, hand hygiene adherence remains low in most settings.12 The World Health Organization (WHO) created a strategy to improve hand hygiene adherence,13 which has been implemented in many countries.14 This strategy consists of five key components: (1) system change, (2) training/education, (3) evaluation and feedback, (4) reminders in the workplace, and (5) institutional safety climate.13 Implementing a multimodal intervention including these five elements has increased hand hygiene adherence among healthcare workers (HCWs) and appears to reduce HAIs in different locations.15-17 Improving hand hygiene practice among HCWs is considered one of the most important ways to decrease the incidence of HAIs.15,18,19
There are two types of practice for hand hygiene: either hand washing with soap and water or using alcohol-based hand rub (AHR). The former requires water, soap, a sink, and paper towels, whereas the latter requires only hand rub, which is easy to use and requires one-third the length of time as the former.20 Therefore, AHR is strongly recommended, especially in acute and intensive care settings in hospitals, which require urgent care of patients. Importantly, previous studies demonstrated that greater use of AHR resulted in significant reductions in HAIs.7,14
In Japan, the data related to hand hygiene adherence is limited. Previous studies at four hospitals in different regions of Japan demonstrated that hand hygiene rates were suboptimal21 and lower than reported adherence rates from other international studies.14 One study at three hospitals showed rates could be improved by a multimodal intervention tailored by each institution.22 A 5-year follow-up study demonstrated the sustainability of the multimodal intervention23; however, hand hygiene adherence rates remained low at approximately 32%.
We hypothesized that perhaps focusing attention on just one single region (or prefecture) could boost hand hygiene rates. Niigata prefecture is located 200 miles north of Tokyo and is the largest prefecture facing the Japan Sea. There are five major tertiary hospitals in Niigata, and they communicate frequently and discuss infection control issues as a group. To investigate hand hygiene adherence before touching patients, and to evaluate the improvement of hand hygiene adherence induced by a multimodal intervention, we performed a pre- and postintervention study among HCWs at four of these tertiary care hospitals in Niigata.
METHODS
Participating hospitals
Four tertiary care hospitals in Niigata, Japan, volunteered to participate in the study. The characteristics of the four participating hospitals are summarized in Table 1. All hospitals are public or community based. Hospital A included two units, consisting of a cardiovascular-cerebral ICU and an emergency department (ED), and Hospitals B, C, and D included various units containing surgical or medical wards, an ICU, or an ED. All four hospitals have at least one designated infection-prevention nurse and an infection-prevention department. In addition, there is an infection control network system among the hospitals, and they communicate well to update the information related to local, domestic, or global infectious diseases through regular seminars and by distributing and exchanging electronic communication.
Preintervention
The preintervention infrastructure and existing activities to improve HCW hand hygiene in each hospital are summarized in Table 1. These activities were developed by each individual hospital and had been in place for at least 6 months before the study intervention. All hospitals used AHR and did direct observation for hand washing in designated wards or units and monitoring of AHR consumption; however, Hospital B did not have a wash basin in each room and no use of portable AHR. Preintervention hand hygiene data were collected from June to August 2018.
Intervention
To improve hand hygiene adherence, we initiated a multimodal intervention from September 2018 to February 2019 based on WHO recommendations13 and the findings from prior hand hygiene studies.22 Each facility was provided the same guidance on how to improve hand hygiene adherence and was asked to tailor their intervention to their settings (Table 2 and Appendix Figure). Suggested interventions included feedback regarding hand hygiene adherence observed during the preintervention period, interventions related to AHR, direct observation of and feedback regarding hand hygiene, new posters promoting hand hygiene in the workplace, a 1-month campaign for hand hygiene, seminars for HCWs related to hand hygiene, creation of a handbook for education/training, feedback regarding hand hygiene adherence during the intervention period, and others. The infection control team at each hospital designed the plans and strategies to improve hand hygiene adherence. Postintervention data were collected from February 2019 to March 2019.
Observation of Hand Hygiene Adherence
Hand hygiene adherence before patient contact was evaluated by board-certified infection control nurses. To reduce observation bias, external nurses from other participating hospitals conducted the observations. To minimize intraobserver variation, the same training as the previous study in Japan21 was provided. Hand hygiene observations were usually performed during the day Monday to Friday from 8
Use of either AHR or soap and water before patient contact was defined as appropriate hand hygiene.24,25 Hand hygiene adherence before patient contact for each provider-patient encounter was observed and recorded using a data collection form used in the previous studies.19,26 The following information was obtained: unit name, time of initiation and completion of observations, HCW type (physician or nurse), and the type of hand hygiene (ie, AHR, hand washing with soap and water, or none). The observers kept an appropriate distance from the observed HCWs to avoid interfering with their regular clinical practice. In addition, we informed HCWs in the hospital that their clinical practices were going to be observed; however, they were not informed their hand hygiene adherence was going to be monitored.
Statistical Analysis
Overall hand hygiene adherence rates from the pre- and postintervention periods were compared based on hospitals and HCW subgroups. The Pearson’s chi-square test was used for the comparison of hand hygiene adherence rates between pre- and postintervention periods, and 95% CIs were estimated using binomial distribution. Poisson regression was used to look at changes in hand hygiene adherence with adjustment for HCW type. A two-tailed P value of <.05 was considered statistically significant. The study protocol was reviewed and approved by the ethics committees at all participating hospitals.
RESULTS
Overall Changes
In total, there were 2,018 and 1,630 observations of hand hygiene during the preintervention and postintervention periods, respectively. Most observations were of nurses: 1,643 of the 2,018 preintervention observations (81.4%) and 1,245 of the 1,630 postintervention observations (76.4%).
Findings from the HCW observations are summarized in Figure A. The overall postintervention hand hygiene adherence rate (548 of 1,630 observations; 33.6%; 95% CI, 31.3%-35.9%) was significantly higher than the preintervention rate (453 of 2,018 observations; 22.4%; 95% CI, 20.6%-24.3%; P < .001). This finding persisted after adjustment for the type of HCW (nurse vs physician), with proper hand hygiene adherence occurring 1.55 times more often after the intervention than before (95% CI, 1.37-1.76; P < .001). The overall improvement in hand hygiene adherence rates in the postintervention period was seen in all four hospitals (Figure B). However, the hand hygiene adherence rates of nurses in Hospitals C and D were lower than those in Hospitals A and B both before and after the intervention.
Use of AHR was the dominant appropriate hand hygiene practice vs hand washing with soap and water. Of those that practiced appropriate hand hygiene, the rate of AHR use was high and unchanged between preintervention (424 of 453; 93.6%) and postintervention periods (513 of 548; 93.6%; P = .99).
Changes by HCW Type
The rates of hand hygiene adherence in both physicians and nurses were higher in the postintervention period than in the preintervention period. However, the improvement of hand hygiene adherence among nurses—from 415 of 1,643 (25.2%) to 487 of 1,245 (39.1%) for an increase of 13.9 percentage points (95% CI,10.4-17.3)—was greater than that in physicians—from 38 of 375 (10.1%) to 61 of 385 (15.8%) for an increase of 5.7 percentage points (95% CI, 1.0-8.1; P < .001; Figure B). In general, nurse hand hygiene adherence was higher than that in physicians both in the preintervention period, with nurses at 25.2% (95% CI, 23.2%-27.4%) vs physicians at 10.1% (95% CI, 7.1%-13.2%; P < .001), and in the postintervention period, with nurses at 39.1% (95% CI, 36.4%-41.8%) vs physicians at 15.8% (95% CI, 12.2%-19.5%; P < .001).
Changes by Hospital
Overall, improvement of hand hygiene adherence was observed in all hospitals. However, the improvement rates differed in each hospital: They were 6.5 percentage points in Hospital A, 11.3 percentage points in Hospital C, 11.4 percentage points in Hospital D, and 18.4 percentage points in Hospital B. Hospital B achieved the highest postintervention adherence rates (42.6%), along with the highest improvement. The improvements of hand hygiene adherence in physicians were higher in Hospitals B (8.4 percentage points) and D (8.3 percentage points) than they were in Hospitals A (4.1 percentage points) and C (4.0 percentage points).
Interventions performed at each hospital to improve hand hygiene adherence are summarized in Table 2 and the Appendix Figure. All hospitals performed feedback of hand hygiene adherence after the preintervention period. Interventions related to AHR were frequently initiated; self-carry AHR was provided in two hospitals (Hospitals C and D), and location of AHR was moved (Hospitals B and D). In addition, new AHR products that caused less skin irritation were introduced in Hospital B. Direct observation by hospital staff (separate from our study observers) was also done as part of Hospital A and D’s improvement efforts. Other interventions included a 1-month campaign for hand hygiene including a contest for senryu (humorous 17-syllable poems; Table 2; Appendix Table), posters, seminars, and creation of a handbook related to hand hygiene. Posters emphasizing the importance of hand hygiene created by the local hospital infection control teams were put on the wall in several locations near wash basins. Seminars (1-hour lectures to emphasize the importance of hand hygiene) were provided to nurses. A 10-page hand hygiene handbook was created by one local infection control team and provided to nurses.
DISCUSSION
Our study demonstrated that the overall rate of hand hygiene adherence improved from 22.4% to 33.6% after multimodal intervention; however, the adherence rates even after intervention were suboptimal. The results were comparable with those of a previous study in Japan,22 which underscores how suboptimal HCW hand hygiene in Japan threatens patient safety. Hand hygiene among HCWs is one of the most important methods to prevent HAIs and to reduce spread of multidrug resistant organisms. High adherence has proven challenging because it requires behavior modification. We implemented WHO hand hygiene adherence strategies27 and evaluated the efficacy of a multimodal intervention in hopes of finding the specific factors that could be related to behavior modification for HCWs.
We observed several important relationships between the intervention components and their improvement in hand hygiene adherence. Among the four participating hospitals, Hospital B was the most successful with improvement of hand hygiene adherence from 24.2% to 42.6%. One unique intervention for Hospital B was the introduction of new AHR products for the people who had felt uncomfortable with current products. Frequent hand washing or the use of certain AHR products could irritate skin causing dry or rough hands, which could reduce hand hygiene practices. In Japan, there are several AHR products available. Among them, a few products contain skin moisturizing elements; these products are 10%-20% higher in cost than nonmoisturizing products. The HCWs in our study stated that the new products were more comfortable to use, and they requested to introduce them as daily use products. Thus, use of a product containing a hand moisturizer may reduce some factors negatively affecting hand hygiene practice and improve adherence rates.
Although this study was unable to determine which components are definitively associated with improving hand hygiene adherence, the findings suggest initiation of multiple intervention components simultaneously may provide more motivation for change than initiating only one or two components at a time. It is also possible that certain intervention components were more beneficial than others. Consistent with a previous study, improving hand hygiene adherence cannot be simply achieved by improving infrastructure (eg, introducing portable AHR) alone, but rather depends on altering the behavior of physicians and nurses.
This study was performed at four tertiary care hospitals in Niigata that are affiliated with Niigata University. They are located closely in the region, within 100 km, have quarterly conferences, and use a mutual monitoring system related to infection prevention. The members of infection control communicate regularly, which we thought would optimize improvements in hand hygiene adherence, compared with the circumstances of previous studies. In this setting, HCWs have similar education and share knowledge related to infection control, and the effects of interventions in each hospital were equally evaluated if similar interventions were implemented. In the current study, the interventions at each hospital were similar, and there was limited variety; therefore, specific, novel interventions that could affect hand hygiene adherence significantly were difficult to find.
There are a few possible reasons why hand hygiene adherence rates were low in the current study. First, part of this study was conducted during the summer so that the consciousness and caution for hand hygiene might be lower, compared with that in winter. In general, HCWs become more cautious for hand hygiene practice when they take care of patients diagnosed with influenza or respiratory syncytial virus infection. Second, the infrastructure for hand hygiene practice in the hospitals in Japan is inadequate and not well designed. Because of safety reasons, a single dispenser of AHR is placed at the entrance of each room in general and not at each bedside. The number of private rooms is limited, and most of the rooms in wards have multiple beds per room, with no access to AHR within the room. In fact, the interventions at all four hospitals included a change in the location and/or access of AHR. Easier access to AHR is likely a key step to improving hand hygiene adherence rates. Finally, there was not an active intervention to include hospital or unit leaders. This is important given the involvement of leaders in hand hygiene practice significantly changed the hand adherence rates in a previous study.19
Given the suboptimal hand hygiene adherence rates in Japan noted in this and previous Japanese studies,21,22 the spread of COVID-19 within the hospital setting is a concern. Transmission of COVID-19 by asymptomatic carriers has been suggested,11 which emphasizes the importance of regular standard precautions with good hand hygiene practice to prevent further transmission.
Although the hand hygiene rate was suboptimal, we were able to achieve a few sustainable, structural modifications in the clinical environment after the intervention. These include adding AHR in new locations, changing the location of existing AHR to more appropriate locations, and introducing new products. These will remain in the clinical environment and will contribute to hand hygiene adherence in the future.
This study has several limitations. First, the presence of external observers in their clinical settings might have affected the behavior of HCWs.28 Although they were not informed that their hand hygiene adherence was going to be monitored, the existence of an external observer in their clinical setting might have changed normal behavior. Second, the infrastructure and interventions for hand hygiene adherence before the intervention were different in each hospital, so there is a possibility that hospitals with less infrastructure for hand hygiene adherence had more room for improvement with the interventions. Third, we included observations at different units at each hospital, which might affect the results of the study because of the inclusion of different medical settings and HCWs. Fourth, the number of physician hand hygiene observations was limited: We conducted our observations between 8
In conclusion, a multimodal intervention to improve hand hygiene adherence successfully improved HCWs’ hand hygiene adherence in Niigata, Japan; however, the adherence rates are still relatively low compared with those reported from other countries. Further intervention is required to improve hand hygiene adherence.
1. Zimlichman E, Henderson D, Tamir O, et al. Health care-associated infections: a meta-analysis of costs and financial impact on the US health care system. JAMA Intern Med. 2013;173(22):2039-2046. https://doi.org/10.1001/jamainternmed.2013.9763.
2. Cassini A, Plachouras D, Eckmanns T, et al. Burden of six healthcare-associated infections on European population health: estimating incidence-based disability-adjusted life years through a population prevalence-based modelling study. PLoS Med. 2016;13(10):e1002150. https://doi.org/10.1371/journal.pmed.1002150.
3. Vrijens F, Hulstaert F, Van de Sande S, Devriese S, Morales I, Parmentier Y. Hospital-acquired, laboratory-confirmed bloodstream infections: linking national surveillance data to clinical and financial hospital data to estimate increased length of stay and healthcare costs. J Hosp Infect. 2010;75(3):158-162. https://doi.org/10.1016/j.jhin.2009.12.006.
4. de Lissovoy G, Fraeman K, Hutchins V, Murphy D, Song D, Vaughn BB. Surgical site infection: incidence and impact on hospital utilization and treatment costs. Am J Infect Control. 2009;37(5):387-397. https://doi.org/10.1016/j.ajic.2008.12.010.
5. Suka M, Yoshida K, Takezawa J. Epidemiological approach to nosocomial infection surveillance data: the Japanese Nosocomial Infection Surveillance System. Environ Health Prev Med. 2008;13(1):30-35. https:// doi.org/10.1007/s12199-007-0004-y.
6. Japan Nosocomial Infection Surveillance. JANIS Open Report. 2018. https://janis.mhlw.go.jp/english/report/open_report/2018/3/1/ken_Open_Report_Eng_201800_clsi2012.pdf. Accessed April 2, 2020.
7. Allegranzi B, Pittet D. Role of hand hygiene in healthcare-associated infection prevention. J Hosp Infect. 2009;73(4):305-315. https://doi.org/10.1016/j.jhin.2009.04.019.
8. Zhu N, Zhang D, Wang W, et al. A novel coronavirus from patients with pneumonia in China, 2019. N Engl J Med. 2020;382(8):727-733. https://doi.org/10.1056/NEJMoa2001017.
9. World Health Organization. Coronavirus disease (COVID-19) advice for the public. 2020. https://www.who.int/emergencies/diseases/novel-coronavirus-2019/advice-for-public. Accessed February 28, 2020.
10. Centers for Disease Control and Prevention. Interim Guidance for Preventing the Spread of Coronavirus Disease 2019 (COVID-19) in Homes and Residential Communities. 2020. https://www.cdc.gov/coronavirus/2019-ncov/hcp/guidance-prevent-spread.html. Accessed February 28, 2020.
11. Bai Y, Yao L, Wei T, et al. Presumed asymptomatic carrier transmission of COVID-19. JAMA. 2020;323(14):1406-1407. https://doi.org/10.1001/jama.2020.2565.
12. Burke JP. Infection control - a problem for patient safety. N Engl J Med. 2003;348(7):651-656. https://doi.org/10.1056/NEJMhpr020557.
13. World Health Organization. A Guide to the Implementation of the WHO Multimodal Hand Hygiene Improvement Strategy. 2013. https://www.who.int/gpsc/5may/Guide_to_Implementation.pdf. Accessed February 28, 2020.
14. Allegranzi B, Gayet-Ageron A, Damani N, et al. Global implementation of WHO’s multimodal strategy for improvement of hand hygiene: a quasi-experimental study. Lancet Infect Dis. 2013;13(10):843-851. https://doi.org/10.1016/S1473-3099(13)70163-4.
15. Pittet D, Hugonnet S, Harbarth S, et al. Effectiveness of a hospital-wide programme to improve compliance with hand hygiene. Infection Control Programme. Lancet. 2000;356(9238):1307-1312. https://doi.org/10.1016/s0140-6736(00)02814-2.
16. Rosenthal VD, Pawar M, Leblebicioglu H, et al. Impact of the International Nosocomial Infection Control Consortium (INICC) multidimensional hand hygiene approach over 13 years in 51 cities of 19 limited-resource countries from Latin America, Asia, the Middle East, and Europe. Infect Control Hosp Epidemiol. 2013;34(4):415-423. https://doi.org/10.1086/669860.
17. Pincock T, Bernstein P, Warthman S, Holst E. Bundling hand hygiene interventions and measurement to decrease health care-associated infections. Am J Infect Control. 2012;40(4 Suppl 1):S18-S27. https://doi.org/10.1016/j.ajic.2012.02.008.
18. Larson EL. APIC guideline for handwashing and hand antisepsis in health care settings. Am J Infect Control. 1995;23(4):251-269. https://doi.org/10.1016/0196-6553(95)90070-5.
19. Saint S, Conti A, Bartoloni A, et al. Improving healthcare worker hand hygiene adherence before patient contact: a before-and-after five-unit multimodal intervention in Tuscany. Qual Saf Health Care. 2009;18(6):429-433. https://doi.org/10.1136/qshc.2009.032771.
20. Bolon MK. Hand hygiene: an update. Infect Dis Clin North Am. 2016;30(3):591-607. https://doi.org/10.1016/j.idc.2016.04.007.
21. Sakihama T, Honda H, Saint S, et al. Hand hygiene adherence among health care workers at Japanese hospitals: a multicenter observational study in Japan. J Patient Saf. 2016;12(1):11-17. https://doi.org/10.1097/PTS.0000000000000108.
22. Sakihama T, Honda H, Saint S, et al. Improving healthcare worker hand hygiene adherence before patient contact: a multimodal intervention of hand hygiene practice in three Japanese tertiary care centers. J Hosp Med. 2016;11(3):199-205. https://doi.org/10.1002/jhm.2491.
23. Sakihama T, Kayauchi N, Kamiya T, et al. Assessing sustainability of hand hygiene adherence 5 years after a contest-based intervention in 3 Japanese hospitals. Am J Infect Control. 2020;48(1):77-81. https://doi.org/10.1016/j.ajic.2019.06.017.
24. World Health Organization. My 5 Moments for Hand Hygiene. https://www.who.int/infection-prevention/campaigns/clean-hands/5moments/en/. Accessed April 2, 2020.
25. World Health Organization. WHO Guidelines on Hand Hygiene in Health Care. 2009. https://www.who.int/gpsc/5may/tools/9789241597906/en/. Accessed February 28, 2020.
26. Saint S, Bartoloni A, Virgili G, et al. Marked variability in adherence to hand hygiene: a 5-unit observational study in Tuscany. Am J Infect Control. 2009;37(4):306-310. https://doi.org/10.1016/j.ajic.2008.08.004.
27. World Health Organization. WHO Guidelines on Hand Hygiene in Health Care: First Global Patient Safety Challenge Clean Care Is Safer Care. Geneva: World Health Organization; 2009. https://www.ncbi.nlm.nih.gov/books/NBK144013/pdf/Bookshelf_NBK144013.pdf. Accessed February 28, 2020.
28. Pan SC, Tien KL, Hung IC, et al. Compliance of health care workers with hand hygiene practices: independent advantages of overt and covert observers. PLoS One. 2013;8(1):e53746. https://doi.org/10.1371/journal.pone.0053746.
© 2020 Society of Hospital Medicine
Is There an Association Between Hidradenitis Suppurativa and Fibromyalgia?
To the Editor:
Hidradenitis suppurativa (HS) is a chronic inflammatory condition that affects approximately 1% to 4% of the worldwide population and is 3 times more common in females than in males.1 The condition is characterized by painful inflamed nodules in apocrine gland–bearing regions that can progress to abscesses, sinus tracts, and/or scarring. Hidradenitis suppurativa is associated with intense pain, work disability, and poor quality of life.1
Recent evidence has suggested that HS is an autoimmune disease resulting from dysregulation of the γ-secretase/Notch pathway, leading to stimulation of the toll-like receptor–mediated innate immunity that contributes to occlusion and inflammation of the hair follicle. Additionally, elevated levels of proinflammatory cytokines such as tumor necrosis factor α and IL-17 are seen in HS lesions.2 The autoimmune nature of HS may account for its increased association with other autoimmune disorders such as thyroid disease and potentially with other unexplored conditions such as fibromyalgia.3
Fibromyalgia is a chronic pain condition that primarily affects females and is commonly associated with other autoimmune conditions.4 The primary objective of this retrospective study was to determine the prevalence of fibromyalgia in HS patients and assess if there is an association between HS disease severity and development of fibromyalgia.
We conducted a retrospective chart review of patients at Wake Forest Baptist Medical Center (Winston-Salem, North Carolina) who were 18 years and older and had a diagnosis of both HS and fibromyalgia from January 2008 to November 2018. The primary end point was the prevalence of fibromyalgia in the HS population. The secondary end point was the association of HS disease severity with the development of fibromyalgia. Hidradenitis disease severity was defined according to the number of body areas affected by HS: mild disease involved 1 body area, moderate disease involved 2 body areas, and severe disease involved 3 or more body areas. Patient age, sex, and race also were recorded.
A total of 1356 patients were seen during this time period for HS. The prevalence of fibromyalgia in the HS population was 3.2% (n=44). Ninety-five percent (42/44) of patients with HS and fibromyalgia were women; 22 (50%) patients had severe disease, 12 (27%) had moderate disease, 7 (16%) had mild disease, and 3 (7%) had an unknown number of affected body areas. Fifty-seven percent (25/44) of patients were diagnosed with HS prior to the diagnosis of fibromyalgia (Table).

In our study, the prevalence of fibromyalgia in HS patients was lower than the overall prevalence estimates of up to 6% in the United States.5 Although fibromyalgia is associated with other autoimmune conditions, it does not appear that fibromyalgia occurs more frequently in the HS population than the general population. A limitation of this study was that we only included academic outpatient clinic visits at one institution, which may not be representative of the entire HS population. Fibromyalgia was one of the many pain disorders in this population of patients. In this population of HS patients, many had pain issues with diagnose
- Smith MK, Nichlson CL, Parks-Miller A, et al. Hidradenitis suppurativa: an update on connecting the tracts. F1000Res. 2017;6:1272.
- Napolitano M, Megna M, Timoshchuk EA, et al. Hidradenitis suppurativa: from pathogenesis to diagnosis and treatment. Clin Cosmet Investig Dermatol. 2017;10:105-115.
- Miller IM, Vinding G, Sorensen HA, et al. Thyroid function in hidradenitis suppurativa: a population-based cross-sectional study from Denmark. Clin Exp Dermatol. 2018;43:899-905.
- Giacomelli C, Talarico R, Bombardieri S, et al. The interaction between autoimmune diseases and fibromyalgia: risk, disease course and management. Expert Rev Clin Immunol. 2013;9:1069-1076.
- Queiroz LP. Worldwide epidemiology of fibromyalgia. Curr Pain Headache Rep. 2013;17:356.
To the Editor:
Hidradenitis suppurativa (HS) is a chronic inflammatory condition that affects approximately 1% to 4% of the worldwide population and is 3 times more common in females than in males.1 The condition is characterized by painful inflamed nodules in apocrine gland–bearing regions that can progress to abscesses, sinus tracts, and/or scarring. Hidradenitis suppurativa is associated with intense pain, work disability, and poor quality of life.1
Recent evidence has suggested that HS is an autoimmune disease resulting from dysregulation of the γ-secretase/Notch pathway, leading to stimulation of the toll-like receptor–mediated innate immunity that contributes to occlusion and inflammation of the hair follicle. Additionally, elevated levels of proinflammatory cytokines such as tumor necrosis factor α and IL-17 are seen in HS lesions.2 The autoimmune nature of HS may account for its increased association with other autoimmune disorders such as thyroid disease and potentially with other unexplored conditions such as fibromyalgia.3
Fibromyalgia is a chronic pain condition that primarily affects females and is commonly associated with other autoimmune conditions.4 The primary objective of this retrospective study was to determine the prevalence of fibromyalgia in HS patients and assess if there is an association between HS disease severity and development of fibromyalgia.
We conducted a retrospective chart review of patients at Wake Forest Baptist Medical Center (Winston-Salem, North Carolina) who were 18 years and older and had a diagnosis of both HS and fibromyalgia from January 2008 to November 2018. The primary end point was the prevalence of fibromyalgia in the HS population. The secondary end point was the association of HS disease severity with the development of fibromyalgia. Hidradenitis disease severity was defined according to the number of body areas affected by HS: mild disease involved 1 body area, moderate disease involved 2 body areas, and severe disease involved 3 or more body areas. Patient age, sex, and race also were recorded.
A total of 1356 patients were seen during this time period for HS. The prevalence of fibromyalgia in the HS population was 3.2% (n=44). Ninety-five percent (42/44) of patients with HS and fibromyalgia were women; 22 (50%) patients had severe disease, 12 (27%) had moderate disease, 7 (16%) had mild disease, and 3 (7%) had an unknown number of affected body areas. Fifty-seven percent (25/44) of patients were diagnosed with HS prior to the diagnosis of fibromyalgia (Table).
In our study, the prevalence of fibromyalgia in HS patients was lower than the overall prevalence estimates of up to 6% in the United States.5 Although fibromyalgia is associated with other autoimmune conditions, it does not appear that fibromyalgia occurs more frequently in the HS population than the general population. A limitation of this study was that we only included academic outpatient clinic visits at one institution, which may not be representative of the entire HS population. Fibromyalgia was one of the many pain disorders in this population of patients. In this population of HS patients, many had pain issues with diagnose
- Smith MK, Nichlson CL, Parks-Miller A, et al. Hidradenitis suppurativa: an update on connecting the tracts. F1000Res. 2017;6:1272.
- Napolitano M, Megna M, Timoshchuk EA, et al. Hidradenitis suppurativa: from pathogenesis to diagnosis and treatment. Clin Cosmet Investig Dermatol. 2017;10:105-115.
- Miller IM, Vinding G, Sorensen HA, et al. Thyroid function in hidradenitis suppurativa: a population-based cross-sectional study from Denmark. Clin Exp Dermatol. 2018;43:899-905.
- Giacomelli C, Talarico R, Bombardieri S, et al. The interaction between autoimmune diseases and fibromyalgia: risk, disease course and management. Expert Rev Clin Immunol. 2013;9:1069-1076.
- Queiroz LP. Worldwide epidemiology of fibromyalgia. Curr Pain Headache Rep. 2013;17:356.
Practice Point
- Although fibromyalgia does not occur more frequently in hidradenitis suppurativa (HS) patients, it is important to recognize that HS patients can have comorbidities that should be addressed when possible to improve overall quality of life.
Incidence of Chronic Opioid Use in Previously Opioid-Naïve Patients Receiving Opioids for Analgesia in the Intensive Care Unit
Chronic pain is a worldwide cause of impairment. According to data from the 2016 National Health Interview Survey, an estimated 50 million American adults suffer from chronic pain, with 19.6 million adults suffering from high-impact chronic pain.1 This phenomenon is particularly prevalent in the older population. More than 25% of adults aged 65 to 74 years reported that they were often in pain in the past 3 months compared with just 10% of those adults between the ages of 18 and 44 years.2
The economic burdens of chronic pain disorders are well known. In 2010, Gaskin and Richard found that chronic pain has far-reaching consequences for the US economy, ranging from direct health care costs to lost productivity. This study estimated additional health care costs at about $300 billion yearly and lost productivity at $300 billion, bringing total annual costs to about $600 billion. This expense is more than heart disease alone ($309 billion), and cancer and diabetes mellitus ($243 billion and $188 billion respectively) combined.3
Opioid medications are powerful and effective pain-reducing agents that are indicated for short-term acute pain or long-term in the management of chronic, severe cancer-related pain.4 Although efficacious, use of these medications carries with it the inherent risks of abuse, misuse, addiction, and overdose.5 Since 1999, opioid-related overdose deaths have been on the rise. The CDC estimated that > 15,000 deaths were attributable specifically to prescription opioids in 2015.6 The estimates had risen to > 17,000 deaths in 2017, with the number increasing since that time.7 Cumulatively, the CDC estimates that > 200,000 deaths in the US between 1999 and 2017 are attributed to prescription opioid overdose, clearly marking this trend as a growing nationwide epidemic.8
In 2016, Florence and colleagues estimated costs associated with opioid overdose to be just shy of $80 billion in 2013 dollars.9 In October 2017, the US Department of Health and Human Services declared the opioid epidemic a public health emergency and committed $900 million to combating the crisis.10
An abundance of data exist analyzing outpatient prescribing and its impacts on opioid dependence, particularly postoperatively. A study by Brummett and colleagues indicated that the incidence of new persistent opioid use in patients who underwent surgery was 5.9% to 6.5% and did not differ between major and minor surgical procedures. This study concluded that new opioid use could be considered one of the most common complications after elective surgery.11 Similarly, in 2017 Makary and colleagues found that surgeons tend to overprescribe pain medications after procedures; some prescribing as many as 50 to 60 tablets to control pain after simple procedures.12 This is in stark contrast to pain guideline recommendations of no more than 10 tablets for most standard operative procedures.13
Sun and colleagues conducted a retrospective analysis of health care claims data in more than 18 million opioid-naïve patients who did and did not undergo surgery. Seven of the 11 surgical procedures were associated with an increased risk of chronic opioid use. The highest incidence of chronic opioid use in the first postoperative year was for total hip arthroplasty (1.4%, OR 5.10; 95% CI, 1.29-1.53). The study found that the risk factors most associated with chronic opioid use after surgery were male sex, aged > 50 years, and preoperative history of drug abuse, alcohol abuse, or depression, along with benzodiazepine use or antidepressant use.14 In a 2018 cohort study that evaluated predictors associated with transitioning to incident chronic opioid therapy, 4 factors were identified. These included opioid duration of action (adjusted odds ratio [AOR], 12.28; 95% CI, 8.1-06-18.72), the parent opioid compound (eg, tramadol vs codeine; AOR, 7.26; 95% CI, 5.20-10.13), the presence of conditions that are very likely to cause chronic pain (AOR, 5.47; 95% CI, 3.89-7.68), and drug use disorders (AOR, 4.02; 95% CI, 2.53-6.40).15
While there has been research into outpatient risk factors and medical practices that may contribute to chronic opioid use, a relative paucity of data exists on the contribution of hospitalization and inpatient opioid use on patient outcomes. A 2014 Canadian study assessed the impact of opioid use in the intensive care unit (ICU) on opioid use after discharge.16 This study included more than 2,500 patients who were admitted to a Canadian ICU between 2005 and 2008, and then followed after discharge for 48 months to quantify chronic opioid use. Nonopioid users increased from 87.8% in the early post-ICU period to 95.6% at 48 months after discharge. Preadmission chronic opioid use and prolonged hospital length of stay (LOS) were found to be associated with an increased risk of chronic opioid use after discharge.16 To date, there are no published studies that analyze the incidence of opioid-naïve veterans who convert to chronic opioid use after receiving opioids during an acute hospitalization.
In this retrospective analysis, we analyze the incidence of chronic opioid use after administration of opioids in the ICU as well as a variety of risk factors that may influence conversion to chronic opioid use.
Methods
This analysis was a single center, retrospective chart review conducted for patients admitted between July 1, 2017 and December 31, 2017 at the US Department of Veterans Affairs (VA) Michael E. DeBakey VA Medical Center (MEDVAMC) in Houston, Texas. MEDVAMC is a 538-bed academic\teaching hospital serving about 130,000 veterans in Southeast Texas. The hospital has 3 ICUs (medical, cardiovascular, and surgical) and 38 total ICU beds. The study was approved by the Baylor College of Medicine Institutional Review Board and MEDVAMC Research and Development Review Board. Informed consent was not required.
Inclusion criteria consisted of patients aged ≥ 18 years admitted to the ICU in the above-specified time frame, who were administered a continuous infusion of an opioid for at least 12 hours. Patients were excluded if they were not opioid naïve prior to admission, defined as receiving > 30 days of opioids in the prior 12 months. Patients who died during hospital admission, never received an opioid despite having an active order, were hospital-to-hospital transfers, or were still admitted at the time of data collection were excluded from the analysis.
All pertinent data were collected using the VA Computerized Patient Record System (CPRS) and the Critical Care Manager (Picis Clinical Solutions) ICU monitoring application. Critical Care Manager was used to track the time frame, duration, and amounts of opioid infusions administered in the ICU. Patient demographic and preadmission data, including date of birth, age, race, history of substance use/alcohol use disorder (defined as a previous diagnosis) and previous opioid prescriptions within the past year were recorded. For the inpatient admission, the ICU LOS, hospital LOS, primary admission diagnosis, type of opioid medication administered, and total duration and dose of opioid administered were collected. After discharge, opioid medication fill data at 3, 6, and 12 months were collected. This information included names of any outpatient opioids filled, dosage unit, quantity, day supply, and number of refills.
The primary outcome for this study was to determine the incidence of chronic opioid use at 3, 6, and 12 months after discharge, defined as the percentage of patients receiving outpatient opioid prescriptions at each time point. Analyses were conducted to observe the effect of age, race, history of substance use or history of alcohol use (International Classification of Diseases documented diagnosis, 9th edition), ICU type (medical, surgical, or cardiovascular), surgical/nonsurgical admission, ICU LOS, hospital LOS, total time, and amount of opioids administered during admission on risk of conversion to chronic opioid use.
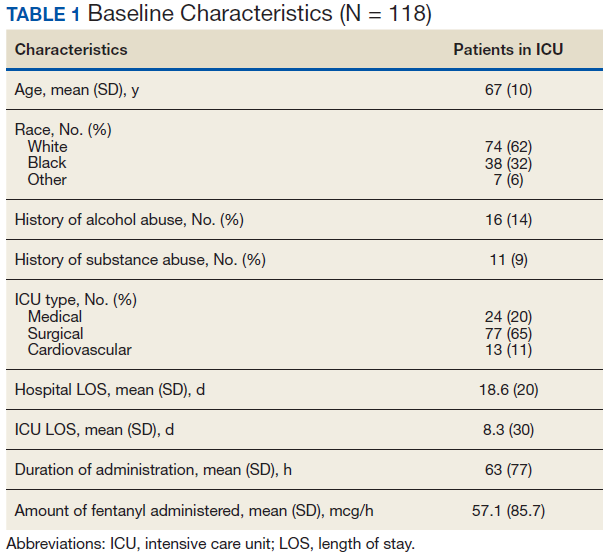
Descriptive statistics were calculated to analyze the incidence of chronic opioid use. Univariate logistic regression analysis, including ORs, 95% CIs, and P values, was conducted to determine the effects of the risk factors noted earlier on chronic opioid use at each time point. A multivariate logistic regression model was performed to assess the effect of multiple independent variables on opioid use at 3, 6, and 12 months. Statistical analysis was performed using StataCorp Stata SE.
Results
During the study period, 330 patients were admitted to the ICU. After applying inclusion/exclusion criteria, 118 patients were included in the final analysis. The most frequent reasons for exclusion from the study were patient death (n = 77), a past history of opioid use (n = 56), and not having received an opioid infusion for at least 12 hours (n = 68). The average age of the patients included was 67 years (Table 1). A total of 14% and 9% of patients, respectively, had a diagnosis of alcohol use disorder or substance use disorder recorded in CPRS. After admission, the most common location for these patients was the surgical ICU (65%). All patients were male. The average hospital LOS was 18.6 days , and the ICU LOS was 8.3 days. The average duration of administration for the opioid (fentanyl) infusion was 63 hours, and the average amount of fentanyl administered to each patient was 57.1 mcg/h.
The incidence of opioid-naïve patients receiving opioids after discharge was 76.3% (n = 90) at 3 months, 19.5% (n = 23) at 6 months and 7.6% (n = 9) at 12 months (Figure). The daily morphine milligram equivalent (MME) of patients prescribed opioids at 3, 6, and 12 months was similar (3 months, 22.7; 6 months, 19.7; 12 months, 20.9). In the univariate regression analysis, several variables were found to be associated with converting to chronic opioid use. Prior history of alcohol use disorder (OR, 0.3; 95% CI, 0.10-0.88; P = .03), ICU type (OR, 3.9; 95% CI, 1.73-8.75; P = .001) and ICU LOS (OR, 0.88; 95% CI, 0.81-0.95; P = .01) had a statistically significant association on opioid use at 3 months. (Table 2). No variables evaluated had a statistically significant effect on chronic opioid use at 6 months, and only age (OR 0.93; 95% CI. 0.87-0.99; P = .02) was statistically significant at 12 months. In the multivariate logistic regression analysis, history of alcohol abuse, admission for surgery, and hospital LOS were significant at 3 months (Table 3).
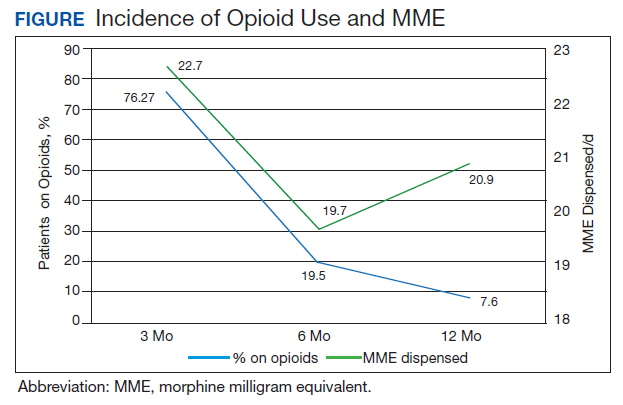
Discussion
In this single-center analysis conducted at a VA academic hospital of opioid-naïve patients who were administered opioids in the ICU, the incidence of patients subsequently receiving outpatient opioid prescriptions at 12 months after discharge was 7.6%. There also was a decrease in the amount of opioids received by patients (daily MME) after discharge at 3, 6, and 12 months. This trend did not demonstrate the propensity for inpatient opioid use to convert opioid-naïve patients to chronic opioid users.
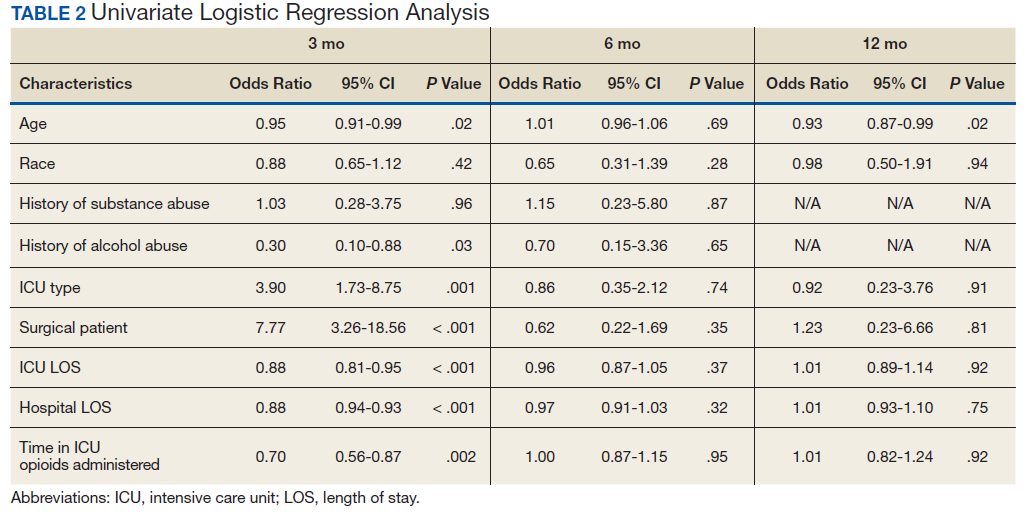
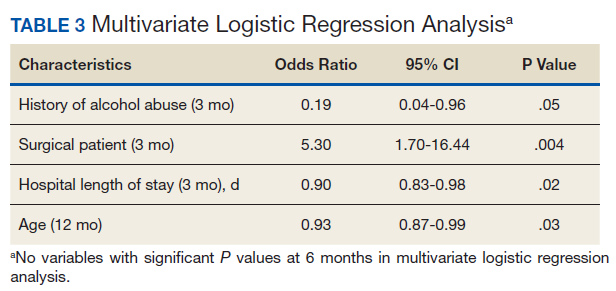
The most common outpatient opioids prescribed were hydrocodone/acetaminophen, morphine, and tramadol. Logistic regression showed few factors that correlated significantly with opioid use in the long-term (12 month) period. This finding is a deviation from the findings of Yaffe and colleagues who found hospital LOS to be one of the only predictors of long-term opioid use in their population (defined as use at 48 months).16 One important difference between our study and the Yaffe and colleagues study was that they evaluated all patients who were admitted to the ICU, regardless of the exposure to opioids during their inpatient stay. Consequently, this difference may have resulted in the differences in findings.
Strengths and Limitations
Location was a strength of our study, as this analysis was conducted at an integrated health care system that provides comprehensive inpatient and outpatient care. The VA uses a closed electronic health record, which allowed patients to be followed both in the inpatient and outpatient settings to determine which medications were prescribed at each time. In other health care systems this information would have been difficult to follow as patients often fill outpatient prescriptions at community pharmacies not affiliated with the treating hospital. However, any patient not using a VA prescriber for subsequent opioid prescriptions or patients who received opioids through other sources would not have had their continued opioid use captured. These data may be available in the states prescription monitoring program, but it was not available to query for research at this time.
This study also excluded chronic opioid users, which could have been another confounding factor to account for when analyzing the results. However, the primary objective of the study was to determine the impact of opioids prescribed in the ICU on converting previous opioid-naïve patients to chronic users. Finally, a multivariate logistic regression was incorporated to assess for factors that may predispose certain patients to convert to chronic opioid users. This analysis served to extend the applicability of our study by not only analyzing whether receiving opioids in the ICU contributed to chronic opioid use in the long-term, but also which populations may be at greatest risk. This information can be used in the future to target harm-reduction efforts toward high-risk hospitalized patients.
One limitation of this study was that it was conducted as a retrospective, single-center chart review in Houston, Texas. Because this was not a randomized controlled trial, it is difficult to imply any causation between exposure to opioids in the ICU and chronic use. In addition, because this study was conducted at a single site, the results may not be able to be generalized to other populations. VA populations tend to be elderly and predominantly male, as was reflected by the study population. These factors, along with regional variability in patient characteristics, may limit the generalizability of this study to older male patients located in Southeast Texas or other similar populations. Other limitations of this study also included the small sample size, limited period of follow-up obtained, and that other comorbidity information (pain scores during stay, use of nonopioid pain medications, past history of anxiety or depression, or other acute illnesses or surgeries that may have required opioid therapy during admission) was not collected.
This study was only able to review 118 patients for a follow-up duration of 1 year. In the Yaffe and colleagues study, more than 2,500 patients were followed over 4 years, which provided a more long-term overview of the clinical course of these patients and may be another reason for discrepant findings. However, this study did not actually assess the impact on administration of opioids on the development of chronic opioid use.16 Finally, the biggest limitation to this study may be the potential for confounding discharge prescriptions. After discharge, patients’ prescriptions were evaluated from discharge to 3 months, in between 3 and 6 months, and between 6 and 12 months for the presence of an opioid prescription. Due to this methodology, any opioid prescription a patient was discharged with was counted in the 3-month time point. Since many patients included in the study were admitted to the surgical ICU (65%), it was logical that they were discharged with opioids after their procedure. While including the immediate postdischarge prescription data was useful for evaluating the decrease in opioid use and incidence over time, it did cause the 3-month time point to appear overly inflated, potentially signaling that at 3 months after discharge many of these patients were still requiring opioid use.
The Society of Critical Care Medicine still recommends opioids as first-line therapy for non-neuropathic pain in the ICU setting.17 Additionally, postoperative pain can be difficult to manage in the surgical population and is often treated with opioids, though treatment with multimodal pain regimens is becoming more common.18 It is difficult to imagine that a finding that implicates opioid use in the hospital with conversion to chronic opioid use would prompt a cessation in the use of opioid in these settings, especially in the context of analgosedation related to mechanically ventilated patients. However, it would be plausible to use this knowledge to advocate for opioid-sparing therapies and consideration for weaning individuals at high risk for misuse after discharge from opioid-containing sedation or analgesia regimens in a timelier manner.
Though our findings did not show a clinically relevant increase in chronic opioid users, clinicians can still use this information to encourage targeted education and closer monitoring for those patients deemed as high risk at discharge to prevent unnecessary prolonged opioid use. By having more frequent follow-up in pain clinics, switching patients to nonopioid therapies after discharge, and ensuring high-risk patients are discharged with naloxone rescue kits, it would be possible to drastically reduce the number of potential overdoses for patients who previously required opioid therapy in the ICU.
Conclusion
After discharge, 7.6% of previously opioid-naïve patients who were treated with opioids in the ICU were still receiving prescriptions for opioids at 12 months. These findings did not suggest a clinically significant increase in the incidence of chronic opioid use after inpatient administration of opioids. However, these results prompt the need for larger, prospective, multicenter studies to evaluate the effect on hospitalization on converting to chronic opioid use and a deeper evaluation of other potential risk factors that may be present.
1. Dahlhamer J, Lucas J, Zelaya C, et al. Prevalence of chronic pain and high-impact chronic pain among adults—United States, 2016. MMWR Morb Mortal Wkly Rep. 2018;67(36):1001-1006.
2. Centers for Disease Control and Prevention. QuickStats: percentage of adults aged ≥18 years who often had pain in the past 3 months, by sex and age group. https://www.cdc.gov/mmwr/preview/mmwrhtml/mm6217a10.htm. Published May 3, 2103. Accessed February 7, 2020.
3. Gaskin DJ, Richard P. The economic costs of pain in the United States. J Pain. 2012;13(8):715-724.
4. Jamison RN, Mao J. Opioid analgesics. Mayo Clin Proc. 2015;90(7):957-68.
5. DiPiro JT, Talbert RL, Yee GC, Matzke GR, Wells BG, Posey LM. Pharmacotherapy: A Pathophysiologic Approach, 9e. McGraw Hill Professional; 2014.
6. Rudd RA, Seth P, David F, Scholl L. Increases in drug and opioid-involved overdose deaths—United States, 2010-2015. MMWR Morb Mortal Wkly Rep. 2016;65(50-51):1445-1452.
7. Ahmad FB, Rossen LM, Spencer M, Warner M, Sutton P. Provisional drug overdose death counts. https://www.cdc.gov/nchs/nvss/vsrr/drug-overdose-data.htm. Reviewed February 12, 2020. Accessed February 18, 2020.
8. National Institute on Drug Abuse. Overdose death rates. https://www.drugabuse.gov/related-topics/trends-statistics/overdose-death-rates. Revised January 2019. Accessed February 10, 2020.
9. Florence CS, Zhou C, Luo F, Xu L. The economic burden of prescription opioid overdose, abuse, and dependence in the United States, 2013. Med Care. 2016;54(10):901-906.
10. HHS Acting Secretary declares public health emergency to address national opioid crisis [news release]. https://www.hhs.gov/about/news/2017/10/26/hhs-acting-secretary-declares-public-health-emergency-address-national-opioid-crisis.html. Published October 26, 2017. Accessed February 7, 2020.
11. Brummett CM, Waljee JF, Goesling J, et al. New persistent opioid use after minor and major surgical procedures in US adults. JAMA Surg. 2017;152(6):e170504.
12. Makary MA, Overton HN, Wang P. Overprescribing is major contributor to opioid crisis. BMJ. 2017;359:j4792.
13. Dowell D, Haegerich TM, Chou R. CDC guideline for prescribing opioids for chronic pain—United States, 2016. MMWR Recomm Rep. 2016;65(1):1-49.
14. Sun EC, Darnall BD, Baker LC, Mackey S. Incidence of and risk factors for chronic opioid use among opioid-naive patients in the postoperative period. JAMA Intern Med. 2016;176(9):1286-93.
15. Thornton JD, Dwibedi N, Scott V, et al. Predictors of transitioning to incident chronic opioid therapy among working-age adults in the United States. Am Health Drug Benefits. 2018;11(1):12-21.
16. Yaffe PB, Green RS, Butler MB, Witter T. Is admission to the intensive care unit associated with chronic opioid use? A 4-year follow-up of intensive care unit survivors. J Intensive Care Med. 2017;327(7):429-435.
17. Devlin JW, Skrobik Y, Gélinas C, et al. Clinical practice guidelines for the prevention and management of pain, agitation/sedation, delirium, immobility, and sleep disruption in adult patients in the ICU. Crit Care Med. 2018;46(9):e825-e873.
18. Chou R, Gordon DB, de Leon-Casasola OA, et al. Management of postoperative pain: a clinical practice guideline from the American Pain Society, the American Society of Regional Anesthesia and Pain Medicine, and the American Society of Anesthesiologists’ Committee on Regional Anesthesia, Executive Committee, and Administrative Council. J Pain. 2016;17(2):131-157.
Chronic pain is a worldwide cause of impairment. According to data from the 2016 National Health Interview Survey, an estimated 50 million American adults suffer from chronic pain, with 19.6 million adults suffering from high-impact chronic pain.1 This phenomenon is particularly prevalent in the older population. More than 25% of adults aged 65 to 74 years reported that they were often in pain in the past 3 months compared with just 10% of those adults between the ages of 18 and 44 years.2
The economic burdens of chronic pain disorders are well known. In 2010, Gaskin and Richard found that chronic pain has far-reaching consequences for the US economy, ranging from direct health care costs to lost productivity. This study estimated additional health care costs at about $300 billion yearly and lost productivity at $300 billion, bringing total annual costs to about $600 billion. This expense is more than heart disease alone ($309 billion), and cancer and diabetes mellitus ($243 billion and $188 billion respectively) combined.3
Opioid medications are powerful and effective pain-reducing agents that are indicated for short-term acute pain or long-term in the management of chronic, severe cancer-related pain.4 Although efficacious, use of these medications carries with it the inherent risks of abuse, misuse, addiction, and overdose.5 Since 1999, opioid-related overdose deaths have been on the rise. The CDC estimated that > 15,000 deaths were attributable specifically to prescription opioids in 2015.6 The estimates had risen to > 17,000 deaths in 2017, with the number increasing since that time.7 Cumulatively, the CDC estimates that > 200,000 deaths in the US between 1999 and 2017 are attributed to prescription opioid overdose, clearly marking this trend as a growing nationwide epidemic.8
In 2016, Florence and colleagues estimated costs associated with opioid overdose to be just shy of $80 billion in 2013 dollars.9 In October 2017, the US Department of Health and Human Services declared the opioid epidemic a public health emergency and committed $900 million to combating the crisis.10
An abundance of data exist analyzing outpatient prescribing and its impacts on opioid dependence, particularly postoperatively. A study by Brummett and colleagues indicated that the incidence of new persistent opioid use in patients who underwent surgery was 5.9% to 6.5% and did not differ between major and minor surgical procedures. This study concluded that new opioid use could be considered one of the most common complications after elective surgery.11 Similarly, in 2017 Makary and colleagues found that surgeons tend to overprescribe pain medications after procedures; some prescribing as many as 50 to 60 tablets to control pain after simple procedures.12 This is in stark contrast to pain guideline recommendations of no more than 10 tablets for most standard operative procedures.13
Sun and colleagues conducted a retrospective analysis of health care claims data in more than 18 million opioid-naïve patients who did and did not undergo surgery. Seven of the 11 surgical procedures were associated with an increased risk of chronic opioid use. The highest incidence of chronic opioid use in the first postoperative year was for total hip arthroplasty (1.4%, OR 5.10; 95% CI, 1.29-1.53). The study found that the risk factors most associated with chronic opioid use after surgery were male sex, aged > 50 years, and preoperative history of drug abuse, alcohol abuse, or depression, along with benzodiazepine use or antidepressant use.14 In a 2018 cohort study that evaluated predictors associated with transitioning to incident chronic opioid therapy, 4 factors were identified. These included opioid duration of action (adjusted odds ratio [AOR], 12.28; 95% CI, 8.1-06-18.72), the parent opioid compound (eg, tramadol vs codeine; AOR, 7.26; 95% CI, 5.20-10.13), the presence of conditions that are very likely to cause chronic pain (AOR, 5.47; 95% CI, 3.89-7.68), and drug use disorders (AOR, 4.02; 95% CI, 2.53-6.40).15
While there has been research into outpatient risk factors and medical practices that may contribute to chronic opioid use, a relative paucity of data exists on the contribution of hospitalization and inpatient opioid use on patient outcomes. A 2014 Canadian study assessed the impact of opioid use in the intensive care unit (ICU) on opioid use after discharge.16 This study included more than 2,500 patients who were admitted to a Canadian ICU between 2005 and 2008, and then followed after discharge for 48 months to quantify chronic opioid use. Nonopioid users increased from 87.8% in the early post-ICU period to 95.6% at 48 months after discharge. Preadmission chronic opioid use and prolonged hospital length of stay (LOS) were found to be associated with an increased risk of chronic opioid use after discharge.16 To date, there are no published studies that analyze the incidence of opioid-naïve veterans who convert to chronic opioid use after receiving opioids during an acute hospitalization.
In this retrospective analysis, we analyze the incidence of chronic opioid use after administration of opioids in the ICU as well as a variety of risk factors that may influence conversion to chronic opioid use.
Methods
This analysis was a single center, retrospective chart review conducted for patients admitted between July 1, 2017 and December 31, 2017 at the US Department of Veterans Affairs (VA) Michael E. DeBakey VA Medical Center (MEDVAMC) in Houston, Texas. MEDVAMC is a 538-bed academic\teaching hospital serving about 130,000 veterans in Southeast Texas. The hospital has 3 ICUs (medical, cardiovascular, and surgical) and 38 total ICU beds. The study was approved by the Baylor College of Medicine Institutional Review Board and MEDVAMC Research and Development Review Board. Informed consent was not required.
Inclusion criteria consisted of patients aged ≥ 18 years admitted to the ICU in the above-specified time frame, who were administered a continuous infusion of an opioid for at least 12 hours. Patients were excluded if they were not opioid naïve prior to admission, defined as receiving > 30 days of opioids in the prior 12 months. Patients who died during hospital admission, never received an opioid despite having an active order, were hospital-to-hospital transfers, or were still admitted at the time of data collection were excluded from the analysis.
All pertinent data were collected using the VA Computerized Patient Record System (CPRS) and the Critical Care Manager (Picis Clinical Solutions) ICU monitoring application. Critical Care Manager was used to track the time frame, duration, and amounts of opioid infusions administered in the ICU. Patient demographic and preadmission data, including date of birth, age, race, history of substance use/alcohol use disorder (defined as a previous diagnosis) and previous opioid prescriptions within the past year were recorded. For the inpatient admission, the ICU LOS, hospital LOS, primary admission diagnosis, type of opioid medication administered, and total duration and dose of opioid administered were collected. After discharge, opioid medication fill data at 3, 6, and 12 months were collected. This information included names of any outpatient opioids filled, dosage unit, quantity, day supply, and number of refills.
The primary outcome for this study was to determine the incidence of chronic opioid use at 3, 6, and 12 months after discharge, defined as the percentage of patients receiving outpatient opioid prescriptions at each time point. Analyses were conducted to observe the effect of age, race, history of substance use or history of alcohol use (International Classification of Diseases documented diagnosis, 9th edition), ICU type (medical, surgical, or cardiovascular), surgical/nonsurgical admission, ICU LOS, hospital LOS, total time, and amount of opioids administered during admission on risk of conversion to chronic opioid use.
Descriptive statistics were calculated to analyze the incidence of chronic opioid use. Univariate logistic regression analysis, including ORs, 95% CIs, and P values, was conducted to determine the effects of the risk factors noted earlier on chronic opioid use at each time point. A multivariate logistic regression model was performed to assess the effect of multiple independent variables on opioid use at 3, 6, and 12 months. Statistical analysis was performed using StataCorp Stata SE.
Results
During the study period, 330 patients were admitted to the ICU. After applying inclusion/exclusion criteria, 118 patients were included in the final analysis. The most frequent reasons for exclusion from the study were patient death (n = 77), a past history of opioid use (n = 56), and not having received an opioid infusion for at least 12 hours (n = 68). The average age of the patients included was 67 years (Table 1). A total of 14% and 9% of patients, respectively, had a diagnosis of alcohol use disorder or substance use disorder recorded in CPRS. After admission, the most common location for these patients was the surgical ICU (65%). All patients were male. The average hospital LOS was 18.6 days , and the ICU LOS was 8.3 days. The average duration of administration for the opioid (fentanyl) infusion was 63 hours, and the average amount of fentanyl administered to each patient was 57.1 mcg/h.
The incidence of opioid-naïve patients receiving opioids after discharge was 76.3% (n = 90) at 3 months, 19.5% (n = 23) at 6 months and 7.6% (n = 9) at 12 months (Figure). The daily morphine milligram equivalent (MME) of patients prescribed opioids at 3, 6, and 12 months was similar (3 months, 22.7; 6 months, 19.7; 12 months, 20.9). In the univariate regression analysis, several variables were found to be associated with converting to chronic opioid use. Prior history of alcohol use disorder (OR, 0.3; 95% CI, 0.10-0.88; P = .03), ICU type (OR, 3.9; 95% CI, 1.73-8.75; P = .001) and ICU LOS (OR, 0.88; 95% CI, 0.81-0.95; P = .01) had a statistically significant association on opioid use at 3 months. (Table 2). No variables evaluated had a statistically significant effect on chronic opioid use at 6 months, and only age (OR 0.93; 95% CI. 0.87-0.99; P = .02) was statistically significant at 12 months. In the multivariate logistic regression analysis, history of alcohol abuse, admission for surgery, and hospital LOS were significant at 3 months (Table 3).
Discussion
In this single-center analysis conducted at a VA academic hospital of opioid-naïve patients who were administered opioids in the ICU, the incidence of patients subsequently receiving outpatient opioid prescriptions at 12 months after discharge was 7.6%. There also was a decrease in the amount of opioids received by patients (daily MME) after discharge at 3, 6, and 12 months. This trend did not demonstrate the propensity for inpatient opioid use to convert opioid-naïve patients to chronic opioid users.
The most common outpatient opioids prescribed were hydrocodone/acetaminophen, morphine, and tramadol. Logistic regression showed few factors that correlated significantly with opioid use in the long-term (12 month) period. This finding is a deviation from the findings of Yaffe and colleagues who found hospital LOS to be one of the only predictors of long-term opioid use in their population (defined as use at 48 months).16 One important difference between our study and the Yaffe and colleagues study was that they evaluated all patients who were admitted to the ICU, regardless of the exposure to opioids during their inpatient stay. Consequently, this difference may have resulted in the differences in findings.
Strengths and Limitations
Location was a strength of our study, as this analysis was conducted at an integrated health care system that provides comprehensive inpatient and outpatient care. The VA uses a closed electronic health record, which allowed patients to be followed both in the inpatient and outpatient settings to determine which medications were prescribed at each time. In other health care systems this information would have been difficult to follow as patients often fill outpatient prescriptions at community pharmacies not affiliated with the treating hospital. However, any patient not using a VA prescriber for subsequent opioid prescriptions or patients who received opioids through other sources would not have had their continued opioid use captured. These data may be available in the states prescription monitoring program, but it was not available to query for research at this time.
This study also excluded chronic opioid users, which could have been another confounding factor to account for when analyzing the results. However, the primary objective of the study was to determine the impact of opioids prescribed in the ICU on converting previous opioid-naïve patients to chronic users. Finally, a multivariate logistic regression was incorporated to assess for factors that may predispose certain patients to convert to chronic opioid users. This analysis served to extend the applicability of our study by not only analyzing whether receiving opioids in the ICU contributed to chronic opioid use in the long-term, but also which populations may be at greatest risk. This information can be used in the future to target harm-reduction efforts toward high-risk hospitalized patients.
One limitation of this study was that it was conducted as a retrospective, single-center chart review in Houston, Texas. Because this was not a randomized controlled trial, it is difficult to imply any causation between exposure to opioids in the ICU and chronic use. In addition, because this study was conducted at a single site, the results may not be able to be generalized to other populations. VA populations tend to be elderly and predominantly male, as was reflected by the study population. These factors, along with regional variability in patient characteristics, may limit the generalizability of this study to older male patients located in Southeast Texas or other similar populations. Other limitations of this study also included the small sample size, limited period of follow-up obtained, and that other comorbidity information (pain scores during stay, use of nonopioid pain medications, past history of anxiety or depression, or other acute illnesses or surgeries that may have required opioid therapy during admission) was not collected.
This study was only able to review 118 patients for a follow-up duration of 1 year. In the Yaffe and colleagues study, more than 2,500 patients were followed over 4 years, which provided a more long-term overview of the clinical course of these patients and may be another reason for discrepant findings. However, this study did not actually assess the impact on administration of opioids on the development of chronic opioid use.16 Finally, the biggest limitation to this study may be the potential for confounding discharge prescriptions. After discharge, patients’ prescriptions were evaluated from discharge to 3 months, in between 3 and 6 months, and between 6 and 12 months for the presence of an opioid prescription. Due to this methodology, any opioid prescription a patient was discharged with was counted in the 3-month time point. Since many patients included in the study were admitted to the surgical ICU (65%), it was logical that they were discharged with opioids after their procedure. While including the immediate postdischarge prescription data was useful for evaluating the decrease in opioid use and incidence over time, it did cause the 3-month time point to appear overly inflated, potentially signaling that at 3 months after discharge many of these patients were still requiring opioid use.
The Society of Critical Care Medicine still recommends opioids as first-line therapy for non-neuropathic pain in the ICU setting.17 Additionally, postoperative pain can be difficult to manage in the surgical population and is often treated with opioids, though treatment with multimodal pain regimens is becoming more common.18 It is difficult to imagine that a finding that implicates opioid use in the hospital with conversion to chronic opioid use would prompt a cessation in the use of opioid in these settings, especially in the context of analgosedation related to mechanically ventilated patients. However, it would be plausible to use this knowledge to advocate for opioid-sparing therapies and consideration for weaning individuals at high risk for misuse after discharge from opioid-containing sedation or analgesia regimens in a timelier manner.
Though our findings did not show a clinically relevant increase in chronic opioid users, clinicians can still use this information to encourage targeted education and closer monitoring for those patients deemed as high risk at discharge to prevent unnecessary prolonged opioid use. By having more frequent follow-up in pain clinics, switching patients to nonopioid therapies after discharge, and ensuring high-risk patients are discharged with naloxone rescue kits, it would be possible to drastically reduce the number of potential overdoses for patients who previously required opioid therapy in the ICU.
Conclusion
After discharge, 7.6% of previously opioid-naïve patients who were treated with opioids in the ICU were still receiving prescriptions for opioids at 12 months. These findings did not suggest a clinically significant increase in the incidence of chronic opioid use after inpatient administration of opioids. However, these results prompt the need for larger, prospective, multicenter studies to evaluate the effect on hospitalization on converting to chronic opioid use and a deeper evaluation of other potential risk factors that may be present.
1. Dahlhamer J, Lucas J, Zelaya C, et al. Prevalence of chronic pain and high-impact chronic pain among adults—United States, 2016. MMWR Morb Mortal Wkly Rep. 2018;67(36):1001-1006.
2. Centers for Disease Control and Prevention. QuickStats: percentage of adults aged ≥18 years who often had pain in the past 3 months, by sex and age group. https://www.cdc.gov/mmwr/preview/mmwrhtml/mm6217a10.htm. Published May 3, 2103. Accessed February 7, 2020.
3. Gaskin DJ, Richard P. The economic costs of pain in the United States. J Pain. 2012;13(8):715-724.
4. Jamison RN, Mao J. Opioid analgesics. Mayo Clin Proc. 2015;90(7):957-68.
5. DiPiro JT, Talbert RL, Yee GC, Matzke GR, Wells BG, Posey LM. Pharmacotherapy: A Pathophysiologic Approach, 9e. McGraw Hill Professional; 2014.
6. Rudd RA, Seth P, David F, Scholl L. Increases in drug and opioid-involved overdose deaths—United States, 2010-2015. MMWR Morb Mortal Wkly Rep. 2016;65(50-51):1445-1452.
7. Ahmad FB, Rossen LM, Spencer M, Warner M, Sutton P. Provisional drug overdose death counts. https://www.cdc.gov/nchs/nvss/vsrr/drug-overdose-data.htm. Reviewed February 12, 2020. Accessed February 18, 2020.
8. National Institute on Drug Abuse. Overdose death rates. https://www.drugabuse.gov/related-topics/trends-statistics/overdose-death-rates. Revised January 2019. Accessed February 10, 2020.
9. Florence CS, Zhou C, Luo F, Xu L. The economic burden of prescription opioid overdose, abuse, and dependence in the United States, 2013. Med Care. 2016;54(10):901-906.
10. HHS Acting Secretary declares public health emergency to address national opioid crisis [news release]. https://www.hhs.gov/about/news/2017/10/26/hhs-acting-secretary-declares-public-health-emergency-address-national-opioid-crisis.html. Published October 26, 2017. Accessed February 7, 2020.
11. Brummett CM, Waljee JF, Goesling J, et al. New persistent opioid use after minor and major surgical procedures in US adults. JAMA Surg. 2017;152(6):e170504.
12. Makary MA, Overton HN, Wang P. Overprescribing is major contributor to opioid crisis. BMJ. 2017;359:j4792.
13. Dowell D, Haegerich TM, Chou R. CDC guideline for prescribing opioids for chronic pain—United States, 2016. MMWR Recomm Rep. 2016;65(1):1-49.
14. Sun EC, Darnall BD, Baker LC, Mackey S. Incidence of and risk factors for chronic opioid use among opioid-naive patients in the postoperative period. JAMA Intern Med. 2016;176(9):1286-93.
15. Thornton JD, Dwibedi N, Scott V, et al. Predictors of transitioning to incident chronic opioid therapy among working-age adults in the United States. Am Health Drug Benefits. 2018;11(1):12-21.
16. Yaffe PB, Green RS, Butler MB, Witter T. Is admission to the intensive care unit associated with chronic opioid use? A 4-year follow-up of intensive care unit survivors. J Intensive Care Med. 2017;327(7):429-435.
17. Devlin JW, Skrobik Y, Gélinas C, et al. Clinical practice guidelines for the prevention and management of pain, agitation/sedation, delirium, immobility, and sleep disruption in adult patients in the ICU. Crit Care Med. 2018;46(9):e825-e873.
18. Chou R, Gordon DB, de Leon-Casasola OA, et al. Management of postoperative pain: a clinical practice guideline from the American Pain Society, the American Society of Regional Anesthesia and Pain Medicine, and the American Society of Anesthesiologists’ Committee on Regional Anesthesia, Executive Committee, and Administrative Council. J Pain. 2016;17(2):131-157.
Concordance Between Dermatologist Self-reported and Industry-Reported Interactions at a National Dermatology Conference
Interactions between industry and physicians, including dermatologists, are widely prevalent.1-3 Proper reporting of industry relationships is essential for transparency, objectivity, and management of potential biases and conflicts of interest. There has been increasing public scrutiny regarding these interactions.
The Physician Payments Sunshine Act established Open Payments (OP), a publicly available database that collects and displays industry-reported physician-industry interactions.4,5 For the medical community and public, the OP database may be used to assess transparency by comparing the data with physician self-disclosures. There is a paucity of studies in the literature examining the concordance of industry-reported disclosures and physician self-reported data, with even fewer studies utilizing OP as a source of industry disclosures, and none exists for dermatology.6-12 It also is not clear to what extent the OP database captures all possible dermatologist-industry interactions, as the Sunshine Act only mandates reporting by applicable US-based manufacturers and group purchasing organizations that produce or purchase drugs or devices that require a prescription and are reimbursable by a government-run health care program.5 As a result, certain companies, such as cosmeceuticals, may not be represented.
In this study we aimed to evaluate the concordance of dermatologist self-disclosure of industry relationships and those reported on OP. Specifically, we focused on interactions disclosed by presenters at the American Academy of Dermatology (AAD) 73rd Annual Meeting in San Francisco, California (March 20–24, 2015), and those by industry in the 2014 OP database.
Methods
In this retrospective cohort study, we compared publicly available data from the OP database to presenter disclosures found in the publicly available AAD 73rd Annual Meeting program (AADMP). The AAD required speakers to disclose financial relationships with industry within the 12 months preceding the presentation, as outlined in the Accreditation Council for Continuing Medical Education guidelines.13 All AAD presenters who were dermatologists practicing in the United States were included in the analysis, whereas residents, fellows, nonphysicians, nondermatologist physicians, and international dermatologists were excluded.
We examined general, research, and associated research payments to specific dermatologists using the 2014 OP data, which contained industry payments made between January 1 and December 31, 2014. Open Payments defined research payments as direct payment to the physician for different types of research activities and associated research payments as indirect payments made to a research institution or entity where the physician was named the principal investigator.5 We chose the 2014 database because it most closely matched the period of required disclosures defined by the AAD for the 2015 meeting. Our review of the OP data occurred after the June 2016 update and thus included the most accurate and up-to-date financial interactions.
We conducted our analysis in 2 major steps. First, we determined whether each industry interaction reported in the OP database was present in the AADMP, which provided an assessment of interaction-level concordance. Second, we determined whether all the industry interactions for any given dermatologist listed in the OP also were present in AADMP, which provided an assessment of dermatologist-level concordance.
First, to establish interaction-level concordance for each industry interaction, the company name and the type of interaction (eg, consultant, speaker, investigator) listed in the AADMP were compared with the data in OP to verify a match. Each interaction was assigned into one of the categories of concordant disclosure (a match of both the company name and type of interaction details in OP and the AADMP), overdisclosure (the presence of an AADMP interaction not found in OP, such as an additional type of interaction or company), or underdisclosure (a company name or type of interaction found in OP but not reported in the AADMP). For underdisclosure, we further classified into company present or company absent based on whether the dermatologist disclosed any relationship with a particular company in the AADMP. We considered the type of interaction to be matching if they were identical or similar in nature (eg, consulting in OP and advisory board in the AADMP), as the types of interactions are reported differently in OP and the AADMP. Otherwise, if they were not similar enough (eg, education in OP and stockholder in the AADMP), it was classified as underdisclosure. Some types of interactions reported in OP were not available on the AAD disclosure form. For example, food and beverage as well as travel and lodging were types of interactions in OP that did not exist in the AADMP. These 2 types of interactions comprised a large majority of OP payment entries but only accounted for a small percentage of the payment amount. Analysis was performed both including and excluding interactions for food, beverage, travel, and lodging (f/b/t/l) to best account for differences in interaction categories between OP and the AADMP.
Second, each dermatologist was assigned to an overall disclosure category of dermatologist-level concordance based on the status for all his/her interactions. Categories included no disclosure (no industry interactions in OP and the AADMP), concordant (all industry interactions reported in OP and the AADMP match), overdisclosure only (no industry interactions on OP but self-reported interactions present in the AADMP), and discordant (not all OP interactions were disclosed in the AADMP). The discordant category was further divided into with overdisclosure and without overdisclosure, depending on the presence or absence of industry relationships listed in the AADMP but not in OP, respectively.
To ensure uniformity, one individual (A.F.S.) reviewed and collected the data from OP and the AADMP. Information on gender and academic affiliation of study participants was obtained from information listed in the AADMP and Google searches. Data management was performed with Microsoft Excel software (Microsoft Excel 2010, Version 14.0, Microsoft Corporation). The New York University School of Medicine’s (New York, New York) institutional review board exempted this study.
Results
Of the 938 presenters listed in the AADMP, 768 individuals met the inclusion criteria. The most commonly cited type of relationship with industry listed in the AADMP was serving as an investigator, consultant, or advisory board member, comprising 34%, 26%, and 18%, respectively (Table 1). The forms of payment most frequently reported in the AADMP were honoraria and grants/research funding, comprising 49% and 25%, respectively (Table 2).
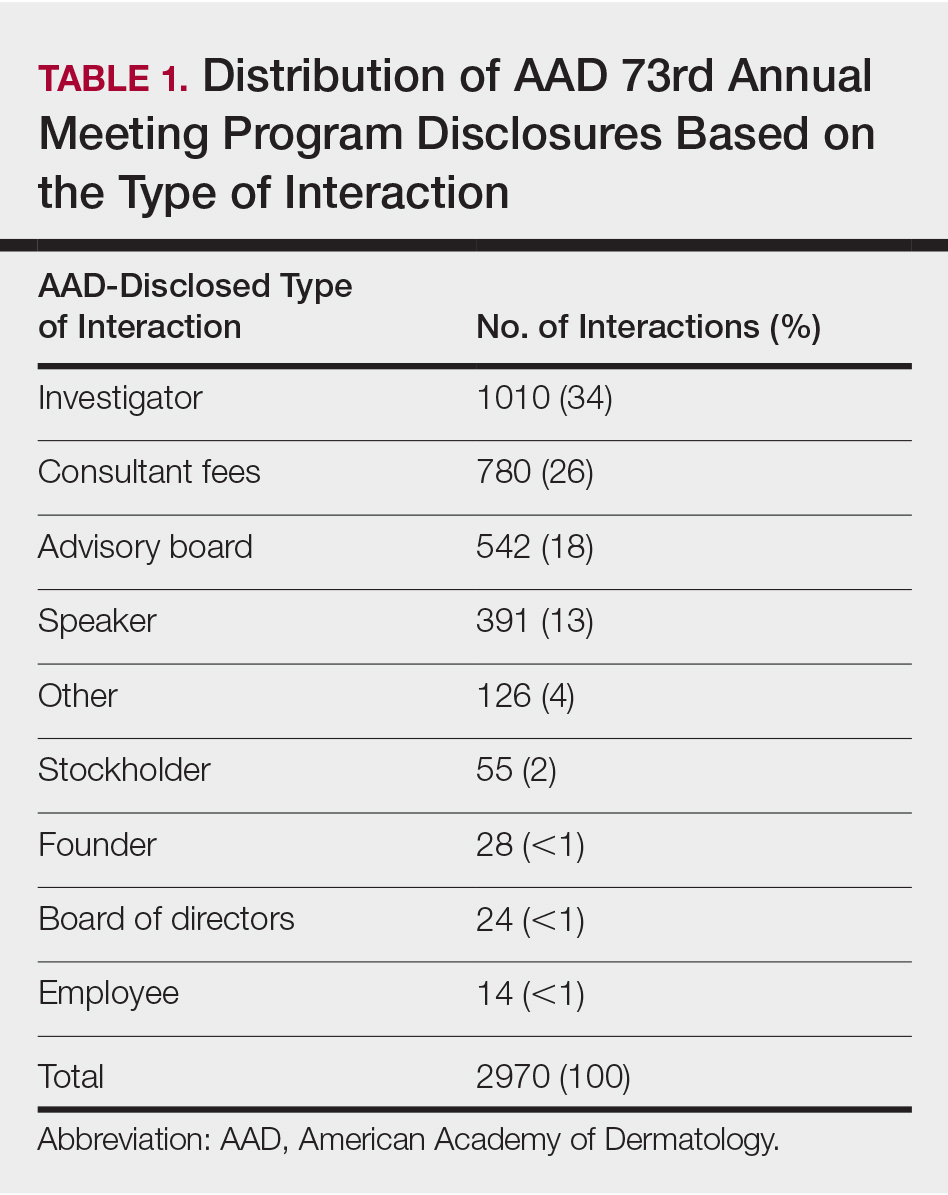
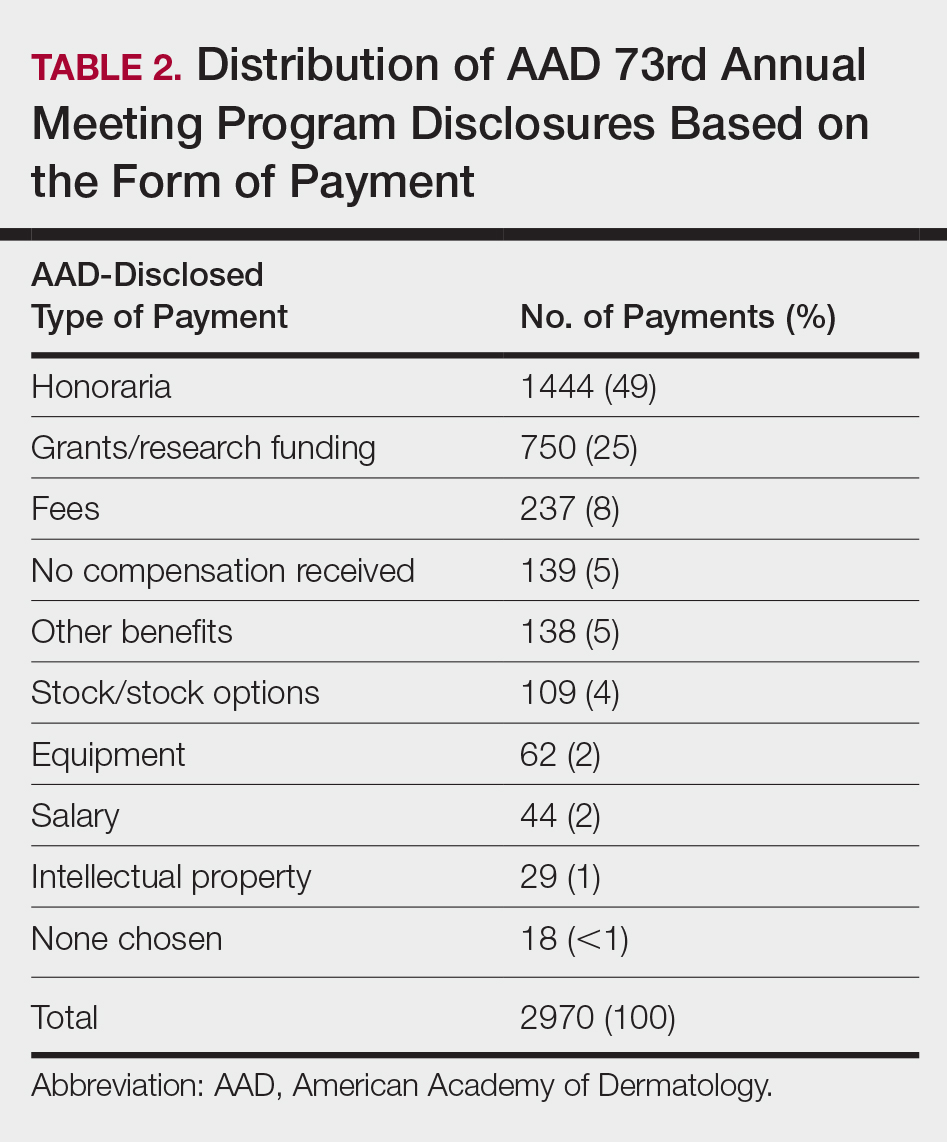
In 2014, there were a total of 20,761 industry payments totaling $35,627,365 for general, research, and associated research payments in the OP database related to the dermatologists who met inclusion criteria. There were 8678 payments totaling $466,622 for food and beverage and 3238 payments totaling $1,357,770 for travel and lodging. After excluding payments for f/b/t/l, there were 8845 payments totaling $33,802,973, with highest percentages of payment amounts for associated research (67.1%), consulting fees (11.5%), research (7.9%), and speaker fees (7.2%)(Table 3). For presenters with industry payments, the range of disbursements excluding f/b/t/l was $6.52 to $1,933,705, with a mean (standard deviation) of $107,997 ($249,941), a median of $18,247, and an interquartile range of $3422 to $97,375 (data not shown).
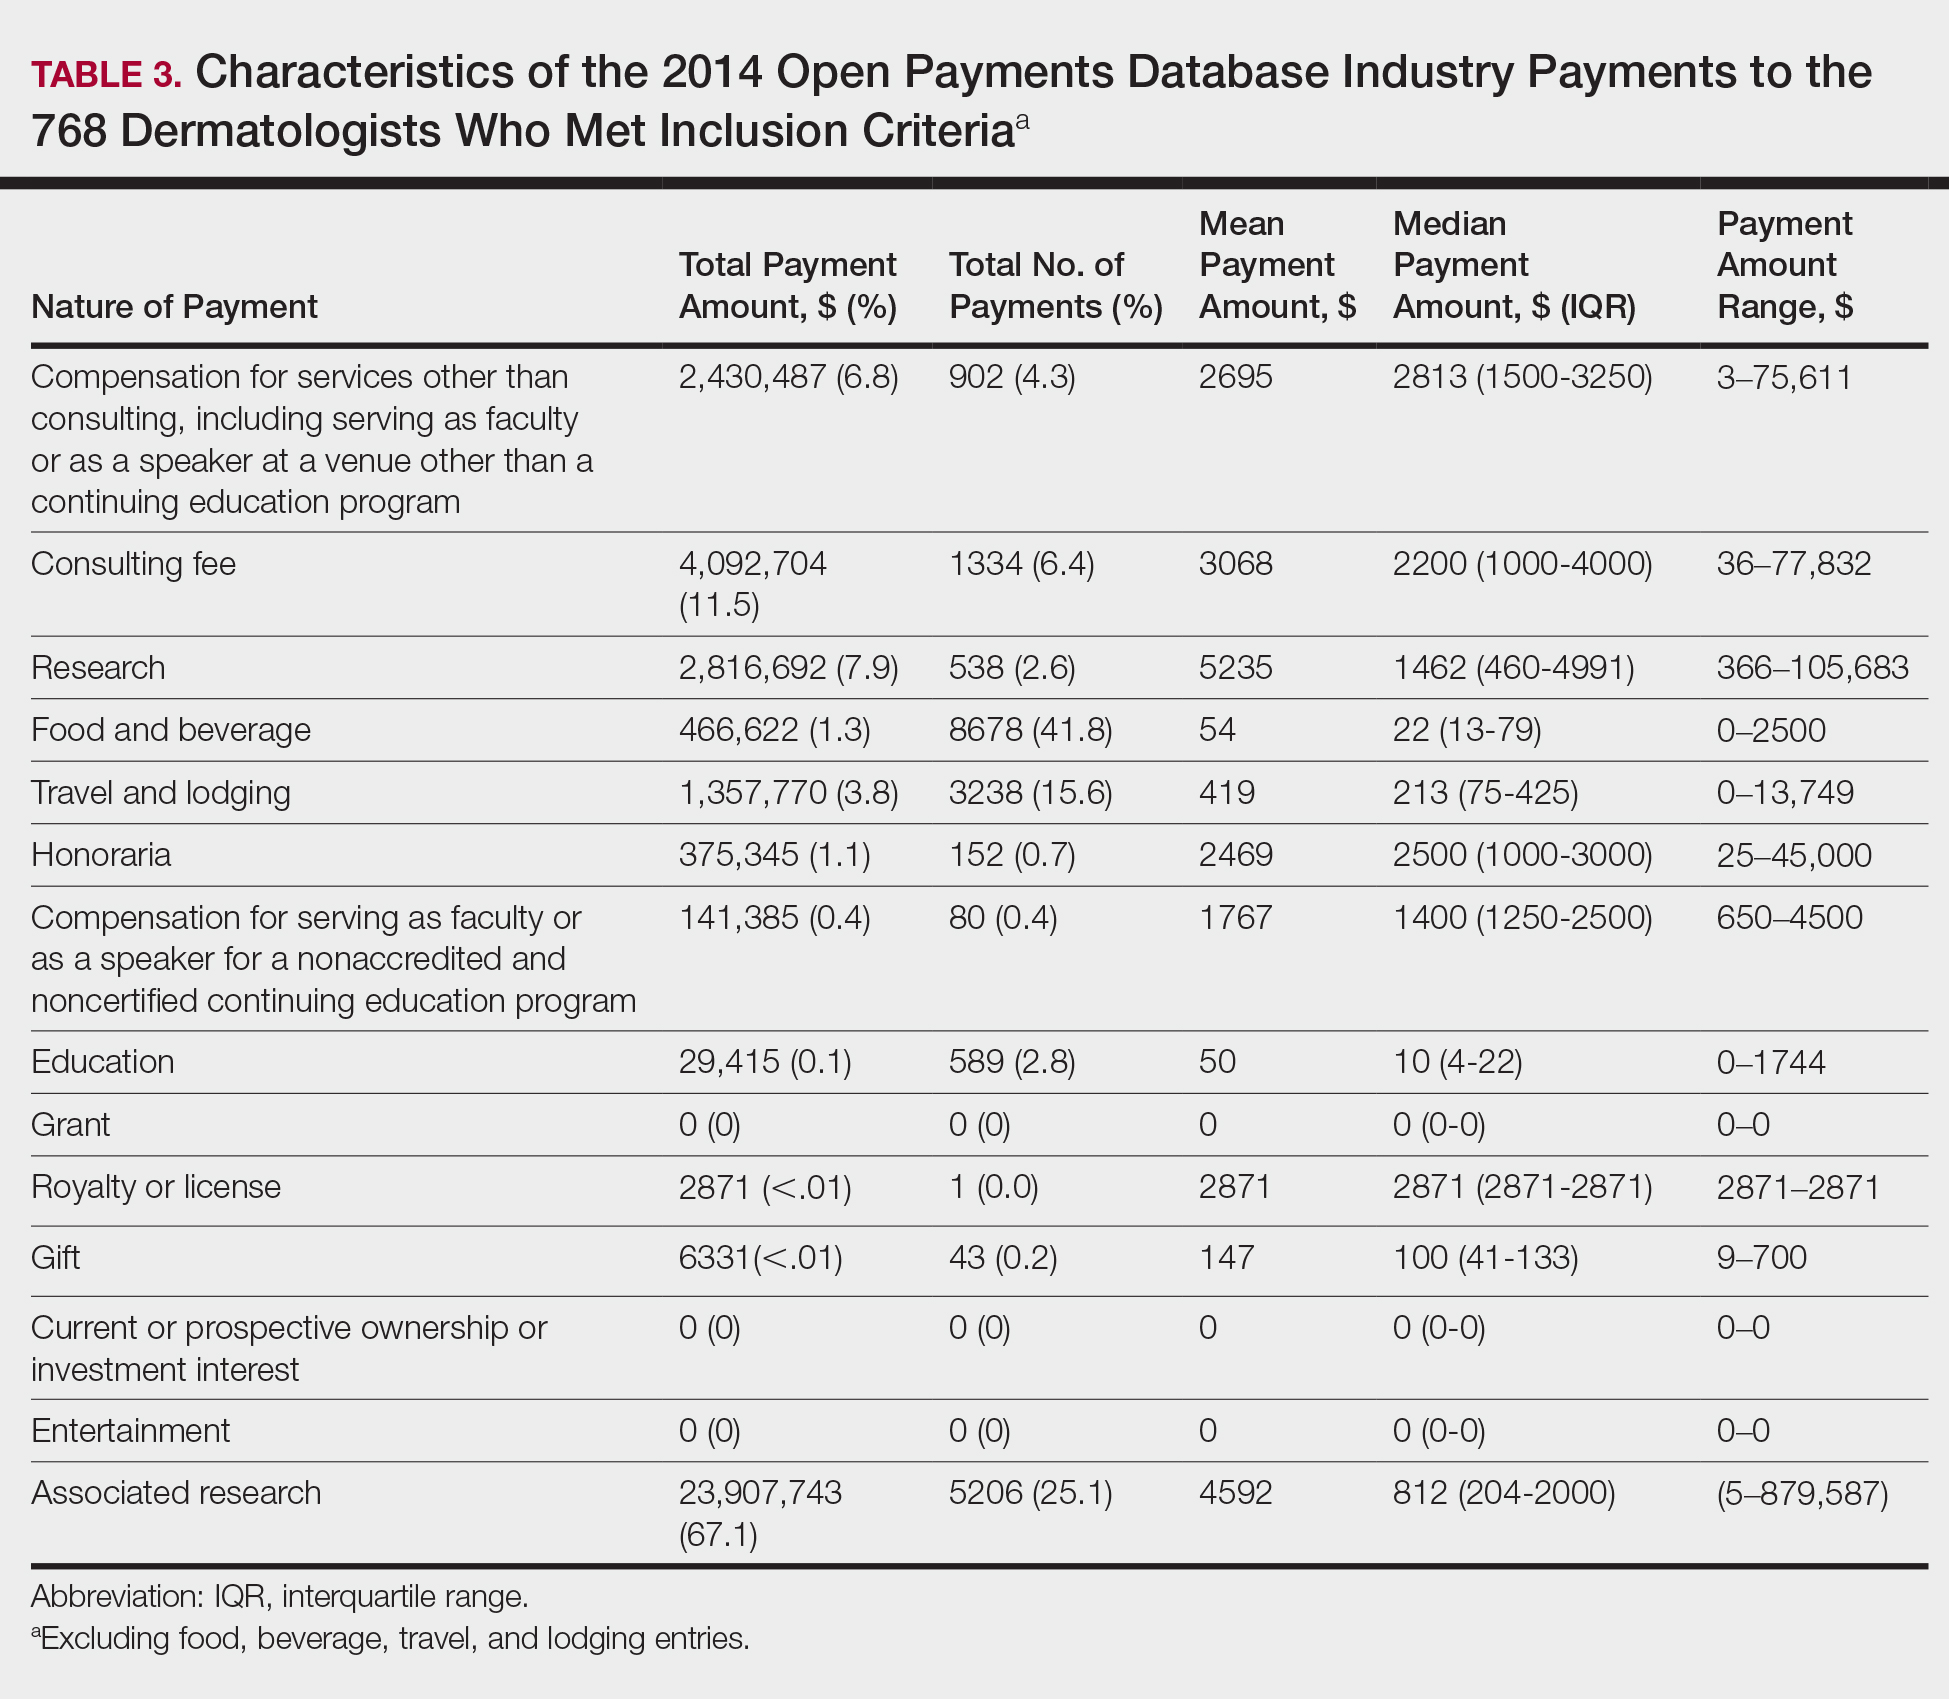
In assessing interaction-level concordance, 63% of all payment amounts in OP were classified as concordant disclosures. Regarding the number of OP payments, 27% were concordant disclosures, 34% were underdisclosures due to f/b/t/l payments, and 39% were underdisclosures due to non–f/b/t/l payments. When f/b/t/l payment entries in OP were excluded, the status of concordant disclosure for the amount and number of OP payments increased to 66% ($22,242,638) and 63% (5549), respectively. The percentage of payment entries with concordant disclosure status ranged from 43% to 71% depending on the payment amount. Payment entries at both ends of the spectrum had the lowest concordant disclosure rates, with 43% for payment entries between $0.01 and $100 and 58% for entries greater than $100,000 (Table 4). The concordance status also differed by the type of interactions. None of the OP payments for gift and royalty or license were disclosed in the AADMP, as there were no suitable corresponding categories. The proportion of payments with concordant disclosure for honoraria (45%), education (48%), and associated research (61%) was lower than the proportion of payments with concordant disclosure for research (90%), speaker fees (75%–79%), and consulting fees (74%)(Table 5).
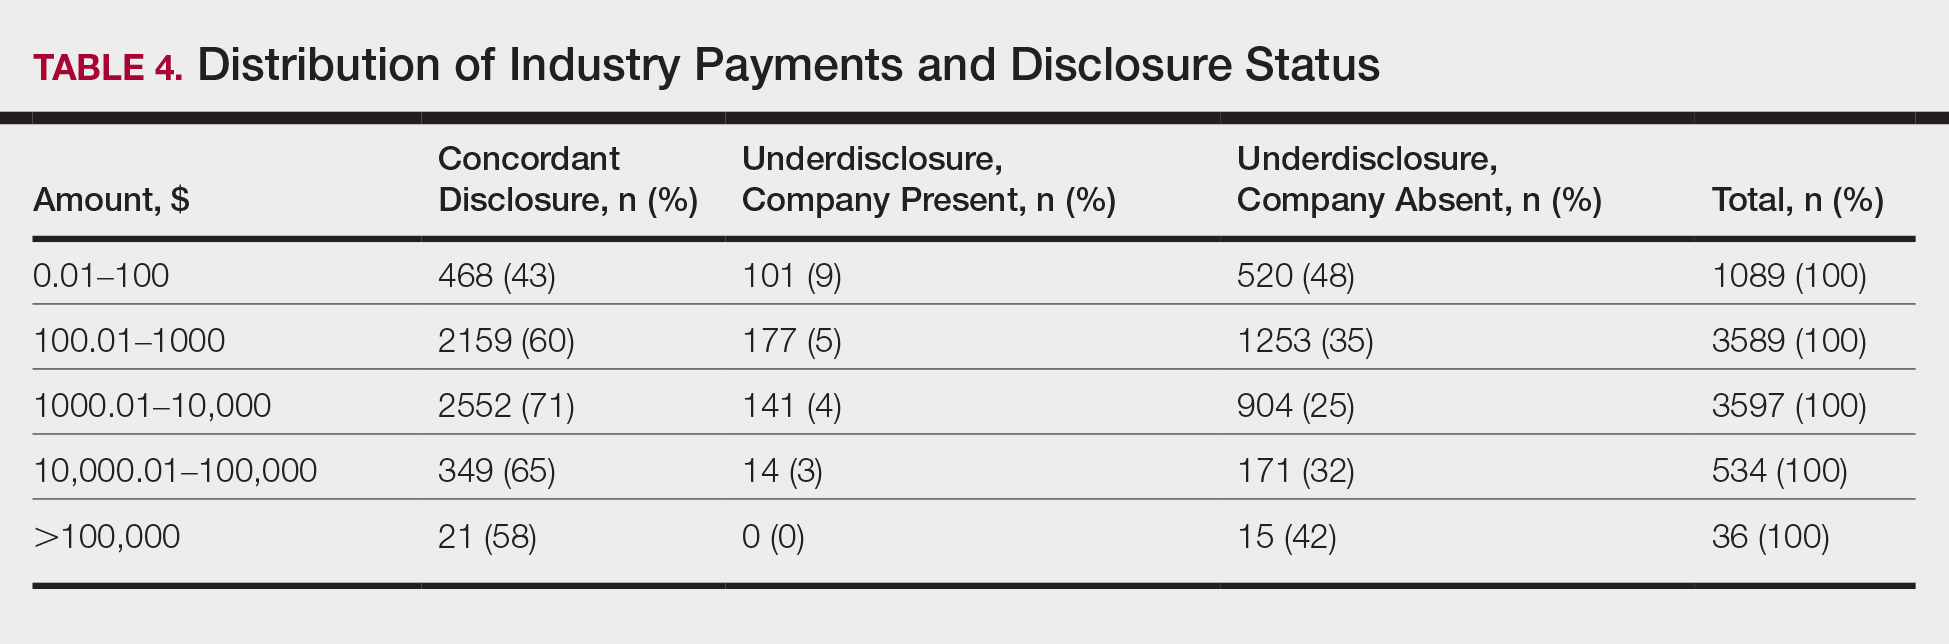
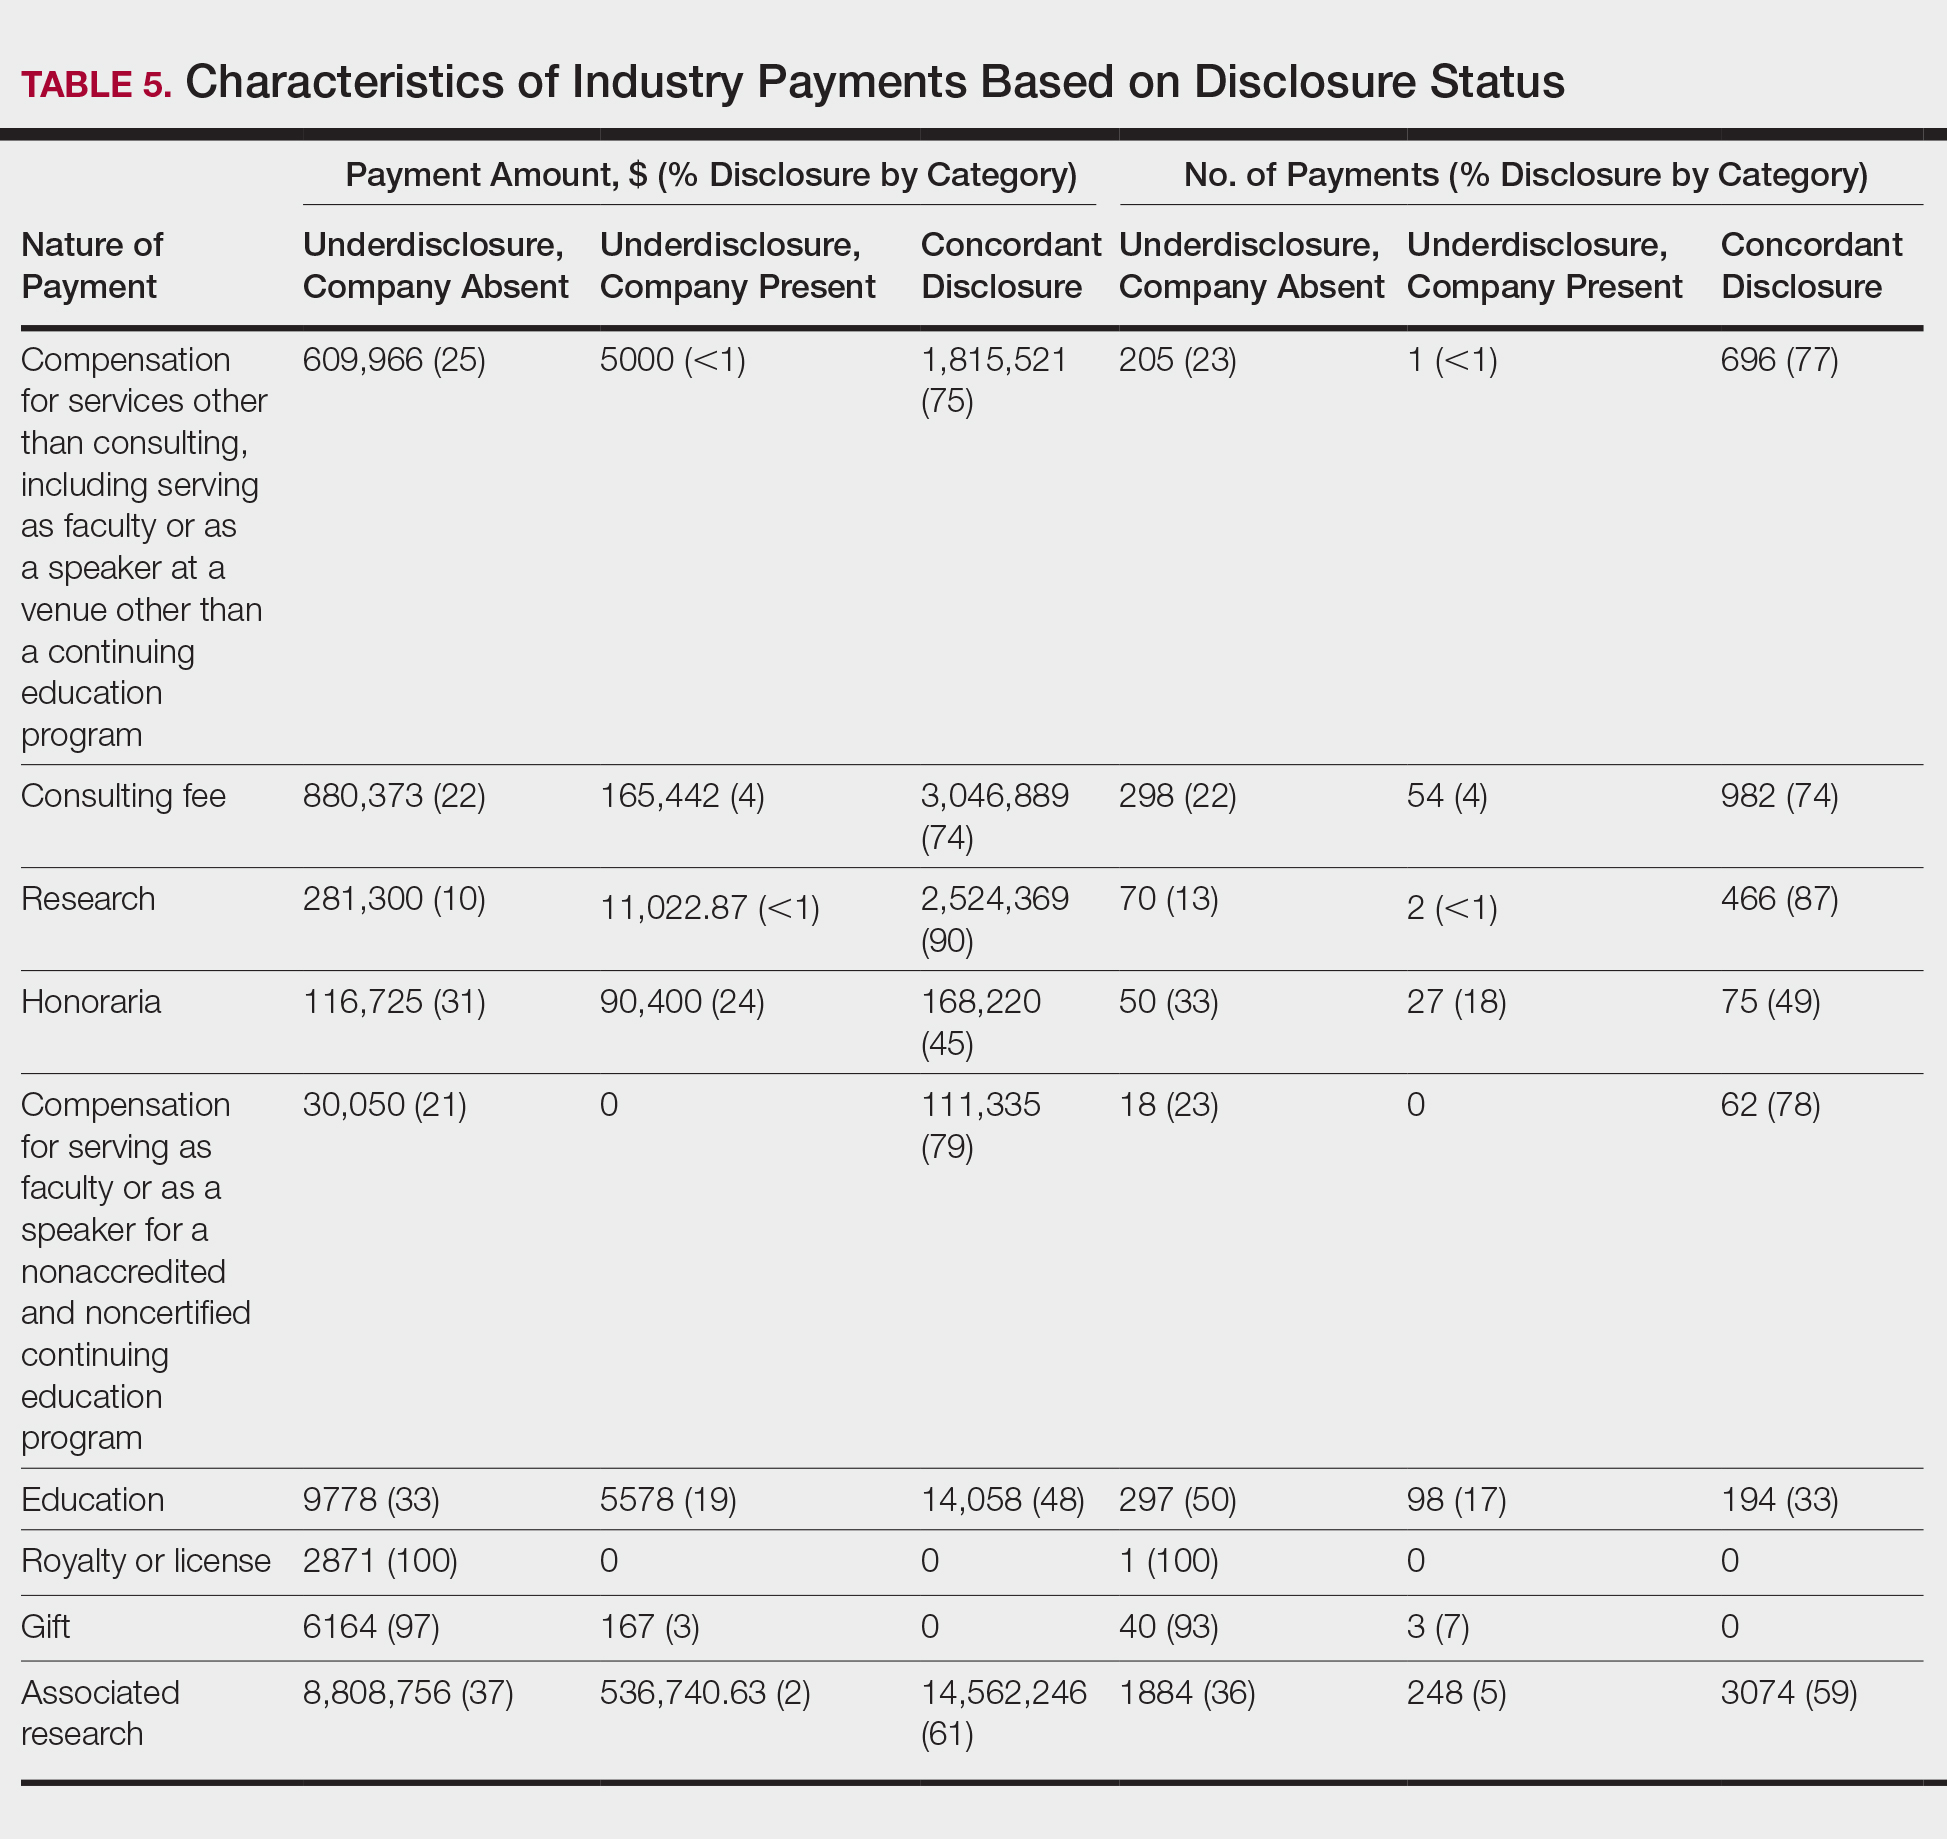
In assessing dermatologist-level concordance including all OP entries, the number of dermatologists with no disclosure, overdisclosure only, concordant disclosure, discordant with overdisclosure, and discordant without overdisclosure statuses were 234 (30%), 70 (9%), 9 (1%), 251 (33%), and 204 (27%), respectively. When f/b/t/l entries were excluded, those figures changed to 347 (45%), 108 (14%), 79 (10%), 157 (20%), and 77 (10%), respectively. The characteristics of these dermatologists and their associated industry interactions by disclosure status are shown in the eTable. Dermatologists in the discordant with overdisclosure group had the highest median number and amount of OP payments, followed by those in the concordant disclosure and discordant without overdisclosure groups. Additionally, discordant with overdisclosure dermatologists also had the highest median and mean number of unique industry interactions not on OP, followed by those in the overdisclosure only and no disclosure groups. Academic and private practice settings did not impact dermatologists’ disclosure status. The percentage of female and male dermatologists in the discordant group was 25% and 36%, respectively.
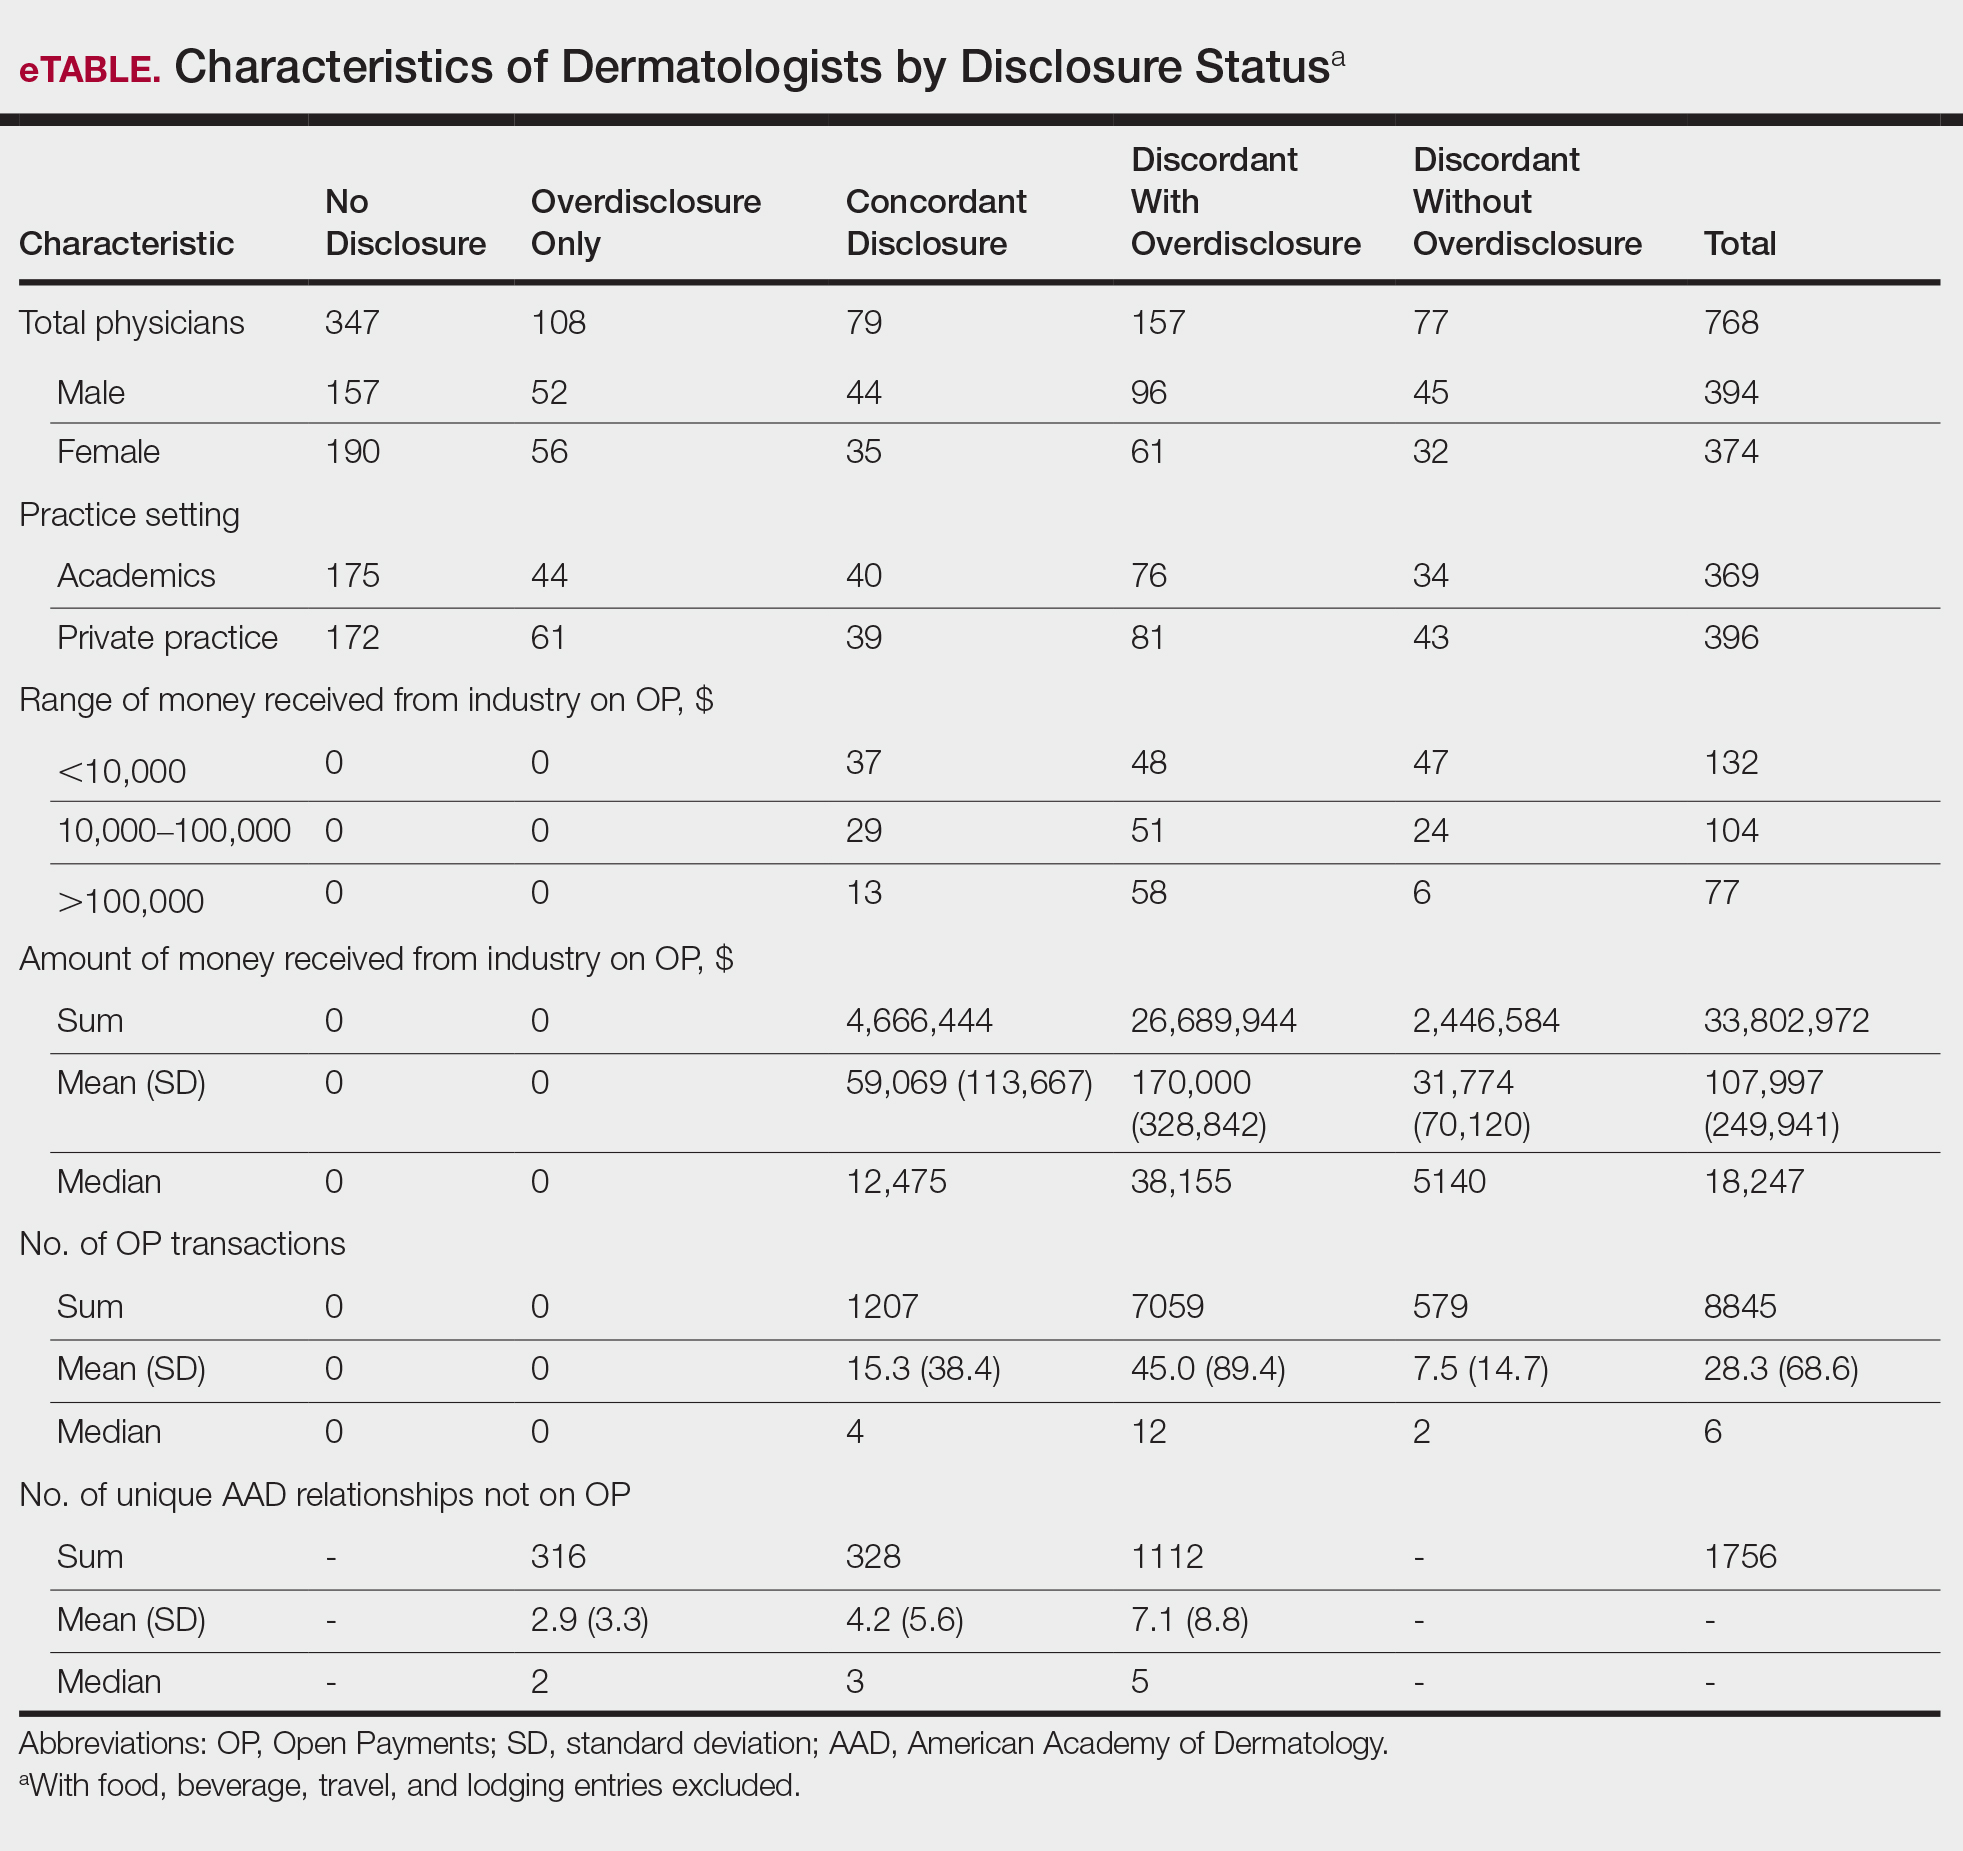
Dermatologists reported a total of 1756 unique industry relationships in the AADMP that were not found on OP. Of these, 1440 (82%) relationships were from 236 dermatologists who had industry payments on OP. The remaining 316 relationships were from 108 dermatologists who had no payments on OP. Although 114 companies reported payments to dermatologists on OP, dermatologists in the AADMP reported interactions with an additional 430 companies.
Comment
In this study, we demonstrated discordance between dermatologist self-reported financial interactions in the AADMP compared with those reported by industry via OP. After excluding f/b/t/l entries, approximately two-thirds of the total amount and number of payments in OP were disclosed, while 31% of dermatologists had discordant disclosure status.
Prior investigations in other medical fields showed high discrepancy rates between industry-reported and physician-reported relationships ranging from 23% to 62%, with studies utilizing various methodologies.6-9,11,12,14,15 Only a few studies have utilized the OP database.8,12,15 Thompson et al12 compared OP payment data with physician financial disclosure at an annual gynecology scientific meeting and found although 209 of 335 (62%) physicians had interactions listed in the OP database, only 24 (7%) listed at least 1 company in the meeting financial disclosure section. Of these 24 physicians, only 5 (21%) accurately disclosed financial relationships with all of the companies listed in OP. The investigators found 129 (38.5%) physicians and 33.7% of the $1.99 million OP payments had concordant disclosure status. When they excluded physicians who received less than $100, 53% of individuals had concordant disclosure.12 Hannon et al8 reported on inconsistencies between disclosures in the OP database and the American Academy of Orthopedic Surgeons Annual Meeting and found 259 (23%) of 1113 physicians meeting inclusion criteria had financial interactions listed in the OP database that were not reported in the meeting disclosures. Yee et al15 also utilized the OP database and compared it with author disclosures in 3 major ophthalmology journals.Of 670 authors, 367 (54.8%) had complete concordance, with 68 (10.1%) more reporting additional overdisclosures, leading to a discordant with underdisclosure rate of 35.1%. Additionally, $1.46 million (44.6%) of the $3.27 million OP payments had concordant disclosure status.15 Other studies compared individual companies’ online reports of physician payments with physician self-disclosures in annual meeting programs, clinical guidelines, and peer-reviewed publications.6,7,9,11,14
Our study demonstrated variation in disclosure status. Compared with other groups, dermatologists in the discordant with overdisclosure group on average had more interactions with and received higher payments from industry, which is consistent with studies in the orthopedic surgery literature.8,9 Male dermatologists had 11% more discordant disclosures than their female counterparts, which may be influenced by men having more industry interactions than women.3 Although small industry payments possessed the lowest concordant rate in our study, which has been observed,12 payments greater than $100,000 had the second-lowest concordance rate at 58%, which may be skewed by the small sample size. Rates of concordant disclosure differed among types of interactions, such as between research and associated research payments. This particular difference may be attributed to the incorrect listing of dermatologists as principal investigators or reduced awareness of payments, as associated research payments were made to the institution and not the individual.
Reasons for discrepancies between industry-reported and dermatologist-reported disclosures may include reporting time differences, lack of physician awareness of OP, industry reporting inaccuracies, dearth of contextual information associated with individual payment entries, and misunderstandings. Prior research demonstrated that the most common reasons for physician nondisclosure included misunderstanding disclosure requirements, unintentional omission of payment, and a lack of relationship between the industry payment and presentation topic.9,12 These factors likely contributed to the disclosure inconsistencies in our study. Similarly high rates of inconsistencies across different specialties suggest systemic concerns.
We found a substantial number of dermatologist-industry interactions listed in the AADMP that were not captured by OP, with 108 dermatologists (35%) having overdisclosures even when excluding f/b/t/l entries. The number of companies in these overdisclosures approximated 4 times the number of companies on OP. Other studies have also observed physician-industry interactions not displayed on OP.8,12,15 Because the Sunshine Act requires reporting only by certain companies, interactions surrounding products such as over-the-counter merchandise, cosmetics, lasers, novel devices, and new medications are generally not included. Further, OP may not capture nonmonetary industry relationships.
There were several limitations to this study. The most notable limitation was the differences in the categorizations of industry relationships by OP and the AADMP. These differences can overemphasize some types of interactions at the expense of other types, such as f/b/t/l. As such, analyses were repeated after excluding f/b/t/l. Another limitation was the inexact overlap of time frames for OP and the AADMP, which may have led to discrepancies. However, we used the best available data and expect the vast majority of interactions to have occurred by the AAD disclosure deadline. It is possible that the presenters may have had a more updated conflict-of-interest disclosure slide at the time of the meeting presentation. The most important limitation was that we were unable to determine whether discrepancies resulted from underreporting by dermatologists or inaccurate reporting by industry. It was unlikely that OP or the AADMP alone completely represented all dermatologist-industry financial relationships.
Conclusion
With a growing emphasis on physician-industry transparency, we identified rates of differences in dermatology consistent with those in other medical fields when comparing the publicly available OP database with disclosures at national conferences. Although the differences in the categorization and requirements for disclosure between the OP database and the AADMP may account for some of the discordance, dermatologists should be aware of potentially negative public perceptions regarding the transparency and prevalence of physician-industry interactions.
Acknowledgment
The first two authors contributed equally to this research/article
- Campbell EG, Gruen RL, Mountford J, et al. A national survey of physician-industry relationships. N Engl J Med. 2007;356:1742-1750.
- Marshall DC, Jackson ME, Hattangadi-Gluth JA. Disclosure of industry payments to physicians: an epidemiologic analysis of early data from the open payments program. Mayo Clin Proc. 2016;91:84-96.
- Feng H, Wu P, Leger M. Exploring the industry-dermatologist financial relationship: insight from the open payment data. JAMA Dermatol. 2016;152:1307-1313.
- Kirschner NM, Sulmasy LS, Kesselheim AS. Health policy basics: the physician payment Sunshine Act and the open payments program. Ann Intern Med. 2014;161:519-521.
- Search Open Payment. Centers for Medicare & Medicaid Services. https://openpaymentsdata.cms.gov. Accessed October 21, 2019.
- Buerba RA, Fu MC, Grauer JN. Discrepancies in spine surgeon conflict of interest disclosures between a national meeting and physician payment listings on device manufacturer web sites. Spine J. 2013;13:1780-1788.
- Chimonas S, Frosch Z, Rothman DJ. From disclosure to transparency: the use of company payment data. Arch Intern Med. 2011;171:81-86.
- Hannon CP, Chalmers PN, Carpiniello MF, et al. Inconsistencies between physician-reported disclosures at the AAOS annual meeting and industry-reported financial disclosures in the open payments database. J Bone Joint Surg. 2016;98:E90.
- Okike K, Kocher MS, Wei EX, et al. Accuracy of conflict-of-interest disclosures reported by physicians. N Engl J Med. 2009;361:1466-1474.
- Ramm O, Brubaker L. Conflicts-of-interest disclosures at the 2010 AUGS Scientific Meeting. Female Pelvic Med Reconstr Surg. 2012;18:79-81.
- Tanzer D, Smith K, Tanzer M. American Academy of Orthopaedic Surgeons disclosure policy fails to accurately inform its members of potential conflicts of interest. Am J Orthop (Belle Mead NJ). 2015;44:E207-E210.
- Thompson JC, Volpe KA, Bridgewater LK, et al. Sunshine Act: shedding light on inaccurate disclosures at a gynecologic annual meeting. Am J Obstet Gynecol. 2016;215:661.
- Disclosure of Potential Conflicts of Interest. American Academy of Dermatology and AAD Association Web site. https://aad.org/Forms/Policies/Uploads/AR/
AR%20Disclosure%20of%20Potential%20Conflicts%
20of%20Interest-2.pdf. Accessed October 21, 2019. - Hockenberry JM, Weigel P, Auerbach A, et al. Financial payments by orthopedic device makers to orthopedic surgeons. Arch Intern Med. 2011;171:1759-1765.
- Yee C, Greenberg PB, Margo CE, et al. Financial disclosures in academic publications and the Sunshine Act: a concordance dtudy. Br J Med Med Res. 2015;10:1-6.
Interactions between industry and physicians, including dermatologists, are widely prevalent.1-3 Proper reporting of industry relationships is essential for transparency, objectivity, and management of potential biases and conflicts of interest. There has been increasing public scrutiny regarding these interactions.
The Physician Payments Sunshine Act established Open Payments (OP), a publicly available database that collects and displays industry-reported physician-industry interactions.4,5 For the medical community and public, the OP database may be used to assess transparency by comparing the data with physician self-disclosures. There is a paucity of studies in the literature examining the concordance of industry-reported disclosures and physician self-reported data, with even fewer studies utilizing OP as a source of industry disclosures, and none exists for dermatology.6-12 It also is not clear to what extent the OP database captures all possible dermatologist-industry interactions, as the Sunshine Act only mandates reporting by applicable US-based manufacturers and group purchasing organizations that produce or purchase drugs or devices that require a prescription and are reimbursable by a government-run health care program.5 As a result, certain companies, such as cosmeceuticals, may not be represented.
In this study we aimed to evaluate the concordance of dermatologist self-disclosure of industry relationships and those reported on OP. Specifically, we focused on interactions disclosed by presenters at the American Academy of Dermatology (AAD) 73rd Annual Meeting in San Francisco, California (March 20–24, 2015), and those by industry in the 2014 OP database.
Methods
In this retrospective cohort study, we compared publicly available data from the OP database to presenter disclosures found in the publicly available AAD 73rd Annual Meeting program (AADMP). The AAD required speakers to disclose financial relationships with industry within the 12 months preceding the presentation, as outlined in the Accreditation Council for Continuing Medical Education guidelines.13 All AAD presenters who were dermatologists practicing in the United States were included in the analysis, whereas residents, fellows, nonphysicians, nondermatologist physicians, and international dermatologists were excluded.
We examined general, research, and associated research payments to specific dermatologists using the 2014 OP data, which contained industry payments made between January 1 and December 31, 2014. Open Payments defined research payments as direct payment to the physician for different types of research activities and associated research payments as indirect payments made to a research institution or entity where the physician was named the principal investigator.5 We chose the 2014 database because it most closely matched the period of required disclosures defined by the AAD for the 2015 meeting. Our review of the OP data occurred after the June 2016 update and thus included the most accurate and up-to-date financial interactions.
We conducted our analysis in 2 major steps. First, we determined whether each industry interaction reported in the OP database was present in the AADMP, which provided an assessment of interaction-level concordance. Second, we determined whether all the industry interactions for any given dermatologist listed in the OP also were present in AADMP, which provided an assessment of dermatologist-level concordance.
First, to establish interaction-level concordance for each industry interaction, the company name and the type of interaction (eg, consultant, speaker, investigator) listed in the AADMP were compared with the data in OP to verify a match. Each interaction was assigned into one of the categories of concordant disclosure (a match of both the company name and type of interaction details in OP and the AADMP), overdisclosure (the presence of an AADMP interaction not found in OP, such as an additional type of interaction or company), or underdisclosure (a company name or type of interaction found in OP but not reported in the AADMP). For underdisclosure, we further classified into company present or company absent based on whether the dermatologist disclosed any relationship with a particular company in the AADMP. We considered the type of interaction to be matching if they were identical or similar in nature (eg, consulting in OP and advisory board in the AADMP), as the types of interactions are reported differently in OP and the AADMP. Otherwise, if they were not similar enough (eg, education in OP and stockholder in the AADMP), it was classified as underdisclosure. Some types of interactions reported in OP were not available on the AAD disclosure form. For example, food and beverage as well as travel and lodging were types of interactions in OP that did not exist in the AADMP. These 2 types of interactions comprised a large majority of OP payment entries but only accounted for a small percentage of the payment amount. Analysis was performed both including and excluding interactions for food, beverage, travel, and lodging (f/b/t/l) to best account for differences in interaction categories between OP and the AADMP.
Second, each dermatologist was assigned to an overall disclosure category of dermatologist-level concordance based on the status for all his/her interactions. Categories included no disclosure (no industry interactions in OP and the AADMP), concordant (all industry interactions reported in OP and the AADMP match), overdisclosure only (no industry interactions on OP but self-reported interactions present in the AADMP), and discordant (not all OP interactions were disclosed in the AADMP). The discordant category was further divided into with overdisclosure and without overdisclosure, depending on the presence or absence of industry relationships listed in the AADMP but not in OP, respectively.
To ensure uniformity, one individual (A.F.S.) reviewed and collected the data from OP and the AADMP. Information on gender and academic affiliation of study participants was obtained from information listed in the AADMP and Google searches. Data management was performed with Microsoft Excel software (Microsoft Excel 2010, Version 14.0, Microsoft Corporation). The New York University School of Medicine’s (New York, New York) institutional review board exempted this study.
Results
Of the 938 presenters listed in the AADMP, 768 individuals met the inclusion criteria. The most commonly cited type of relationship with industry listed in the AADMP was serving as an investigator, consultant, or advisory board member, comprising 34%, 26%, and 18%, respectively (Table 1). The forms of payment most frequently reported in the AADMP were honoraria and grants/research funding, comprising 49% and 25%, respectively (Table 2).
In 2014, there were a total of 20,761 industry payments totaling $35,627,365 for general, research, and associated research payments in the OP database related to the dermatologists who met inclusion criteria. There were 8678 payments totaling $466,622 for food and beverage and 3238 payments totaling $1,357,770 for travel and lodging. After excluding payments for f/b/t/l, there were 8845 payments totaling $33,802,973, with highest percentages of payment amounts for associated research (67.1%), consulting fees (11.5%), research (7.9%), and speaker fees (7.2%)(Table 3). For presenters with industry payments, the range of disbursements excluding f/b/t/l was $6.52 to $1,933,705, with a mean (standard deviation) of $107,997 ($249,941), a median of $18,247, and an interquartile range of $3422 to $97,375 (data not shown).
In assessing interaction-level concordance, 63% of all payment amounts in OP were classified as concordant disclosures. Regarding the number of OP payments, 27% were concordant disclosures, 34% were underdisclosures due to f/b/t/l payments, and 39% were underdisclosures due to non–f/b/t/l payments. When f/b/t/l payment entries in OP were excluded, the status of concordant disclosure for the amount and number of OP payments increased to 66% ($22,242,638) and 63% (5549), respectively. The percentage of payment entries with concordant disclosure status ranged from 43% to 71% depending on the payment amount. Payment entries at both ends of the spectrum had the lowest concordant disclosure rates, with 43% for payment entries between $0.01 and $100 and 58% for entries greater than $100,000 (Table 4). The concordance status also differed by the type of interactions. None of the OP payments for gift and royalty or license were disclosed in the AADMP, as there were no suitable corresponding categories. The proportion of payments with concordant disclosure for honoraria (45%), education (48%), and associated research (61%) was lower than the proportion of payments with concordant disclosure for research (90%), speaker fees (75%–79%), and consulting fees (74%)(Table 5).
In assessing dermatologist-level concordance including all OP entries, the number of dermatologists with no disclosure, overdisclosure only, concordant disclosure, discordant with overdisclosure, and discordant without overdisclosure statuses were 234 (30%), 70 (9%), 9 (1%), 251 (33%), and 204 (27%), respectively. When f/b/t/l entries were excluded, those figures changed to 347 (45%), 108 (14%), 79 (10%), 157 (20%), and 77 (10%), respectively. The characteristics of these dermatologists and their associated industry interactions by disclosure status are shown in the eTable. Dermatologists in the discordant with overdisclosure group had the highest median number and amount of OP payments, followed by those in the concordant disclosure and discordant without overdisclosure groups. Additionally, discordant with overdisclosure dermatologists also had the highest median and mean number of unique industry interactions not on OP, followed by those in the overdisclosure only and no disclosure groups. Academic and private practice settings did not impact dermatologists’ disclosure status. The percentage of female and male dermatologists in the discordant group was 25% and 36%, respectively.
Dermatologists reported a total of 1756 unique industry relationships in the AADMP that were not found on OP. Of these, 1440 (82%) relationships were from 236 dermatologists who had industry payments on OP. The remaining 316 relationships were from 108 dermatologists who had no payments on OP. Although 114 companies reported payments to dermatologists on OP, dermatologists in the AADMP reported interactions with an additional 430 companies.
Comment
In this study, we demonstrated discordance between dermatologist self-reported financial interactions in the AADMP compared with those reported by industry via OP. After excluding f/b/t/l entries, approximately two-thirds of the total amount and number of payments in OP were disclosed, while 31% of dermatologists had discordant disclosure status.
Prior investigations in other medical fields showed high discrepancy rates between industry-reported and physician-reported relationships ranging from 23% to 62%, with studies utilizing various methodologies.6-9,11,12,14,15 Only a few studies have utilized the OP database.8,12,15 Thompson et al12 compared OP payment data with physician financial disclosure at an annual gynecology scientific meeting and found although 209 of 335 (62%) physicians had interactions listed in the OP database, only 24 (7%) listed at least 1 company in the meeting financial disclosure section. Of these 24 physicians, only 5 (21%) accurately disclosed financial relationships with all of the companies listed in OP. The investigators found 129 (38.5%) physicians and 33.7% of the $1.99 million OP payments had concordant disclosure status. When they excluded physicians who received less than $100, 53% of individuals had concordant disclosure.12 Hannon et al8 reported on inconsistencies between disclosures in the OP database and the American Academy of Orthopedic Surgeons Annual Meeting and found 259 (23%) of 1113 physicians meeting inclusion criteria had financial interactions listed in the OP database that were not reported in the meeting disclosures. Yee et al15 also utilized the OP database and compared it with author disclosures in 3 major ophthalmology journals.Of 670 authors, 367 (54.8%) had complete concordance, with 68 (10.1%) more reporting additional overdisclosures, leading to a discordant with underdisclosure rate of 35.1%. Additionally, $1.46 million (44.6%) of the $3.27 million OP payments had concordant disclosure status.15 Other studies compared individual companies’ online reports of physician payments with physician self-disclosures in annual meeting programs, clinical guidelines, and peer-reviewed publications.6,7,9,11,14
Our study demonstrated variation in disclosure status. Compared with other groups, dermatologists in the discordant with overdisclosure group on average had more interactions with and received higher payments from industry, which is consistent with studies in the orthopedic surgery literature.8,9 Male dermatologists had 11% more discordant disclosures than their female counterparts, which may be influenced by men having more industry interactions than women.3 Although small industry payments possessed the lowest concordant rate in our study, which has been observed,12 payments greater than $100,000 had the second-lowest concordance rate at 58%, which may be skewed by the small sample size. Rates of concordant disclosure differed among types of interactions, such as between research and associated research payments. This particular difference may be attributed to the incorrect listing of dermatologists as principal investigators or reduced awareness of payments, as associated research payments were made to the institution and not the individual.
Reasons for discrepancies between industry-reported and dermatologist-reported disclosures may include reporting time differences, lack of physician awareness of OP, industry reporting inaccuracies, dearth of contextual information associated with individual payment entries, and misunderstandings. Prior research demonstrated that the most common reasons for physician nondisclosure included misunderstanding disclosure requirements, unintentional omission of payment, and a lack of relationship between the industry payment and presentation topic.9,12 These factors likely contributed to the disclosure inconsistencies in our study. Similarly high rates of inconsistencies across different specialties suggest systemic concerns.
We found a substantial number of dermatologist-industry interactions listed in the AADMP that were not captured by OP, with 108 dermatologists (35%) having overdisclosures even when excluding f/b/t/l entries. The number of companies in these overdisclosures approximated 4 times the number of companies on OP. Other studies have also observed physician-industry interactions not displayed on OP.8,12,15 Because the Sunshine Act requires reporting only by certain companies, interactions surrounding products such as over-the-counter merchandise, cosmetics, lasers, novel devices, and new medications are generally not included. Further, OP may not capture nonmonetary industry relationships.
There were several limitations to this study. The most notable limitation was the differences in the categorizations of industry relationships by OP and the AADMP. These differences can overemphasize some types of interactions at the expense of other types, such as f/b/t/l. As such, analyses were repeated after excluding f/b/t/l. Another limitation was the inexact overlap of time frames for OP and the AADMP, which may have led to discrepancies. However, we used the best available data and expect the vast majority of interactions to have occurred by the AAD disclosure deadline. It is possible that the presenters may have had a more updated conflict-of-interest disclosure slide at the time of the meeting presentation. The most important limitation was that we were unable to determine whether discrepancies resulted from underreporting by dermatologists or inaccurate reporting by industry. It was unlikely that OP or the AADMP alone completely represented all dermatologist-industry financial relationships.
Conclusion
With a growing emphasis on physician-industry transparency, we identified rates of differences in dermatology consistent with those in other medical fields when comparing the publicly available OP database with disclosures at national conferences. Although the differences in the categorization and requirements for disclosure between the OP database and the AADMP may account for some of the discordance, dermatologists should be aware of potentially negative public perceptions regarding the transparency and prevalence of physician-industry interactions.
Acknowledgment
The first two authors contributed equally to this research/article
- Campbell EG, Gruen RL, Mountford J, et al. A national survey of physician-industry relationships. N Engl J Med. 2007;356:1742-1750.
- Marshall DC, Jackson ME, Hattangadi-Gluth JA. Disclosure of industry payments to physicians: an epidemiologic analysis of early data from the open payments program. Mayo Clin Proc. 2016;91:84-96.
- Feng H, Wu P, Leger M. Exploring the industry-dermatologist financial relationship: insight from the open payment data. JAMA Dermatol. 2016;152:1307-1313.
- Kirschner NM, Sulmasy LS, Kesselheim AS. Health policy basics: the physician payment Sunshine Act and the open payments program. Ann Intern Med. 2014;161:519-521.
- Search Open Payment. Centers for Medicare & Medicaid Services. https://openpaymentsdata.cms.gov. Accessed October 21, 2019.
- Buerba RA, Fu MC, Grauer JN. Discrepancies in spine surgeon conflict of interest disclosures between a national meeting and physician payment listings on device manufacturer web sites. Spine J. 2013;13:1780-1788.
- Chimonas S, Frosch Z, Rothman DJ. From disclosure to transparency: the use of company payment data. Arch Intern Med. 2011;171:81-86.
- Hannon CP, Chalmers PN, Carpiniello MF, et al. Inconsistencies between physician-reported disclosures at the AAOS annual meeting and industry-reported financial disclosures in the open payments database. J Bone Joint Surg. 2016;98:E90.
- Okike K, Kocher MS, Wei EX, et al. Accuracy of conflict-of-interest disclosures reported by physicians. N Engl J Med. 2009;361:1466-1474.
- Ramm O, Brubaker L. Conflicts-of-interest disclosures at the 2010 AUGS Scientific Meeting. Female Pelvic Med Reconstr Surg. 2012;18:79-81.
- Tanzer D, Smith K, Tanzer M. American Academy of Orthopaedic Surgeons disclosure policy fails to accurately inform its members of potential conflicts of interest. Am J Orthop (Belle Mead NJ). 2015;44:E207-E210.
- Thompson JC, Volpe KA, Bridgewater LK, et al. Sunshine Act: shedding light on inaccurate disclosures at a gynecologic annual meeting. Am J Obstet Gynecol. 2016;215:661.
- Disclosure of Potential Conflicts of Interest. American Academy of Dermatology and AAD Association Web site. https://aad.org/Forms/Policies/Uploads/AR/
AR%20Disclosure%20of%20Potential%20Conflicts%
20of%20Interest-2.pdf. Accessed October 21, 2019. - Hockenberry JM, Weigel P, Auerbach A, et al. Financial payments by orthopedic device makers to orthopedic surgeons. Arch Intern Med. 2011;171:1759-1765.
- Yee C, Greenberg PB, Margo CE, et al. Financial disclosures in academic publications and the Sunshine Act: a concordance dtudy. Br J Med Med Res. 2015;10:1-6.
Practice Points
- There is heightening public attention to conflicts of interest since the start of the government-mandated reporting of physician-industry interactions.
- When compared with an industry-reported physician-interaction database, approximately two-thirds of dermatologists who presented at a national dermatology conference self-disclosed all interactions.
- This rate of discordance is consistent with other specialties, but it may reflect differences in the database reporting methods.

Clinical Case-Viewing Sessions in Dermatology: The Patient Perspective
To the Editor:
Dermatology clinical case-viewing (CCV) sessions, commonly referred to as Grand Rounds, are of core educational importance in teaching residents, fellows, and medical students. The traditional format includes the viewing of patient cases followed by resident- and faculty-led group discussions. Clinical case-viewing sessions often involve several health professionals simultaneously observing and interacting with a patient. Although these sessions are highly academically enriching, they may be ill-perceived by patients. The objective of this study was to evaluate patients’ perception of CCV sessions.
This study was approved by the Wake Forest School of Medicine (Winston-Salem, North Carolina) institutional review board and was conducted from February 2017 to August 2017. Following informed consent, 18 patients older than 18 years who were present at the Wake Forest Department of Dermatology CCV sessions were recruited. Patients were each assigned to a private clinical examination room, and CCV attendees briefly visited each room to assess the pathologic findings of interest. Patients received written quantitative surveys before and after the CCV sessions assessing their perspectives on the session (Table 1). Quantitative surveys were assessed using a 10-point Likert scale (1=least willing; 10=most willing). Patients also received qualitative surveys following the session (Table 2). Scores on a 10-item Likert scale were evaluated using a 2-tailed t test.
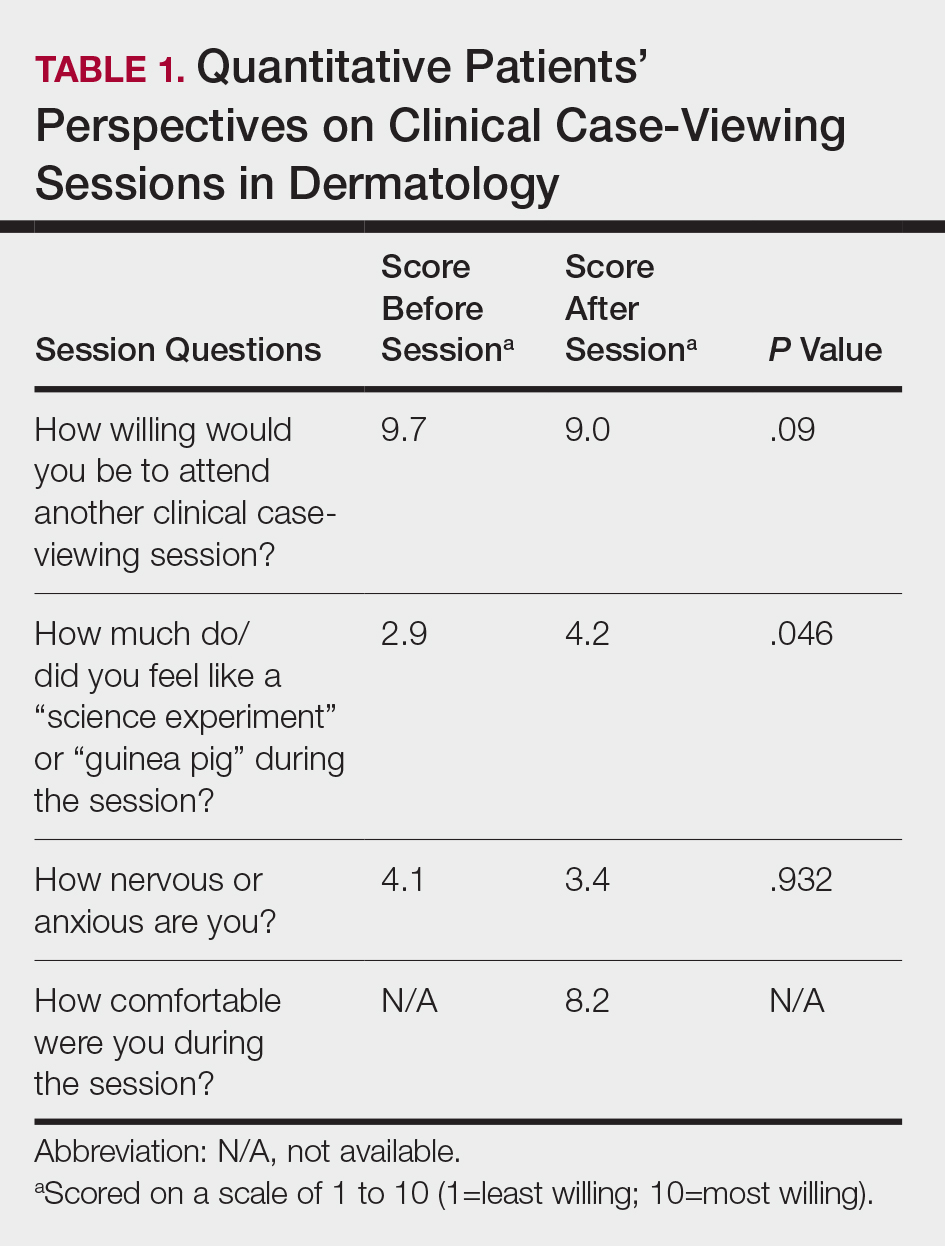
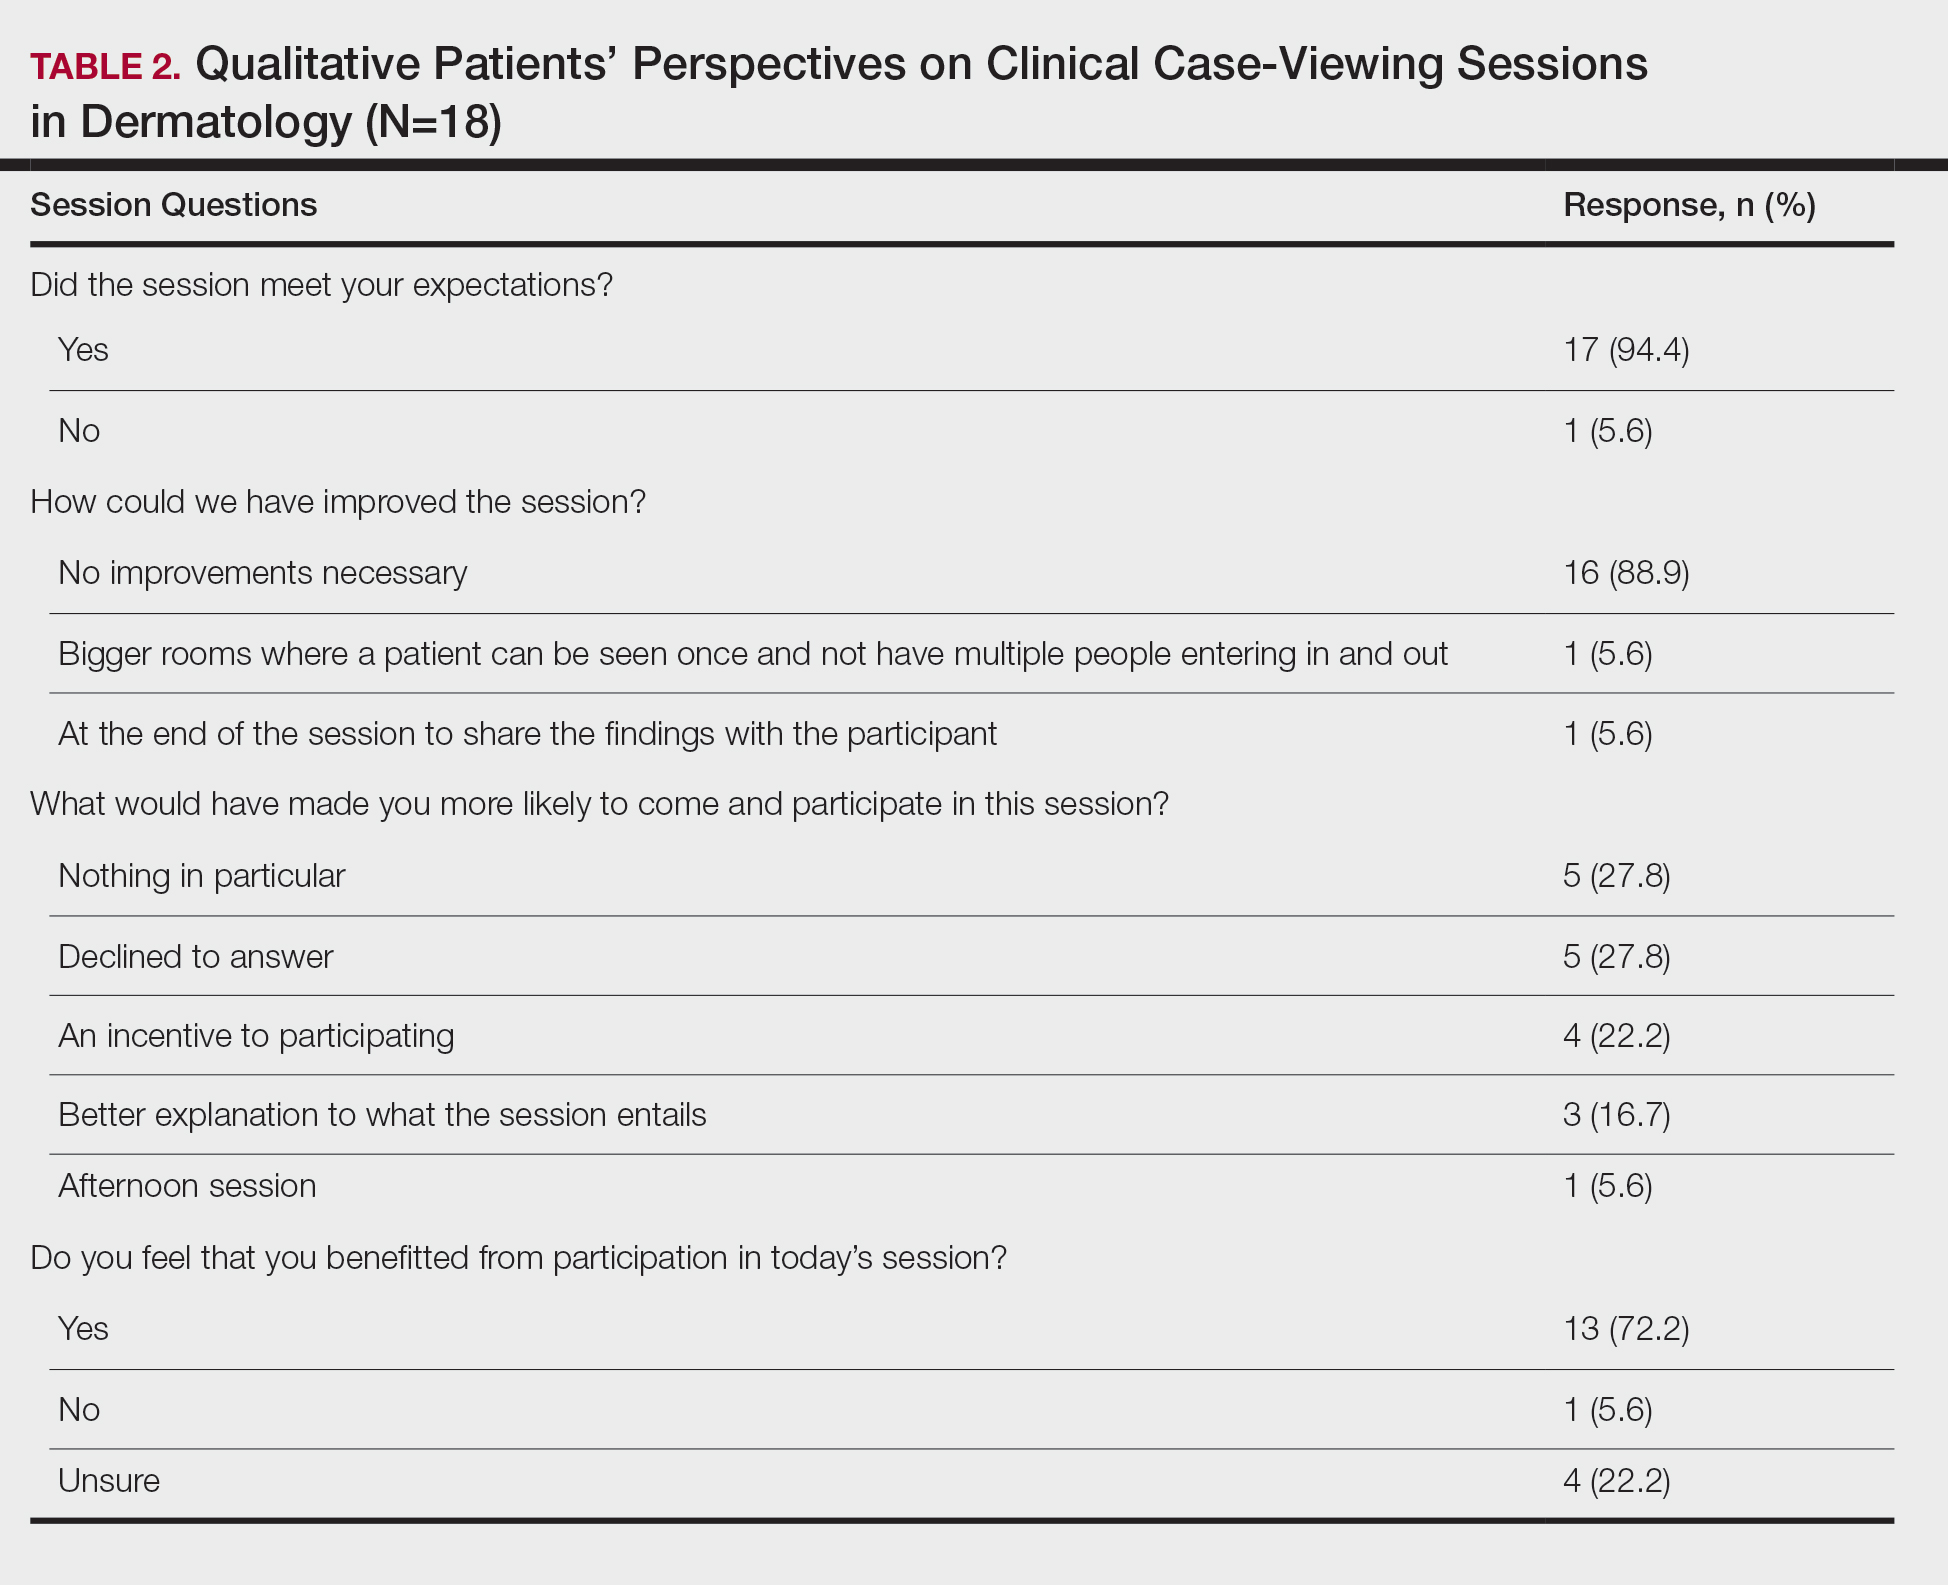
The mean age of patients was 57.6 years, and women comprised 66.7% (12/18). Patient willingness to attend CCV sessions was relatively unchanged before and after the session, with a mean willingness of 9.7 before the session and 9.0 after the session (P=.09). There was a significant difference in the extent to which patients perceived themselves as experimental subjects prior to the session compared to after the session (2.9 vs 4.2)(P=.046). Following the session, 94.4% (17/18) of patients had the impression that the session met their expectations, and 72.2% (13/18) of patients felt they directly benefitted from the session.
Clinical case-viewing sessions are the foundation of any dermatology residency program1-3; however, characterizing the sessions’ psychosocial implications on patients is important too. Although some patients did feel part of a “science experiment,” this finding may be of less importance, as patients generally considered the sessions to be a positive experience and were willing to take part again.
Limitations of the study were typical of survey-based research. All participants were patients at a single center, which may limit the generalization of the results, in addition to the small sample size. Clinical case-viewing sessions also are conducted slightly differently between dermatology programs, which may further limit the generalization of the results. Future studies may aim to assess varying CCV formats to optimize both medical education as well as patient satisfaction.
- Mehrabi D, Cruz PD Jr. Educational conferences in dermatology residency programs. J Am Acad Dermatol. 2006;55:523-524.
- Hull AL, Cullen RJ, Hekelman FP. A retrospective analysis of grand rounds in continuing medical education. J Contin Educ Health Prof. 1989;9:257-266.
- Cruz PD Jr, Chaker MB. Teaching conferences in dermatology residency programs revisited. J Am Acad of Dermatol. 1995;32:675-677.
To the Editor:
Dermatology clinical case-viewing (CCV) sessions, commonly referred to as Grand Rounds, are of core educational importance in teaching residents, fellows, and medical students. The traditional format includes the viewing of patient cases followed by resident- and faculty-led group discussions. Clinical case-viewing sessions often involve several health professionals simultaneously observing and interacting with a patient. Although these sessions are highly academically enriching, they may be ill-perceived by patients. The objective of this study was to evaluate patients’ perception of CCV sessions.
This study was approved by the Wake Forest School of Medicine (Winston-Salem, North Carolina) institutional review board and was conducted from February 2017 to August 2017. Following informed consent, 18 patients older than 18 years who were present at the Wake Forest Department of Dermatology CCV sessions were recruited. Patients were each assigned to a private clinical examination room, and CCV attendees briefly visited each room to assess the pathologic findings of interest. Patients received written quantitative surveys before and after the CCV sessions assessing their perspectives on the session (Table 1). Quantitative surveys were assessed using a 10-point Likert scale (1=least willing; 10=most willing). Patients also received qualitative surveys following the session (Table 2). Scores on a 10-item Likert scale were evaluated using a 2-tailed t test.
The mean age of patients was 57.6 years, and women comprised 66.7% (12/18). Patient willingness to attend CCV sessions was relatively unchanged before and after the session, with a mean willingness of 9.7 before the session and 9.0 after the session (P=.09). There was a significant difference in the extent to which patients perceived themselves as experimental subjects prior to the session compared to after the session (2.9 vs 4.2)(P=.046). Following the session, 94.4% (17/18) of patients had the impression that the session met their expectations, and 72.2% (13/18) of patients felt they directly benefitted from the session.
Clinical case-viewing sessions are the foundation of any dermatology residency program1-3; however, characterizing the sessions’ psychosocial implications on patients is important too. Although some patients did feel part of a “science experiment,” this finding may be of less importance, as patients generally considered the sessions to be a positive experience and were willing to take part again.
Limitations of the study were typical of survey-based research. All participants were patients at a single center, which may limit the generalization of the results, in addition to the small sample size. Clinical case-viewing sessions also are conducted slightly differently between dermatology programs, which may further limit the generalization of the results. Future studies may aim to assess varying CCV formats to optimize both medical education as well as patient satisfaction.
- Mehrabi D, Cruz PD Jr. Educational conferences in dermatology residency programs. J Am Acad Dermatol. 2006;55:523-524.
- Hull AL, Cullen RJ, Hekelman FP. A retrospective analysis of grand rounds in continuing medical education. J Contin Educ Health Prof. 1989;9:257-266.
- Cruz PD Jr, Chaker MB. Teaching conferences in dermatology residency programs revisited. J Am Acad of Dermatol. 1995;32:675-677.
Practice Points
- Patient willingness to attend dermatology clinical case-viewing (CCV) sessions is relatively unchanged before and after the session.
- Participants generally consider CCV sessions to be a positive experience.