User login
Theory of Planned Behavior Provides A Theoretical Explanation For Enhanced Behavior Change With Genetic-Based Lifestyle Interventions
Study Overview
Objective. To determine the impact of providing genetically tailored and population-based lifestyle advice for weight management on key constructs of the Theory of Planned Behavior (TPB), a widely accepted theory used to help predict human lifestyle-related behaviors.
Design. Pragmatic, cluster, randomized controlled trial.
Settings and participants. This study took place at the East Elgin Family Health Team, a primary care clinic in Aylmer, Ontario, Canada. Recruitment occurred between April 2017 and September 2018, with staggered intervention cohorts occurring from May 2017 to September 2019. Participants enrolled in a weight management program at the clinic were invited to participate in the study if they met the following inclusion criteria: body mass index (BMI) ≥25 kg/m2, >18 years of age, English-speaking, willing to undergo genetic testing, having access to a computer with internet at least 1 day per week, and not seeing another health care provider for weight loss advice outside of the study. Exclusion criteria included pregnancy and lactation. All participants provided written informed consent.
Interventions. At baseline, weight management program cohorts (average cohort size was 14 participants) were randomized (1:1) to receive either the standard population-based intervention (Group Lifestyle Balance, or GLB) or a modified GLB intervention, which included the provision of lifestyle genomics (LGx) information and advice (GLB+LGx). Both interventions aimed to assist participants with weight management and healthy lifestyle change, with particular focus on nutrition and physical activity (PA). Interventions were 12 months long, consisting of 23 group-based sessions and 3 one-on-one sessions with a registered dietitian after 3, 6, and 12 months (all sessions were face-to-face). To improve intervention adherence, participants were given reminder calls for their one-on-one appointments and for the start of their program. A sample size was calculated based on the primary outcome indicating that a total of 74 participants were needed (n = 37 per group) for this trial. By September 2019, this sample size was exceeded with 10 randomized groups (n = 140).
The 5 randomized standard GLB groups followed the established GLB program curriculum comprising population-based information and advice while focusing on following a calorie-controlled, moderate-fat (25% of calories) nutrition plan with at least 150 minutes of weekly moderate-intensity PA. Participants were also provided with a 1-page summary report of their nutrition and PA guidelines at the first group meeting outlining population-based targets, including acceptable macronutrient distribution ranges for protein, total fat, saturated fat, monounsaturated fat, polyunsaturated fat, sodium, calories, snacking, and PA.
The 5 randomized modified GLB+LGx groups followed a modified GLB program curriculum in which participants were given genetic-based information and advice, which differed from the advice given to the standard GLB group, while focusing on following a calorie-controlled nutrition plan. The nutrition and PA targets were personalized based on their individual genetic variation. For example, participants with the AA variant of FTO (rs9939609) were advised to engage in at least 30 to 60 minutes of PA daily 6 days per week, with muscle-strengthening activities at least 2 days per week, rather than receiving the standard population-based advice to aim for 150 minutes weekly of PA with at least 2 days per week of muscle-strengthening activity. Participants were also provided with a 1-page summary report of their nutrition and PA guidelines at the first group meeting, which outlined genetic-based information and advice related to protein, total fat, saturated fat, monounsaturated fat, polyunsaturated fat, sodium, calories, snacking, and PA.
Measures and analysis. Change in the TPB components (attitudes, subjective norms and perceived behavioral control) were measured via a TPB questionnaire at 5 time points: baseline (2-week run-in period), immediately after the first group session (where participants received a summary report of either population-based or genetic-based recommendations depending on group assignment), and after 3-, 6- and 12-month follow-ups. Attitudes, subjective norms, and perceived behavioral control were measured on a Likert scale from 1 through 7. Self-reported measures of actual behavioral control (including annual household income, perceptions about events arising in one’s day-to-day life that suddenly take up one’s free time, perceptions about the frequency of feeling ill or tired, and highest achieved level of education) were collected via survey questions and assessed on a Likert scale of 1 through 7. Stage of change was also measured, based on the Transtheoretical Model, using a Likert scale of 1 through 6.
Linear mixed models were used to conduct within- and between-group analyses using SPSS version 26.0, while controlling for measures of actual behavioral control. All analyses were intention-to-treat by originally assigned groups, with mean value imputation conducted for missing data. A Bonferroni correction for multiple testing was used. For all statistical analyses, the level of significance was set at P < 0.05 and trending towards significance at P = 0.05–0.06.
Main results. Participants consisted of primarily middle-age, middle-income, Caucasian females. Baseline attitudes towards the effectiveness of nutrition and PA for weight management were generally positive, and participants perceived that undergoing genetic testing would assist with weight management. Participants had overall neutral subjective norms related to friends and family consuming a healthy diet and engaging in PA, but perceived that their friends, family, and health care team (HCT) believed it was important for them to achieve their nutrition and PA recommendations. Participants overall also perceived that their HCT believed genetic testing could assist with weight management. Baseline measures of perceived behavioral control were overall neutral, with baseline stage of change between “motivation” and “action” (short-term; <3 months).
In within-group analyses, significant improvements (P < 0.05) in attitudes towards the effectiveness of nutrition and PA recommendations for weight management, subjective norms related to both friends and family consuming a healthy diet, and perceived behavioral control in changing PA/dietary intake and managing weight tended to be short-term in the GLB group and long-term for the GLB+LGx group. In all cases of between-group differences for changes in TPB components, the GLB group exhibited reductions in scores, whereas the GLB+LGx group exhibited increases or improvements. Between-group differences (short-term and long-term) in several measures of subjective norms were observed. For example, after 3 months, significant between-group differences were observed in changes in perception that friends believed LGx would help with weight management (P = 0.024). After 12 months, between-group differences trending towards significance were also observed in changes in perception that family members believed genetic testing would help with weight management (P = 0.05). Significant between-group differences and differences trending towards significance were also observed at 12 months for changes in perception that family believed it was important for the participant to achieve the PA recommendations (P = 0.049) and nutrition recommendations (P = 0.05). Between-group differences trending towards significance were also observed at 3 months in attitudes towards the effectiveness of LGx for weight management (P = 0.06). There were no significant between-group differences observed in changes in perceived behavioral control.
Conclusion. Results from this study support the hypothesis that the TPB can help provide a theoretical explanation for why genetically tailored lifestyle information and advice can lead to improvements in lifestyle behavior change.
Commentary
Because health behaviors are critical in areas such as prevention, treatment, and rehabilitation, it is important to describe and understand what drives these behaviors.1 Theories are important tools in this effort as they aim to explain and predict health behavior and are used in the design and evaluation of interventions.1 The TPB is one of the most widely accepted behavior change theories and posits that attitudes, subjective norms (or social pressures and behaviors), and perceived behavioral control are significant predictors of an individual’s intention to engage in behaviors.2 TPB has been highlighted in the literature as a validated theory for predicting nutrition and PA intentions and resulting behaviors.3,4
Motivating lifestyle behavior change in clinical practice can be challenging, but some studies have demonstrated how providing genetic information and advice (or lifestyle genomics) can help motivate changes in nutrition and PA among patients.5-7 Because this has yet to be explained using the TPB, this study is an important contribution to the literature as it aimed to determine the impact of providing genetically tailored and population-based lifestyle advice for weight management on key constructs of the TPB. Briefly, results from within-group analyses in this study demonstrated that the provision of genetically tailored lifestyle information and advice (via the GLB+LGx intervention) tended to impact antecedents of behavior change, more so over the long-term, while population-based advice (via the standard GLB intervention) tended to impact antecedents of behavior change over the short-term (eg, attitudes towards dietary fat intake, perceptions that friends and family consume a healthy diet, and perceptions about the impact of genetic-based advice for weight management). In addition, between-group differences in subjective norms observed at 12 months suggested that social pressures and norms may be influencing long-term changes in lifestyle habits.
While key strengths of this study include its pragmatic cluster randomized controlled trial design, 12-month intervention duration, and intent-to-treat analyses, there are some study limitations, which are acknowledged by the authors. Generalizability is limited to the demographic characteristics of the study population (ie, middle-aged, middle-income, Caucasian females enrolled in a lifestyle change weight management program). Thus, replication of the study is needed in more diverse study populations and with health-related outcomes beyond weight management. In addition, as the authors indicate, future research should ensure the inclusion of theory-based questionnaires in genetic-based intervention studies assessing lifestyle behavior change to elucidate theory-based mechanisms of change.
Applications for Clinical Practice
Population-based research has consistently indicated that nutrition interventions typically impact short-term dietary changes. Confronting the challenge of long-term adherence to nutrition and PA recommendations requires an understanding of factors impacting long-term motivation and behavior change. With increased attention on and research into genetically tailored lifestyle advice (or lifestyle genomics), it is important for clinical practitioners to be familiar with the evidence supporting these approaches. In addition, this research highlights the need to consider individual factors (attitudes, subjective norms, and perceived behavioral control) that may predict successful change in lifestyle habits when providing nutrition and PA recommendations, whether population-based or genetically tailored.
—Katrina F. Mateo, PhD, MPH
1. Lippke S, Ziegelmann JP. Theory-based health behavior change: Developing, testing, and applying theories for evidence-based interventions. Appl Psychol. 2008;57:698-716.
2. Ajzen I. The Theory of planned behaviour: reactions and reflections. Psychol Health. 2011;26:1113-1127.
3. McDermott MS, Oliver M, Simnadis T, et al. The Theory of Planned Behaviour and dietary patterns: A systematic review and meta-analysis. Prev Med (Baltim). 2015;81:150-156.
4. McEachan RRC, Conner M, Taylor NJ, Lawton RJ. Prospective prediction of health-related behaviours with the theory of planned behaviour: A meta-analysis. Health Psychol Rev. 2011;5:97-144.
5. Hietaranta-Luoma H-L, Tahvonen R, Iso-Touru T, et al A. An intervention study of individual, APOE genotype-based dietary and physical-activity advice: impact on health behavior. J Nutrigenet Nutrigenomics. 2014;7:161-174.
6. Nielsen DE, El-Sohemy A. Disclosure of genetic information and change in dietary intake: a randomized controlled trial. DeAngelis MM, ed. PLoS One. 2014;9(11):e112665.
7. Egglestone C, Morris A, O’Brien A. Effect of direct‐to‐consumer genetic tests on health behaviour and anxiety: a survey of consumers and potential consumers. J Genet Couns. 2013;22:565-575.
Study Overview
Objective. To determine the impact of providing genetically tailored and population-based lifestyle advice for weight management on key constructs of the Theory of Planned Behavior (TPB), a widely accepted theory used to help predict human lifestyle-related behaviors.
Design. Pragmatic, cluster, randomized controlled trial.
Settings and participants. This study took place at the East Elgin Family Health Team, a primary care clinic in Aylmer, Ontario, Canada. Recruitment occurred between April 2017 and September 2018, with staggered intervention cohorts occurring from May 2017 to September 2019. Participants enrolled in a weight management program at the clinic were invited to participate in the study if they met the following inclusion criteria: body mass index (BMI) ≥25 kg/m2, >18 years of age, English-speaking, willing to undergo genetic testing, having access to a computer with internet at least 1 day per week, and not seeing another health care provider for weight loss advice outside of the study. Exclusion criteria included pregnancy and lactation. All participants provided written informed consent.
Interventions. At baseline, weight management program cohorts (average cohort size was 14 participants) were randomized (1:1) to receive either the standard population-based intervention (Group Lifestyle Balance, or GLB) or a modified GLB intervention, which included the provision of lifestyle genomics (LGx) information and advice (GLB+LGx). Both interventions aimed to assist participants with weight management and healthy lifestyle change, with particular focus on nutrition and physical activity (PA). Interventions were 12 months long, consisting of 23 group-based sessions and 3 one-on-one sessions with a registered dietitian after 3, 6, and 12 months (all sessions were face-to-face). To improve intervention adherence, participants were given reminder calls for their one-on-one appointments and for the start of their program. A sample size was calculated based on the primary outcome indicating that a total of 74 participants were needed (n = 37 per group) for this trial. By September 2019, this sample size was exceeded with 10 randomized groups (n = 140).
The 5 randomized standard GLB groups followed the established GLB program curriculum comprising population-based information and advice while focusing on following a calorie-controlled, moderate-fat (25% of calories) nutrition plan with at least 150 minutes of weekly moderate-intensity PA. Participants were also provided with a 1-page summary report of their nutrition and PA guidelines at the first group meeting outlining population-based targets, including acceptable macronutrient distribution ranges for protein, total fat, saturated fat, monounsaturated fat, polyunsaturated fat, sodium, calories, snacking, and PA.
The 5 randomized modified GLB+LGx groups followed a modified GLB program curriculum in which participants were given genetic-based information and advice, which differed from the advice given to the standard GLB group, while focusing on following a calorie-controlled nutrition plan. The nutrition and PA targets were personalized based on their individual genetic variation. For example, participants with the AA variant of FTO (rs9939609) were advised to engage in at least 30 to 60 minutes of PA daily 6 days per week, with muscle-strengthening activities at least 2 days per week, rather than receiving the standard population-based advice to aim for 150 minutes weekly of PA with at least 2 days per week of muscle-strengthening activity. Participants were also provided with a 1-page summary report of their nutrition and PA guidelines at the first group meeting, which outlined genetic-based information and advice related to protein, total fat, saturated fat, monounsaturated fat, polyunsaturated fat, sodium, calories, snacking, and PA.
Measures and analysis. Change in the TPB components (attitudes, subjective norms and perceived behavioral control) were measured via a TPB questionnaire at 5 time points: baseline (2-week run-in period), immediately after the first group session (where participants received a summary report of either population-based or genetic-based recommendations depending on group assignment), and after 3-, 6- and 12-month follow-ups. Attitudes, subjective norms, and perceived behavioral control were measured on a Likert scale from 1 through 7. Self-reported measures of actual behavioral control (including annual household income, perceptions about events arising in one’s day-to-day life that suddenly take up one’s free time, perceptions about the frequency of feeling ill or tired, and highest achieved level of education) were collected via survey questions and assessed on a Likert scale of 1 through 7. Stage of change was also measured, based on the Transtheoretical Model, using a Likert scale of 1 through 6.
Linear mixed models were used to conduct within- and between-group analyses using SPSS version 26.0, while controlling for measures of actual behavioral control. All analyses were intention-to-treat by originally assigned groups, with mean value imputation conducted for missing data. A Bonferroni correction for multiple testing was used. For all statistical analyses, the level of significance was set at P < 0.05 and trending towards significance at P = 0.05–0.06.
Main results. Participants consisted of primarily middle-age, middle-income, Caucasian females. Baseline attitudes towards the effectiveness of nutrition and PA for weight management were generally positive, and participants perceived that undergoing genetic testing would assist with weight management. Participants had overall neutral subjective norms related to friends and family consuming a healthy diet and engaging in PA, but perceived that their friends, family, and health care team (HCT) believed it was important for them to achieve their nutrition and PA recommendations. Participants overall also perceived that their HCT believed genetic testing could assist with weight management. Baseline measures of perceived behavioral control were overall neutral, with baseline stage of change between “motivation” and “action” (short-term; <3 months).
In within-group analyses, significant improvements (P < 0.05) in attitudes towards the effectiveness of nutrition and PA recommendations for weight management, subjective norms related to both friends and family consuming a healthy diet, and perceived behavioral control in changing PA/dietary intake and managing weight tended to be short-term in the GLB group and long-term for the GLB+LGx group. In all cases of between-group differences for changes in TPB components, the GLB group exhibited reductions in scores, whereas the GLB+LGx group exhibited increases or improvements. Between-group differences (short-term and long-term) in several measures of subjective norms were observed. For example, after 3 months, significant between-group differences were observed in changes in perception that friends believed LGx would help with weight management (P = 0.024). After 12 months, between-group differences trending towards significance were also observed in changes in perception that family members believed genetic testing would help with weight management (P = 0.05). Significant between-group differences and differences trending towards significance were also observed at 12 months for changes in perception that family believed it was important for the participant to achieve the PA recommendations (P = 0.049) and nutrition recommendations (P = 0.05). Between-group differences trending towards significance were also observed at 3 months in attitudes towards the effectiveness of LGx for weight management (P = 0.06). There were no significant between-group differences observed in changes in perceived behavioral control.
Conclusion. Results from this study support the hypothesis that the TPB can help provide a theoretical explanation for why genetically tailored lifestyle information and advice can lead to improvements in lifestyle behavior change.
Commentary
Because health behaviors are critical in areas such as prevention, treatment, and rehabilitation, it is important to describe and understand what drives these behaviors.1 Theories are important tools in this effort as they aim to explain and predict health behavior and are used in the design and evaluation of interventions.1 The TPB is one of the most widely accepted behavior change theories and posits that attitudes, subjective norms (or social pressures and behaviors), and perceived behavioral control are significant predictors of an individual’s intention to engage in behaviors.2 TPB has been highlighted in the literature as a validated theory for predicting nutrition and PA intentions and resulting behaviors.3,4
Motivating lifestyle behavior change in clinical practice can be challenging, but some studies have demonstrated how providing genetic information and advice (or lifestyle genomics) can help motivate changes in nutrition and PA among patients.5-7 Because this has yet to be explained using the TPB, this study is an important contribution to the literature as it aimed to determine the impact of providing genetically tailored and population-based lifestyle advice for weight management on key constructs of the TPB. Briefly, results from within-group analyses in this study demonstrated that the provision of genetically tailored lifestyle information and advice (via the GLB+LGx intervention) tended to impact antecedents of behavior change, more so over the long-term, while population-based advice (via the standard GLB intervention) tended to impact antecedents of behavior change over the short-term (eg, attitudes towards dietary fat intake, perceptions that friends and family consume a healthy diet, and perceptions about the impact of genetic-based advice for weight management). In addition, between-group differences in subjective norms observed at 12 months suggested that social pressures and norms may be influencing long-term changes in lifestyle habits.
While key strengths of this study include its pragmatic cluster randomized controlled trial design, 12-month intervention duration, and intent-to-treat analyses, there are some study limitations, which are acknowledged by the authors. Generalizability is limited to the demographic characteristics of the study population (ie, middle-aged, middle-income, Caucasian females enrolled in a lifestyle change weight management program). Thus, replication of the study is needed in more diverse study populations and with health-related outcomes beyond weight management. In addition, as the authors indicate, future research should ensure the inclusion of theory-based questionnaires in genetic-based intervention studies assessing lifestyle behavior change to elucidate theory-based mechanisms of change.
Applications for Clinical Practice
Population-based research has consistently indicated that nutrition interventions typically impact short-term dietary changes. Confronting the challenge of long-term adherence to nutrition and PA recommendations requires an understanding of factors impacting long-term motivation and behavior change. With increased attention on and research into genetically tailored lifestyle advice (or lifestyle genomics), it is important for clinical practitioners to be familiar with the evidence supporting these approaches. In addition, this research highlights the need to consider individual factors (attitudes, subjective norms, and perceived behavioral control) that may predict successful change in lifestyle habits when providing nutrition and PA recommendations, whether population-based or genetically tailored.
—Katrina F. Mateo, PhD, MPH
1. Lippke S, Ziegelmann JP. Theory-based health behavior change: Developing, testing, and applying theories for evidence-based interventions. Appl Psychol. 2008;57:698-716.
2. Ajzen I. The Theory of planned behaviour: reactions and reflections. Psychol Health. 2011;26:1113-1127.
3. McDermott MS, Oliver M, Simnadis T, et al. The Theory of Planned Behaviour and dietary patterns: A systematic review and meta-analysis. Prev Med (Baltim). 2015;81:150-156.
4. McEachan RRC, Conner M, Taylor NJ, Lawton RJ. Prospective prediction of health-related behaviours with the theory of planned behaviour: A meta-analysis. Health Psychol Rev. 2011;5:97-144.
5. Hietaranta-Luoma H-L, Tahvonen R, Iso-Touru T, et al A. An intervention study of individual, APOE genotype-based dietary and physical-activity advice: impact on health behavior. J Nutrigenet Nutrigenomics. 2014;7:161-174.
6. Nielsen DE, El-Sohemy A. Disclosure of genetic information and change in dietary intake: a randomized controlled trial. DeAngelis MM, ed. PLoS One. 2014;9(11):e112665.
7. Egglestone C, Morris A, O’Brien A. Effect of direct‐to‐consumer genetic tests on health behaviour and anxiety: a survey of consumers and potential consumers. J Genet Couns. 2013;22:565-575.
Full-dose anticoagulation reduces need for life support in COVID-19
Full-dose anticoagulation was superior to low, prophylactic doses in reducing the need for vital organ support such as ventilation in moderately ill patients hospitalized for COVID-19, according to a report released Jan. 22 by the National Institutes of Health (NIH).
“This is a major advance for patients hospitalized with COVID. Full dose of anticoagulation in these non-ICU patients improved outcomes and there’s a trend toward a reduction in mortality,” Judith Hochman, MD, director of the Cardiovascular Clinical Research Center at NYU Langone Medical Center, New York, said in an interview.
“We have treatments that are improving outcomes but not as many that reduce mortality, so we’re hopeful when the full dataset comes in that will be confirmed,” she said.
The observation of increased rates of blood clots and inflammation among COVID-19 patients, which can lead to complications such as lung failure, heart attack, and stroke, has given rise to various anticoagulant treatment protocols and a need for randomized data on routinely administering increased doses of anticoagulation to hospitalized patients.
Today’s top-line findings come from three linked clinical trials – REMAP-CAP, ACTIV-4, and ATTACC – examining the safety and efficacy of full-dose anticoagulation to treat moderately ill or critically ill adults hospitalized with COVID-19 compared with a lower dose typically used to prevent blood clots in hospitalized patients.
In December 2020, all three trials paused enrollment of the critically ill subgroup after results showed that full-dose anticoagulation started in the intensive care unit (ICU) was not beneficial and may have been harmful in some patients.
Moderately ill patients with COVID-19, defined as those who did not require ICU care or organ support, made up 80% of participants at enrollment in the three trials, Dr. Hochman said.
Among more than 1,000 moderately ill patients reviewed as of the data cut with the data safety monitoring board, full doses of low molecular weight or unfractionated heparin were superior to low prophylactic doses for the primary endpoint of need for ventilation or other organ supportive interventions at 21 days after randomization.
This met the predefined threshold for 99% probability of superiority and recruitment was stopped, Dr. Hochman reported. “Obviously safety figured into this decision. The risk/benefit ratio was very clear.”
The results do not pertain to patients with a previous indication for anticoagulation, who were excluded from the trials.
Data from an additional 1,000 patients will be reviewed and the data published sometime in the next 2-3 months, she said.
With large numbers of COVID-19 patients requiring hospitalization, the outcomes could help reduce the overload on intensive care units around the world, the NIH noted.
The results also highlight the critical role of timing in the course of COVID-19.
“We believe that full anticoagulation is effective early in the disease course,” Dr. Hochman said. “Based on the results so far from these three platform trials, those that were very, very sick at the time of enrollment really didn’t benefit and we needed to have caught them at an earlier stage.
“It’s possible that the people in the ICU are just different and the minute they get sick they need the ICU; so we haven’t clearly demonstrated this time course and when to intervene, but that’s the implication of the findings.”
The question of even earlier treatment is being examined in the partner ACTIV-4B trial, which is enrolling patients with COVID-19 illness not requiring hospitalization and randomizing them to the direct oral anticoagulant apixaban or aspirin or placebo.
“It’s a very important trial and we really want to get the message out that patients should volunteer for it,” said Dr. Hochman, principal investigator of the ACTIV-4 trial.
In the United States, the ACTIV-4 trial is being led by a collaborative effort involving a number of universities, including the University of Pittsburgh and New York University.
The REMAP-CAP, ACTIV-4, and ATTACC study platforms span five continents in more than 300 hospitals and are supported by multiple international funding organizations including the National Institutes of Health, Canadian Institutes of Health Research, the National Institute for Health Research (United Kingdom), the National Health and Medical Research Council (Australia), and the PREPARE and RECOVER consortia (European Union).
A version of this article first appeared on Medscape.com.
Timing of Complete Revascularization in Patients With STEMI
Study Overview
Objective. To determine the effect of the timing of nonculprit-lesion percutaneous coronary intervention (PCI) on outcomes in patients with ST-segment elevation myocardial infarction (STEMI).
Design. Planned substudy of an international, multicenter, randomized controlled trial blinded to outcome.
Setting and participants. Among 4041 patients with STEMI who had multivessel coronary disease, randomization to nonculprit PCI versus culprit-only PCI was stratified according to intended timing of nonculprit lesion PCI. A total of 2702 patients with intended timing of nonculprit PCI during the index hospitalization and 1339 patients with intended timing of nonculprit PCI after the index hospitalization within 45 days were included.
Main outcome measures. The first co-primary endpoint was a composite of cardiovascular (CV) death or myocardial infarction (MI).
Main results. In both groups, the composite endpoint of CV death or MI was reduced with complete revascularization compared to the culprit-only strategy (index hospitalization: hazard ratio [HR], 0.77, 95% confidence interval [CI], 0.59-1.00; after hospital discharge: HR, 0.69, 95% CI, 0.49-0.97; interaction, P = 0.62). Landmark analyses demonstrated a HR of 0.86 (95% CI, 0.59-1.24) during the first 45 days and 0.69 (95% CI,0.54-0.89) from 45 days to the end of follow-up for intended nonculprit lesion PCI versus culprit-lesion-only PCI.
Conclusion. Among patients with STEMI and multivessel disease, the benefit of complete revascularization over culprit-lesion-only PCI was consistent, irrespective of the investigator-determined timing of staged nonculprit lesion intervention.
Commentary
Patients presenting with STEMI often have multivessel disease.1 Although the question of whether to revascularize the nonculprit vessel has been controversial, multiple contemporary studies have reported benefit of nonculprit-vessel revascularization compared to the culprit-only strategy.2-5 Compared to these previous medium-sized randomized controlled trials that included ischemia-driven revascularization as a composite endpoint, the COMPETE trial was unique in that it enrolled a large number of patients and reported a benefit in hard outcomes of a composite of CV death or MI.6
As the previous studies point toward the benefit of complete revascularization in patients presenting with STEMI, another important question has been the optimal timing of nonculprit vessel revascularization. Operators have 3 possible options: during the index procedure as primary PCI, as a staged procedure during the index admission, or as a staged procedure as an outpatient following discharge. Timing of nonculprit PCI has been inconsistent in the previous studies. For example, in the PRAMI trial, nonculprit PCI was performed during the index procedure,2 while in the CvPRIT and COMPARE ACUTE trials, the nonculprit PCI was performed during the index procedure or as a staged procedure during the same admission at the operator’s discretion.3,5
In this context, the COMPLETE investigators report their findings of the prespecified substudy regarding the timing of staged nonculprit vessel PCI. In the COMPLETE trial, 4041 patients were stratified by intended timing of nonculprit lesion PCI (2702 patients during index hospitalization, 1339 after discharge), which was predetermined by the operator prior to the randomization. Among the patients with intended staged nonculprit PCI during index hospitalization, the incidence of the first co-primary outcome of CV death or MI was 2.7% per year in patients with complete revascularization, as compared to 3.5% per year in patients with culprit-lesion only PCI (HR, 0.77; 95% CI, 0.59-1.00). Similarly, in patients with intended nonculprit PCI after the index hospitalization, the incidence of the first co-primary outcome of CV death or MI was 2.7% per year in patients randomized to complete revascularization, as compared to 3.9% per year in patients with culprit-lesion-only PCI (HR, 0.69; 95% CI, 0.49-0.97). These findings were similar for the second co-primary outcome of CV death, MI, or ischemia-driven revascularization (3.0% vs 6.6% per year for intended timing of nonculprit PCI during index admission, and 3.1% vs 5.4% per year for intended timing of nonculprit PCI after discharge, both favoring complete revascularization).
The investigators also performed a landmark analysis before and after 45 days of randomization. Within the first 45 days, CV death or MI occurred in 2.5% of the complete revascularization group and 3.0% of the culprit-lesion-only PCI group (HR, 0.86; 95% CI, 0.59-1.24). On the other hand, during the interval from 45 days to the end of the study, CV death or MI occurred in 5.5% in the complete revascularization group and 7.8% in the culprit-lesion-only group (HR, 0.69; 95% CI, 0.54-0.89).
There were a number of strengths of the COMPLETE study, as we have previously described, such as multiple patients enrolled, contemporary therapy with high use of radial access, mandated use of fractional flow reserve for 50% to 69% stenosis lesions, and low cross-over rate.7 In addition, the current substudy is unique and important, as it was the first study to systematically evaluate the timing of the staged PCI. In addition to their finding of consistent benefit between staged procedure before or after discharge, the results from their landmark analysis suggest that the benefit of complete revascularization accumulates over the long term rather than the short term.
The main limitation of the COMPLETE study is that it was not adequately powered to find statistical differences in each subgroup studied. In addition, since all nonculprit PCIs were staged in this study, nonculprit PCI performed during the index procedure cannot be assessed.
Nevertheless, the finding of similar benefit of complete revascularization regardless of the timing of the staged PCI has clinical implication for practicing interventional cardiologists and patients presenting with STEMI. For example, if the patient presents with hemodynamically stable STEMI on a Friday, the patient can potentially be safely discharged over the weekend and return for a staged PCI as an outpatient instead of staying extra days for an inpatient staged PCI. Whether this approach may improve the patient satisfaction and hospital resource utilization will require further study.
Applications for Clinical Practice
In patients presenting with hemodynamically stable STEMI, staged complete revascularization can be performed during the admission or after discharge within 45 days.
—Taishi Hirai, MD
1. Park DW, Clare RM, Schulte PJ, et al. Extent, location, and clinical significance of non-infarct-related coronary artery disease among patients with ST-elevation myocardial infarction. JAMA. 2014;312:2019-2027.
2. Wald DS, Morris JK, Wald NJ, et al. Randomized trial of preventive angioplasty in myocardial infarction. N Engl J Med. 2013;369:1115-1123.
3. Gershlick AH, Khan JN, Kelly DJ, et al. Randomized trial of complete versus lesion-only revascularization in patients undergoing primary percutaneous coronary intervention for STEMI and multivessel disease: the CvLPRIT trial. J Am Coll Cardiol. 2015;65:963-972.
4. Engstrom T, Kelbaek H, Helqvist S, et al. Complete revascularisation versus treatment of the culprit lesion only in patients with ST-segment elevation myocardial infarction and multivessel disease (DANAMI-3-PRIMULTI): an open-label, randomised controlled trial. Lancet. 2015;386(9994):665-671.
5. Smits PC, Abdel-Wahab M, Neumann FJ, et al. Fractional flow reserve-guided multivessel angioplasty in myocardial infarction. N Engl J Med. 2017;376:1234-1244.
6. Mehta SR, Wood DA, Storey RF, et al. Complete revascularization with multivessel pci for myocardial infarction. N Engl J Med. 2019;381:1411-1421.
7. Hirai T, Blair JEA. Nonculprit lesion PCI strategies in patients with STEMI without cardiogenic shock. J Clin Outcomes Management. 2020;27:7-9.
Study Overview
Objective. To determine the effect of the timing of nonculprit-lesion percutaneous coronary intervention (PCI) on outcomes in patients with ST-segment elevation myocardial infarction (STEMI).
Design. Planned substudy of an international, multicenter, randomized controlled trial blinded to outcome.
Setting and participants. Among 4041 patients with STEMI who had multivessel coronary disease, randomization to nonculprit PCI versus culprit-only PCI was stratified according to intended timing of nonculprit lesion PCI. A total of 2702 patients with intended timing of nonculprit PCI during the index hospitalization and 1339 patients with intended timing of nonculprit PCI after the index hospitalization within 45 days were included.
Main outcome measures. The first co-primary endpoint was a composite of cardiovascular (CV) death or myocardial infarction (MI).
Main results. In both groups, the composite endpoint of CV death or MI was reduced with complete revascularization compared to the culprit-only strategy (index hospitalization: hazard ratio [HR], 0.77, 95% confidence interval [CI], 0.59-1.00; after hospital discharge: HR, 0.69, 95% CI, 0.49-0.97; interaction, P = 0.62). Landmark analyses demonstrated a HR of 0.86 (95% CI, 0.59-1.24) during the first 45 days and 0.69 (95% CI,0.54-0.89) from 45 days to the end of follow-up for intended nonculprit lesion PCI versus culprit-lesion-only PCI.
Conclusion. Among patients with STEMI and multivessel disease, the benefit of complete revascularization over culprit-lesion-only PCI was consistent, irrespective of the investigator-determined timing of staged nonculprit lesion intervention.
Commentary
Patients presenting with STEMI often have multivessel disease.1 Although the question of whether to revascularize the nonculprit vessel has been controversial, multiple contemporary studies have reported benefit of nonculprit-vessel revascularization compared to the culprit-only strategy.2-5 Compared to these previous medium-sized randomized controlled trials that included ischemia-driven revascularization as a composite endpoint, the COMPETE trial was unique in that it enrolled a large number of patients and reported a benefit in hard outcomes of a composite of CV death or MI.6
As the previous studies point toward the benefit of complete revascularization in patients presenting with STEMI, another important question has been the optimal timing of nonculprit vessel revascularization. Operators have 3 possible options: during the index procedure as primary PCI, as a staged procedure during the index admission, or as a staged procedure as an outpatient following discharge. Timing of nonculprit PCI has been inconsistent in the previous studies. For example, in the PRAMI trial, nonculprit PCI was performed during the index procedure,2 while in the CvPRIT and COMPARE ACUTE trials, the nonculprit PCI was performed during the index procedure or as a staged procedure during the same admission at the operator’s discretion.3,5
In this context, the COMPLETE investigators report their findings of the prespecified substudy regarding the timing of staged nonculprit vessel PCI. In the COMPLETE trial, 4041 patients were stratified by intended timing of nonculprit lesion PCI (2702 patients during index hospitalization, 1339 after discharge), which was predetermined by the operator prior to the randomization. Among the patients with intended staged nonculprit PCI during index hospitalization, the incidence of the first co-primary outcome of CV death or MI was 2.7% per year in patients with complete revascularization, as compared to 3.5% per year in patients with culprit-lesion only PCI (HR, 0.77; 95% CI, 0.59-1.00). Similarly, in patients with intended nonculprit PCI after the index hospitalization, the incidence of the first co-primary outcome of CV death or MI was 2.7% per year in patients randomized to complete revascularization, as compared to 3.9% per year in patients with culprit-lesion-only PCI (HR, 0.69; 95% CI, 0.49-0.97). These findings were similar for the second co-primary outcome of CV death, MI, or ischemia-driven revascularization (3.0% vs 6.6% per year for intended timing of nonculprit PCI during index admission, and 3.1% vs 5.4% per year for intended timing of nonculprit PCI after discharge, both favoring complete revascularization).
The investigators also performed a landmark analysis before and after 45 days of randomization. Within the first 45 days, CV death or MI occurred in 2.5% of the complete revascularization group and 3.0% of the culprit-lesion-only PCI group (HR, 0.86; 95% CI, 0.59-1.24). On the other hand, during the interval from 45 days to the end of the study, CV death or MI occurred in 5.5% in the complete revascularization group and 7.8% in the culprit-lesion-only group (HR, 0.69; 95% CI, 0.54-0.89).
There were a number of strengths of the COMPLETE study, as we have previously described, such as multiple patients enrolled, contemporary therapy with high use of radial access, mandated use of fractional flow reserve for 50% to 69% stenosis lesions, and low cross-over rate.7 In addition, the current substudy is unique and important, as it was the first study to systematically evaluate the timing of the staged PCI. In addition to their finding of consistent benefit between staged procedure before or after discharge, the results from their landmark analysis suggest that the benefit of complete revascularization accumulates over the long term rather than the short term.
The main limitation of the COMPLETE study is that it was not adequately powered to find statistical differences in each subgroup studied. In addition, since all nonculprit PCIs were staged in this study, nonculprit PCI performed during the index procedure cannot be assessed.
Nevertheless, the finding of similar benefit of complete revascularization regardless of the timing of the staged PCI has clinical implication for practicing interventional cardiologists and patients presenting with STEMI. For example, if the patient presents with hemodynamically stable STEMI on a Friday, the patient can potentially be safely discharged over the weekend and return for a staged PCI as an outpatient instead of staying extra days for an inpatient staged PCI. Whether this approach may improve the patient satisfaction and hospital resource utilization will require further study.
Applications for Clinical Practice
In patients presenting with hemodynamically stable STEMI, staged complete revascularization can be performed during the admission or after discharge within 45 days.
—Taishi Hirai, MD
1. Park DW, Clare RM, Schulte PJ, et al. Extent, location, and clinical significance of non-infarct-related coronary artery disease among patients with ST-elevation myocardial infarction. JAMA. 2014;312:2019-2027.
2. Wald DS, Morris JK, Wald NJ, et al. Randomized trial of preventive angioplasty in myocardial infarction. N Engl J Med. 2013;369:1115-1123.
3. Gershlick AH, Khan JN, Kelly DJ, et al. Randomized trial of complete versus lesion-only revascularization in patients undergoing primary percutaneous coronary intervention for STEMI and multivessel disease: the CvLPRIT trial. J Am Coll Cardiol. 2015;65:963-972.
4. Engstrom T, Kelbaek H, Helqvist S, et al. Complete revascularisation versus treatment of the culprit lesion only in patients with ST-segment elevation myocardial infarction and multivessel disease (DANAMI-3-PRIMULTI): an open-label, randomised controlled trial. Lancet. 2015;386(9994):665-671.
5. Smits PC, Abdel-Wahab M, Neumann FJ, et al. Fractional flow reserve-guided multivessel angioplasty in myocardial infarction. N Engl J Med. 2017;376:1234-1244.
6. Mehta SR, Wood DA, Storey RF, et al. Complete revascularization with multivessel pci for myocardial infarction. N Engl J Med. 2019;381:1411-1421.
7. Hirai T, Blair JEA. Nonculprit lesion PCI strategies in patients with STEMI without cardiogenic shock. J Clin Outcomes Management. 2020;27:7-9.
Severe renal arteriosclerosis may indicate cardiovascular risk in lupus nephritis
Severe renal arteriosclerosis was associated with a ninefold increased risk of atherosclerotic cardiovascular disease in patients with lupus nephritis, based on data from an observational study of 189 individuals.
Atherosclerotic cardiovascular disease (ASCVD) has traditionally been thought to be a late complication of systemic lupus erythematosus (SLE), but this has been challenged in recent population-based studies of patients with SLE and lupus nephritis (LN) that indicated an early and increased risk of ASCVD at the time of diagnosis. However, it is unclear which early risk factors may predispose patients to ASCVD, Shivani Garg, MD, of the University of Wisconsin, Madison, and colleagues wrote in a study published in Arthritis Care & Research.
In patients with IgA nephropathy and renal transplantation, previous studies have shown that severe renal arteriosclerosis (r-ASCL) based on kidney biopsies at the time of diagnosis predicts ASCVD, but “a few studies including LN biopsies failed to report a similar association between the presence of severe r-ASCL and ASCVD occurrence,” possibly because of underreporting of r-ASCL. Dr. Garg and colleagues also noted the problem of underreporting of r-ASCL in their own previous study of its prevalence in LN patients at the time of diagnosis.
To get a more detailed view of how r-ASCL may be linked to early occurrence of ASCVD in LN patients, Dr. Garg and coauthors identified 189 consecutive patients with incident LN who underwent diagnostic biopsies between 1994 and 2017. The median age of the patients was 25 years, 78% were women, and 73% were white. The researchers developed a composite score for r-ASCL severity based on reported and overread biopsies.
Overall, 31% of the patients had any reported r-ASCL, and 7% had moderate-severe r-ASCL. After incorporating systematically reexamined r-ASCL grades, the prevalence of any and moderate-severe r-ASCL increased to 39% and 12%, respectively.
Based on their composite of reported and overread r-ASCL grade, severe r-ASCL in diagnostic LN biopsies was associated with a ninefold increased risk of ASCVD.
The researchers identified 22 incident ASCVD events over an 11-year follow-up for an overall 12% incidence of ASCVD in LN. ASCVD was defined as ischemic heart disease (including myocardial infarction, coronary artery revascularization, abnormal stress test, abnormal angiogram, and events documented by a cardiologist); stroke and transient ischemic attack (TIA); and peripheral vascular disease. Incident ASCVD was defined as the first ASCVD event between 1 and 10 years after LN diagnosis.
The most common ASCVD events were stroke or TIA (12 patients), events related to ischemic heart disease (7 patients), and events related to peripheral vascular disease (3 patients).
Lack of statin use
The researchers also hypothesized that the presence of gaps in statin use among eligible LN patients would be present in their study population. “Among the 20 patients with incident ASCVD events after LN diagnosis in our cohort, none was on statin therapy at the time of LN diagnosis,” the researchers said, noting that current guidelines from the American College of Rheumatology and the European League Against Rheumatism (now known as the European Alliance of Associations for Rheumatology) recommend initiating statin therapy at the time of LN diagnosis in all patients who have hyperlipidemia and chronic kidney disease (CKD) stage ≥3. “Further, 11 patients (55%) met high-risk criteria (hyperlipidemia and CKD stage ≥3) to implement statin therapy at the time of LN diagnosis, yet only one patient (9%) was initiated on statin therapy.” In addition, patients with stage 3 or higher CKD were more likely to develop ASCVD than patients without stage 3 or higher CKD, they said.
The study findings were limited by several factors including the majority white study population, the ability to overread only 25% of the biopsies, and the lack of data on the potential role of chronic lesions in ASCVD, the researchers noted. However, the results were strengthened by the use of a validated LN cohort, and the data provide “the basis to establish severe composite r-ASCL as a predictor of ASCVD events using a larger sample size in different cohorts,” they said.
The study received no outside funding. The researchers had no financial conflicts to disclose.
FROM ARTHRITIS CARE & RESEARCH
20-year-old man • sudden-onset chest pain • worsening pain with cough and exertion • Dx?
THE CASE
A 20-year-old man presented to our clinic with a 3-day history of nonradiating chest pain located at the center of his chest. Past medical history included idiopathic neonatal giant-cell hepatitis and subsequent liver transplant at 1 month of age; he had been followed by the transplant team without rejection or infection and was in otherwise good health prior to the chest pain.
On the day of symptom onset, he was walking inside his house and fell to his knees with a chest pain described as “a punch” to the center of the chest that lasted for a few seconds. He was able to continue his daily activities without limitation despite a constant, squeezing, centrally located chest pain. The pain worsened with cough and exertion.
A few hours later, he went to an urgent care center for evaluation. There, he reported, his chest radiograph and electrocardiogram (EKG) results were normal and he was given a diagnosis of musculoskeletal chest pain. Over the next 3 days, his chest pain persisted but did not worsen. He was taking 500 mg of naproxen every 8 hours with no improvement. No other acute or chronic medications were being taken. He had no significant family history. A review of systems was otherwise negative.
On physical exam, his vital statistics included a height of 6’4”; weight, 261 lb; body mass index, 31.8; temperature, 98.7 °F; blood pressure, 134/77 mm Hg; heart rate, 92 beats/min; respiratory rate, 18 breaths/min; and oxygen saturation, 96%. Throughout the exam, he demonstrated no acute distress, appeared well, and was talkative; however, he reported having a “constant, squeezing” chest pain that did not worsen with palpation of the chest. The rest of his physical exam was unremarkable.
Although he reported that his EKG and chest radiograph were normal 3 days prior, repeat chest radiograph and EKG were ordered due to his unexplained, active chest pain and the lack of immediate access to the prior results.
THE DIAGNOSIS
The chest radiograph (FIGURE 1A) showed a “mildly ectatic ascending thoracic aorta” that had increased since a chest radiograph from 6 years prior (FIGURE 1B) and “was concerning for an aneurysm.” Computed tomography (CT) angiography (FIGURE 2) then confirmed a 7-cm aneurysm of the ascending aorta, with findings suggestive of a retrograde ascending aortic dissection.

DISCUSSION
The average age of a patient with acute aortic dissection (AAD) is 63 years; only 7% occur in people younger than 40.1 AAD is often accompanied by a predisposing risk factor such as a connective tissue disease, bicuspid aortic valve, longstanding hypertension, trauma, or larger aortic dimensions.2,3 Younger patients are more likely to have predisposing risk factors of Marfan syndrome, prior aortic surgery, or a bicuspid aortic valve.3

Continue to: A literature review did not reveal...
A literature review did not reveal any known correlation between the patient’s history of giant-cell hepatitis or antirejection therapy with thoracic aortic dissection. Furthermore, liver transplant is not known to be a specific risk factor for AAD in pediatric patients or outside the immediate postoperative period. Therefore, there were no known predisposing risk factors for AAD in our patient.
The most common clinical feature of AAD is chest pain, which occurs in 75% of patients.1 Other clinical symptoms include hypertension and diaphoresis.2,4 However, classic clinical findings are not always displayed, making the diagnosis difficult.2,4 The classical description of “tearing pain” is seen in only 51% of patients, and 5% to 15% of patients present without any pain.1
Commonly missed or misdiagnosed. The diagnosis of AAD has been missed during the initial exam in 38% of patients.4 As seen in our case, symptoms may be initially diagnosed as musculoskeletal chest pain. Based on symptoms, AAD can be incorrectly diagnosed as an acute myocardial infarction or vascular embolization.2,4
Every hour after symptom onset, the mortality rate of untreated AAD increases 1% to 2%,with no difference based on age.3,4 Different reports have shown mortality rates between 7% and 30%.4
Effective imaging is crucial to the diagnosis and treatment of AAD, given the occurrence of atypical presentation, missed diagnosis, and high mortality rate.4 A chest radiograph will show a widened mediastinum, but the preferred diagnostic tests are a CT or transthoracic echocardiogram.2,4 Once the diagnosis of AAD is confirmed, an aortic angiogram is the preferred test to determine the extent of the dissection prior to surgical treatment.2
Continue to: Classification dictates treatment
Classification dictates treatment. AAD is classified based on where the dissection of the aorta occurs. If the dissection involves the ascending aorta, it is classified as a type A AAD and should immediately be treated with emergent surgery in order to prevent complications including myocardial infarction, cardiac tamponade, and aortic rupture.2,4,5 If the dissection is limited to the descending aorta, it is classified as a type B AAD and can be medically managed by controlling pain and lowering blood pressure; if symptoms persist, surgical management may be required.2 After hospital discharge, AAD patients are followed closely with medical therapy, serial imaging, and reoperation if necessary.4
Our patient underwent emergent surgery for aortic root/ascending aortic replacement with a mechanical valve. He tolerated the procedure well. Surgical tissue pathology of the aortic segment showed a wall of elastic vessel with medial degeneration and dissection, and the tissue pathology of the aorta leaflets showed valvular tissue with myxoid degeneration.
THE TAKEAWAY
It is critical to keep AAD in the differential diagnosis of a patient presenting with acute onset of chest pain, as AAD often has an atypical presentation and can easily be misdiagnosed. Effective imaging is crucial to diagnosis, and immediate treatment is essential to patient survival.
CORRESPONDENCE
Rachel A. Reedy, PA, University of Florida, Department of General Pediatrics, 7046 SW Archer Road, Gainesville, FL 32608; rreedy@ufl.edu
1. Pineault J, Ouimet D, Pichette V, Vallée M. A case of aortic dissection in a young adult: a refresher of the literature of this “great masquerader.” Int J Gen Med. 2011;4:889-893.
2. Agabegi SS, Agabegi ElD, Ring AC. Diseases of the cardiovascular system. In: Jackson A, ed. Step-up to Medicine. 3rd ed. Lippincott Williams & Wilkins; 2012:54-55.
3. Januzzi JL, Isselbacher EM, Fattori R, et al. Characterizing the young patient with aortic dissection: results from the International Registry of Aortic Dissection (IRAD). J Am Coll Cardiol. 2004;43:665-669.
4. Tsai TT, Trimarchi S, Nienaber CA. Acute aortic dissection: perspectives from the International Registry of Acute Aortic Dissection (IRAD). Eur J Vasc Endovasc Surg. 2009;37:149-159.
5. Trimarchi S, Eagle KA, Nienaber CA, et al. Role of age in acute type A aortic dissection outcome: Report from the International Registry of Acute Aortic Dissection (IRAD). J Thorac Cardiovasc Surg. 2010;140:784-789.
THE CASE
A 20-year-old man presented to our clinic with a 3-day history of nonradiating chest pain located at the center of his chest. Past medical history included idiopathic neonatal giant-cell hepatitis and subsequent liver transplant at 1 month of age; he had been followed by the transplant team without rejection or infection and was in otherwise good health prior to the chest pain.
On the day of symptom onset, he was walking inside his house and fell to his knees with a chest pain described as “a punch” to the center of the chest that lasted for a few seconds. He was able to continue his daily activities without limitation despite a constant, squeezing, centrally located chest pain. The pain worsened with cough and exertion.
A few hours later, he went to an urgent care center for evaluation. There, he reported, his chest radiograph and electrocardiogram (EKG) results were normal and he was given a diagnosis of musculoskeletal chest pain. Over the next 3 days, his chest pain persisted but did not worsen. He was taking 500 mg of naproxen every 8 hours with no improvement. No other acute or chronic medications were being taken. He had no significant family history. A review of systems was otherwise negative.
On physical exam, his vital statistics included a height of 6’4”; weight, 261 lb; body mass index, 31.8; temperature, 98.7 °F; blood pressure, 134/77 mm Hg; heart rate, 92 beats/min; respiratory rate, 18 breaths/min; and oxygen saturation, 96%. Throughout the exam, he demonstrated no acute distress, appeared well, and was talkative; however, he reported having a “constant, squeezing” chest pain that did not worsen with palpation of the chest. The rest of his physical exam was unremarkable.
Although he reported that his EKG and chest radiograph were normal 3 days prior, repeat chest radiograph and EKG were ordered due to his unexplained, active chest pain and the lack of immediate access to the prior results.
THE DIAGNOSIS
The chest radiograph (FIGURE 1A) showed a “mildly ectatic ascending thoracic aorta” that had increased since a chest radiograph from 6 years prior (FIGURE 1B) and “was concerning for an aneurysm.” Computed tomography (CT) angiography (FIGURE 2) then confirmed a 7-cm aneurysm of the ascending aorta, with findings suggestive of a retrograde ascending aortic dissection.
DISCUSSION
The average age of a patient with acute aortic dissection (AAD) is 63 years; only 7% occur in people younger than 40.1 AAD is often accompanied by a predisposing risk factor such as a connective tissue disease, bicuspid aortic valve, longstanding hypertension, trauma, or larger aortic dimensions.2,3 Younger patients are more likely to have predisposing risk factors of Marfan syndrome, prior aortic surgery, or a bicuspid aortic valve.3
Continue to: A literature review did not reveal...
A literature review did not reveal any known correlation between the patient’s history of giant-cell hepatitis or antirejection therapy with thoracic aortic dissection. Furthermore, liver transplant is not known to be a specific risk factor for AAD in pediatric patients or outside the immediate postoperative period. Therefore, there were no known predisposing risk factors for AAD in our patient.
The most common clinical feature of AAD is chest pain, which occurs in 75% of patients.1 Other clinical symptoms include hypertension and diaphoresis.2,4 However, classic clinical findings are not always displayed, making the diagnosis difficult.2,4 The classical description of “tearing pain” is seen in only 51% of patients, and 5% to 15% of patients present without any pain.1
Commonly missed or misdiagnosed. The diagnosis of AAD has been missed during the initial exam in 38% of patients.4 As seen in our case, symptoms may be initially diagnosed as musculoskeletal chest pain. Based on symptoms, AAD can be incorrectly diagnosed as an acute myocardial infarction or vascular embolization.2,4
Every hour after symptom onset, the mortality rate of untreated AAD increases 1% to 2%,with no difference based on age.3,4 Different reports have shown mortality rates between 7% and 30%.4
Effective imaging is crucial to the diagnosis and treatment of AAD, given the occurrence of atypical presentation, missed diagnosis, and high mortality rate.4 A chest radiograph will show a widened mediastinum, but the preferred diagnostic tests are a CT or transthoracic echocardiogram.2,4 Once the diagnosis of AAD is confirmed, an aortic angiogram is the preferred test to determine the extent of the dissection prior to surgical treatment.2
Continue to: Classification dictates treatment
Classification dictates treatment. AAD is classified based on where the dissection of the aorta occurs. If the dissection involves the ascending aorta, it is classified as a type A AAD and should immediately be treated with emergent surgery in order to prevent complications including myocardial infarction, cardiac tamponade, and aortic rupture.2,4,5 If the dissection is limited to the descending aorta, it is classified as a type B AAD and can be medically managed by controlling pain and lowering blood pressure; if symptoms persist, surgical management may be required.2 After hospital discharge, AAD patients are followed closely with medical therapy, serial imaging, and reoperation if necessary.4
Our patient underwent emergent surgery for aortic root/ascending aortic replacement with a mechanical valve. He tolerated the procedure well. Surgical tissue pathology of the aortic segment showed a wall of elastic vessel with medial degeneration and dissection, and the tissue pathology of the aorta leaflets showed valvular tissue with myxoid degeneration.
THE TAKEAWAY
It is critical to keep AAD in the differential diagnosis of a patient presenting with acute onset of chest pain, as AAD often has an atypical presentation and can easily be misdiagnosed. Effective imaging is crucial to diagnosis, and immediate treatment is essential to patient survival.
CORRESPONDENCE
Rachel A. Reedy, PA, University of Florida, Department of General Pediatrics, 7046 SW Archer Road, Gainesville, FL 32608; rreedy@ufl.edu
1. Pineault J, Ouimet D, Pichette V, Vallée M. A case of aortic dissection in a young adult: a refresher of the literature of this “great masquerader.” Int J Gen Med. 2011;4:889-893.
2. Agabegi SS, Agabegi ElD, Ring AC. Diseases of the cardiovascular system. In: Jackson A, ed. Step-up to Medicine. 3rd ed. Lippincott Williams & Wilkins; 2012:54-55.
3. Januzzi JL, Isselbacher EM, Fattori R, et al. Characterizing the young patient with aortic dissection: results from the International Registry of Aortic Dissection (IRAD). J Am Coll Cardiol. 2004;43:665-669.
4. Tsai TT, Trimarchi S, Nienaber CA. Acute aortic dissection: perspectives from the International Registry of Acute Aortic Dissection (IRAD). Eur J Vasc Endovasc Surg. 2009;37:149-159.
5. Trimarchi S, Eagle KA, Nienaber CA, et al. Role of age in acute type A aortic dissection outcome: Report from the International Registry of Acute Aortic Dissection (IRAD). J Thorac Cardiovasc Surg. 2010;140:784-789.

Tactics to prevent or slow progression of CKD in patients with diabetes
Chronic kidney disease (CKD) is a significant comorbidity of diabetes mellitus. The Kidney Disease Outcomes Quality Initiative (KDOQI) of the National Kidney Foundation defines CKD as the presence of kidney damage or decreased kidney function for ≥ 3 months. CKD caused by diabetes is called diabetic kidney disease (DKD), which is 1 of 3 principal microvascular complications of diabetes. DKD can progress to end-stage renal disease (ESRD), requiring kidney replacement therapy, and is the leading cause of CKD and ESRD in the United States.1-3 Studies have also shown that, particularly in patients with diabetes, CKD considerably increases the risk of cardiovascular events, which often occur prior to ESRD.1,4
This article provides the latest recommendations for evaluating and managing DKD to help you prevent or slow its progression.
Defining and categorizing diabetic kidney disease
CKD is defined as persistently elevated excretion of urinary albumin (albuminuria) and decreased estimated glomerular filtration rate (eGFR), or as the presence of signs of progressive kidney damage.5,6 DKD, also known as diabetic nephropathy, is CKD attributed to long-term diabetes. A patient’s eGFR is the established basis for assignment to a stage (1, 2, 3a, 3b, 4, or 5) of CKD (TABLE 17) and, along with the category of albuminuria (A1, A2, or A3), can indicate prognosis.

Taking its toll in diabetes
As many as 40% of patients with diabetes develop DKD.8-10 Most studies of DKD have been conducted in patients with type 1 diabetes (T1D), because the time of clinical onset is typically known.
Type 1 diabetes. DKD usually occurs 10 to 15 years, or later, after the onset of diabetes.6 As many as 30% of people with T1D have albuminuria approximately 15 years after onset of diabetes; almost one-half of those develop DKD.5,11 After approximately 22.5 years without albuminuria, patients with T1D have approximately a 1% annual risk of DKD.12
Type 2 diabetes (T2D). DKD is often present at diagnosis, likely due to a delay in diagnosis and briefer clinical exposure, compared to T1D. Albuminuria has been reported in as many as 40% of patients with T2D approximately 10 years after onset of diabetes.12,13
Multiple risk factors with no standout “predictor”
Genetic susceptibility, ethnicity, glycemic control, smoking, blood pressure (BP), and the eGFR have been identified as risk factors for renal involvement in diabetes; obesity, oral contraceptives, and age can also contribute. Although each risk factor increases the risk of DKD, no single factor is adequately predictive. Moderately increased albuminuria, the earliest sign of DKD, is associated with progressive nephropathy.12
Continue to: How great is the risk?
How great is the risk? From disease onset to proteinuria and from proteinuria to ESRD, the risk of DKD in T1D and T2D is similar. With appropriate treatment, albuminuria can regress, and the risk of ESRD can be < 20% at 10 years in T1D.12 As in T1D, good glycemic control might result in regression of albuminuria in T2D.14
For unknown reasons, the degree of albuminuria can exist independent of the progression of DKD. Factors responsible for a progressive decline in eGFR in DKD without albuminuria are unknown.12,15
Patient evaluation with an eye toward comorbidities
A comprehensive initial medical evaluation for DKD includes a review of microvascular complications; visits to specialists; lifestyle and behavior patterns (eg, diet, sleep, substance use, and social support); and medication adherence, adverse drug effects, and alternative medicines. Although DKD is often a clinical diagnosis, it can be ruled in by persistent albuminuria or decreased eGFR, or both, in established diabetes or diabetic retinopathy when other causes are unlikely (see “Recommended DKD screening protocol,” below).
Screening for mental health conditions and barriers to self-management is also key.6
Comorbidities, of course, can complicate disease management in patients with diabetes.16-20 Providers and patients therefore need to be aware of potential diabetic comorbidities. For example, DKD and even moderately increased albuminuria significantly increase the risk of cardiovascular disease (CVD).12 Other possible comorbidities include (but are not limited to) nonalcoholic steatohepatitis, fracture, hearing impairment, cancer (eg, liver, pancreas, endometrium, colon, rectum, breast, and bladder), pancreatitis, hypogonadism, obstructive sleep apnea, periodontal disease, anxiety, depression, and eating disorders.6
Continue to: Recommended DKD screening protocol
Recommended DKD screening protocol
In all cases of T2D, in cases of T1D of ≥ 5 years’ duration, and in patients with diabetes and comorbid hypertension, perform annual screening for albuminuria, an elevated creatinine level, and a decline in eGFR.
To confirm the diagnosis of DKD, at least 2 of 3 urine specimens must demonstrate an elevated urinary albumin:creatinine ratio (UACR) over a 3- to 6-month period.21 Apart from renal damage, exercise within 24 hours before specimen collection, infection, fever, congestive heart failure, hyperglycemia, menstruation, and hypertension can elevate the UACR.6
Levels of the UACR are established as follows22:
- Normal UACR is defined as < 30 milligrams of albumin per gram of creatinine (expressed as “mg/g”).
- Increased urinary albumin excretion is defined as ≥ 30 mg/g.
- Moderately increased albuminuria, a predictor of potential nephropathy, is the excretion of 30 to 300 mg/g.
- Severely increased albuminuria is excretion > 300 mg/g; it is often followed by a gradual decline in eGFR that, without treatment, eventually leads to ESRD.
The rate of decline in eGFR once albuminuria is severely increased is equivalent in T1D and T2D.12 Without intervention, the time from severely increased albuminuria to ESRD in T1D and T2D averages approximately 6 or 7 years.
Clinical features
DKD is typically a clinical diagnosis seen in patients with longstanding diabetes, albuminuria, retinopathy, or a reduced eGFR in the absence of another primary cause of kidney damage. In patients with T1D and DKD, signs of retinopathy and neuropathy are almost always present at diagnosis, unless a diagnosis is made early in the course of diabetes.12 Therefore, the presence of retinopathy suggests that diabetes is the likely cause of CKD.
Continue to: The presence of microvascular disease...
The presence of microvascular disease in patients with T2D and DKD is less predictable.12 In T2D patients who do not have retinopathy, consider causes of CKD other than DKD. Features suggesting that the cause of CKD is an underlying condition other than diabetes are rapidly increasing albuminuria or decreasing eGFR; urinary sediment comprising red blood cells or white blood cells; and nephrotic syndrome.6
As the prevalence of diabetes increases, it has become more common to diagnose DKD by eGFR without albuminuria—underscoring the importance of routine monitoring of eGFR in patients with diabetes.6
Sources of expert guidance. The Chronic Kidney Disease Epidemiology Collaboration equation23 is preferred for calculating eGFR from serum creatinine: An eGFR < 60 mL/min/1.73 m2 is considered abnormal.3,12 At these rates, the prevalence of complications related to CKD rises and screening for complications becomes necessary.
A more comprehensive classification of the stages of CKD, incorporating albuminuria and progression of CKD, has been recommended by Kidney Disease: Improving Global Outcomes (KDIGO).7 Because eGFR and excretion of albumin vary, abnormal test results need to be verified over time to stage the degree of CKD.3,12 Kidney damage often manifests as albuminuria, but also as hematuria, other types of abnormal urinary sediment, radiographic abnormalities, and other abnormal presentations.
Management
Nutritional factors
Excessive protein intake has been shown to increase albuminuria, worsen renal function, and increase CVD mortality in DKD.24-26 Therefore, daily dietary protein intake of 0.8 g/kg body weight is recommended for patients who are not on dialysis.3 Patients on dialysis might require higher protein intake to preserve muscle mass caused by protein-energy wasting, which is common in dialysis patients.6
Continue to: Low sodium intake
Low sodium intake in CKD patients has been shown to decrease BP and thus slow the progression of renal disease and lower the risk of CVD. The recommended dietary sodium intake in CKD patients is 1500-3000 mg/d.3
Low potassium intake. Hyperkalemia is a serious complication of CKD. A low-potassium diet is recommended in ESRD patients who have a potassium level > 5.5 mEq/L.6
Blood pressure
Preventing and treating hypertension is critical to slowing the progression of CKD and reducing cardiovascular risk. BP should be measured at every clinic visit. Aside from lifestyle changes, medication might be needed to reach target BP.
The American Diabetes Association recommends a BP goal of ≤ 140/90 mm Hg for hypertensive patients with diabetes, although they do state that a lower BP target (≤ 130/80 mm Hg) might be more appropriate for patients with DKD.27
The American College of Cardiology recommends that hypertensive patients with CKD have a BP target of ≤ 130/80 mm Hg.28
Continue to: ACE inhibitors and ARBs
Angiotensin-converting enzyme (ACE) inhibitors and angiotensin II receptor blockers (ARBs) have renoprotective benefits. These agents are recommended as first-line medications for patients with diabetes, hypertension, and an eGFR < 60 mL/min/1.73 m2 and a UACR > 300 mg/g.29-31 Evidence also supports their use when the UACR is 30 to 299 mg/g.
Studies have shown that, in patients with DKD, ACE inhibitors and ARBs can slow the progression of renal disease.29,30,32 There is no difference between ACE inhibitors and ARBs in their effectiveness for preventing progression of DKD.6 There is no added benefit in combining an ACE inhibitor and an ARB33; notably, combination ACE inhibitor and ARB therapy can increase the risk of adverse events, such as hyperkalemia and acute kidney injury, especially in patients with DKD.33
There is no evidence for starting an ACE inhibitor or ARB to prevent CKD in patients with diabetes who are not hypertensive.5
ACE inhibitors and ARBs should be used with caution in women of childbearing age, who should use a reliable form of contraception if taking one of these drugs.
Diuretics. Thiazide-type and loop diuretics might potentiate the positive effects of ACE inhibitors and ARBs. KDOQI guidelines recommend that, in patients who require a second agent to control BP, a diuretic should be considered in combination with an ACE inhibitor or an ARB.20 A loop diuretic is preferred if the eGFR is < 30 mL/min/1.73 m2.
Continue to: Nondihydropyridine calcium-channel blockers
Nondihydropyridine calcium-channel blockers (CCBs), such as diltiazem and verapamil, have been shown to be more effective then dihydrophyridine CCBs, such as amlodipine and nifedipine, in slowing the progression of renal disease because of their antiproteinuric effects. However, the antiproteinuric effects of nondihydropyridine CCBs are not as strong as those of ACE inhibitors or ARBs, and these drugs do not appear to potentiate the effects of an ACE inhibitor or ARB when used in combination.20
Nondihydropyridine CCBs might be a reasonable alternative in patients who cannot tolerate an ACE inhibitor or an ARB.
Mineralocorticoid receptor antagonists in combination with an ACE inhibitor or ARB have been demonstrated to reduce albuminuria in short-term studies.34,35
Glycemic levels
Studies conducted in patients with T1D, and others in patients with T2D, have shown that tight glycemic control can delay the onset and slow the progression of albuminuria and a decline in the eGFR.10,36-39 The target glycated hemoglobin (A1C) should be < 7% to prevent or slow progression of DKD.40 However, patients with DKD have an increased risk of hypoglycemic events and increased mortality with more intensive glycemic control.40,41 Given those findings, some patients with DKD and significant comorbidities, ESRD, or limited life expectancy might need to have an A1C target set at 8%.6,42
Adjustments to antidiabetes medications in DKD
In patients with stages 3 to 5 DKD, several common antidiabetic medications might need to be adjusted or discontinued because they decrease creatinine clearance.
Continue to: First-generation sulfonylureas
First-generation sulfonylureas should be avoided in DKD. Glipizide and gliclazide are preferred among second-generation sulfonylureas because they do not increase the risk of hypoglycemia in DKD patients, although patients taking these medications still require close monitoring of their blood glucose level.20
Metformin. In 2016, recommendations changed for the use of metformin in patients with DKD: The eGFR, not the serum creatinine level, should guide treatment.43 Metformin can be used safely in patients with (1) an eGFR of < 60 mL/min/1.73 m2 and (2) an eGFR of 30 mL/min/1.73 m2 with close monitoring. Metformin should not be initiated if the eGFR is < 45 mL/min/1.73 m2.43
Antidiabetes medications with direct effect on the kidney
Several antidiabetes medications have a direct effect on the kidney apart from their effect on the blood glucose level.
Sodium-glucose co-transporter 2 (SGLT2) inhibitors have been shown to reduce albuminuria and slow the decrease of eGFR independent of glycemic control. In addition, SGLT2 inhibitors have also been shown to have cardiovascular benefits in patients with DKD.44,45
Glucagon-like peptide 1 (GLP-1) receptor agonists have been shown to delay and decrease the progression of DKD.46-48 Also, similar to what is seen with SGLT2 inhibitors, GLP-1 agonists have demonstrable cardiovascular benefit in patients with DKD.46,48
Continue to: Dyslipidemia and DKD
Dyslipidemia and DKD
Because the risk of CVD is increased in patients with DKD, addressing other modifiable risk factors, including dyslipidemia, is recommended in these patients. Patients with diabetes and stages 1 to 4 DKD should be treated with a high-intensity statin or a combination of a statin and ezetimibe.49,50
If a patient is taking a statin and starting dialysis, it’s important to discuss with him or her whether to continue the statin, based on perceived benefits and risks. It is not recommended that statins be initiated in patients on dialysis unless there is a specific cardiovascular indication for doing so. Risk reduction with a statin has been shown to be significantly less in dialysis patients than in patients who are not being treated with dialysis.49
Complications of CKD
Anemia is a common complication of CKD. KDIGO recommends measuring the hemoglobin concentration annually in DKD stage 3 patients without anemia; at least every 6 months in stage 4 patients; and at least every 3 months in stage 5. DKD patients with anemia should have additional laboratory testing: the absolute reticulocyte count, serum ferritin, serum transferrin saturation, vitamin B12, and folate.51
Mineral and bone disorder should be screened for in patients with DKD. TABLE 252 outlines when clinical laboratory tests should be ordered to assess for mineral bone disease.

When to refer to a nephrologist
Refer patients with stage 4 or 5 CKD (eGFR, ≤ 30 mL/min/1.73 m2) to a nephrologist for discussion of kidney replacement therapy.6 Patients with stage 3a CKD and severely increased albuminuria or with stage 3b CKD and moderately or severely increased albuminuria should also be referred to a nephrologist for intervention to delay disease progression.
Continue to: Identifying the need for early referral...
Identifying the need for early referral to a nephrologist has been shown to reduce the cost, and improve the quality, of care.53 Other indications for earlier referral include uncertainty about the etiology of renal disease, persistent or severe albuminuria, persistent hematuria, a rapid decline in eGFR, and acute kidney injury. Additionally, referral at an earlier stage of DKD might be needed to assist with complications associated with DKD, such as anemia, secondary hyperparathyroidism, mineral and bone disorder, resistant hypertension, fluid overload, and electrolyte disturbances.6
ACKNOWLEDGEMENT
The authors thank Colleen Colbert, PhD, and Iqbal Ahmad, PhD, for their review and critique of the manuscript of this article. They also thank Christopher Babiuch, MD, for his guidance in the preparation of the manuscript.
CORRESPONDENCE
Faraz Ahmad, MD, MPH, Care Point East Family Medicine, 543 Taylor Avenue, 2nd floor, Columbus, OH 43203; faraz. ahmad@osumc.edu.
1. Radbill B, Murphy B, LeRoith D. Rationale and strategies for early detection and management of diabetic kidney disease. Mayo Clin Proc. 2008;83:1373-1381.
2. Saran R, Robinson B, Abbott KC, et al. US Renal Data System 2017 Annual Data Report: Epidemiology of kidney disease in the United States. Am J Kidney Dis. 2018;71(3 suppl 1):A7.
3. Tuttle KR, Bakris GL, Bilous RW, et al. Diabetic kidney disease: a report from an ADA Consensus Conference. Am J Kidney Dis. 2014;64:510-533.
4. Fox CS, Matsushita K, Woodward M, et al; . Associations of kidney disease measures with mortality and end-stage renal disease in individuals with and without diabetes: a meta-analysis. Lancet. 2012;380:1662-1673.
5. Orchard TJ, Dorman JS, Maser RE, et al. Prevalence of complications in IDDM by sex and duration. Pittsburgh Epidemiology of Diabetes Complications Study II. Diabetes. 1990;39:1116-1124.
6. American Diabetes Association. Standards of Medical Care in Diabetes—2018. Diabetes Care. 2018;41(suppl 1):S1-S159. Accessed January 5, 2021. https://care.diabetesjournals.org/content/41/Supplement_1
7. National Kidney Foundation. KDIGO 2012 clinical practice guideline for the evaluation and management of chronic kidney disease. Kidney Int Suppl. 2013;3:1-150. Accessed January 5, 2021. https://kdigo.org/wp-content/uploads/2017/02/KDIGO_2012_CKD_GL.pdf
8. Afkarian M, Zelnick LR, Hall YN, et al. Clinical manifestations of kidney disease among US adults with diabetes, 1988-2014. JAMA. 2016;316:602-610.
9. de Boer IH, Rue TC, Hall YN, et al. Temporal trends in the prevalence of diabetic kidney disease in the United States. JAMA. 2011;305:2532-2539.
10. de Boer IH; DCCT/EDIC Research Group. Kidney disease and related findings in the Diabetes Control and Complications Trial/Epidemiology of Diabetes Interventions and Complications study. Diabetes Care. 2014;37:24-30.
11. Stanton RC. Clinical challenges in diagnosis and management of diabetic kidney disease. Am J Kidney Dis. 2014;63(2 suppl 2):S3-S21.
12. Mottl AK, Tuttle KR. Diabetic kidney disease: Pathogenesis and epidemiology. UpToDate. Updated August 19, 2019. Accessed January 5, 2021. www.uptodate.com/contents/diabetic-kidney-disease-pathogenesis-and-epidemiology
13. Bakris GL. Moderately increased albuminuria (microalbuminuria) in type 2 diabetes mellitus. UpToDate. Updated November 3, 2020. Accessed January 5, 2021. https://www.uptodate.com/contents/moderately-increased-albuminuria-microalbuminuria-in-type-2-diabetes-mellitus
14. Bandak G, Sang Y, Gasparini A, et al. Hyperkalemia after initiating renin-angiotensin system blockade: the Stockholm Creatinine Measurements (SCREAM) Project. J Am Heart Assoc. 2017;6:e005428.
15. Saran R, Robinson B, Abbott KC, et al. US Renal Data System 2016 Annual Data Report: Epidemiology of kidney disease in the United States. Am J Kidney Dis. 2017;69(3 suppl 1):A7-A8.
16. Nilsson E, Gasparini A, Ärnlöv J, et al. Incidence and determinants of hyperkalemia and hypokalemia in a large healthcare system. Int J Cardiol. 2017;245:277-284.
17. de Boer IH, Gao X, Cleary PA, et al; Diabetes Control and Complications Trial/Epidemiology of Diabetes Interventions and Complications (DCCT/EDIC) Research Group. Albuminuria changes and cardiovascular and renal outcomes in type 1 diabetes: The DCCT/EDIC study. Clin J Am Soc Nephrol. 2016;11:1969-1977.
18. Sumida K, Molnar MZ, Potukuchi PK, et al. Changes in albuminuria and subsequent risk of incident kidney disease. Clin J Am Soc Nephrol. 2017;12:1941-1949.
19. Borch-Johnsen K, Wenzel H, Viberti GC, et al. Is screening and intervention for microalbuminuria worthwhile in patient with insulin dependent diabetes? BMJ. 1993;306:1722-1725.
20. KDOQI. KDOQI clinical practice guidelines and clinical practice recommendations for diabetes and chronic kidney disease. Am J Kidney Dis. 2007;49(2 suppl 2):S12-154.
21. Bakris GL. Moderately increased albuminuria (microalbuminuria) in type 1 diabetes mellitus. UpToDate. Updated December 3, 2019. Accessed January 5, 2021. https://www.uptodate.com/contents/moderately-increased-albuminuria-microalbuminuria-in-type-1-diabetes-mellitus
22. Delanaye P, Glassock RJ, Pottel H, et al. An age-calibrated definition of chronic kidney disease: rationale and benefits. Clin Biochem Rev. 2016;37:17-26.
23. Levey AS, Stevens LA, Schmid CH, et al; , A new equation to estimate glomerular filtration rate. Ann Intern Med. 2009;150:604-612.
24. Wrone EM, Carnethon MR, Palaniappan L, et al; . Association of dietary protein intake and microalbuminuria in healthy adults: Third National Health and Nutrition Examination Survey. Am J Kidney Dis. 2003;41:580-587.
25. Knight EL, Stampfer MJ, Hankinson SE, et al. The impact of protein intake on renal function decline in women with normal renal function or mild renal insufficiency. Ann Intern Med. 2003;138:460-467.
26. Bernstein AM, Sun Q, Hu FB, et al. Major dietary protein sources and risk of coronary heart disease in women. Circulation. 2010;122:876-883.
27. de Boer, IH, Bangalore S, Benetos A, et al. Diabetes and hypertension: a position statement by the American Diabetes Association. Diabetes Care. 2017;40:1273-1284.
28. Whelton PK, Carey RM, Aronow WS, et al. 2017 ACC/AHA/AAPA/ABC/ACPM/AGS/APhA/ASH/ASPC/NMA/PCNA guideline for the prevention, detection, evaluation, and management of high blood pressure in adults: report of the American College of Cardiology/American Heart Association Task Force on Clinical Practice Guidelines. J Am Coll Cardiol. 2018;71:e127-e248.
29. Brenner BM, Cooper ME, de Zeeuw D, et al; Effects of losartan on renal and cardiovascular outcomes in patients with type 2 diabetes and nephropathy. N Engl J Med. 2001;345:861-869.
30. Lewis EJ, Hunsicker LG, Bain RP, et al. The effect of angiotensin-converting-enzyme inhibition on diabetic nephropathy. The Collaborative Study Group. N Engl J Med. 1993;329:1456-1462.
31. Heart Outcomes Prevention Evaluation (HOPE) Study Investigators. Effects of ramipril on cardiovascular and microvascular outcomes in people with diabetes mellitus: results of the HOPE study and MICRO-HOPE substudy. Lancet. 2000;355;253-259.
32. Lewis EJ, Hunsicker LG, Clarke WR, et al; . Renoprotective effect of the angiotensin-receptor antagonist irbesartan in patients with nephropathy due to type 2 diabetes. N Engl J Med. 2001;345:851-860.
33. Fried LF, Emanuele N, Zhang JH, et al; . Combined angiotensin inhibition for the treatment of diabetic nephropathy. N Engl J Med. 2013;369:1892-1903.
34. Bakris GL, Agarwal R, Chan JC, et al; . Effect of finerenone on albuminuria in patients with diabetic nephropathy: a randomized clinical trial. JAMA. 2015;314:884-894.
35. Filippatos G, Anker SD, M, et al. Randomized controlled study of finerenone vs. eplerenone in patients with worsening chronic heart failure and diabetes mellitus and/or chronic kidney disease. Eur Heart J. 2016;37:2105-2114.
36. The ADVANCE Collaborative Group. Intensive blood glucose control and vascular outcomes in patients with type 2 diabetes.N Engl J Med. 2008;358:2560-2572.
37. Ismail-Beigi F, Craven T, Banerji MA, et al; . Effect of intensive treatment of hyperglycaemia on microvascular outcomes in type 2 diabetes: an analysis of the ACCORD randomised trial. Lancet. 2010;376:419-430.
38. Zoungas S, Chalmers J, Neal B, et al; . Follow-up of blood-pressure lowering and glucose control in type 2 diabetes. N Engl J Med. 2014;371:1392-1406.
39. Zoungas S, Arima H, Gerstein HC, et al; . Effects of intensive glucose control on microvascular outcomes in patients with type 2 diabetes: a meta-analysis of individual participant data from randomised controlled trials. Lancet Diabetes Endocrinol. 2017;5:431-437.
40. Miller ME, Bonds DE, Gerstein HC, et al; . The effects of baseline characteristics, glycaemia treatment approach, and glycated haemoglobin concentration on the risk of severe hypoglycaemia: post hoc epidemiological analysis of the ACCORD study. BMJ. 2010;340;b5444.
41. Papademetriou V, Lovato L, Doumas M, et al; . Chronic kidney disease and intensive glycemic control increase cardiovascular risk in patients with type 2 diabetes. Kidney Int. 2015;87:649-659.
42. National Kidney Foundation. KDOQI clinical practice guideline for diabetes and CKD: 2012 Update. Am J Kidney Dis. 2012;60:850-886.
43. Imam TH. Changes in metformin use in chronic kidney disease. Clin Kidney J. 2017;10:301-304.
44. Wanner C, Inzucchi SE, Lachin JM, et al; Empagliflozin and progression of kidney disease in type 2 diabetes. N Engl J Med. 2016;375:323-334.
45. Neal B, Perkovic V, Mahaffey KW, et al; . Canagliflozin and cardiovascular and renal events in type 2 diabetes. N Engl J Med. 2017;377:644-657.
46. Marso SP, Daniels GH, Brown-Frandsen K, et al; . Liraglutide and cardiovascular outcomes in type 2 diabetes. N Engl J Med. 2016;375:311-322.
47. Mann JFE, DD, Brown-Frandsen K, et al; . Liraglutide and renal outcomes in type 2 diabetes. N Engl J Med. 2017;377:839-848.
48. Marso SP, Bain SC, Consoli A, et al; . Semaglutide and cardiovascular outcomes in patients with type 2 diabetes. N Engl J Med. 2016;375:1834-1844.
49. Wanner C, Tonelli M; Kidney Disease: Improving Global Outcomes Lipid Guideline Development Work Group Members. KDIGO clinical practice guideline for lipid management in CKD: summary of recommendation statements and clinical approach to the patient. Kidney Int. 2014;85:1303-1309.
50. Grundy SM, Stone NJ, Bailey AL, et al. 2018 AHA/ACC/AACVPR/AAPA/ABC/ACPM/ADA/AGS/APhA/ASPC/NLA/PCNA guideline on the management of blood cholesterol. A Report of the American College of Cardiology/American Heart Association Task Force on Clinical Practice Guidelines. Circulation. 2019;139:e1082-e1143.
51. National Kidney Foundation KDOQI. KDIGO clinical practice guideline for anemia in chronic kidney disease. Kidney Int Suppl. 2012;2:279-335. Accessed January 5, 2021. www.sciencedirect.com/journal/kidney-international-supplements/vol/2/issue/4
52. National Kidney Foundation KDOQI. Evaluation and treatment of chronic kidney disease-mineral and bone disorder (CKD-MBD). 2010. Accessed January 5, 2021. www.kidney.org/sites/default/files/02-10-390B_LBA_KDOQI_BoneGuide.pdf
53. Smart MA, Dieberg G, Ladhani M, et al. Early referral to specialist nephrology services for preventing the progression to end-stage kidney disease. Cochrane Database Syst Rev. 2014;(6):CD007333.
Chronic kidney disease (CKD) is a significant comorbidity of diabetes mellitus. The Kidney Disease Outcomes Quality Initiative (KDOQI) of the National Kidney Foundation defines CKD as the presence of kidney damage or decreased kidney function for ≥ 3 months. CKD caused by diabetes is called diabetic kidney disease (DKD), which is 1 of 3 principal microvascular complications of diabetes. DKD can progress to end-stage renal disease (ESRD), requiring kidney replacement therapy, and is the leading cause of CKD and ESRD in the United States.1-3 Studies have also shown that, particularly in patients with diabetes, CKD considerably increases the risk of cardiovascular events, which often occur prior to ESRD.1,4
This article provides the latest recommendations for evaluating and managing DKD to help you prevent or slow its progression.
Defining and categorizing diabetic kidney disease
CKD is defined as persistently elevated excretion of urinary albumin (albuminuria) and decreased estimated glomerular filtration rate (eGFR), or as the presence of signs of progressive kidney damage.5,6 DKD, also known as diabetic nephropathy, is CKD attributed to long-term diabetes. A patient’s eGFR is the established basis for assignment to a stage (1, 2, 3a, 3b, 4, or 5) of CKD (TABLE 17) and, along with the category of albuminuria (A1, A2, or A3), can indicate prognosis.
Taking its toll in diabetes
As many as 40% of patients with diabetes develop DKD.8-10 Most studies of DKD have been conducted in patients with type 1 diabetes (T1D), because the time of clinical onset is typically known.
Type 1 diabetes. DKD usually occurs 10 to 15 years, or later, after the onset of diabetes.6 As many as 30% of people with T1D have albuminuria approximately 15 years after onset of diabetes; almost one-half of those develop DKD.5,11 After approximately 22.5 years without albuminuria, patients with T1D have approximately a 1% annual risk of DKD.12
Type 2 diabetes (T2D). DKD is often present at diagnosis, likely due to a delay in diagnosis and briefer clinical exposure, compared to T1D. Albuminuria has been reported in as many as 40% of patients with T2D approximately 10 years after onset of diabetes.12,13
Multiple risk factors with no standout “predictor”
Genetic susceptibility, ethnicity, glycemic control, smoking, blood pressure (BP), and the eGFR have been identified as risk factors for renal involvement in diabetes; obesity, oral contraceptives, and age can also contribute. Although each risk factor increases the risk of DKD, no single factor is adequately predictive. Moderately increased albuminuria, the earliest sign of DKD, is associated with progressive nephropathy.12
Continue to: How great is the risk?
How great is the risk? From disease onset to proteinuria and from proteinuria to ESRD, the risk of DKD in T1D and T2D is similar. With appropriate treatment, albuminuria can regress, and the risk of ESRD can be < 20% at 10 years in T1D.12 As in T1D, good glycemic control might result in regression of albuminuria in T2D.14
For unknown reasons, the degree of albuminuria can exist independent of the progression of DKD. Factors responsible for a progressive decline in eGFR in DKD without albuminuria are unknown.12,15
Patient evaluation with an eye toward comorbidities
A comprehensive initial medical evaluation for DKD includes a review of microvascular complications; visits to specialists; lifestyle and behavior patterns (eg, diet, sleep, substance use, and social support); and medication adherence, adverse drug effects, and alternative medicines. Although DKD is often a clinical diagnosis, it can be ruled in by persistent albuminuria or decreased eGFR, or both, in established diabetes or diabetic retinopathy when other causes are unlikely (see “Recommended DKD screening protocol,” below).
Screening for mental health conditions and barriers to self-management is also key.6
Comorbidities, of course, can complicate disease management in patients with diabetes.16-20 Providers and patients therefore need to be aware of potential diabetic comorbidities. For example, DKD and even moderately increased albuminuria significantly increase the risk of cardiovascular disease (CVD).12 Other possible comorbidities include (but are not limited to) nonalcoholic steatohepatitis, fracture, hearing impairment, cancer (eg, liver, pancreas, endometrium, colon, rectum, breast, and bladder), pancreatitis, hypogonadism, obstructive sleep apnea, periodontal disease, anxiety, depression, and eating disorders.6
Continue to: Recommended DKD screening protocol
Recommended DKD screening protocol
In all cases of T2D, in cases of T1D of ≥ 5 years’ duration, and in patients with diabetes and comorbid hypertension, perform annual screening for albuminuria, an elevated creatinine level, and a decline in eGFR.
To confirm the diagnosis of DKD, at least 2 of 3 urine specimens must demonstrate an elevated urinary albumin:creatinine ratio (UACR) over a 3- to 6-month period.21 Apart from renal damage, exercise within 24 hours before specimen collection, infection, fever, congestive heart failure, hyperglycemia, menstruation, and hypertension can elevate the UACR.6
Levels of the UACR are established as follows22:
- Normal UACR is defined as < 30 milligrams of albumin per gram of creatinine (expressed as “mg/g”).
- Increased urinary albumin excretion is defined as ≥ 30 mg/g.
- Moderately increased albuminuria, a predictor of potential nephropathy, is the excretion of 30 to 300 mg/g.
- Severely increased albuminuria is excretion > 300 mg/g; it is often followed by a gradual decline in eGFR that, without treatment, eventually leads to ESRD.
The rate of decline in eGFR once albuminuria is severely increased is equivalent in T1D and T2D.12 Without intervention, the time from severely increased albuminuria to ESRD in T1D and T2D averages approximately 6 or 7 years.
Clinical features
DKD is typically a clinical diagnosis seen in patients with longstanding diabetes, albuminuria, retinopathy, or a reduced eGFR in the absence of another primary cause of kidney damage. In patients with T1D and DKD, signs of retinopathy and neuropathy are almost always present at diagnosis, unless a diagnosis is made early in the course of diabetes.12 Therefore, the presence of retinopathy suggests that diabetes is the likely cause of CKD.
Continue to: The presence of microvascular disease...
The presence of microvascular disease in patients with T2D and DKD is less predictable.12 In T2D patients who do not have retinopathy, consider causes of CKD other than DKD. Features suggesting that the cause of CKD is an underlying condition other than diabetes are rapidly increasing albuminuria or decreasing eGFR; urinary sediment comprising red blood cells or white blood cells; and nephrotic syndrome.6
As the prevalence of diabetes increases, it has become more common to diagnose DKD by eGFR without albuminuria—underscoring the importance of routine monitoring of eGFR in patients with diabetes.6
Sources of expert guidance. The Chronic Kidney Disease Epidemiology Collaboration equation23 is preferred for calculating eGFR from serum creatinine: An eGFR < 60 mL/min/1.73 m2 is considered abnormal.3,12 At these rates, the prevalence of complications related to CKD rises and screening for complications becomes necessary.
A more comprehensive classification of the stages of CKD, incorporating albuminuria and progression of CKD, has been recommended by Kidney Disease: Improving Global Outcomes (KDIGO).7 Because eGFR and excretion of albumin vary, abnormal test results need to be verified over time to stage the degree of CKD.3,12 Kidney damage often manifests as albuminuria, but also as hematuria, other types of abnormal urinary sediment, radiographic abnormalities, and other abnormal presentations.
Management
Nutritional factors
Excessive protein intake has been shown to increase albuminuria, worsen renal function, and increase CVD mortality in DKD.24-26 Therefore, daily dietary protein intake of 0.8 g/kg body weight is recommended for patients who are not on dialysis.3 Patients on dialysis might require higher protein intake to preserve muscle mass caused by protein-energy wasting, which is common in dialysis patients.6
Continue to: Low sodium intake
Low sodium intake in CKD patients has been shown to decrease BP and thus slow the progression of renal disease and lower the risk of CVD. The recommended dietary sodium intake in CKD patients is 1500-3000 mg/d.3
Low potassium intake. Hyperkalemia is a serious complication of CKD. A low-potassium diet is recommended in ESRD patients who have a potassium level > 5.5 mEq/L.6
Blood pressure
Preventing and treating hypertension is critical to slowing the progression of CKD and reducing cardiovascular risk. BP should be measured at every clinic visit. Aside from lifestyle changes, medication might be needed to reach target BP.
The American Diabetes Association recommends a BP goal of ≤ 140/90 mm Hg for hypertensive patients with diabetes, although they do state that a lower BP target (≤ 130/80 mm Hg) might be more appropriate for patients with DKD.27
The American College of Cardiology recommends that hypertensive patients with CKD have a BP target of ≤ 130/80 mm Hg.28
Continue to: ACE inhibitors and ARBs
Angiotensin-converting enzyme (ACE) inhibitors and angiotensin II receptor blockers (ARBs) have renoprotective benefits. These agents are recommended as first-line medications for patients with diabetes, hypertension, and an eGFR < 60 mL/min/1.73 m2 and a UACR > 300 mg/g.29-31 Evidence also supports their use when the UACR is 30 to 299 mg/g.
Studies have shown that, in patients with DKD, ACE inhibitors and ARBs can slow the progression of renal disease.29,30,32 There is no difference between ACE inhibitors and ARBs in their effectiveness for preventing progression of DKD.6 There is no added benefit in combining an ACE inhibitor and an ARB33; notably, combination ACE inhibitor and ARB therapy can increase the risk of adverse events, such as hyperkalemia and acute kidney injury, especially in patients with DKD.33
There is no evidence for starting an ACE inhibitor or ARB to prevent CKD in patients with diabetes who are not hypertensive.5
ACE inhibitors and ARBs should be used with caution in women of childbearing age, who should use a reliable form of contraception if taking one of these drugs.
Diuretics. Thiazide-type and loop diuretics might potentiate the positive effects of ACE inhibitors and ARBs. KDOQI guidelines recommend that, in patients who require a second agent to control BP, a diuretic should be considered in combination with an ACE inhibitor or an ARB.20 A loop diuretic is preferred if the eGFR is < 30 mL/min/1.73 m2.
Continue to: Nondihydropyridine calcium-channel blockers
Nondihydropyridine calcium-channel blockers (CCBs), such as diltiazem and verapamil, have been shown to be more effective then dihydrophyridine CCBs, such as amlodipine and nifedipine, in slowing the progression of renal disease because of their antiproteinuric effects. However, the antiproteinuric effects of nondihydropyridine CCBs are not as strong as those of ACE inhibitors or ARBs, and these drugs do not appear to potentiate the effects of an ACE inhibitor or ARB when used in combination.20
Nondihydropyridine CCBs might be a reasonable alternative in patients who cannot tolerate an ACE inhibitor or an ARB.
Mineralocorticoid receptor antagonists in combination with an ACE inhibitor or ARB have been demonstrated to reduce albuminuria in short-term studies.34,35
Glycemic levels
Studies conducted in patients with T1D, and others in patients with T2D, have shown that tight glycemic control can delay the onset and slow the progression of albuminuria and a decline in the eGFR.10,36-39 The target glycated hemoglobin (A1C) should be < 7% to prevent or slow progression of DKD.40 However, patients with DKD have an increased risk of hypoglycemic events and increased mortality with more intensive glycemic control.40,41 Given those findings, some patients with DKD and significant comorbidities, ESRD, or limited life expectancy might need to have an A1C target set at 8%.6,42
Adjustments to antidiabetes medications in DKD
In patients with stages 3 to 5 DKD, several common antidiabetic medications might need to be adjusted or discontinued because they decrease creatinine clearance.
Continue to: First-generation sulfonylureas
First-generation sulfonylureas should be avoided in DKD. Glipizide and gliclazide are preferred among second-generation sulfonylureas because they do not increase the risk of hypoglycemia in DKD patients, although patients taking these medications still require close monitoring of their blood glucose level.20
Metformin. In 2016, recommendations changed for the use of metformin in patients with DKD: The eGFR, not the serum creatinine level, should guide treatment.43 Metformin can be used safely in patients with (1) an eGFR of < 60 mL/min/1.73 m2 and (2) an eGFR of 30 mL/min/1.73 m2 with close monitoring. Metformin should not be initiated if the eGFR is < 45 mL/min/1.73 m2.43
Antidiabetes medications with direct effect on the kidney
Several antidiabetes medications have a direct effect on the kidney apart from their effect on the blood glucose level.
Sodium-glucose co-transporter 2 (SGLT2) inhibitors have been shown to reduce albuminuria and slow the decrease of eGFR independent of glycemic control. In addition, SGLT2 inhibitors have also been shown to have cardiovascular benefits in patients with DKD.44,45
Glucagon-like peptide 1 (GLP-1) receptor agonists have been shown to delay and decrease the progression of DKD.46-48 Also, similar to what is seen with SGLT2 inhibitors, GLP-1 agonists have demonstrable cardiovascular benefit in patients with DKD.46,48
Continue to: Dyslipidemia and DKD
Dyslipidemia and DKD
Because the risk of CVD is increased in patients with DKD, addressing other modifiable risk factors, including dyslipidemia, is recommended in these patients. Patients with diabetes and stages 1 to 4 DKD should be treated with a high-intensity statin or a combination of a statin and ezetimibe.49,50
If a patient is taking a statin and starting dialysis, it’s important to discuss with him or her whether to continue the statin, based on perceived benefits and risks. It is not recommended that statins be initiated in patients on dialysis unless there is a specific cardiovascular indication for doing so. Risk reduction with a statin has been shown to be significantly less in dialysis patients than in patients who are not being treated with dialysis.49
Complications of CKD
Anemia is a common complication of CKD. KDIGO recommends measuring the hemoglobin concentration annually in DKD stage 3 patients without anemia; at least every 6 months in stage 4 patients; and at least every 3 months in stage 5. DKD patients with anemia should have additional laboratory testing: the absolute reticulocyte count, serum ferritin, serum transferrin saturation, vitamin B12, and folate.51
Mineral and bone disorder should be screened for in patients with DKD. TABLE 252 outlines when clinical laboratory tests should be ordered to assess for mineral bone disease.
When to refer to a nephrologist
Refer patients with stage 4 or 5 CKD (eGFR, ≤ 30 mL/min/1.73 m2) to a nephrologist for discussion of kidney replacement therapy.6 Patients with stage 3a CKD and severely increased albuminuria or with stage 3b CKD and moderately or severely increased albuminuria should also be referred to a nephrologist for intervention to delay disease progression.
Continue to: Identifying the need for early referral...
Identifying the need for early referral to a nephrologist has been shown to reduce the cost, and improve the quality, of care.53 Other indications for earlier referral include uncertainty about the etiology of renal disease, persistent or severe albuminuria, persistent hematuria, a rapid decline in eGFR, and acute kidney injury. Additionally, referral at an earlier stage of DKD might be needed to assist with complications associated with DKD, such as anemia, secondary hyperparathyroidism, mineral and bone disorder, resistant hypertension, fluid overload, and electrolyte disturbances.6
ACKNOWLEDGEMENT
The authors thank Colleen Colbert, PhD, and Iqbal Ahmad, PhD, for their review and critique of the manuscript of this article. They also thank Christopher Babiuch, MD, for his guidance in the preparation of the manuscript.
CORRESPONDENCE
Faraz Ahmad, MD, MPH, Care Point East Family Medicine, 543 Taylor Avenue, 2nd floor, Columbus, OH 43203; faraz. ahmad@osumc.edu.
1. Radbill B, Murphy B, LeRoith D. Rationale and strategies for early detection and management of diabetic kidney disease. Mayo Clin Proc. 2008;83:1373-1381.
2. Saran R, Robinson B, Abbott KC, et al. US Renal Data System 2017 Annual Data Report: Epidemiology of kidney disease in the United States. Am J Kidney Dis. 2018;71(3 suppl 1):A7.
3. Tuttle KR, Bakris GL, Bilous RW, et al. Diabetic kidney disease: a report from an ADA Consensus Conference. Am J Kidney Dis. 2014;64:510-533.
4. Fox CS, Matsushita K, Woodward M, et al; . Associations of kidney disease measures with mortality and end-stage renal disease in individuals with and without diabetes: a meta-analysis. Lancet. 2012;380:1662-1673.
5. Orchard TJ, Dorman JS, Maser RE, et al. Prevalence of complications in IDDM by sex and duration. Pittsburgh Epidemiology of Diabetes Complications Study II. Diabetes. 1990;39:1116-1124.
6. American Diabetes Association. Standards of Medical Care in Diabetes—2018. Diabetes Care. 2018;41(suppl 1):S1-S159. Accessed January 5, 2021. https://care.diabetesjournals.org/content/41/Supplement_1
7. National Kidney Foundation. KDIGO 2012 clinical practice guideline for the evaluation and management of chronic kidney disease. Kidney Int Suppl. 2013;3:1-150. Accessed January 5, 2021. https://kdigo.org/wp-content/uploads/2017/02/KDIGO_2012_CKD_GL.pdf
8. Afkarian M, Zelnick LR, Hall YN, et al. Clinical manifestations of kidney disease among US adults with diabetes, 1988-2014. JAMA. 2016;316:602-610.
9. de Boer IH, Rue TC, Hall YN, et al. Temporal trends in the prevalence of diabetic kidney disease in the United States. JAMA. 2011;305:2532-2539.
10. de Boer IH; DCCT/EDIC Research Group. Kidney disease and related findings in the Diabetes Control and Complications Trial/Epidemiology of Diabetes Interventions and Complications study. Diabetes Care. 2014;37:24-30.
11. Stanton RC. Clinical challenges in diagnosis and management of diabetic kidney disease. Am J Kidney Dis. 2014;63(2 suppl 2):S3-S21.
12. Mottl AK, Tuttle KR. Diabetic kidney disease: Pathogenesis and epidemiology. UpToDate. Updated August 19, 2019. Accessed January 5, 2021. www.uptodate.com/contents/diabetic-kidney-disease-pathogenesis-and-epidemiology
13. Bakris GL. Moderately increased albuminuria (microalbuminuria) in type 2 diabetes mellitus. UpToDate. Updated November 3, 2020. Accessed January 5, 2021. https://www.uptodate.com/contents/moderately-increased-albuminuria-microalbuminuria-in-type-2-diabetes-mellitus
14. Bandak G, Sang Y, Gasparini A, et al. Hyperkalemia after initiating renin-angiotensin system blockade: the Stockholm Creatinine Measurements (SCREAM) Project. J Am Heart Assoc. 2017;6:e005428.
15. Saran R, Robinson B, Abbott KC, et al. US Renal Data System 2016 Annual Data Report: Epidemiology of kidney disease in the United States. Am J Kidney Dis. 2017;69(3 suppl 1):A7-A8.
16. Nilsson E, Gasparini A, Ärnlöv J, et al. Incidence and determinants of hyperkalemia and hypokalemia in a large healthcare system. Int J Cardiol. 2017;245:277-284.
17. de Boer IH, Gao X, Cleary PA, et al; Diabetes Control and Complications Trial/Epidemiology of Diabetes Interventions and Complications (DCCT/EDIC) Research Group. Albuminuria changes and cardiovascular and renal outcomes in type 1 diabetes: The DCCT/EDIC study. Clin J Am Soc Nephrol. 2016;11:1969-1977.
18. Sumida K, Molnar MZ, Potukuchi PK, et al. Changes in albuminuria and subsequent risk of incident kidney disease. Clin J Am Soc Nephrol. 2017;12:1941-1949.
19. Borch-Johnsen K, Wenzel H, Viberti GC, et al. Is screening and intervention for microalbuminuria worthwhile in patient with insulin dependent diabetes? BMJ. 1993;306:1722-1725.
20. KDOQI. KDOQI clinical practice guidelines and clinical practice recommendations for diabetes and chronic kidney disease. Am J Kidney Dis. 2007;49(2 suppl 2):S12-154.
21. Bakris GL. Moderately increased albuminuria (microalbuminuria) in type 1 diabetes mellitus. UpToDate. Updated December 3, 2019. Accessed January 5, 2021. https://www.uptodate.com/contents/moderately-increased-albuminuria-microalbuminuria-in-type-1-diabetes-mellitus
22. Delanaye P, Glassock RJ, Pottel H, et al. An age-calibrated definition of chronic kidney disease: rationale and benefits. Clin Biochem Rev. 2016;37:17-26.
23. Levey AS, Stevens LA, Schmid CH, et al; , A new equation to estimate glomerular filtration rate. Ann Intern Med. 2009;150:604-612.
24. Wrone EM, Carnethon MR, Palaniappan L, et al; . Association of dietary protein intake and microalbuminuria in healthy adults: Third National Health and Nutrition Examination Survey. Am J Kidney Dis. 2003;41:580-587.
25. Knight EL, Stampfer MJ, Hankinson SE, et al. The impact of protein intake on renal function decline in women with normal renal function or mild renal insufficiency. Ann Intern Med. 2003;138:460-467.
26. Bernstein AM, Sun Q, Hu FB, et al. Major dietary protein sources and risk of coronary heart disease in women. Circulation. 2010;122:876-883.
27. de Boer, IH, Bangalore S, Benetos A, et al. Diabetes and hypertension: a position statement by the American Diabetes Association. Diabetes Care. 2017;40:1273-1284.
28. Whelton PK, Carey RM, Aronow WS, et al. 2017 ACC/AHA/AAPA/ABC/ACPM/AGS/APhA/ASH/ASPC/NMA/PCNA guideline for the prevention, detection, evaluation, and management of high blood pressure in adults: report of the American College of Cardiology/American Heart Association Task Force on Clinical Practice Guidelines. J Am Coll Cardiol. 2018;71:e127-e248.
29. Brenner BM, Cooper ME, de Zeeuw D, et al; Effects of losartan on renal and cardiovascular outcomes in patients with type 2 diabetes and nephropathy. N Engl J Med. 2001;345:861-869.
30. Lewis EJ, Hunsicker LG, Bain RP, et al. The effect of angiotensin-converting-enzyme inhibition on diabetic nephropathy. The Collaborative Study Group. N Engl J Med. 1993;329:1456-1462.
31. Heart Outcomes Prevention Evaluation (HOPE) Study Investigators. Effects of ramipril on cardiovascular and microvascular outcomes in people with diabetes mellitus: results of the HOPE study and MICRO-HOPE substudy. Lancet. 2000;355;253-259.
32. Lewis EJ, Hunsicker LG, Clarke WR, et al; . Renoprotective effect of the angiotensin-receptor antagonist irbesartan in patients with nephropathy due to type 2 diabetes. N Engl J Med. 2001;345:851-860.
33. Fried LF, Emanuele N, Zhang JH, et al; . Combined angiotensin inhibition for the treatment of diabetic nephropathy. N Engl J Med. 2013;369:1892-1903.
34. Bakris GL, Agarwal R, Chan JC, et al; . Effect of finerenone on albuminuria in patients with diabetic nephropathy: a randomized clinical trial. JAMA. 2015;314:884-894.
35. Filippatos G, Anker SD, M, et al. Randomized controlled study of finerenone vs. eplerenone in patients with worsening chronic heart failure and diabetes mellitus and/or chronic kidney disease. Eur Heart J. 2016;37:2105-2114.
36. The ADVANCE Collaborative Group. Intensive blood glucose control and vascular outcomes in patients with type 2 diabetes.N Engl J Med. 2008;358:2560-2572.
37. Ismail-Beigi F, Craven T, Banerji MA, et al; . Effect of intensive treatment of hyperglycaemia on microvascular outcomes in type 2 diabetes: an analysis of the ACCORD randomised trial. Lancet. 2010;376:419-430.
38. Zoungas S, Chalmers J, Neal B, et al; . Follow-up of blood-pressure lowering and glucose control in type 2 diabetes. N Engl J Med. 2014;371:1392-1406.
39. Zoungas S, Arima H, Gerstein HC, et al; . Effects of intensive glucose control on microvascular outcomes in patients with type 2 diabetes: a meta-analysis of individual participant data from randomised controlled trials. Lancet Diabetes Endocrinol. 2017;5:431-437.
40. Miller ME, Bonds DE, Gerstein HC, et al; . The effects of baseline characteristics, glycaemia treatment approach, and glycated haemoglobin concentration on the risk of severe hypoglycaemia: post hoc epidemiological analysis of the ACCORD study. BMJ. 2010;340;b5444.
41. Papademetriou V, Lovato L, Doumas M, et al; . Chronic kidney disease and intensive glycemic control increase cardiovascular risk in patients with type 2 diabetes. Kidney Int. 2015;87:649-659.
42. National Kidney Foundation. KDOQI clinical practice guideline for diabetes and CKD: 2012 Update. Am J Kidney Dis. 2012;60:850-886.
43. Imam TH. Changes in metformin use in chronic kidney disease. Clin Kidney J. 2017;10:301-304.
44. Wanner C, Inzucchi SE, Lachin JM, et al; Empagliflozin and progression of kidney disease in type 2 diabetes. N Engl J Med. 2016;375:323-334.
45. Neal B, Perkovic V, Mahaffey KW, et al; . Canagliflozin and cardiovascular and renal events in type 2 diabetes. N Engl J Med. 2017;377:644-657.
46. Marso SP, Daniels GH, Brown-Frandsen K, et al; . Liraglutide and cardiovascular outcomes in type 2 diabetes. N Engl J Med. 2016;375:311-322.
47. Mann JFE, DD, Brown-Frandsen K, et al; . Liraglutide and renal outcomes in type 2 diabetes. N Engl J Med. 2017;377:839-848.
48. Marso SP, Bain SC, Consoli A, et al; . Semaglutide and cardiovascular outcomes in patients with type 2 diabetes. N Engl J Med. 2016;375:1834-1844.
49. Wanner C, Tonelli M; Kidney Disease: Improving Global Outcomes Lipid Guideline Development Work Group Members. KDIGO clinical practice guideline for lipid management in CKD: summary of recommendation statements and clinical approach to the patient. Kidney Int. 2014;85:1303-1309.
50. Grundy SM, Stone NJ, Bailey AL, et al. 2018 AHA/ACC/AACVPR/AAPA/ABC/ACPM/ADA/AGS/APhA/ASPC/NLA/PCNA guideline on the management of blood cholesterol. A Report of the American College of Cardiology/American Heart Association Task Force on Clinical Practice Guidelines. Circulation. 2019;139:e1082-e1143.
51. National Kidney Foundation KDOQI. KDIGO clinical practice guideline for anemia in chronic kidney disease. Kidney Int Suppl. 2012;2:279-335. Accessed January 5, 2021. www.sciencedirect.com/journal/kidney-international-supplements/vol/2/issue/4
52. National Kidney Foundation KDOQI. Evaluation and treatment of chronic kidney disease-mineral and bone disorder (CKD-MBD). 2010. Accessed January 5, 2021. www.kidney.org/sites/default/files/02-10-390B_LBA_KDOQI_BoneGuide.pdf
53. Smart MA, Dieberg G, Ladhani M, et al. Early referral to specialist nephrology services for preventing the progression to end-stage kidney disease. Cochrane Database Syst Rev. 2014;(6):CD007333.
PRACTICE RECOMMENDATIONS
› Screen patients with diabetes annually for diabetic kidney disease with measurement of urinary albumin and the estimated glomerular filtration rate. B
› Optimize blood glucose and blood pressure control in patients with diabetes to prevent or delay progression to diabetic kidney disease. A
› Treat hypertensive patients with diabetes and stages 1 to 4 chronic kidney disease with an angiotensin-converting enzyme inhibitor or angiotensin II-receptor blocker as a first-line antihypertensive, absent contraindications. A
Strength of recommendation (SOR)
A Good-quality patient-oriented evidence
B Inconsistent or limited-quality patient-oriented evidence
C Consensus, usual practice, opinion, disease-oriented evidence, case series

PCPs play a small part in low-value care spending
according to a brief report published online Jan. 18 in Annals of Internal Medicine.
However, one expert said there are better ways to curb low-value care than focusing on which specialties are guilty of the practice.
Analyzing a 20% random sample of Medicare Part B claims, Aaron Baum, PhD, with the Icahn School of Medicine at Mount Sinai, New York, and colleagues found that the services primary care physicians performed or ordered made up on average 8.3% of the low-value care their patients received (interquartile range, 3.9%-15.1%; 95th percentile, 35.6%) and their referrals made up 15.4% (IQR, 6.3%-26.4%; 95th percentile, 44.6%).
By specialty, cardiology had the worst record with 27% of all spending on low-value services ($1.8 billion) attributed to that specialty. Yet, of the 25 highest-spending specialties in the report, 12 of them were associated with 1% or less than 1% each of all low-value spending, indicating the waste was widely distributed.
Dr. Baum said in an interview that though there are some PCPs guilty of high spending on low-value services, overall, most primary care physicians’ low-value services add up to only 0.3% of Part B spending. He noted that Part B spending is about one-third of all Medicare spending.
Primary care is often thought to be at the core of care management and spending and PCPs are often seen as the gatekeepers, but this analysis suggests that efforts to make big differences in curtailing low-value spending might be more effective elsewhere.
“There’s only so much spending you can reduce by changing primary care physicians’ services that they directly perform,” Dr. Baum said.
Low-value care is costly, can be harmful
Mark Fendrick, MD, director of the University of Michigan’s Center for Value-Based Insurance Design in Ann Arbor, said in an interview that the report adds confirmation to previous research that has consistently shown low-value care is “extremely common, very costly, and provided by primary care providers and specialists alike.” He noted that it can also be harmful.
“The math is simple,” he said. “If we want to improve coverage and lower patient costs for essential services like visits, diagnostic tests, and drugs, we have to reduce spending on those services that do not make Americans any healthier.”
The study ranked 31 clinical services judged to be low value by physician societies, Medicare and clinical guidelines, and their use among beneficiaries enrolled between 2007 and 2014. Here’s how the top six low-value services compare.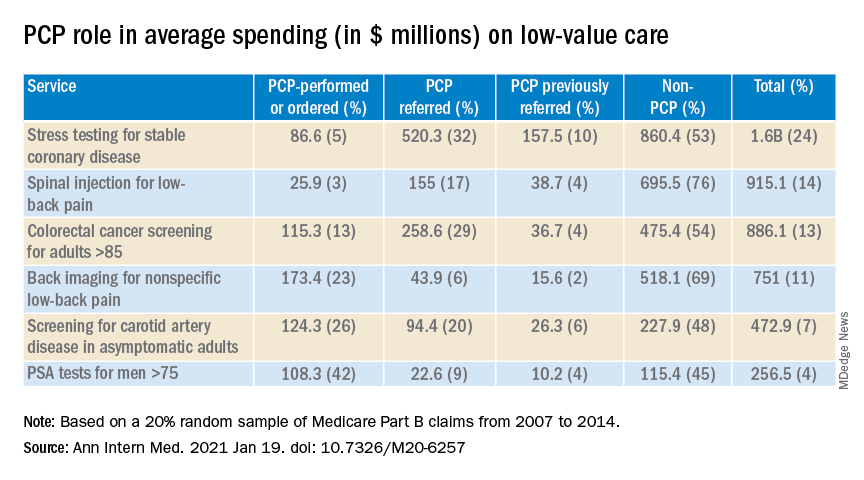
Dr. Fendrick said a weakness of the paper is the years of the data (2007-2014). Some of the criteria around low-value care have changed since then. The age that a prostate-specific antigen test becomes low-value is now 70 years, for instance, instead of 75. He added that some of the figures attributed to non-PCP providers appear out of date.
Dr. Fendrick said, “I understand that there are Medicare patients who end up at a gastroenterologist or surgeon’s office to get colorectal cancer screening, but it would be very hard for me to believe that half of stress tests and over half of colon cancer screening over [age] 85 [years] and half of PSA for people over 75 did not have some type of referring clinicians involved. I certainly don’t think that would be the case in 2020-2021.”
Dr. Baum said those years were the latest years available for the data points needed for this analysis, but he and his colleagues were working to update the data for future publication.
Dr. Fendrick said not much has changed in recent years in terms of waste on low-value care, even with campaigns such as Choosing Wisely dedicated to identifying low-value services or procedures in each specialty.
“I believe there’s not a particular group of clinicians one way or the other who are actually doing any better now than they were 7 years ago,” he said. He would rather focus less on which specialties are associated with the most low-value care and more on the underlying policies that encourage low-value care.
“If you’re going to get paid for doing a stress test and get paid nothing or significantly less if you don’t, the incentives are in the wrong direction,” he said.
Dr. Fendrick said the pandemic era provides an opportunity to eliminate low-value care because use of those services has dropped drastically as resources have been diverted to COVID-19 patients and many services have been delayed or canceled.
He said he has been pushing an approach that providers should be paid more after the pandemic “to do the things we want them to do.”
As an example, he said, instead of paying $886 million on colonoscopies for people over the age of 85, “why don’t we put a policy in place that would make it better for patients by lowering cost sharing and better for providers by paying them more to do the service on the people who need it as opposed to the people who don’t?”
The research was funded by the American Board of Family Medicine Foundation. Dr. Baum and a coauthor reported receiving personal fees from American Board of Family Medicine Foundation during the conduct of the study. Another coauthor reported receiving personal fees from Collective Health, HealthRight 360, PLOS Medicine, and the New England Journal of Medicine, outside the submitted work. Dr. Fendrick disclosed no relevant financial relationships.
A version of this article first appeared on Medscape.com.
Think twice before intensifying BP regimen in older hospitalized patients
Background: It is common practice for providers to intensify antihypertensive regimen during admission for noncardiac conditions even if a patient has a history of well-controlled blood pressure as an outpatient. Many providers have assumed that these changes will benefit patients; however, this outcome had never been studied.
Study design: Retrospective cohort study.
Setting: Veterans Affairs hospitals.
Synopsis: The authors analyzed a well-matched retrospective cohort of 4,056 adults aged 65 years or older with hypertension who were admitted for noncardiac conditions including pneumonia, urinary tract infection, and venous thromboembolism. Half of the cohort was discharged with intensification of their antihypertensives, defined as a new antihypertensive medication or an increase of 20% of a prior medication.
Patients discharged with regimen intensification were more likely to be readmitted (hazard ratio, 1.23; 95% confidence interval, 1.07-1.42; number needed to harm = 27), experience a medication-related serious adverse event (HR, 1.42; 95% CI, 1.06-1.88; NNH = 63), and have a cardiovascular event (HR, 1.65; 95% CI, 1.13-2.4) within 30 days of discharge. At 1 year, no significant difference in mortality, cardiovascular events, or systolic BP were noted between the two groups.
A subgroup analysis of patients with poorly controlled blood pressure as outpatients (defined as systolic blood pressure greater than 140 mm Hg) who had their anti-hypertensive medications intensified did not show significant difference in 30-day readmission, severe adverse events, or cardiovascular events.
Limitations of the study include observational design and majority male sex (97.5%) of the study population.
Bottom line: Intensification of antihypertensive regimen among older adults hospitalized for noncardiac conditions with well-controlled blood pressure as an outpatient can potentially cause harm.
Citation: Anderson TS et al. Clinical outcomes after intensifying antihypertensive medication regimens among older adults at hospital discharge. JAMA Intern Med. 2019 Aug 19. doi: 10.1001/jamainternmed.2019.3007.
Dr. Zarookian is a hospitalist at Maine Medical Center in Portland and Stephens Memorial Hospital in Norway, Maine.
Age at menarche signals potential cardiovascular health risk
“Increases in age at menarche are significantly associated with increases in cardiovascular health among women,” reported Yi Zheng, MPH, and colleagues at the University of Florida, Gainesville.
Mr. Zheng and colleagues conducted a cross-sectional analysis of 20,447 women aged 18 or older using data from a nationally representative sample of the 1999-2016 National Health and Nutrition Examinations Survey (NHANES). In all, 2,292 (11.2%) were determined to have ideal cardiovascular health (CVH).
Early menarche was confirmed to be related to increases in body mass index and greater incidence of type 2 diabetes, consistent with earlier studies, the authors confirmed. Those with nonideal CVH were more likely to have reported early menarche; those with ideal CVH were not only younger, but they also had college or graduate level education or above and higher poverty income ratio. Those with ideal CVH were also less likely to be to be of non-Hispanic Black heritage or to have been previously married.
BMI may be the missing link between early menarche and CVH
Unlike previous studies, the researchers found no significant link between early menarche and blood pressure, total cholesterol, smoking, physical activity, or diet using fully adjusted model data, leading them to conclude that “the associations between early menarche and CVH might be mainly driven by its associations with BMI.”
Mr. Zheng and colleagues suggested that future studies should evaluate the causal relationships between age at menarche and BMI and whether genetic factors and childhood lifestyle predispose women to early menarche and obesity.
“Our findings further highlighted that age at menarche may be used to identify high-risk population[s] and to guide targeted preventions to maintain and improve CVH,” the authors noted. Although they cited several strengths and limitations of the study, they emphasized that the wide use of Life’s Simple 7 factors (blood pressure, total cholesterol, glucose levels, smoking, BMI, physical activity, and diet) to measure CVH should “only be regarded as a surrogate construct, and future efforts are needed to better characterize CVH,” they cautioned.
The findings offer an opportunity to more closely track CVH in racial and ethnic groups
In a separate editorial, Ewa M. Gross-Sawicka, MD, PhD, and Eiran Z. Gorodeski, MD, MPH, both of the Harrington Heart and Vascular Institute, Cleveland, observed: “That the authors found African American women had the lowest overall CVH scores, even after adjusting for differences, highlights the importance of beginning cardiovascular health education earlier, especially for those in certain racial and ethnic groups.”
Dr. Gross-Sawicka and Dr. Gorodeski also raised several key questions that warrant further research: “1) Why do women who experience late menarche have improved cardiovascular health while those who experience early menarche have reduced cardiovascular health? 2) Why do the ‘beneficial’ effects of late menarche on CVH last 10 years longer than the ‘detrimental’ effects of early menarche? 3) Since both early and late menarche are associated with increased risk of cardiovascular disease, are women who experience menarche at an older age more cognizant of the cardiovascular risks compared with younger women and adjust their CVH accordingly?”
A key point also worth further consideration: “It is unclear whether age at menarche is directly associated with CVH, or if this relationship is mediated by the association of age at menarche and BMI and/or hyperglycemia,” said Dr. Gross-Sawicka and Dr. Gorodeski.
In an interview, Jan Shifren, MD, director, Midlife Women’s Health Center, Massachusetts General Hospital, Boston, noted, “The principal finding is that early menarche is associated with worse cardiovascular health, which may reflect the adverse impact of obesity and glucose intolerance on CVH, as obesity also is a risk factor for early menarche. The association between early menarche and worse CVH was significant only in women aged 25-34 years, but not in older women, possibly as other risk factors become more important as women age. One of the most concerning findings in this study ... is that only 11% had ideal CVH based on a combination of behavioral and health factors. As cardiovascular disease is the leading cause of death for women, we must do a better job of optimizing [their] cardiovascular health. Clinicians need to focus on optimizing cardiovascular health for all of their midlife patients, whether or not they experienced early menarche!”
Mr. Zheng and colleagues, as well as Dr. Shifren and Dr. Grodeski, had no conflicts of interest to report. Dr. Gross-Sawicka has received funding from Abbott and Novartis.
FROM THE JOURNAL OF THE NORTH AMERICAN MENOPAUSE SOCIETY
Childhood growth hormones raise risk for adult cardiovascular events
Childhood treatment with recombinant human growth hormone was associated with a significantly increased risk of cardiovascular events, based on data from more than 3,000 individuals.
“Both excess levels of growth hormone and [growth hormone deficiency] have been associated with increased cardiovascular morbidity and mortality,” but data on long-term cardiovascular morbidity in individuals treated with growth hormone in childhood are lacking, wrote Anders Tinblad, MD, of Karolinska Institutet, Stockholm, and colleagues.
In a population-based cohort study published in JAMA Pediatrics, the researchers identified 3,408 Swedish patients treated as children with recombinant human growth hormone (rhGH) between Jan. 1, 1985, and Dec. 31, 2010, and compared each with 15 matched controls (a total of 50,036 controls). The patients were treated for one of three conditions: isolated growth hormone deficiency (GHD), small for gestational age (SGA), and idiopathic short stature (ISS).
Data on cardiovascular outcomes were collected from health care and population-based registers and analyzed between Jan. 1, 1985, and Dec. 31, 2014. The average age of the participants at the study’s end was 25.1 years.
In all, 1,809 cardiovascular disease events were recorded over a median follow-up period of 14.9 years, for an incidence rate of 25.6 events per 10,000 person-years in patients and 22.6 events per 10,000 person-years in controls.
When separated by sex, the incidence was higher in female patients compared with controls (31.2 vs. 23.4 events per 10,000 person-years, respectively, but similar in male patients vs. controls (23.3 vs. 22.3 events per 10,000 person-years). “Differences in estrogen levels or responsiveness to rhGH treatment have previously been hypothesized as possible explanations, but the underlying mechanism for this sex difference still remains unclear and merits further investigation,” the researchers wrote.
Overall, the highest adjusted hazard ratios occurred in subgroups of patients with the longest treatment duration (HR 2.08) and highest cumulative dose of growth hormone (HR 2.05), but no association was noted between highest daily hormone dose and cardiovascular event risk. Hazard ratios were higher across all three treatment subgroups of SGA, GHD, and ISS compared with controls (HR 1.97, 1.66, and 1.55, respectively).
“The association between childhood rhGH treatment and CVD events was also seen when assessing only severe CVD outcomes, but with even lower absolute risks,” the researchers noted.
The study findings were limited by several factors including the potential for confounding by treatment indication and the lack of long-term follow-up data given the relatively young age of the study population, the researchers said. The results were strengthened by the large sample size and showed that the absolute risk for overall and severe cardiovascular disease in children treated with growth hormones was low, “which could be reassuring to individual patients,” they added. However, “At the group level, and perhaps especially for female patients and those treated for SGA indication, further close monitoring and future studies of CVD safety are warranted,” they concluded.
Safety and ethical concerns persist
Although the study authors cite limited conclusions on causality and low absolute risk, several issues persist that prompt ongoing analysis of pediatric growth hormone use, namely “worrisome indirect evidence, challenges and limitations in the direct evidence, and the changing world of growth hormone treatment,” Adda Grimberg, MD, of the University of Pennsylvania, Philadelphia, wrote in an accompanying editorial.
“Although evidence asserts that neither growth hormone nor insulinlike growth factor I is carcinogenic, the basic science and oncology literatures are rife with reports showing that they can make aberrant cells more aggressive,” and such indirect evidence supports the need for more direct evidence of possible harm from growth hormone treatment, Dr. Grimberg wrote. Most current safety data on growth hormone come from postmarketing surveillance studies, but these studies do not include controls or data on outcomes after discontinuation of treatment, she noted.
The current study, while able to follow patients across the lifespan, cannot indicate “whether the small but increased risk of cardiovascular disease found in this study was caused by the pediatric growth hormone treatment that identified the participants, by the conditions being treated, by other potential confounder(s) not captured by the study’s methods, or by a combination of the above,” said Dr. Grimberg.
In addition, “the move from replacement of GHD to pharmacologic height augmentation in children who already make sufficient growth hormone had the potential to change the safety profile of treatment,” she said.
“Parents of patients in pediatric primary care practices and of patients seeking growth-related care in a subspecialty endocrine clinic rated treatment characteristics (i.e., proven efficacy and safety) as the factor most having a big or extreme effect on their growth-related medical decision-making,” Dr. Grimberg said. “The centrality of treatment safety to patient-family decision-making underscores the importance of continued scrutiny of growth hormone safety as the treatment and its recipients continue to evolve,” she concluded.
The study was supported by the Swedish Research Council, the Stockholm City Council, the Karolinska Institute, the Society for Child Care, Sahlgrenska University Hospital, and the Stockholm County Council’s combined clinical residency and PhD training program. Lead author Dr. Tidblad disclosed funding from the Society for Child Care and Stockholm County Council during the conduct of the study and personal fees from Pfizer. Dr. Grimberg disclosed serving as a member of the steering committee for the Pfizer International Growth Study Database, and as a consultant for the Pediatric Endocrine Society GH Deficiency Knowledge Center, sponsored by Sandoz AG.
FROM JAMA PEDIATRICS