User login
Bariatric surgery can lead to diabetes remission, cut cancer risk
Patients with obesity and type 2 diabetes who underwent bariatric surgery and had 10-year durable diabetes remission had a 60% lower risk of incident cancer than patients who had usual obesity care.
And women who had bariatric surgery had a 42% lower risk of having cancer during a median 21-year follow-up, compared with women who had usual obesity care.
These findings from 701 patients in the Swedish Obese Subjects (SOS) study who had type 2 diabetes were recently published in Diabetes Care.
The results illustrate the “connection between glucose control and cancer prevention” and suggest that “among patients with type 2 diabetes, many cancer cases are preventable,” lead author Kajsa Sjöholm, PhD, associate professor of molecular medicine at Sahlgrenska Academy, University of Gothenburg (Sweden), said in a press release from the university.
“The global epidemic of both obesity and diabetes leads to an increased risk of cancer, as well as an increased risk of premature death,” added senior author Magdalena Taube, PhD, associate professor of molecular medicine in the same academy.
“It has been estimated that, over the next 10-15 years, obesity may cause more cancer cases than smoking in several countries,” she noted. Therefore, “strategies are needed to prevent this development, and our results can provide vital guidance for prevention of cancer in patients with obesity and type 2 diabetes.”
Durable diabetes remission seems key
Two-thirds of the patients in the bariatric surgery group had vertical banded gastroplasty (65%), and the rest had adjustable or nonadjustable gastric banding (18%) or gastric bypass (17%).
Each type of bariatric surgery was associated with higher diabetes remission rates, compared with usual care, in a previous study by these researchers, Dr. Taube said in an interview.
“In our present study,” she added, “we observed a nonsignificant trend, where patients with obesity and type 2 diabetes in the highest weight loss tertile (average weight loss, –44.8 kg) had somewhat lower risk of cancer compared to the lowest tertile [average weight loss, –14.9 kg].”
This might suggest, Dr. Taube continued, that with respect to cancer risk, surgery techniques resulting in greater weight loss (for example, Roux-en-Y gastric bypass and sleeve gastrectomy) should be recommended in patients with obesity and diabetes.
“However, it should also be noted that long-term diabetes remission seems imperative for cancer risk reduction,” she said, “and in a recent meta-analysis by McTigue et al., published in JAMA Surgery, it was shown that patients who had Roux-en-Y gastric bypass had greater weight loss, a slightly higher type 2 diabetes remission rate, less type 2 diabetes relapse, and better long-term glycemic control, compared with those who had sleeve gastrectomy.
“The observed cancer reduction in women with obesity and type 2 diabetes is in line with previous findings showing that cancer risk reduction following bariatric surgery in patients with obesity is more marked among women than men,” Dr. Taube noted. This may be because cancer rates are higher in women with diabetes than in men with diabetes, and common cancer types associated with obesity are female specific.
The main cancers in women were breast cancer, followed by endometrial and colorectal cancer. In men, the main cancers were colorectal, prostate, and urothelial/malignant skin cancer.
Study design and findings
It is well established that obesity is a risk factor for 13 types of cancer, and some of these cancers (liver, pancreatic, endometrial, colon and rectal, breast, and bladder) may be related to type 2 diabetes. And bariatric surgery has been shown to reduce cancer risk in patients with obesity.
However, it is not clear how bariatric surgery may affect cancer risk in patients with obesity and type 2 diabetes.
To study this, the researchers examined data from 393 patients who underwent bariatric surgery and 308 patients who received usual obesity treatment, who were part of the SOS study.
The SOS study enrolled men with a body mass index of at least 34 kg/m2, and women with a BMI of at least 38 kg/m2 who were aged 37-60 years between 1987 and 2001.
The current study outcome – cancer incidence in patients with obesity and type 2 diabetes – was not a prespecified outcome
The intervention groups were matched on 18 variables, including age, sex, serum insulin, alcohol, education, and smoking.
At baseline, the patients had a mean age of about 49 and 60% were women. They had a mean BMI of about 42 and a mean hemoglobin A1c of 7.8%.
On average, patients in the surgery group had lost 27.5 kg and 22.7 kg, and patients in the usual care group had lost 3.2 kg and 4.8 kg, at 2 years and 10 years, respectively.
During a median follow-up of 21 years, there were 74 incident cancers in the control group and 68 cancers in the bariatric surgery group.
The risk of cancer during follow-up was 37% lower in the surgery group than in the usual care group, after multivariable adjustment (adjusted hazard ratio, 0.63; 95% confidence interval, 0.44-0.89; P = .008).
A deeper dive showed that there were 86 incident cancers in women and 56 cancers in men. The risk of cancer was significantly lower in women who had bariatric surgery, compared with those who had usual care (aHR, 0.58; 95% CI 0.38-0.90, P = .016). However, the risk of cancer was not significantly lower in men who had bariatric surgery versus those who had usual care (aHR 0.79, 95% CI, 0.46-1.38; P = .413).
Diabetes remission at 10 years was associated with a 60% reduced cancer incidence (aHR, 0.40; 95% CI, 0.22-0.74, P = .003).
The study was funded by the Swedish state (under an agreement between the Swedish government and the county councils), the Swedish Research Council, the Novo Nordisk Foundation, the Swedish Heart-Lung Foundation, and the Swedish Diabetes Foundation. One author received consulting fees from Johnson & Johnson. The other authors had no relevant financial disclosures.
A version of this article first appeared on Medscape.com.
FROM DIABETES CARE
Outrage over dapagliflozin withdrawal for type 1 diabetes in EU
In a shocking, yet low-key, announcement, the sodium-glucose transporter 2 (SGLT2) inhibitor dapagliflozin (Forxiga, AstraZeneca) has been withdrawn from the market in all EU countries for the indication of type 1 diabetes.

This includes withdrawal in the U.K., which was part of the EU when dapagliflozin was approved for type 1 diabetes in 2019, but following Brexit, is no longer.
AstraZeneca said the decision is not motivated by safety concerns but points nevertheless to an increased risk of diabetic ketoacidosis (DKA) associated with SGLT2 inhibitors in those with type 1 diabetes, which it said might cause “confusion” among physicians using the drug to treat numerous other indications for which this agent is now approved.
DKA is a potentially dangerous side effect resulting from acid build-up in the blood and is normally accompanied by very high glucose levels. DKA is flagged as a potential side effect in type 2 diabetes but is more common in those with type 1 diabetes. It can also occur as “euglycemic” DKA, which is ketosis but with relatively normal glucose levels (and therefore harder for patients to detect). Euglycemic DKA is thought to be more of a risk in those with type 1 diabetes than in those with type 2 diabetes.
One charity believes concerns around safety are the underlying factor for the withdrawal of dapagliflozin for type 1 diabetes in Europe, suggesting that AstraZeneca might not want to risk income from more lucrative indications – such as type 2 diabetes with much larger patient populations – because of potential concerns from doctors, who may be deterred from prescribing the drug due to concerns about DKA.
JDRF International, a leading global type 1 diabetes charity, called on AstraZeneca in a statement “to explain to people affected by type 1 diabetes why the drug has been withdrawn.”
It added that dapagliflozin is the “only other drug besides insulin” to be licensed in Europe for the treatment of type 1 diabetes and represents a “major advancement since the discovery of insulin 100 years ago.”
Karen Addington, U.K. Chief Executive of JDRF, said it is “appalling” that the drug has been withdrawn, as “many people with type 1 are finding it an effective and useful tool to help manage their glucose levels.”
SGLT2 inhibitors never approved for type 1 diabetes in U.S.
Dapagliflozin and other drugs from the SGLT2 inhibitor class had already been approved for the treatment of type 2 diabetes for a number of years when dapagliflozin was approved in early 2019 for the treatment of adults with type 1 diabetes meeting certain criteria by the European Medicines Agency (EMA), which at that time included the U.K. in its remit, based on data from the DEPICT series of phase 3 trials.
SGLT2 inhibitors have also recently shown benefit in other indications, such as heart failure and chronic kidney disease – even in the absence of diabetes – leaving some to label them a new class of wonder drugs.
Following the 2019 EU approval for type 1 diabetes, dapagliflozin was subsequently recommended for this use on the National Health Service (NHS) in England and Wales and was accompanied by guidance from the National Institute for Health and Care Excellence (NICE), which has now had to be withdrawn.
Of note, dapagliflozin was never approved for use in type 1 diabetes in the United States (where it is known as Farxiga), with the U.S. Food and Drug Administration turning it down in July 2019.
An advisory panel for the FDA also later turned down another SGLT2 inhibitor for type 1 diabetes, empagliflozin (Jardiance, Boehringer Ingelheim) in Nov. 2019, as reported by this news organization.
Discontinuation ‘not due to safety concerns,’ says AZ
The announcement to discontinue dapagliflozin for the indication of type 1 diabetes in certain adults just two and a half years after its approval in the EU comes as a big surprise, especially as it was made with little fanfare just last month.
In the U.K., AstraZeneca sent a letter to health care professionals on Nov. 2 stating that, from Oct. 25, dapagliflozin 5 mg was “no longer authorized” for the treatment of type 1 diabetes and “should no longer be used” in this patient population.
However, it underlined that other indications for dapagliflozin 5 mg and 10 mg were “not affected by this licensing change,” and it remains available for adults with type 2 diabetes, as well as for the management of symptomatic chronic heart feature with reduced ejection fraction (HFrEF) and chronic kidney disease (CKD).
In the letter, sent by Tom Keith-Roach, country president of AstraZeneca UK, the company asserts that the removal of the type 1 diabetes indication from dapagliflozin is “not due to any safety concern” with the drug “in any indication, including type 1 diabetes.”
It nevertheless goes on to highlight that DKA is a known common side effect of dapagliflozin in type 1 diabetes and, following the announcement, “additional risk minimization measures ... will no longer be available.”
In a separate statement, AstraZeneca said that the decision to remove the indication was made “voluntarily” and had been “agreed” with the Medicines and Healthcare products Regulatory Agency (MHRA) in Great Britain and the equivalent body in Northern Ireland.
“It follows discussions regarding product information changes needed post-approval for dapagliflozin 5 mg specific to type 1 diabetes,” the company said, “which might cause confusion” among physicians treating patients with type 2 diabetes, chronic heart feature with reduced ejection fraction, or CKD.
AstraZeneca told this news organization that similar communications about the withdrawal were issued to health care agencies and health care professionals in all countries of the EU.
‘Appalling, devastating, disappointing’ for patients
The announcement has been met with disappointment in some quarters and outrage in others, and questions have been raised as to the explanation given by AstraZeneca for the drug’s withdrawal.
“Although only a small number of people with type 1 diabetes have been using dapagliflozin, we know that those who have been using it will have been benefitting from tighter control of their condition,” Simon O’Neill, director of health intelligence and professional liaison at Diabetes UK, told this news organization.
“It’s disappointing that these people will now need to go back to the drawing board and will have to work with their clinical team to find other ways of better managing their condition.”
Mr. O’Neill said it was “disappointing that AstraZeneca and the MHRA were unable to find a workable solution to allow people living with type 1 diabetes to continue using the drug safely without leading to confusion for clinicians or people living with type 2 diabetes, who also use it.”
Sanjoy Dutta, JDRF International vice president of research, added that the news is “devastating.”
“The impending negative impact of removing a drug like dapagliflozin from any market can be detrimental in the potential for other national medical ruling boards to have confidence in approving it for their citizens,” he added.
“We stand with our type 1 diabetes communities across the globe in demanding an explanation to clarify this removal.”
Why not an educational campaign about DKA risk?
In an interview, Hilary Nathan, policy & communications director at JDRF International, explained that the charity has its theories as to why dapagliflozin has been withdrawn for type 1 diabetes.
What AstraZeneca is saying, “and what we don’t agree with them on,” is that the “black triangle” warning that has to be put onto the drug due to the increased risk of DKA in type 1 diabetes is “misunderstood by health care practitioners” outside of that specialty and that “by having that black triangle, it will inhibit take-up in those other markets.”
In other words, “there will be less desire to prescribe it,” ventured Ms. Nathan.
She continued: “For us, we feel that if a medicine is deemed safe and efficacious, it should not be withdrawn because of other patient constituencies.”
“We asked: ‘Why can’t you do an educational awareness campaign about the black triangle?’ And the might of AstraZeneca said it would be too big a task.”
Ms. Nathan was also surprised at how the drug could be withdrawn without any warning or real explanation.
“How is it possible that, when a drug is approved there are multiple stakeholders that are involved in putting forward views and experiences – both from the clinical and patient advocacy communities, as well as obviously the pharmaceutical community – yet [a drug] can be withdrawn by a ... company that may well have conflicts of interest around commercial take-up.”
She added: “I feel that there are potentially motives around the withdrawal that AstraZeneca are still not being clear about.”
Perhaps a further clue as to the real motives behind the withdrawal can be found in an announcement, just last week, by the British MHRA.
“The decision by the marketing authorization holder to voluntarily withdraw the indication in type 1 diabetes followed commercial considerations due to a specific European-wide regulatory requirement for this authorization,” it said.
“The decision was not driven by any new safety concerns, such as the already known increased risk of DKA in type 1 diabetes compared with type 2 diabetes.”
Separately, a new in-depth investigation into when Johnson & Johnson, which markets another SGLT2 inhibitor, canagliflozin (Invokana), first knew that its agent was associated with DKA has revealed multiple discrepancies in staff accounts. Some claim the company knew as early as 2010 that canagliflozin – first approved for type 2 diabetes in the United States in 2013 – could increase the risk of DKA. It was not until May 2015 that the FDA first issued a warning about the potential risk of DKA associated with use of SGLT2 inhibitors, with the EMA following suit a month later. In Dec. 2015, the FDA updated the labels for all SGLT2 inhibitors approved in the United States at that time – canagliflozin, empagliflozin, and dapagliflozin – to include the risks for ketoacidosis (and urinary tract infections).
Forxiga (dapagliflozin) is manufactured by AstraZeneca. No relevant financial relationships declared.
A version of this article first appeared on Medscape.com.
In a shocking, yet low-key, announcement, the sodium-glucose transporter 2 (SGLT2) inhibitor dapagliflozin (Forxiga, AstraZeneca) has been withdrawn from the market in all EU countries for the indication of type 1 diabetes.
This includes withdrawal in the U.K., which was part of the EU when dapagliflozin was approved for type 1 diabetes in 2019, but following Brexit, is no longer.
AstraZeneca said the decision is not motivated by safety concerns but points nevertheless to an increased risk of diabetic ketoacidosis (DKA) associated with SGLT2 inhibitors in those with type 1 diabetes, which it said might cause “confusion” among physicians using the drug to treat numerous other indications for which this agent is now approved.
DKA is a potentially dangerous side effect resulting from acid build-up in the blood and is normally accompanied by very high glucose levels. DKA is flagged as a potential side effect in type 2 diabetes but is more common in those with type 1 diabetes. It can also occur as “euglycemic” DKA, which is ketosis but with relatively normal glucose levels (and therefore harder for patients to detect). Euglycemic DKA is thought to be more of a risk in those with type 1 diabetes than in those with type 2 diabetes.
One charity believes concerns around safety are the underlying factor for the withdrawal of dapagliflozin for type 1 diabetes in Europe, suggesting that AstraZeneca might not want to risk income from more lucrative indications – such as type 2 diabetes with much larger patient populations – because of potential concerns from doctors, who may be deterred from prescribing the drug due to concerns about DKA.
JDRF International, a leading global type 1 diabetes charity, called on AstraZeneca in a statement “to explain to people affected by type 1 diabetes why the drug has been withdrawn.”
It added that dapagliflozin is the “only other drug besides insulin” to be licensed in Europe for the treatment of type 1 diabetes and represents a “major advancement since the discovery of insulin 100 years ago.”
Karen Addington, U.K. Chief Executive of JDRF, said it is “appalling” that the drug has been withdrawn, as “many people with type 1 are finding it an effective and useful tool to help manage their glucose levels.”
SGLT2 inhibitors never approved for type 1 diabetes in U.S.
Dapagliflozin and other drugs from the SGLT2 inhibitor class had already been approved for the treatment of type 2 diabetes for a number of years when dapagliflozin was approved in early 2019 for the treatment of adults with type 1 diabetes meeting certain criteria by the European Medicines Agency (EMA), which at that time included the U.K. in its remit, based on data from the DEPICT series of phase 3 trials.
SGLT2 inhibitors have also recently shown benefit in other indications, such as heart failure and chronic kidney disease – even in the absence of diabetes – leaving some to label them a new class of wonder drugs.
Following the 2019 EU approval for type 1 diabetes, dapagliflozin was subsequently recommended for this use on the National Health Service (NHS) in England and Wales and was accompanied by guidance from the National Institute for Health and Care Excellence (NICE), which has now had to be withdrawn.
Of note, dapagliflozin was never approved for use in type 1 diabetes in the United States (where it is known as Farxiga), with the U.S. Food and Drug Administration turning it down in July 2019.
An advisory panel for the FDA also later turned down another SGLT2 inhibitor for type 1 diabetes, empagliflozin (Jardiance, Boehringer Ingelheim) in Nov. 2019, as reported by this news organization.
Discontinuation ‘not due to safety concerns,’ says AZ
The announcement to discontinue dapagliflozin for the indication of type 1 diabetes in certain adults just two and a half years after its approval in the EU comes as a big surprise, especially as it was made with little fanfare just last month.
In the U.K., AstraZeneca sent a letter to health care professionals on Nov. 2 stating that, from Oct. 25, dapagliflozin 5 mg was “no longer authorized” for the treatment of type 1 diabetes and “should no longer be used” in this patient population.
However, it underlined that other indications for dapagliflozin 5 mg and 10 mg were “not affected by this licensing change,” and it remains available for adults with type 2 diabetes, as well as for the management of symptomatic chronic heart feature with reduced ejection fraction (HFrEF) and chronic kidney disease (CKD).
In the letter, sent by Tom Keith-Roach, country president of AstraZeneca UK, the company asserts that the removal of the type 1 diabetes indication from dapagliflozin is “not due to any safety concern” with the drug “in any indication, including type 1 diabetes.”
It nevertheless goes on to highlight that DKA is a known common side effect of dapagliflozin in type 1 diabetes and, following the announcement, “additional risk minimization measures ... will no longer be available.”
In a separate statement, AstraZeneca said that the decision to remove the indication was made “voluntarily” and had been “agreed” with the Medicines and Healthcare products Regulatory Agency (MHRA) in Great Britain and the equivalent body in Northern Ireland.
“It follows discussions regarding product information changes needed post-approval for dapagliflozin 5 mg specific to type 1 diabetes,” the company said, “which might cause confusion” among physicians treating patients with type 2 diabetes, chronic heart feature with reduced ejection fraction, or CKD.
AstraZeneca told this news organization that similar communications about the withdrawal were issued to health care agencies and health care professionals in all countries of the EU.
‘Appalling, devastating, disappointing’ for patients
The announcement has been met with disappointment in some quarters and outrage in others, and questions have been raised as to the explanation given by AstraZeneca for the drug’s withdrawal.
“Although only a small number of people with type 1 diabetes have been using dapagliflozin, we know that those who have been using it will have been benefitting from tighter control of their condition,” Simon O’Neill, director of health intelligence and professional liaison at Diabetes UK, told this news organization.
“It’s disappointing that these people will now need to go back to the drawing board and will have to work with their clinical team to find other ways of better managing their condition.”
Mr. O’Neill said it was “disappointing that AstraZeneca and the MHRA were unable to find a workable solution to allow people living with type 1 diabetes to continue using the drug safely without leading to confusion for clinicians or people living with type 2 diabetes, who also use it.”
Sanjoy Dutta, JDRF International vice president of research, added that the news is “devastating.”
“The impending negative impact of removing a drug like dapagliflozin from any market can be detrimental in the potential for other national medical ruling boards to have confidence in approving it for their citizens,” he added.
“We stand with our type 1 diabetes communities across the globe in demanding an explanation to clarify this removal.”
Why not an educational campaign about DKA risk?
In an interview, Hilary Nathan, policy & communications director at JDRF International, explained that the charity has its theories as to why dapagliflozin has been withdrawn for type 1 diabetes.
What AstraZeneca is saying, “and what we don’t agree with them on,” is that the “black triangle” warning that has to be put onto the drug due to the increased risk of DKA in type 1 diabetes is “misunderstood by health care practitioners” outside of that specialty and that “by having that black triangle, it will inhibit take-up in those other markets.”
In other words, “there will be less desire to prescribe it,” ventured Ms. Nathan.
She continued: “For us, we feel that if a medicine is deemed safe and efficacious, it should not be withdrawn because of other patient constituencies.”
“We asked: ‘Why can’t you do an educational awareness campaign about the black triangle?’ And the might of AstraZeneca said it would be too big a task.”
Ms. Nathan was also surprised at how the drug could be withdrawn without any warning or real explanation.
“How is it possible that, when a drug is approved there are multiple stakeholders that are involved in putting forward views and experiences – both from the clinical and patient advocacy communities, as well as obviously the pharmaceutical community – yet [a drug] can be withdrawn by a ... company that may well have conflicts of interest around commercial take-up.”
She added: “I feel that there are potentially motives around the withdrawal that AstraZeneca are still not being clear about.”
Perhaps a further clue as to the real motives behind the withdrawal can be found in an announcement, just last week, by the British MHRA.
“The decision by the marketing authorization holder to voluntarily withdraw the indication in type 1 diabetes followed commercial considerations due to a specific European-wide regulatory requirement for this authorization,” it said.
“The decision was not driven by any new safety concerns, such as the already known increased risk of DKA in type 1 diabetes compared with type 2 diabetes.”
Separately, a new in-depth investigation into when Johnson & Johnson, which markets another SGLT2 inhibitor, canagliflozin (Invokana), first knew that its agent was associated with DKA has revealed multiple discrepancies in staff accounts. Some claim the company knew as early as 2010 that canagliflozin – first approved for type 2 diabetes in the United States in 2013 – could increase the risk of DKA. It was not until May 2015 that the FDA first issued a warning about the potential risk of DKA associated with use of SGLT2 inhibitors, with the EMA following suit a month later. In Dec. 2015, the FDA updated the labels for all SGLT2 inhibitors approved in the United States at that time – canagliflozin, empagliflozin, and dapagliflozin – to include the risks for ketoacidosis (and urinary tract infections).
Forxiga (dapagliflozin) is manufactured by AstraZeneca. No relevant financial relationships declared.
A version of this article first appeared on Medscape.com.
Medicare insulin negotiations seen saving $17 billion
Medicare could have saved more than $16.7 billion on three kinds of insulin products from 2011 to 2017 if it had secured the same discounts other federal health programs get through negotiations, House Democrats argue in a new report.

On Dec. 10, Democrats on the House Committee on Oversight and Reform released a final majority staff report, which they say is the culmination of an almost 3-year investigation into pharmaceutical pricing and business practices. The report draws from 1.5 million pages of internal company documents, the committee says.
Documents from insulin makers Eli Lilly, Novo Nordisk, and Sanofi indicate these firms “raised their prices in lockstep in order to maintain ‘pricing parity’,” with senior executives encouraging the practice, the committee staff writes in the report.
“In a discussion among Novo Nordisk employees about an Eli Lilly price increase for a different diabetes product on Dec. 24, 2015, a Novo Nordisk pricing analyst remarked, ‘[M]aybe Sanofi will wait until tomorrow morning to announce their price increase ... that’s all I want for Christmas,’” the report states.
House Democrats are seeking to use the report findings to aid their Senate colleagues’ attempt to pass the sweeping Build Back Better bill, which includes many provisions addressing drug costs.
It’s still unclear when the Senate will act on the measure. The House passed the Build Back Better bill, 220-213, in November. It includes a provision that would allow Medicare to negotiate the prices of certain drugs covered by Part D pharmacy plans.
That would mark a reversal of the stance taken when Congress created the pharmacy benefit in a 2003 law, which left negotiations to insurers that cover Part D plans.
Republicans have long argued insurers get the best deals on drugs for people on Medicare. Democrats say this approach sacrifices much of Medicare’s bargaining clout, scattering it among plans.
“This fight has been going on since the Medicare Part D legislation which gave away the store” to drugmakers, said Speaker Nancy Pelosi (D-CA) at a Dec. 10 press conference about the House Oversight report. “And they got used to having the store to themselves.”
The Endocrine Society is urging the Senate to protect the insulin affordability provisions included in the Build Back Better Act and move quickly to pass this crucial legislation.
“We implore all Senators to ensure these provisions are not scaled back. The Build Back Better Act represents the best opportunity to address the price of insulin. Millions of Americans cannot wait any longer for a solution,” it said in a statement issued Dec. 14.
Better deals for military, medicaid programs
Medicare is unusual among federal programs in that it doesn’t directly leverage its clout to lower drug costs.
Total Part D expenditures were approximately $105 billion last year, according to Medicare’s board of trustees. This spending is divided among the many insurers that run Part D plans, which then make a myriad of decisions about formularies and other factors that affect pricing.
For drugs administered by clinicians, and thus covered by Medicare Part B, the program pays a premium of the reported average sales price. Part B drug spending was $39 billion in 2019, an increase of about 11.6% from the previous year, according to the Medicare Payment Advisory Commission.
In contrast, federal law calls for steep reductions in drug prices for people on Medicaid.
The Department of Veterans Affairs (VA) and the Defense Department (DoD)’s Tricare program use several bargaining strategies to lower prices. To control costs, VA and DoD often use formularies of preferred drugs, steer patients to lower-cost drugs, and buy drugs in large volumes, “all of which increase their leverage with drug manufacturers,” the staff of the Congressional Budget Office (CBO) wrote in a Feb. 2021 report.
The CBO report examines how those different federal agencies’ approaches played out in terms of prices, net of applicable rebates, and discounts of 176 top-selling brand-name drugs in Medicare Part D.
The average price for this group of drugs was $118 in Medicaid. And for VA and DoD, the average prices were $190 and $184, respectively, for drugs dispensed at the agencies’ medical facilities or by mail.
But for Medicare Part D, the average price was $343, CBO said in the report, which was one of the sources consulted by House Oversight staff when developing their report released on Dec. 10.
Insulin still of interest, 100 years after its discovery
The House Oversight report runs to almost 270 pages. It addresses several issues with drug prices, including strategies pharmaceutical companies have used to thwart generic competition. On Monday, the trade group America’s Health Insurance Plans separately released its own report looking at patents and delays to the introduction of generic drugs.
Yet, much of the debate on drug prices has focused on one of the oldest widely produced prescription drugs, insulin.
Even with the allowance of generic competition for the essential medicine, branded versions of insulin have been some of the costliest products for Medicare in recent years. Eli Lilly, Novo Nordisk, and Sanofi dominate the insulin market.
Medicare Part D spent about $2.5 billion in 2019 on Sanofi’s Lantus Solostar insulin, or about $2,585 per person in the program using it. The program also paid about $1.1 billion for another form of Lantus, or about $2,746 per patient.
Medicare Part D also spent about $1.84 billion in 2019 on Novo Nordisk’s NovoLog FlexPen, or about $3,063 per person.
Medicare Part D’s drug spending dashboard also lists eight versions of Lilly’s Humalog, with combined 2019 spending of more than $2 billion. The cost per patient in Medicare Part D ranges from $5,619 to $1,462.
“Over the past 20 years, they have repeatedly and dramatically raised the list prices of their rapid-acting and long-acting insulins and reaped billions of dollars in revenues,” write the House Oversight staff in their report.
Republicans on the House Oversight and Reform Committee disagree with their Democratic colleagues on many points in the debate on drug prices, but they also looked at insulin as a cause for concern.
GOP members of the committee released a separate report on Dec. 10. They call for greater clarity into the role middlemen in the drug-supply chain – known as pharmaceutical benefit managers – may play in the rising costs of medicines. The GOP report notes that there are bills pending in the House that would seek to steer any discounts offered on insulin within the supply chain toward consumers (Insulin Price Reduction Act H.R. 4906, Insulin Cost Reduction Act H.R. 5623).
Democratic staff in the committee’s report seek to draw attention to how manufacturers priced their insulin products, including the comment by the Novo Nordisk employee about wishing for a price hike for a competitor’s product.
In a statement provided to this news organization, Novo Nordisk said the committee’s report reflects “a limited picture of the efforts put forth by our company and other companies to manage formulary access.”
“This glimpse into the complexity of pricing, formularies, and the health care system demonstrates why Novo Nordisk continues to advocate for comprehensive solutions,” Denmark’s Novo Nordisk said in the statement.
$35 a month for insulin?
Paris-based Sanofi said it makes insulin-pricing decisions independently from competitors. Sanofi said the net price of its insulins has declined by 53% since 2012, arguing the high prices charged to patients reflect decisions made elsewhere in the supply chain.
“Over the same period, the net price for commercial and Medicare Part D plans of Lantus has fallen 44.9%, while average out-of-pocket costs for patients with commercial insurance and Medicare Part D has risen approximately 82%,” Sanofi said.
“For all the focus on the growth of list prices, today, the average net price of Lantus is below 2006 levels. That is why we support policy reforms to require health plans to share negotiated savings with patients by requiring patient cost-sharing be tied to the net prices.”
Indianapolis-based Lilly offered a similar response in a statement to this news organization.
“Lilly, like other companies, monitors competitor list-price changes that are available through publicly available services,” the company said. “However, any changes we make to our list prices are independent decisions, and to the extent they consider competitors they are informed only through publicly available data.”
Despite rising insurance deductibles, the average monthly out-of-pocket cost for Lilly insulin has dropped 27% to $28.05 over the past 4 years, the company said in an interview. Lilly also noted that there are “several affordability options now available” allowing people to purchase their monthly prescription of its insulin for $35, “whether they are uninsured or use commercial insurance, Medicaid, or a participating Medicare Part D plan.”
In 2020, Lilly had announced that people with commercial insurance and those without insurance would be able to get monthly prescriptions of Lilly insulin for $35.
The Build Back Better Act would require insurers, including Medicare Part D plans and private group or individual health plans, to charge patient cost-sharing of no more than $35 per month for insulin products, said the staff of the nonprofit Kaiser Family Foundation (KFF) in a review of the bill.
“Private group or individual plans would not be required to cover all insulin products, just one of each dosage form (vial, pen) and insulin type (rapid-acting, short-acting, intermediate-acting, and long-acting), for no more than $35,” the KFF staff state in the report.
People enrolled in Medicare can already choose to enroll in a Part D plan participating in a federal test program that can secure certain insulin products for them at a monthly copayment of $35. In 2022, a total of 2,159 Part D plans will participate in this model, a 32% increase in participating plans since 2021, KFF said.
A version of this article first appeared on Medscape.com.
Medicare could have saved more than $16.7 billion on three kinds of insulin products from 2011 to 2017 if it had secured the same discounts other federal health programs get through negotiations, House Democrats argue in a new report.
On Dec. 10, Democrats on the House Committee on Oversight and Reform released a final majority staff report, which they say is the culmination of an almost 3-year investigation into pharmaceutical pricing and business practices. The report draws from 1.5 million pages of internal company documents, the committee says.
Documents from insulin makers Eli Lilly, Novo Nordisk, and Sanofi indicate these firms “raised their prices in lockstep in order to maintain ‘pricing parity’,” with senior executives encouraging the practice, the committee staff writes in the report.
“In a discussion among Novo Nordisk employees about an Eli Lilly price increase for a different diabetes product on Dec. 24, 2015, a Novo Nordisk pricing analyst remarked, ‘[M]aybe Sanofi will wait until tomorrow morning to announce their price increase ... that’s all I want for Christmas,’” the report states.
House Democrats are seeking to use the report findings to aid their Senate colleagues’ attempt to pass the sweeping Build Back Better bill, which includes many provisions addressing drug costs.
It’s still unclear when the Senate will act on the measure. The House passed the Build Back Better bill, 220-213, in November. It includes a provision that would allow Medicare to negotiate the prices of certain drugs covered by Part D pharmacy plans.
That would mark a reversal of the stance taken when Congress created the pharmacy benefit in a 2003 law, which left negotiations to insurers that cover Part D plans.
Republicans have long argued insurers get the best deals on drugs for people on Medicare. Democrats say this approach sacrifices much of Medicare’s bargaining clout, scattering it among plans.
“This fight has been going on since the Medicare Part D legislation which gave away the store” to drugmakers, said Speaker Nancy Pelosi (D-CA) at a Dec. 10 press conference about the House Oversight report. “And they got used to having the store to themselves.”
The Endocrine Society is urging the Senate to protect the insulin affordability provisions included in the Build Back Better Act and move quickly to pass this crucial legislation.
“We implore all Senators to ensure these provisions are not scaled back. The Build Back Better Act represents the best opportunity to address the price of insulin. Millions of Americans cannot wait any longer for a solution,” it said in a statement issued Dec. 14.
Better deals for military, medicaid programs
Medicare is unusual among federal programs in that it doesn’t directly leverage its clout to lower drug costs.
Total Part D expenditures were approximately $105 billion last year, according to Medicare’s board of trustees. This spending is divided among the many insurers that run Part D plans, which then make a myriad of decisions about formularies and other factors that affect pricing.
For drugs administered by clinicians, and thus covered by Medicare Part B, the program pays a premium of the reported average sales price. Part B drug spending was $39 billion in 2019, an increase of about 11.6% from the previous year, according to the Medicare Payment Advisory Commission.
In contrast, federal law calls for steep reductions in drug prices for people on Medicaid.
The Department of Veterans Affairs (VA) and the Defense Department (DoD)’s Tricare program use several bargaining strategies to lower prices. To control costs, VA and DoD often use formularies of preferred drugs, steer patients to lower-cost drugs, and buy drugs in large volumes, “all of which increase their leverage with drug manufacturers,” the staff of the Congressional Budget Office (CBO) wrote in a Feb. 2021 report.
The CBO report examines how those different federal agencies’ approaches played out in terms of prices, net of applicable rebates, and discounts of 176 top-selling brand-name drugs in Medicare Part D.
The average price for this group of drugs was $118 in Medicaid. And for VA and DoD, the average prices were $190 and $184, respectively, for drugs dispensed at the agencies’ medical facilities or by mail.
But for Medicare Part D, the average price was $343, CBO said in the report, which was one of the sources consulted by House Oversight staff when developing their report released on Dec. 10.
Insulin still of interest, 100 years after its discovery
The House Oversight report runs to almost 270 pages. It addresses several issues with drug prices, including strategies pharmaceutical companies have used to thwart generic competition. On Monday, the trade group America’s Health Insurance Plans separately released its own report looking at patents and delays to the introduction of generic drugs.
Yet, much of the debate on drug prices has focused on one of the oldest widely produced prescription drugs, insulin.
Even with the allowance of generic competition for the essential medicine, branded versions of insulin have been some of the costliest products for Medicare in recent years. Eli Lilly, Novo Nordisk, and Sanofi dominate the insulin market.
Medicare Part D spent about $2.5 billion in 2019 on Sanofi’s Lantus Solostar insulin, or about $2,585 per person in the program using it. The program also paid about $1.1 billion for another form of Lantus, or about $2,746 per patient.
Medicare Part D also spent about $1.84 billion in 2019 on Novo Nordisk’s NovoLog FlexPen, or about $3,063 per person.
Medicare Part D’s drug spending dashboard also lists eight versions of Lilly’s Humalog, with combined 2019 spending of more than $2 billion. The cost per patient in Medicare Part D ranges from $5,619 to $1,462.
“Over the past 20 years, they have repeatedly and dramatically raised the list prices of their rapid-acting and long-acting insulins and reaped billions of dollars in revenues,” write the House Oversight staff in their report.
Republicans on the House Oversight and Reform Committee disagree with their Democratic colleagues on many points in the debate on drug prices, but they also looked at insulin as a cause for concern.
GOP members of the committee released a separate report on Dec. 10. They call for greater clarity into the role middlemen in the drug-supply chain – known as pharmaceutical benefit managers – may play in the rising costs of medicines. The GOP report notes that there are bills pending in the House that would seek to steer any discounts offered on insulin within the supply chain toward consumers (Insulin Price Reduction Act H.R. 4906, Insulin Cost Reduction Act H.R. 5623).
Democratic staff in the committee’s report seek to draw attention to how manufacturers priced their insulin products, including the comment by the Novo Nordisk employee about wishing for a price hike for a competitor’s product.
In a statement provided to this news organization, Novo Nordisk said the committee’s report reflects “a limited picture of the efforts put forth by our company and other companies to manage formulary access.”
“This glimpse into the complexity of pricing, formularies, and the health care system demonstrates why Novo Nordisk continues to advocate for comprehensive solutions,” Denmark’s Novo Nordisk said in the statement.
$35 a month for insulin?
Paris-based Sanofi said it makes insulin-pricing decisions independently from competitors. Sanofi said the net price of its insulins has declined by 53% since 2012, arguing the high prices charged to patients reflect decisions made elsewhere in the supply chain.
“Over the same period, the net price for commercial and Medicare Part D plans of Lantus has fallen 44.9%, while average out-of-pocket costs for patients with commercial insurance and Medicare Part D has risen approximately 82%,” Sanofi said.
“For all the focus on the growth of list prices, today, the average net price of Lantus is below 2006 levels. That is why we support policy reforms to require health plans to share negotiated savings with patients by requiring patient cost-sharing be tied to the net prices.”
Indianapolis-based Lilly offered a similar response in a statement to this news organization.
“Lilly, like other companies, monitors competitor list-price changes that are available through publicly available services,” the company said. “However, any changes we make to our list prices are independent decisions, and to the extent they consider competitors they are informed only through publicly available data.”
Despite rising insurance deductibles, the average monthly out-of-pocket cost for Lilly insulin has dropped 27% to $28.05 over the past 4 years, the company said in an interview. Lilly also noted that there are “several affordability options now available” allowing people to purchase their monthly prescription of its insulin for $35, “whether they are uninsured or use commercial insurance, Medicaid, or a participating Medicare Part D plan.”
In 2020, Lilly had announced that people with commercial insurance and those without insurance would be able to get monthly prescriptions of Lilly insulin for $35.
The Build Back Better Act would require insurers, including Medicare Part D plans and private group or individual health plans, to charge patient cost-sharing of no more than $35 per month for insulin products, said the staff of the nonprofit Kaiser Family Foundation (KFF) in a review of the bill.
“Private group or individual plans would not be required to cover all insulin products, just one of each dosage form (vial, pen) and insulin type (rapid-acting, short-acting, intermediate-acting, and long-acting), for no more than $35,” the KFF staff state in the report.
People enrolled in Medicare can already choose to enroll in a Part D plan participating in a federal test program that can secure certain insulin products for them at a monthly copayment of $35. In 2022, a total of 2,159 Part D plans will participate in this model, a 32% increase in participating plans since 2021, KFF said.
A version of this article first appeared on Medscape.com.
Diabetes tied to Parkinson’s risk, more rapid disease progression
Diabetes mellitus (DM) is associated with Parkinson’s disease (PD) development, as well as more severe symptoms and more rapid disease progression, new research suggests.
In a systematic review, patients with type 2 diabetes were 34% more likely to develop PD than those without comorbid DM. In addition, patients with both conditions had significantly worse scores on the Unified Parkinson’s Disease Rating Scale (UPDRS) and worse cognitive performance.
Together, the results suggest that “DM may be a facilitating factor of neurodegeneration,” wrote the investigators, led by Gennaro Pagano, MD, PhD, expert medical director at Roche Pharma Research and Early Development, in Basel, Switzerland.
The findings were published in a recent issue of the Journal of Parkinson’s Disease.
Unanswered questions
Researchers have long proposed a potential relationship between diabetes and PD. However, case-control studies have yielded conflicting results about this relationship – and previous systematic reviews have failed to clarify the question.
In the current systematic review and meta-analysis, investigators identified relevant studies in databases such as MEDLINE/PubMed, Cochrane CENTRAL, and Scopus.
Eligible studies reported prevalence of DM in patients with PD, reported incidence of PD in those with and those without DM, and analyzed Parkinson’s phenotype and progression in those with and those without DM.
The researchers identified 3,829 articles in their initial search, evaluated 90 articles in detail, and included 43 studies in their analysis. Study quality was judged to be moderate or good, and the investigators did not find significant publication bias.
Twenty-one studies that encompassed 11,396 patients were examined to determine prevalence of DM in PD. This prevalence was calculated to be 10.02%, which is similar to the global prevalence of 9.3% reported in 2019.
The researchers also analyzed 12 cohort studies that included 17,797,221 patients to calculate risk for PD in patients with comorbid diabetes. The pooled summary odds ratio for incident PD among patients with type 2 diabetes was 1.34.
The evaluation of the effect of diabetes on PD severity was based on 10 studies that included 603 patients with both diseases. Because data on motor symptoms were not available for all studies, the researchers considered Hoehn and Yahr stage, UPDRS score, and cognitive impairment.
Patients with both conditions had a worse Hoehn and Yahr stage (standardized mean difference, 0.36; P < .001), and higher UPDRS score (SMD, 0.60; P < .001). In 7 of the 10 studies, diabetes was associated with worse cognitive performance in patients with PD.
Mechanisms uncertain
The mechanisms of the effect of diabetes on risk for and severity of PD are uncertain, but the researchers have developed hypotheses.
“Overlapping mechanisms between insulin resistance, mitochondrial dysfunction, oxidative stress, and alpha-synuclein expression could influence the development of the neurodegeneration process,” they wrote.
Because the current analysis demonstrated a trend toward more pronounced cognitive decline in patients with the comorbidities, clinicians should pay particular attention to the progression of motor and cognitive symptoms in patients with these diseases, the investigators noted.
“Additional studies are needed in order to better define the clinical phenotype of PD-DM patients and explore the role of antidiabetic drugs on PD progression,” they wrote.
They add that future studies also are needed to evaluate whether antidiabetic drugs might reduce risk for PD in these patients.
The investigators noted several limitations of their research. In many of the studies they examined, for example, diagnostic criteria of type 2 diabetes and PD were based only on medical records or self-reported health questionnaires. The diagnoses were rarely confirmed.
In addition, not all studies clearly stated that their populations presented with type 2 diabetes. Finally, patients with diabetes may be at increased risk for cardiovascular death, which could affect follow-up related to the development of PD, the investigators noted.
A version of this article first appeared on Medscape.com.
FROM THE JOURNAL OF PARKINSON’S DISEASE
Inadequate routine diabetes screening common in HIV
, research shows.
“Despite known risk in this patient population, most patients were not up to date with routine preventative screenings,” report Maya Hardman, PharmD, and colleagues with Southwest CARE Center, in Santa Fe, New Mexico, in research presented at the United States Conference on HIV/AIDS (USCHA) 2021 Annual Meeting.
“Routine preventative screenings can help identify chronic complications of diabetes early, if performed at the recommended intervals,” they write.
People with HIV are known to be at an increased risk of diabetes and the long-term complications of the disease, making the need for routine screening to prevent such complications all the more pressing due to their higher-risk health status.
Among the key routine diabetes care quality measures recommended by the Healthcare Effectiveness Data and Information Set (HEDIS) for people with HIV are testing for A1c once every 3 months, foot and eye exams every 12 months, urine albumin creatinine ratio (UACR) screenings every 12 months, and two controlled blood pressure readings every 12 months.
To investigate the rates of adherence to the HEDIS screening recommendations and identify predictors of poor compliance among people with HIV, Dr. Hardman and her colleagues evaluated data on 121 adult patients at the Southwest CARE Center who had been diagnosed with diabetes and HIV and were treated between 2019 and 2020.
The patients had a mean age of 57.5, and 9% were female. Their mean duration of being HIV positive was 19.8 years, and they had an intermediate Atherosclerotic Cardiovascular Disease (ASCVD) risk score of 17.08%.
Despite their known diagnoses of having diabetes, as many as 93.4% were found not to be up to date on their routine preventive screenings.
Of the 121 patients, only 30 had received the recommended A1c screenings, 37 had the recommended UACR screenings, and just 18 had received the recommended foot exam screenings.
Only blood pressure screenings, reported in 90 of the 121 patients, were up to date in the majority of patients in the group.
In looking at factors associated with compliance with A1c screening, only age (OR, 0.95; P = .04) was a significant predictor.
The authors pointed out that routine screenings for diabetes complications are relatively easy to implement.
“Screening for these chronic complications is minimally invasive and can be provided by individuals trained in diabetes management during routine clinic appointments.”
The team’s ongoing research is evaluating the potential benefits of clinical pharmacy services in assisting with the screenings for patients with HIV.
Research underscoring the increased risk and poorer treatment outcomes of diabetes in people with HIV include a study comparing 337 people with HIV in 2005 with a cohort of 338 participants in 2015.
The study showed the prevalence of type 2 diabetes had increased to 15.1% in 2015 from 6.8% 10 years earlier, for a relative risk of 2.4 compared with the general population.
“The alarmingly high prevalence of type 2 diabetes in HIV requires improved screening, targeted to older patients and those with a longer duration of exposure to antiretrovirals,” the authors wrote.
“Effective diabetes prevention and management strategies are needed urgently to reduce this risk; such interventions should target both conventional risk factors, such as abdominal obesity and HIV-specific risk factors such as weight gain following initiation of antiretrovirals.”
Of note, the 2015 cohort was significantly older and had higher BMI and higher hypertension than the 2005 cohort.
First author Alastair Duncan, PhD, principal dietitian at Guy’s & St. Thomas’ Hospital and lecturer, King’s College London, noted that since that 2015 study was published, concerns particularly with weight gain in the HIV population have only increased.
“Weight gain appears to be more of an issue [now],” he told this news organization in an interview.
“As in the general population, people living with HIV experienced significant weight gain during COVID-related lockdowns. Added to the high number of people living with HIV being treated with integrase inhibitors, weight gain remains a challenge.”
Meanwhile, “there are not enough studies comparing people living with HIV with the general population,” Dr. Duncan added. “We need to conduct studies where participants are matched.”
Sudipa Sarkar, MD, who co-authored a report on the issue of diabetes and HIV this year but was not involved in the study presented at USCHA, noted that the setting of care could play an important role in the quality of screening for diabetes that people with HIV receive.
“It may depend on factors such as whether a patient is being followed regularly by an HIV care provider and the larger health care system that the patient is in,” Dr. Sarkar, an assistant professor of medicine at Johns Hopkins University School of Medicine, Division of Endocrinology, Diabetes, and Metabolism, told this news organization.
“For example, one might find differences between a patient being seen in a managed care group versus not.”
The issue of how the strikingly high rates of inadequate screening in the current study compare with routine screening in the general diabetes population “is a good question and warrants more research,” she said.
The authors and Dr. Sarkar have disclosed no relevant financial relationships.
A version of this article first appeared on Medscape.com.
The Role of Diagnostic Imaging in Macular Telangiectasia Type 2
While uncommon with subtle findings, macular telangiectasia type 2 can be diagnosed with careful retinal examination and selective use of diagnostic imaging.
Macular telangiectasia type 2 (MacTel2) is an uncommon, bilateral, and asymmetric condition that typically presents between the ages of 40 and 60 years without sex predilection.1-9 Its estimated prevalence ranges from 0.02 to 0.10%.2,8 The disease can manifest in either a nonproliferative or proliferative phase; the latter is far less common. The etiology of MacTel2 is poorly understood, but it is believed to have neurodegenerative as well as vascular components.1-6,8-10 We present a case of MacTel2 and highlight the role of diagnostic imaging in early diagnosis prior to development of classic funduscopic features.
Case Presentation
A 66-year-old White male with a 10-year history of type 2 diabetes mellitus (T2DM) presented to the eye clinic for an annual eye examination. The patient was taking metformin, and 6 months prior to presentation, his hemoglobin A1c was 7.4%. He had a history of mild nonproliferative diabetic retinopathy in the left eye without diabetic macular edema. He reported no ocular concerns.
On examination, best-corrected visual acuity (VA) was 20/20 in each eye. Slit-lamp examination was notable only for bilateral mild nuclear sclerosis. Dilated fundus examination showed a blunted foveal reflex consistent with the appearance of a macular pseudo-hole in the right eye and was unremarkable in the left eye (Figure 1).
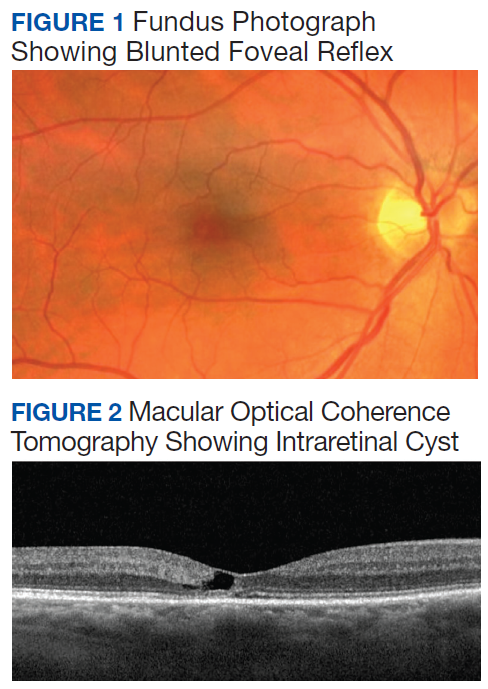
Macular optical coherence tomography (OCT) revealed an intraretinal cyst without thickening in the temporal fovea of both eyes with mild disruption of the underlying ellipsoid zone in the right eye (Figure 2). A presumptive diagnosis of MacTel2 vs diabetic macular edema was made, and the patient was referred to the retina clinic for further evaluation.
At the 1-month follow-up in the retina clinic, VA, macula OCT, and fundus examination were stable. Fundus autofluorescence (FAF), optical coherence tomography angiography (OCT-A), and fluorescein angiography (FA) were performed. The FAF revealed a hyperreflective crescent in the temporal aspect of the fovea of both eyes, greater in the right eye than the left (Figure 3). The OCT-A showed abnormal dilation of the vessels in the deep capillary plexus of the temporal fovea of both eyes (Figure 4). This area of abnormality correlated to the area of hyperreflectivity seen on FAF. The early- phase FA revealed telangiectatic vessels in the temporal fovea in both eyes; in the late phase, there was leakage of telangiectatic vessels, which remained localized to the temporal perifovea and spared the central fovea of both eyes (Figure 5). The patient was diagnosed with MacTel2.
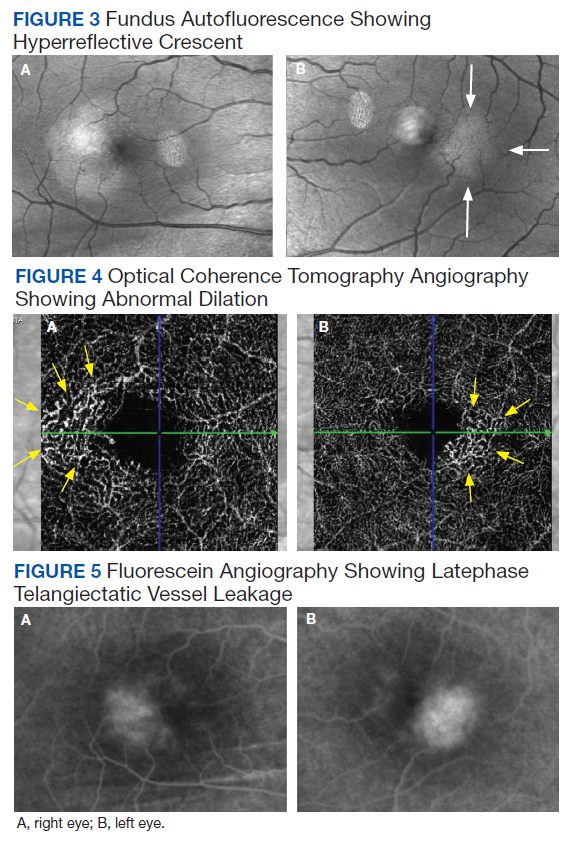
Discussion
This case highlights several important management considerations in MacTel2. These include symptoms, disease stage, and diagnostic imaging, which can allow more precise staging of the disease.
The etiology of MacTel2 is unknown.6 It is believed to be primarily a neurodegenerative condition that damages Müller cells and photoreceptors, leading to vascular changes.1-6,8-10 Müller cells may play a role in creating and maintaining the integrity of the blood-retinal barrier, particularly in the deep capillary plexus where the vascular abnormalities begin.6,10 These early changes in the deep capillary plexus may evolve to include the superficial capillary plexus in intermediate stages with anastomoses forming between the 2 layers.2,6-10 Late proliferative stages show significant alterations of the juxtafoveal capillary network, subretinal neovascularization and retinochoroidal anastomoses.6,7,9,11 In one cohort study, 81% of patients with MacTel2 were White, and a genetic link is still under investigation.2,4-9
Presentation
The most common symptoms of MacTel2 include blurred vision, microscotoma, metamorphopsia, and difficulty reading, with missing or distorted letters a common concern.1,2,4-8 Best-corrected VA at presentation is usually better than 20/30, and disease progression tends to be slow.2,6 Microscotomata are best mapped with microperimetry.1-3,5-7
There are several classic fundus findings (Table). In the early stages, these findings are subtle or entirely absent funduscopically.1,2,4-10 In intermediate stages, fundus findings become apparent and include a loss of retinal clarity (grayish perifoveal sheen), telangiectatic macular vessels, retinal pigment epithelium hypertrophy, blunted right-angled vessels, and superficial retinal crystalline deposits.2,4-11 Right-angled vessels may have a greater association with choroidal neovascularization, with growth into the outer retina in particular being a marker of disease progression.9 The crystalline deposits have been hypothesized to be the footplates of degenerated Müller cells.6
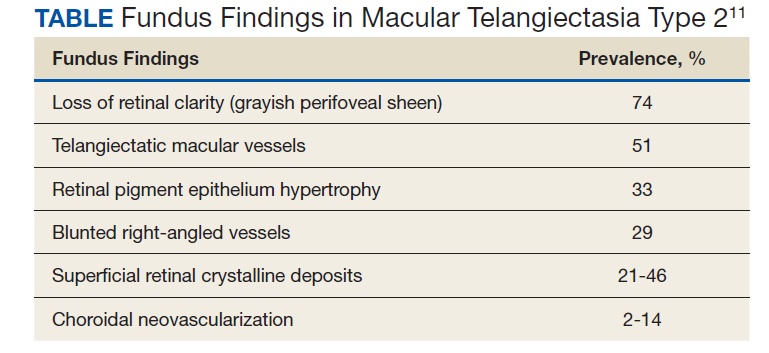
An important vision-threatening complication of MacTel2 is progression to proliferative disease.1,2,5-10 Choroidal neovascularization is present in a minority of cases and is associated with rapid vision loss.2,6 It is often accompanied by subretinal hemorrhage and lipid exudation.6,7,9 If untreated, the result can be disciform scarring and fibrosis.2,5,6 Additional complications of MacTel2 are foveal atrophy and full thickness macular holes.1,2,4-8, Macular holes secondary to MacTel2 respond poorly to pars plana vitrectomy with inner limiting membrane (ILM) peel.2,6
Diagnostic Testing
Diagnostic retinal imaging is invaluable in the diagnosis of MacTel2. The OCT can detect hyporeflectivity within the ellipsoid zone in early disease corresponding to ellipsoid zone loss, which increases as the disease progresses.1-8,10 This loss most often begins in the temporal parafoveal region and correlates with the progression of both relative and absolute scotomas perceived by affected individuals.2,3,5,8
Intraretinal foveal hyporeflective spaces on the OCT represent cavity formation after Müller cell and photoreceptor loss and do not correlate with increased thickness.1,2,4,6,7 This is important in differentiating from diabetic macular edema, which will often show thickening.6 In most cases of MacTel2, foveal thickness is decreased.4-6 The ILM remains intact overlying this space and is referred to as ILM drape.6,7 This can cause blunting or absence of the foveal light reflex and mimic the appearance of a macular pseudohole.4
The OCT-A allows visualization of capillary changes through every layer of the retina, which could not otherwise be appreciated, allowing early detection as well as precise staging of the disease.2,6-10 Anastomoses present in late-stage disease also can be imaged using OCT-A.7,9 These anastomoses can be seen as hyperreflective vasculature present between the retinal layers where there is little to no vasculature visible in normal eyes.7
A lesser-known occurrence in MacTel2 is the depletion of macular luteal pigment, with many eyes possessing an abnormal distribution.2,4,6-8,10 This depletion and abnormal distribution can be visualized with FAF. In particular, short wavelength fundus autofluorescence (SW-FAF) is the most effective at highlighting these changes.10 The characteristic finding is a hyperreflective halo surrounding the fovea.2,6 Fluorescence life imaging ophthalmoscopy (FLIO) is a recent development in FAF that measures FAF lifetime, which is the duration of time a structure autofluoresces.8 A cross-sectional study published in 2018 showed prolonged FAF lifetime in the temporal fovea of patients with early and moderate stage MacTel2 when compared with normal patients.8 More advanced stages showed a ring encircling the entire fovea.8
Classic FA findings in MacTel2 include early hyperfluorescence of temporal foveal telangiectatic capillaries and late-stage leakage with sparing of the central fovea.1,2,4,6,7,11
Management and Prognosis
Management of MacTel2 depends on the stage of the disease. In the absence of proven treatment, management in nonproliferative stages is conservative.2,6 Intravitreal anti-VEGF does not offer any benefit in nonproliferative disease.2,5,6 Indeed, as VEGF may have a neuroprotective effect on the retina, anti-VEGF may result in more harm than benefit in earlier disease stages.5 In proliferative stages, intravitreal anti-VEGF can help limit scarring and prevent vision loss.2,5
Long-term prognosis of MacTel2 is variable with VA typically better than 20/100.2 Vision loss in MacTel2 most often begins paracentrally; it can then progress centrally, leading to significant reduction in VA.12 The progression of this functional vision loss and corresponding structural damage is typically slow.3 VA worse than 20/100 is usually a result of proliferative disease; in such cases, there is potential for severe central vision loss and legal blindness.1
Conclusions
This case of MacTel2 underscores the subtle retinal findings in the earliest stages of the disease and the importance of a complete retinal examination and diagnostic imaging with macula OCT, OCT-A, and FAF to establish the correct diagnosis.
1. Chew EY, Clemons TE, Jaffe GJ, et al. Effect of ciliary neurotrophic factor on retinal neurodegeneration in patients with macular telangiectasia type 2: a randomized clinical trial. Ophthalmology. 2019;126(4):540-549. doi:10.1016/j.ophtha.2018.09.041
2. Christakis PG, Fine HF, Wiley HE. The diagnosis and management of macular telangiectasia. Ophthalmic Surg Lasers Imaging Retina. 2019;50(3):139-144. doi:10.3928/23258160-20190301-02
3. Heeren TFC, Kitka D, Florea D, et al. Longitudinal correlation of ellipsoid zone loss and functional loss in macular telangiectasia type 2. Retina. 2018;38 Suppl 1(suppl 1):S20-S26. doi:10.1097/IAE.0000000000001715
4. Charbel Issa P, Heeren TF, Kupitz EH, Holz FG, Berendschot TT. Very early disease manifestations of macular telangiectasia type 2. Retina. 2016;36(3):524-534. doi:10.1097/IAE.0000000000000863
5. Khodabande A, Roohipoor R, Zamani J, et al. Management of idiopathic macular telangiectasia type 2. Ophthalmol Ther. 2019;8(2):155-175. doi:10.1007/s40123-019-0170-1
6. Wu L. When is macular edema not macular edema? An update on macular telangiectasia type 2. Taiwan J Ophthalmol. 2015;5(4):149-155. doi:10.1016/j.tjo.2015.09.001
7. Roisman L, Rosenfeld PJ. Optical Coherence Tomography Angiography of Macular Telangiectasia Type 2. Dev Ophthalmol. 2016;56:146-158. doi:10.1159/000442807
8. Sauer L, Gensure RH, Hammer M, Bernstein PS. Fluorescence lifetime imaging ophthalmoscopy: a novel way to assess macular telangiectasia type 2. Ophthalmol Retina. 2018;2(6):587-598. doi:10.1016/j.oret.2017.10.008
9. Tzaridis S, Heeren T, Mai C, et al. Right-angled vessels in macular telangiectasia type 2. Br J Ophthalmol. 2021;105(9):1289-1296. doi:10.1136/bjophthalmol-2018-313364
10. Micevych PS, Lee HE, Fawzi AA. Overlap between telangiectasia and photoreceptor loss increases with progression of macular telangiectasia type 2. PLoS One. 2019;14(10):e0224393. Published 2019 Oct 28. doi:10.1371/journal.pone.0224393
11. Gass JD, Oyakawa RT. Idiopathic juxtafoveolar retinal telangiectasis. Arch Ophthalmol. 1982;100(5):769-780. doi:10.1001/archopht.1982.01030030773010
12. Heeren TF, Clemons T, Scholl HP, Bird AC, Holz FG, Charbel Issa P. Progression of vision loss in macular telangiectasia type 2. Invest Ophthalmol Vis Sci. 2015;56(6):3905-3912. doi:10.1167/iovs.15-16915
While uncommon with subtle findings, macular telangiectasia type 2 can be diagnosed with careful retinal examination and selective use of diagnostic imaging.
While uncommon with subtle findings, macular telangiectasia type 2 can be diagnosed with careful retinal examination and selective use of diagnostic imaging.
Macular telangiectasia type 2 (MacTel2) is an uncommon, bilateral, and asymmetric condition that typically presents between the ages of 40 and 60 years without sex predilection.1-9 Its estimated prevalence ranges from 0.02 to 0.10%.2,8 The disease can manifest in either a nonproliferative or proliferative phase; the latter is far less common. The etiology of MacTel2 is poorly understood, but it is believed to have neurodegenerative as well as vascular components.1-6,8-10 We present a case of MacTel2 and highlight the role of diagnostic imaging in early diagnosis prior to development of classic funduscopic features.
Case Presentation
A 66-year-old White male with a 10-year history of type 2 diabetes mellitus (T2DM) presented to the eye clinic for an annual eye examination. The patient was taking metformin, and 6 months prior to presentation, his hemoglobin A1c was 7.4%. He had a history of mild nonproliferative diabetic retinopathy in the left eye without diabetic macular edema. He reported no ocular concerns.
On examination, best-corrected visual acuity (VA) was 20/20 in each eye. Slit-lamp examination was notable only for bilateral mild nuclear sclerosis. Dilated fundus examination showed a blunted foveal reflex consistent with the appearance of a macular pseudo-hole in the right eye and was unremarkable in the left eye (Figure 1).
Macular optical coherence tomography (OCT) revealed an intraretinal cyst without thickening in the temporal fovea of both eyes with mild disruption of the underlying ellipsoid zone in the right eye (Figure 2). A presumptive diagnosis of MacTel2 vs diabetic macular edema was made, and the patient was referred to the retina clinic for further evaluation.
At the 1-month follow-up in the retina clinic, VA, macula OCT, and fundus examination were stable. Fundus autofluorescence (FAF), optical coherence tomography angiography (OCT-A), and fluorescein angiography (FA) were performed. The FAF revealed a hyperreflective crescent in the temporal aspect of the fovea of both eyes, greater in the right eye than the left (Figure 3). The OCT-A showed abnormal dilation of the vessels in the deep capillary plexus of the temporal fovea of both eyes (Figure 4). This area of abnormality correlated to the area of hyperreflectivity seen on FAF. The early- phase FA revealed telangiectatic vessels in the temporal fovea in both eyes; in the late phase, there was leakage of telangiectatic vessels, which remained localized to the temporal perifovea and spared the central fovea of both eyes (Figure 5). The patient was diagnosed with MacTel2.
Discussion
This case highlights several important management considerations in MacTel2. These include symptoms, disease stage, and diagnostic imaging, which can allow more precise staging of the disease.
The etiology of MacTel2 is unknown.6 It is believed to be primarily a neurodegenerative condition that damages Müller cells and photoreceptors, leading to vascular changes.1-6,8-10 Müller cells may play a role in creating and maintaining the integrity of the blood-retinal barrier, particularly in the deep capillary plexus where the vascular abnormalities begin.6,10 These early changes in the deep capillary plexus may evolve to include the superficial capillary plexus in intermediate stages with anastomoses forming between the 2 layers.2,6-10 Late proliferative stages show significant alterations of the juxtafoveal capillary network, subretinal neovascularization and retinochoroidal anastomoses.6,7,9,11 In one cohort study, 81% of patients with MacTel2 were White, and a genetic link is still under investigation.2,4-9
Presentation
The most common symptoms of MacTel2 include blurred vision, microscotoma, metamorphopsia, and difficulty reading, with missing or distorted letters a common concern.1,2,4-8 Best-corrected VA at presentation is usually better than 20/30, and disease progression tends to be slow.2,6 Microscotomata are best mapped with microperimetry.1-3,5-7
There are several classic fundus findings (Table). In the early stages, these findings are subtle or entirely absent funduscopically.1,2,4-10 In intermediate stages, fundus findings become apparent and include a loss of retinal clarity (grayish perifoveal sheen), telangiectatic macular vessels, retinal pigment epithelium hypertrophy, blunted right-angled vessels, and superficial retinal crystalline deposits.2,4-11 Right-angled vessels may have a greater association with choroidal neovascularization, with growth into the outer retina in particular being a marker of disease progression.9 The crystalline deposits have been hypothesized to be the footplates of degenerated Müller cells.6
An important vision-threatening complication of MacTel2 is progression to proliferative disease.1,2,5-10 Choroidal neovascularization is present in a minority of cases and is associated with rapid vision loss.2,6 It is often accompanied by subretinal hemorrhage and lipid exudation.6,7,9 If untreated, the result can be disciform scarring and fibrosis.2,5,6 Additional complications of MacTel2 are foveal atrophy and full thickness macular holes.1,2,4-8, Macular holes secondary to MacTel2 respond poorly to pars plana vitrectomy with inner limiting membrane (ILM) peel.2,6
Diagnostic Testing
Diagnostic retinal imaging is invaluable in the diagnosis of MacTel2. The OCT can detect hyporeflectivity within the ellipsoid zone in early disease corresponding to ellipsoid zone loss, which increases as the disease progresses.1-8,10 This loss most often begins in the temporal parafoveal region and correlates with the progression of both relative and absolute scotomas perceived by affected individuals.2,3,5,8
Intraretinal foveal hyporeflective spaces on the OCT represent cavity formation after Müller cell and photoreceptor loss and do not correlate with increased thickness.1,2,4,6,7 This is important in differentiating from diabetic macular edema, which will often show thickening.6 In most cases of MacTel2, foveal thickness is decreased.4-6 The ILM remains intact overlying this space and is referred to as ILM drape.6,7 This can cause blunting or absence of the foveal light reflex and mimic the appearance of a macular pseudohole.4
The OCT-A allows visualization of capillary changes through every layer of the retina, which could not otherwise be appreciated, allowing early detection as well as precise staging of the disease.2,6-10 Anastomoses present in late-stage disease also can be imaged using OCT-A.7,9 These anastomoses can be seen as hyperreflective vasculature present between the retinal layers where there is little to no vasculature visible in normal eyes.7
A lesser-known occurrence in MacTel2 is the depletion of macular luteal pigment, with many eyes possessing an abnormal distribution.2,4,6-8,10 This depletion and abnormal distribution can be visualized with FAF. In particular, short wavelength fundus autofluorescence (SW-FAF) is the most effective at highlighting these changes.10 The characteristic finding is a hyperreflective halo surrounding the fovea.2,6 Fluorescence life imaging ophthalmoscopy (FLIO) is a recent development in FAF that measures FAF lifetime, which is the duration of time a structure autofluoresces.8 A cross-sectional study published in 2018 showed prolonged FAF lifetime in the temporal fovea of patients with early and moderate stage MacTel2 when compared with normal patients.8 More advanced stages showed a ring encircling the entire fovea.8
Classic FA findings in MacTel2 include early hyperfluorescence of temporal foveal telangiectatic capillaries and late-stage leakage with sparing of the central fovea.1,2,4,6,7,11
Management and Prognosis
Management of MacTel2 depends on the stage of the disease. In the absence of proven treatment, management in nonproliferative stages is conservative.2,6 Intravitreal anti-VEGF does not offer any benefit in nonproliferative disease.2,5,6 Indeed, as VEGF may have a neuroprotective effect on the retina, anti-VEGF may result in more harm than benefit in earlier disease stages.5 In proliferative stages, intravitreal anti-VEGF can help limit scarring and prevent vision loss.2,5
Long-term prognosis of MacTel2 is variable with VA typically better than 20/100.2 Vision loss in MacTel2 most often begins paracentrally; it can then progress centrally, leading to significant reduction in VA.12 The progression of this functional vision loss and corresponding structural damage is typically slow.3 VA worse than 20/100 is usually a result of proliferative disease; in such cases, there is potential for severe central vision loss and legal blindness.1
Conclusions
This case of MacTel2 underscores the subtle retinal findings in the earliest stages of the disease and the importance of a complete retinal examination and diagnostic imaging with macula OCT, OCT-A, and FAF to establish the correct diagnosis.
1. Chew EY, Clemons TE, Jaffe GJ, et al. Effect of ciliary neurotrophic factor on retinal neurodegeneration in patients with macular telangiectasia type 2: a randomized clinical trial. Ophthalmology. 2019;126(4):540-549. doi:10.1016/j.ophtha.2018.09.041
2. Christakis PG, Fine HF, Wiley HE. The diagnosis and management of macular telangiectasia. Ophthalmic Surg Lasers Imaging Retina. 2019;50(3):139-144. doi:10.3928/23258160-20190301-02
3. Heeren TFC, Kitka D, Florea D, et al. Longitudinal correlation of ellipsoid zone loss and functional loss in macular telangiectasia type 2. Retina. 2018;38 Suppl 1(suppl 1):S20-S26. doi:10.1097/IAE.0000000000001715
4. Charbel Issa P, Heeren TF, Kupitz EH, Holz FG, Berendschot TT. Very early disease manifestations of macular telangiectasia type 2. Retina. 2016;36(3):524-534. doi:10.1097/IAE.0000000000000863
5. Khodabande A, Roohipoor R, Zamani J, et al. Management of idiopathic macular telangiectasia type 2. Ophthalmol Ther. 2019;8(2):155-175. doi:10.1007/s40123-019-0170-1
6. Wu L. When is macular edema not macular edema? An update on macular telangiectasia type 2. Taiwan J Ophthalmol. 2015;5(4):149-155. doi:10.1016/j.tjo.2015.09.001
7. Roisman L, Rosenfeld PJ. Optical Coherence Tomography Angiography of Macular Telangiectasia Type 2. Dev Ophthalmol. 2016;56:146-158. doi:10.1159/000442807
8. Sauer L, Gensure RH, Hammer M, Bernstein PS. Fluorescence lifetime imaging ophthalmoscopy: a novel way to assess macular telangiectasia type 2. Ophthalmol Retina. 2018;2(6):587-598. doi:10.1016/j.oret.2017.10.008
9. Tzaridis S, Heeren T, Mai C, et al. Right-angled vessels in macular telangiectasia type 2. Br J Ophthalmol. 2021;105(9):1289-1296. doi:10.1136/bjophthalmol-2018-313364
10. Micevych PS, Lee HE, Fawzi AA. Overlap between telangiectasia and photoreceptor loss increases with progression of macular telangiectasia type 2. PLoS One. 2019;14(10):e0224393. Published 2019 Oct 28. doi:10.1371/journal.pone.0224393
11. Gass JD, Oyakawa RT. Idiopathic juxtafoveolar retinal telangiectasis. Arch Ophthalmol. 1982;100(5):769-780. doi:10.1001/archopht.1982.01030030773010
12. Heeren TF, Clemons T, Scholl HP, Bird AC, Holz FG, Charbel Issa P. Progression of vision loss in macular telangiectasia type 2. Invest Ophthalmol Vis Sci. 2015;56(6):3905-3912. doi:10.1167/iovs.15-16915
IDF Atlas: 1 in 10 adults worldwide now has diabetes
One in 10 adults worldwide currently has diabetes, accounting for an estimated global health expenditure of $966 billion in U.S. dollars in 2021, according to the new International Diabetes Federation Diabetes Atlas.
The IDF Atlas, 10th edition, was published online Dec. 6, 2021.
Highlights from it were presented during two sessions at the IDF Virtual Congress 2021, covering global diabetes incidence and prevalence, mortality, and costs, as well as new sections in this edition devoted to adult-onset type 1 diabetes, childhood-onset type 2 diabetes, and the interactions between diabetes and COVID-19.
More detailed data from some of the Atlas chapters were also published Dec. 6, 2021, in separate papers in the IDF journal Diabetes Research and Clinical Practice, with more publications planned.
Information for the Atlas comes from peer-reviewed literature, unpublished reports, and national registries. This latest edition includes 219 data sources from 144 countries, with figures for other countries extrapolated.
Atlas cochair Dianna Magliano, PhD, reviewed some of the highlights. Half of those currently with diabetes, or about 240 million adults, are undiagnosed, and another 319 million have impaired fasting glucose. Over three-quarters of all adults with diabetes now live in low- and middle-income countries. And about 6.7 million deaths in 2021 can be attributed to diabetes.
The Atlas also predicts increases in these numbers over the coming decades if current trends continue.
“Our data and projections tell a sobering story. Diabetes prevalence is expected to increase globally. The number of adults with diabetes will rise from 537 million in 2021 to 786 million ... by the year 2045, an increase of 46%. Rises are expected in every region of the world, with the largest increases expected to occur in the regions of Africa, the Middle East, and Southeast Asia,” said Dr. Magliano, head of diabetes and population health at the Baker Heart and Diabetes Institute, Melbourne.
Since 2019, when the last Atlas was published, the 2021 numbers represent increases of 73.6 million more adults with diabetes including 7.8 million more undiagnosed, 2.5 million more deaths attributed to diabetes, and an additional global expenditure of $206 billion.
Increases have also occurred in the number of people with prediabetes, children with type 1 diabetes, and pregnancies affected by diabetes, Dr. Magliano reported.
“There is a strong need for effective intervention strategies and policies to stall the increase in the number of people developing diabetes across the world,” she added.
Projected rise in expenditures for diabetes will be ‘unsustainable’
The current $966 billion global health expenditure caused by diabetes represents a 316% increase from the $232 billion reported in 2006, according to William H. Herman, MD, professor of internal medicine and epidemiology at the University of Michigan, Ann Arbor.
By region, 43% of current diabetes-related global expenditures are in North America, 25% in the Western Pacific, and 20% in Europe, while 12% are from the regions of South and Central America, North Africa, Africa, and Southeast Asia combined, Herman said.
The direct costs of diabetes are projected to grow to $1054 billion in 2045, an increase of just 9% over 25 years. The reason for the far lower increase going forward, compared with the tripling in the 15 years prior, is because of the anticipated diabetes rise in regions of the world where per-person spending on diabetes is low, a situation Dr. Herman called “unsustainable.”
“The keys to controlling the global costs of diabetes care are diabetes prevention and providing effective care to the largest number of people at the lowest possible cost,” he said.
Diabetes-related mortality: Some shifts since 2019
One third of the current 6.7 million diabetes-related deaths in 2021 were in people younger than 60 years, said Elbert S. Huang, MD, professor of medicine and public health sciences at the University of Chicago.
Overall, diabetes accounted for 11.8% of total global deaths in people younger than 60 years, but that varied widely, from 24.5% in the Middle East/North Africa to just 6.9% in Southeast Asia.
The regions with the highest number of diabetes-related deaths in people younger than 60 years in 2021 were the Western Pacific and the Middle East/North Africa, a major change from just 2 years ago, when Southeast Asia and Africa saw the greatest numbers of diabetes-related deaths in working-age adults.
“These findings mirror recent reports on inadequate uptake of diabetes prevention programs as well as stagnant quality of care trends for the past decade and reemphasize the need to address noncommunicable diseases across the globe,” Dr. Huang said.
Diabetes and COVID-19: Other factors partly explain the increased risk
Gillian Booth, MD, summarized the current literature on COVID-19 and diabetes including a meta-analysis her group conducted of 300 studies from around the world, with 58% from high-income countries.
The risk for increased COVID-19 severity in people with diabetes could be at least partly explained by factors such as age, sex, and comorbidities, said Dr. Booth, professor in the department of medicine and the Institute of Health Policy, Management, and Evaluation at the University of Toronto.
For example, the unadjusted pooled odds of hospitalization with COVID-19 in patients with diabetes, compared with those without diabetes, was 3.69, but dropped to 1.73 after adjustment for age, sex, and having one or more comorbidities. For COVID-19–related death, those odds ratios were 2.32 unadjusted versus 1.59 adjusted. In both cases, the values were still significant after adjustment, she emphasized.
Overall, hyperglycemia and hemoglobin A1c at admission emerged as significant independent predictors of severe outcomes.
“Further research is needed to understand the interplay between COVID-19 and diabetes and how best to address the disproportionate burden of COVID-19 among people living with diabetes,” she stressed.
Adult-onset type 1 diabetes: Growing recognition of the burden
Ascertainment of data for both adult-onset type 1 and type 2 diabetes in youth was subject to significant limitations.
For adult-onset type 1 diabetes, Jessica Harding, PhD, pointed to the fact that the epidemiology of adult-onset type 1 diabetes hasn’t been well characterized because of the historical focus on children, the difficulty of distinguishing it from type 2 diabetes in adults, and that many registries simply don’t include incident data across the lifespan for type 1 diabetes.
Nonetheless, she said, “there is growing recognition of the burden of adult-onset type 1,” noting that the American Diabetes Association and European Association for the Study of Diabetes just published a consensus statement addressing the topic.
A systematic review of 46 studies representing 32 countries or regions revealed that countries with the highest incidence of type 1 diabetes onset per population of 100,000 ages 20 or above were Eritrea, at 46.2, followed by Sweden and Ireland, both at 30.6, and Finland, at 0. The lowest rates were in Asian countries.
While the Nordic countries (Finland, Sweden, and Norway) are among the top for incidence of both childhood-onset (0-14 years) and adult-onset type 1 diabetes, Eritrea isn’t even among the top 10 for childhood onset.
The unusual situation in Eritrea is the subject of current study but the reasons aren’t yet clear, noted Dr. Magliano, of Emory University, Atlanta, during the question-and-answer period.
And only seven studies, 15%, used biomarkers to determine type 1 diabetes status, suggesting “there is a pressing need to improve the quality and quantity of information on adult-onset type 1 diabetes, particularly in those low- and middle-income countries,” Dr. Harding said.
Type 2 diabetes in youth: A call for better data
When presenting the data for childhood-onset type 2 diabetes, Andrea Luk, MD, noted: “The onset of advanced complications during the most productive time of life has significant impact on individuals, communities, and health economies.”
In 19 studies, the highest reported prevalence of type 2 diabetes in youth was in Brazil, Mexico, indigenous populations of the United States and Canada, and the Black population in the United States, with rates ranging from 160 per 100,000 to 3300 per 100,000. The lowest prevalence rates of 0.6 per 100,000 to 2.7 per 100,000 were reported in Europe. Incidence data were similar, with the highest rates from 31 per 100,000 to 94 per 100,000 and the lowest 0.1 per 100,000 to 0.8 per 100,000 per year.
Of note, Dr. Luk pointed out that childhood obesity is an important factor but not the only one.
“Some populations that have a low prevalence of obesity, such as East Asians, reported higher incidence rates of youth-onset type 2 diabetes than populations with a greater burden of childhood obesity.”
There was variability in incidence rates for youth of similar ethnic background but from different countries. “Apart from genetic predisposition and background obesogenic environment, disparity in socioeconomic status, access to health care, and cultural practices are other contributors to differences in risk of type 2 diabetes in youth,” noted Dr. Luk, associate professor in the division of endocrinology, Department of Medicine and Therapeutics, Chinese University of Hong Kong.
She also noted that the incidence of type 2 diabetes was extremely low in prepubertal children and rises gradually during puberty, and that the incidence is higher in girls than boys but that reverses in adulthood.
Compared with adults with type 2 diabetes, youth with type 2 diabetes had a more adverse glycemic trajectory and higher rates of metformin failure.
And compared with youth with type 1 diabetes, those with type 2 diabetes had more adverse metabolic profiles and higher rates of vascular complications.
“A strong call must be made for the collection of trend data to assess global burden of type 2 diabetes in youth,” she concluded.
Dr. Luk reported serving as an advisory panel member for and/or receiving research support from Amgen, AstraZeneca, Boehringer Ingelheim, Sanofi, the Asia Diabetes Foundation, Bayer, Lee’s Pharmaceutical, MSD, Novo Nordisk, Roche, Sugardown, and Takeda. The other authors reported no relevant financial relationships.
A version of this article first appeared on Medscape.com.
25-hydroxyvitamin D concentration is key to analyzing vitamin D’s effects
The recent Practice Alert by Dr. Campos-Outcalt, “How to proceed when it comes to vitamin D” (J Fam Pract. 2021;70:289-292) claimed that the value of vitamin D supplements for prevention is nil or still unknown.1 Most of the references cited in support of this statement were centered on randomized controlled trials (RCTs) based on vitamin D dose rather than achieved 25-hydroxyvitamin D [25(OH)D] concentration. Since the health effects of vitamin D supplementation are correlated with 25(OH)D concentration, the latter should be used to evaluate the results of vitamin D RCTs—a point I made in my 2018 article on the topic.2
For example, in the Vitamin D and Type 2 Diabetes (D2d) Study, in which participants in the treatment arm received 4000 IU/d vitamin D3, there was no reduced rate of progression from prediabetes to diabetes. However, when 25(OH)D concentrations were analyzed for those in the vitamin D arm during the trial, the risk was found to be reduced by 25% (hazard ratio [HR] = 0.75; 95% CI, 0.68-0.82) per 10 ng/mL increase in 25(OH)D.3
Another trial, the Harvard-led VITamin D and OmegA-3 TriaL (VITAL), enrolled more than 25,000 participants, with the treatment arm receiving 2000 IU/d vitamin D3.4 There were no significant reductions in incidence of either cancer or cardiovascular disease for the entire group. The mean baseline 25(OH)D concentration for those for whom values were provided was 31 ng/mL (32.2 ng/mL for White participants, 24.9 ng/mL for Black participants). However, there were ~25% reductions in cancer risk among Black participants (who had lower 25(OH)D concentrations than White participants) and those with a body mass index < 25. A posthoc analysis suggested a possible benefit related to the rate of total cancer deaths.
A recent article reported the results of long-term vitamin D supplementation among Veterans Health Administration patients who had an initial 25(OH)D concentration of < 20 ng/mL.5 For those who were treated with vitamin D and achieved a 25(OH)D concentration of > 30 ng/mL (compared to those who were untreated and had an average concentration of < 20 ng/mL), the risk of myocardial infarction was 27% lower (HR = 0.73; 95% CI, 0.55-0.96) and the risk of all-cause mortality was reduced by 39% (HR = 0.61; 95% CI, 0.56-0.67).
An analysis of SARS-CoV-2 positivity examined data for more than 190,000 patients in the United States who had serum 25(OH)D concentration measurements taken up to 1 year prior to their SARS-CoV-2 test. Positivity rates were 12.5% (95% CI, 12.2%-12.8%) for those with a 25(OH)D concentration < 20 ng/mL vs 5.9% (95% CI, 5.5%-6.4%) for those with a 25(OH)D concentration ≥55 ng/mL.6
Thus, there are significant benefits of vitamin D supplementation to achieve a 25(OH)D concentration of 30 to 60 ng/mL for important health outcomes.
Continue to: Author's Response
Author's response
I appreciate the letter from Dr. Grant in response to my previous Practice Alert, as it provides an opportunity to make some important points about assessment of scientific evidence and drawing conclusions based on sound methodology. There is an overabundance of scientific literature published, much of which is of questionable quality, meaning a “study” or 2 can be found to support any preconceived point of view.
In 2011, the Institute of Medicine (now the National Academy of Medicine) published a series of recommendations on how trustworthy recommendations and guidelines should be produced.1,2 Key among the steps recommended is a full assessment of the totality of the literature on the subject by an independent, nonconflicted panel. This should be based on a systematic review that includes standard search methods to find all pertinent articles, an assessment of the quality of each study using standardized tools, and an overall assessment of the quality of the evidence. A high-quality systematic review meeting these standards was the basis for my review article on vitamin D.3
To challenge the findings of the unproven benefits of vitamin D, Dr. Grant cited 4 studies to support the purported benefit of achieving a specific serum 25(OH)D level to prevent cardiovascular disease, diabetes, cancer, and COVID-19. After reading these studies, I would not consider any of them a “game changer.”
The first study was restricted to those with prediabetes, had limited follow-up (mean of 2.5 years), and found different results for those with the same 25(OH)D concentrations in the placebo and treatment groups.4 The second study was a large, well-conducted clinical trial that found no benefit of vitamin D supplementation in preventing cancer and cardiovascular disease.5 While Dr. Grant claims that benefits were found for some subgroups, I could locate only the statistics on cancer incidence in Black participants, and the confidence intervals showed no statistically significant benefit. It is always questionable to look at multiple outcomes in multiple subgroups without a prior hypothesis because of the likely occurrence of chance findings in so many comparisons. The third was a retrospective observational study with all the potential biases and challenges to validity that such studies present.6 A single study, especially 1 with observational methods, almost never conclusively settles a point.
The role of vitamin D in the prevention or treatment of COVID-19 is an aspect that was not covered in the systematic review by the US Preventive Services Task Force. The study on this issuecited by Dr. Grant was a large retrospective observational study that found an inverse relationship between serum 25(OH)D levels and SARS-CoV-2 positivity rates.7 This is 1 observational study with interesting results. However, I believe the conclusion of the National Institutes of Health is currently still the correct one: “There is insufficient evidence to recommend either for or against the use of vitamin D for the prevention or treatment of COVID-19.”8
With time and further research, Dr. Grant may eventually prove to be correct on specific points. However, when challenging a high-quality systematic review, one must assess the quality of the studies used while also placing them in context of the totality of the literature.
Doug Campos-Outcalt, MD, MPA
Phoenix, AZ
References
1. Institute of Medicine. Finding What Works in Health Care. The National Academy Press, 2011.
2. Institute of Medicine. Clinical Practice Guidelines We Can Trust. The National Academy Press, 2011.
3. Kahwati LC, LeBlanc E, Weber RP, et al. Screening for vitamin D deficiency in adults; updated evidence report and systematic review for the US Preventive Services Task Force. JAMA. 2021;325:1443-1463. doi: 10.1001/jama.2020.26498
4. Dawson-Hughes B, Staten MA, Knowler WC, et al. Intratrial exposure to vitamin D and new-onset diabetes among adults with prediabetes: a secondary analysis from the Vitamin D and Type 2 Diabetes (D2d) Study. Diabetes Care. 2020;43:2916-2922. doi: 10.2337/dc20-1765
5. Manson JE, Cook NR, Lee I-M, et al. Vitamin D supplements and prevention of cancer and cardiovascular disease. N Engl J Med. 2019;380:33-44. doi: 10.1056/NEJMoa1809944
6. Acharya P, Dalia T, Ranka S, et al. The effects of vitamin D supplementation and 25-hydroxyvitamin D levels on the risk of myocardial infarction and mortality. J Endocr Soc. 2021;5:bvab124. doi: 10.1210/jendso/bvab124
7. Kaufman HW, Niles JK, Kroll MH, et al. SARS-CoV-2 positivity rates associated with circulating 25-hydroxyvitamin D levels. PLoS One. 2020;15:e0239252. doi: 10.1371/journal.pone.0239252
8. National Institutes of Health. Vitamin D. COVID-19 treatment guidelines. Updated April 21, 2021. Accessed November 18, 2021. www.covid19treatmentguidelines.nih.gov/therapies/supplements/vitamin-d/
1. Campos-Outcalt D. How to proceed when it comes to vitamin D. J Fam Pract. 2021;70:289-292. doi: 10.12788/jfp.0215
2. Grant WB, Boucher BJ, Bhattoa HP, et al. Why vitamin D clinical trials should be based on 25-hydroxyvitamin D concentrations. J Steroid Biochem Mol Biol. 2018;177:266-269. doi: 10.1016/j.jsbmb.2017.08.009
3. Dawson-Hughes B, Staten MA, Knowler WC, et al. Intratrial exposure to vitamin D and new-onset diabetes among adults with prediabetes: a secondary analysis from the Vitamin D and Type 2 Diabetes (D2d) Study. Diabetes Care. 2020;43:2916-2922. doi: 10.2337/dc20-1765
4. Manson JE, Cook NR, Lee I-M, et al. Vitamin D supplements and prevention of cancer and cardiovascular disease. N Engl J Med. 2019;380:33-44. doi: 10.1056/NEJMoa1809944
5. Acharya P, Dalia T, Ranka S, et al. The effects of vitamin D supplementation and 25-hydroxyvitamin D levels on the risk of myocardial infarction and mortality. J Endocr Soc. 2021;5:bvab124. doi: 10.1210/jendso/bvab124
6. Kaufman HW, Niles JK, Kroll MH, et al. SARS-CoV-2 positivity rates associated with circulating 25-hydroxyvitamin D levels. PLoS One. 2020;15:e0239252. doi: 10.1371/journal.pone.0239252
The recent Practice Alert by Dr. Campos-Outcalt, “How to proceed when it comes to vitamin D” (J Fam Pract. 2021;70:289-292) claimed that the value of vitamin D supplements for prevention is nil or still unknown.1 Most of the references cited in support of this statement were centered on randomized controlled trials (RCTs) based on vitamin D dose rather than achieved 25-hydroxyvitamin D [25(OH)D] concentration. Since the health effects of vitamin D supplementation are correlated with 25(OH)D concentration, the latter should be used to evaluate the results of vitamin D RCTs—a point I made in my 2018 article on the topic.2
For example, in the Vitamin D and Type 2 Diabetes (D2d) Study, in which participants in the treatment arm received 4000 IU/d vitamin D3, there was no reduced rate of progression from prediabetes to diabetes. However, when 25(OH)D concentrations were analyzed for those in the vitamin D arm during the trial, the risk was found to be reduced by 25% (hazard ratio [HR] = 0.75; 95% CI, 0.68-0.82) per 10 ng/mL increase in 25(OH)D.3
Another trial, the Harvard-led VITamin D and OmegA-3 TriaL (VITAL), enrolled more than 25,000 participants, with the treatment arm receiving 2000 IU/d vitamin D3.4 There were no significant reductions in incidence of either cancer or cardiovascular disease for the entire group. The mean baseline 25(OH)D concentration for those for whom values were provided was 31 ng/mL (32.2 ng/mL for White participants, 24.9 ng/mL for Black participants). However, there were ~25% reductions in cancer risk among Black participants (who had lower 25(OH)D concentrations than White participants) and those with a body mass index < 25. A posthoc analysis suggested a possible benefit related to the rate of total cancer deaths.
A recent article reported the results of long-term vitamin D supplementation among Veterans Health Administration patients who had an initial 25(OH)D concentration of < 20 ng/mL.5 For those who were treated with vitamin D and achieved a 25(OH)D concentration of > 30 ng/mL (compared to those who were untreated and had an average concentration of < 20 ng/mL), the risk of myocardial infarction was 27% lower (HR = 0.73; 95% CI, 0.55-0.96) and the risk of all-cause mortality was reduced by 39% (HR = 0.61; 95% CI, 0.56-0.67).
An analysis of SARS-CoV-2 positivity examined data for more than 190,000 patients in the United States who had serum 25(OH)D concentration measurements taken up to 1 year prior to their SARS-CoV-2 test. Positivity rates were 12.5% (95% CI, 12.2%-12.8%) for those with a 25(OH)D concentration < 20 ng/mL vs 5.9% (95% CI, 5.5%-6.4%) for those with a 25(OH)D concentration ≥55 ng/mL.6
Thus, there are significant benefits of vitamin D supplementation to achieve a 25(OH)D concentration of 30 to 60 ng/mL for important health outcomes.
Continue to: Author's Response
Author's response
I appreciate the letter from Dr. Grant in response to my previous Practice Alert, as it provides an opportunity to make some important points about assessment of scientific evidence and drawing conclusions based on sound methodology. There is an overabundance of scientific literature published, much of which is of questionable quality, meaning a “study” or 2 can be found to support any preconceived point of view.
In 2011, the Institute of Medicine (now the National Academy of Medicine) published a series of recommendations on how trustworthy recommendations and guidelines should be produced.1,2 Key among the steps recommended is a full assessment of the totality of the literature on the subject by an independent, nonconflicted panel. This should be based on a systematic review that includes standard search methods to find all pertinent articles, an assessment of the quality of each study using standardized tools, and an overall assessment of the quality of the evidence. A high-quality systematic review meeting these standards was the basis for my review article on vitamin D.3
To challenge the findings of the unproven benefits of vitamin D, Dr. Grant cited 4 studies to support the purported benefit of achieving a specific serum 25(OH)D level to prevent cardiovascular disease, diabetes, cancer, and COVID-19. After reading these studies, I would not consider any of them a “game changer.”
The first study was restricted to those with prediabetes, had limited follow-up (mean of 2.5 years), and found different results for those with the same 25(OH)D concentrations in the placebo and treatment groups.4 The second study was a large, well-conducted clinical trial that found no benefit of vitamin D supplementation in preventing cancer and cardiovascular disease.5 While Dr. Grant claims that benefits were found for some subgroups, I could locate only the statistics on cancer incidence in Black participants, and the confidence intervals showed no statistically significant benefit. It is always questionable to look at multiple outcomes in multiple subgroups without a prior hypothesis because of the likely occurrence of chance findings in so many comparisons. The third was a retrospective observational study with all the potential biases and challenges to validity that such studies present.6 A single study, especially 1 with observational methods, almost never conclusively settles a point.
The role of vitamin D in the prevention or treatment of COVID-19 is an aspect that was not covered in the systematic review by the US Preventive Services Task Force. The study on this issuecited by Dr. Grant was a large retrospective observational study that found an inverse relationship between serum 25(OH)D levels and SARS-CoV-2 positivity rates.7 This is 1 observational study with interesting results. However, I believe the conclusion of the National Institutes of Health is currently still the correct one: “There is insufficient evidence to recommend either for or against the use of vitamin D for the prevention or treatment of COVID-19.”8
With time and further research, Dr. Grant may eventually prove to be correct on specific points. However, when challenging a high-quality systematic review, one must assess the quality of the studies used while also placing them in context of the totality of the literature.
Doug Campos-Outcalt, MD, MPA
Phoenix, AZ
References
1. Institute of Medicine. Finding What Works in Health Care. The National Academy Press, 2011.
2. Institute of Medicine. Clinical Practice Guidelines We Can Trust. The National Academy Press, 2011.
3. Kahwati LC, LeBlanc E, Weber RP, et al. Screening for vitamin D deficiency in adults; updated evidence report and systematic review for the US Preventive Services Task Force. JAMA. 2021;325:1443-1463. doi: 10.1001/jama.2020.26498
4. Dawson-Hughes B, Staten MA, Knowler WC, et al. Intratrial exposure to vitamin D and new-onset diabetes among adults with prediabetes: a secondary analysis from the Vitamin D and Type 2 Diabetes (D2d) Study. Diabetes Care. 2020;43:2916-2922. doi: 10.2337/dc20-1765
5. Manson JE, Cook NR, Lee I-M, et al. Vitamin D supplements and prevention of cancer and cardiovascular disease. N Engl J Med. 2019;380:33-44. doi: 10.1056/NEJMoa1809944
6. Acharya P, Dalia T, Ranka S, et al. The effects of vitamin D supplementation and 25-hydroxyvitamin D levels on the risk of myocardial infarction and mortality. J Endocr Soc. 2021;5:bvab124. doi: 10.1210/jendso/bvab124
7. Kaufman HW, Niles JK, Kroll MH, et al. SARS-CoV-2 positivity rates associated with circulating 25-hydroxyvitamin D levels. PLoS One. 2020;15:e0239252. doi: 10.1371/journal.pone.0239252
8. National Institutes of Health. Vitamin D. COVID-19 treatment guidelines. Updated April 21, 2021. Accessed November 18, 2021. www.covid19treatmentguidelines.nih.gov/therapies/supplements/vitamin-d/
1. Campos-Outcalt D. How to proceed when it comes to vitamin D. J Fam Pract. 2021;70:289-292. doi: 10.12788/jfp.0215
2. Grant WB, Boucher BJ, Bhattoa HP, et al. Why vitamin D clinical trials should be based on 25-hydroxyvitamin D concentrations. J Steroid Biochem Mol Biol. 2018;177:266-269. doi: 10.1016/j.jsbmb.2017.08.009
3. Dawson-Hughes B, Staten MA, Knowler WC, et al. Intratrial exposure to vitamin D and new-onset diabetes among adults with prediabetes: a secondary analysis from the Vitamin D and Type 2 Diabetes (D2d) Study. Diabetes Care. 2020;43:2916-2922. doi: 10.2337/dc20-1765
4. Manson JE, Cook NR, Lee I-M, et al. Vitamin D supplements and prevention of cancer and cardiovascular disease. N Engl J Med. 2019;380:33-44. doi: 10.1056/NEJMoa1809944
5. Acharya P, Dalia T, Ranka S, et al. The effects of vitamin D supplementation and 25-hydroxyvitamin D levels on the risk of myocardial infarction and mortality. J Endocr Soc. 2021;5:bvab124. doi: 10.1210/jendso/bvab124
6. Kaufman HW, Niles JK, Kroll MH, et al. SARS-CoV-2 positivity rates associated with circulating 25-hydroxyvitamin D levels. PLoS One. 2020;15:e0239252. doi: 10.1371/journal.pone.0239252
Waxy fingers and skin tethering
A 73-year-old man with longstanding, poorly controlled type 1 diabetes (T1D) and worsening paresthesia presented to the dermatology clinic following a painless thermal burn of his fingertips from holding a hot cup of coffee. The patient’s paresthesia in a stocking-and-glove distribution was attributable to diabetes-associated polyneuropathy. Two years prior, he had been diagnosed with mildly symptomatic, diabetes-associated scleredema of his upper back and treated with topical corticosteroids.
Physical examination revealed tense bullae on the pads of all 5 digits of his right hand (FIGURE 1). Localized, waxy tightening of the skin was noted on all digits of both hands, along with mild tethering of thickened skin on the right palm.
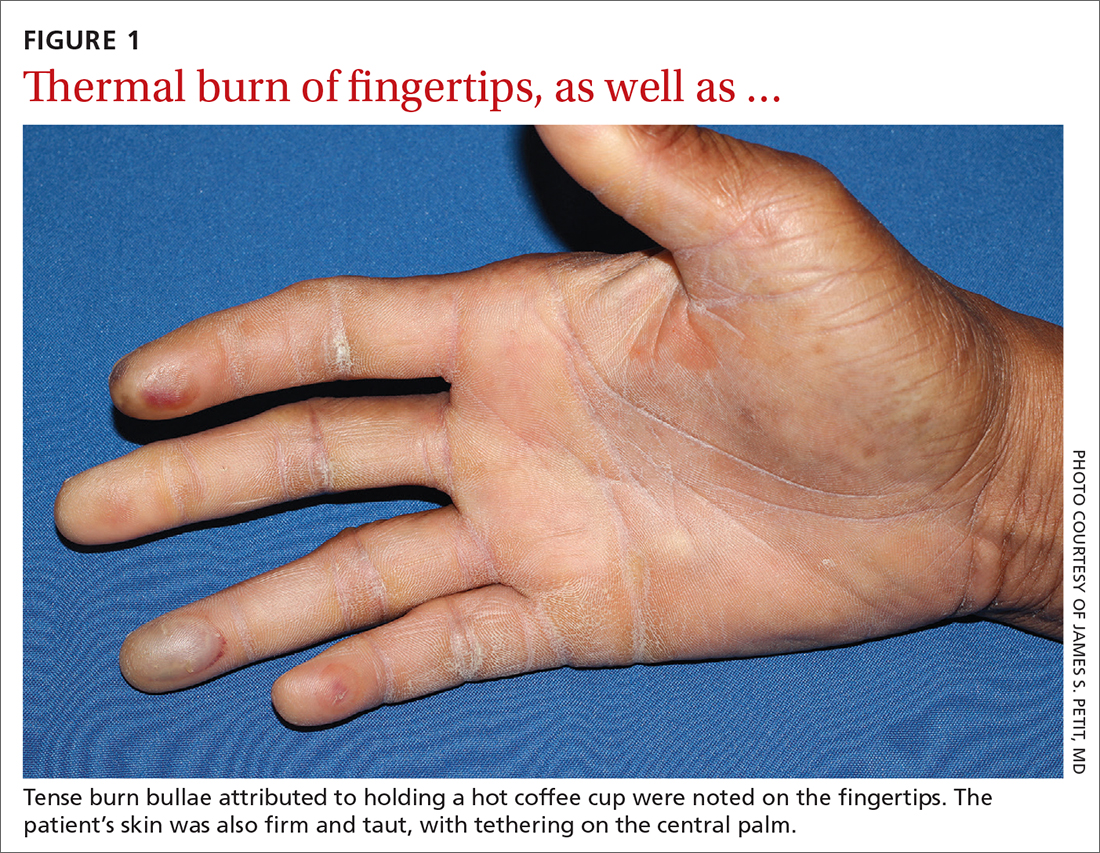
WHAT IS YOUR DIAGNOSIS?
HOW WOULD YOU TREAT THIS PATIENT?
Diagnosis: Diabetic hand syndrome
Subtle, early signs of diabetic sclerodactyly and Dupuytren contracture (DC) were observed in the context of an existing diagnosis of T1D, leading to a diagnosis of diabetic hand syndrome.
Sclerodactyly, a thickening and tightening of the skin, is a characteristic component of limited and systemic sclerosis. Sclerodactyly is not commonly observed in association with type 1 and type 2 diabetes; however, when it does occur, it is typically found in patients who have had uncontrolled diabetes for some time.1-3 (In the context of diabetes, this skin manifestation is known as pseudoscleroderma and scleredema diabeticorum.) In 1 study of 238 patients with T1D, the prevalence of this diabetes manifestation was 39%, with a range of 10% to 50% also reported.3
Diabetic hand syndrome is an umbrella term for the constellation of debilitating fibroproliferative sequelae of the hand rendered by diabetes.3 In addition to diabetic sclerodactyly, diabetic hand syndrome includes limited joint mobility (LJM), or diabetic cheiroarthropathy, which typically manifests with either the “prayer sign” (the inability of the palms to obtain full approximation while the wrists are maximally flexed) or the “tabletop sign” (the inability of the palm to flatten completely against the surface of a table) (FIGURE 2).4,5 The prevalence of LJM has been reported to range from 8% to 50% of patients diagnosed with longstanding, uncontrolled diabetes.4
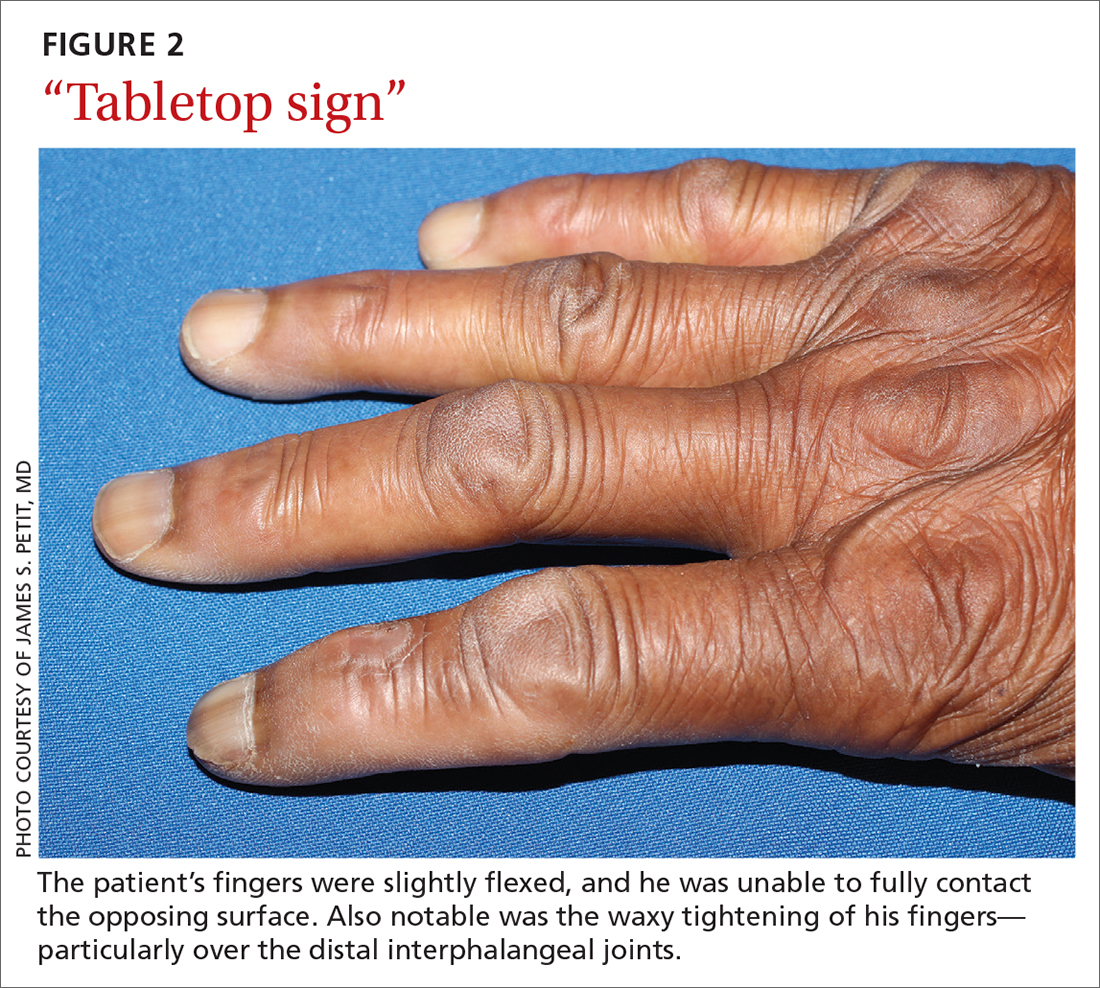
Other musculoskeletal abnormalities seen in this syndrome include: DC, often found clinically as a palpable palmar nodule that ultimately results in a flexion contracture of the affected finger; stenosing tenosynovitis, or trigger finger, in which a reproducible locking phenomenon occurs on flexion of a finger, typically in the first, third, and fourth digits; and carpal tunnel syndrome, a median nerve entrapment neuropathy that results in pain and/or paresthesia over the thumb, index, middle, and lateral half of the ring fingers.3-5
Secondary symptoms can signal long-term degenerative disease
Stocking-and-glove distribution polyneuropathy with deterioration of tactile sensation is a common sequela of diabetes, especially as disease severity progresses.2 Although the exact pathogenesis remains unclear, it has been proposed that both diabetic polyneuropathy and increased skin thickness occur secondary to long-term degenerative microvascular disease.
Continue to: Specifically, prolonged...
Specifically, prolonged hyperglycemia and secondary chronic inflammation set the stage for protein glycation, with formation of advanced glycation end products (AGEs). It is thought that these AGEs in cutaneous and connective tissues stiffen collagen, leading to scleroderma-like skin changes.2
These microvascular and fibroproliferative changes are also considered important contributors in the etiology of DC and trigger finger, ultimately leading to increased collagen deposition and fascial thickening.4,5 In addition, increased activation of the polyol pathway may occur secondary to hyperglycemia, resulting in increased intracellular water and cellular edema.5
The differential is comprisedof components of systemic disease
The differential diagnosis includes tropical diabetic hand, autoimmune-related scleroderma (also called systemic sclerosis), complex regional pain syndrome, and diabetic scleredema.
Tropical diabetic hand, a potentially dangerous infection, is generally found only in tropical regions and in the setting of injury.5,6
Autoimmune-related scleroderma may be diagnosed alongside other signs and symptoms of CREST: calcinosis, Raynaud phenomenon, esophageal dysmotility, sclerodactyly, and telangiectasia. In the absence of other signs and symptoms, and in the presence of uncontrolled diabetes, biopsy would be needed to definitively diagnose it. Clinically, diabetic hand can be distinguished with concurrent involvement of the upper back.
Continue to: Complex regional pain syndrome
Complex regional pain syndrome is characterized by chronic, disabling pain, swelling, and motor impairment that frequently affect the hand, often secondary to surgery or trauma.5,7 This diagnosis differs from the generally painless skin hardening of diabetic hand.
The co-existence of diabetic scleredema and diabetic sclerodactyly has been previously reported, although the onset of each condition is often temporally distinct.8 In contrast to diabetic sclerodactyly, the firm indurated skin characteristic of diabetic scleredema (which our patient had) initially involves the shoulders and neck and may progress over the trunk, including the upper back, typically sparing the distal extremities. Of note, the dermis in scleredema is thickened with marked deposition of mucopolysaccharide.9
Glycemic control is paramount
Studies of patients with diabetes who have thick, waxy skin and LJM have shown that tight glycemic control may reduce skin thickness and palmar fascia fibrosis.3,5,9 Thus, in this patient with poorly controlled T1D, diabetic sclerodactyly, early DC, and second-degree burns attributable to advanced polyneuropathy, tightened glycemic control is logical and warranted. Such control could potentially impact the trajectory and morbidity of skin and musculoskeletal manifestations in this broad-reaching disease.
Although there are limited treatments for mobility-related symptoms of diabetic hand syndrome, physiotherapy is recommended in more severe stages of disease to increase joint range of motion.4,5 More severe cases of DC and trigger finger have been successfully treated with topical steroids, corticosteroid injections, and surgery.4,5 Simply stated—and in line with compulsive foot care—the diabetic milieu necessitates clinicians’ close attention to the hands. Components of diabetic hand, LJM, DC, or trigger finger may indicate a need to screen not only for diabetes in a patient previously undiagnosed but also, importantly, for other sequelae of diabetes, including retinopathy.4,5
Our patient was treated with a moderate-potency topical steroid, triamcinolone 0.1% cream, and was advised to continue optimizing glycemic control with the aid of his primary care physician. It was unclear whether the patient improved with use, as he was lost to follow-up.
1. Yosipovitch G, Hodak E, Vardi P, et al. The prevalence of cutaneous manifestations in IDDM patients and their association with diabetes risk factors and microvascular complications. Diabetes Care. 1998;21:506-509. doi: 10.2337/diacare.21.4.506
2. Redmond CL, Bain GI, Laslett LL, et al. Deteriorating tactile sensation in patients with hand syndromes associated with diabetes: a two-year observational study. J Diabetes Complications. 2012;26:313-318. doi: 10.1016/j.jdiacomp.2012.04.009
3. Rosen J, Yosipovitch G. Skin manifestations of diabetes mellitus. In: Feingold KR, Anawalt B, Boyce A, et al, eds. Endotext. 2018. South Dartmouth, MA. Accessed November 30, 2021. www.ncbi.nlm.nih.gov/books/NBK481900/
4. Goyal A, Tiwari V, Gupta Y. Diabetic hand: a neglected complication of diabetes mellitus. Cureus. 2018;10:e2772. doi: 10.7759/cureus.2772
5. Papanas N, Maltezos E. The diabetic hand: a forgotten complication? J Diabetes Complications. 2010;24:154-162. doi: 10.1016/j.jdiacomp.2008.12.009
6. Gill GV, Famuyiwa OO, Rolfe M, et al. Tropical diabetic hand syndrome. Lancet. 1998;351:113-114. doi: 10.1016/S0140-6736(05)78146-0
7. Goh EL, Chidambaram S, Ma D. Complex regional pain syndrome: a recent update. Burns Trauma. 2017;5:2. doi: 10.1186/s41038-016-0066-4
8. Gruson LM, Franks A Jr. Scleredema and diabetic sclerodactyly. Dermatol Online J. 2005;11:3.
9. Shazzad MN, Azad AK, Abdal SJ, et al. Scleredema diabeticorum – a case report. Mymensingh Med J. 2015;24:606-609.
A 73-year-old man with longstanding, poorly controlled type 1 diabetes (T1D) and worsening paresthesia presented to the dermatology clinic following a painless thermal burn of his fingertips from holding a hot cup of coffee. The patient’s paresthesia in a stocking-and-glove distribution was attributable to diabetes-associated polyneuropathy. Two years prior, he had been diagnosed with mildly symptomatic, diabetes-associated scleredema of his upper back and treated with topical corticosteroids.
Physical examination revealed tense bullae on the pads of all 5 digits of his right hand (FIGURE 1). Localized, waxy tightening of the skin was noted on all digits of both hands, along with mild tethering of thickened skin on the right palm.
WHAT IS YOUR DIAGNOSIS?
HOW WOULD YOU TREAT THIS PATIENT?
Diagnosis: Diabetic hand syndrome
Subtle, early signs of diabetic sclerodactyly and Dupuytren contracture (DC) were observed in the context of an existing diagnosis of T1D, leading to a diagnosis of diabetic hand syndrome.
Sclerodactyly, a thickening and tightening of the skin, is a characteristic component of limited and systemic sclerosis. Sclerodactyly is not commonly observed in association with type 1 and type 2 diabetes; however, when it does occur, it is typically found in patients who have had uncontrolled diabetes for some time.1-3 (In the context of diabetes, this skin manifestation is known as pseudoscleroderma and scleredema diabeticorum.) In 1 study of 238 patients with T1D, the prevalence of this diabetes manifestation was 39%, with a range of 10% to 50% also reported.3
Diabetic hand syndrome is an umbrella term for the constellation of debilitating fibroproliferative sequelae of the hand rendered by diabetes.3 In addition to diabetic sclerodactyly, diabetic hand syndrome includes limited joint mobility (LJM), or diabetic cheiroarthropathy, which typically manifests with either the “prayer sign” (the inability of the palms to obtain full approximation while the wrists are maximally flexed) or the “tabletop sign” (the inability of the palm to flatten completely against the surface of a table) (FIGURE 2).4,5 The prevalence of LJM has been reported to range from 8% to 50% of patients diagnosed with longstanding, uncontrolled diabetes.4
Other musculoskeletal abnormalities seen in this syndrome include: DC, often found clinically as a palpable palmar nodule that ultimately results in a flexion contracture of the affected finger; stenosing tenosynovitis, or trigger finger, in which a reproducible locking phenomenon occurs on flexion of a finger, typically in the first, third, and fourth digits; and carpal tunnel syndrome, a median nerve entrapment neuropathy that results in pain and/or paresthesia over the thumb, index, middle, and lateral half of the ring fingers.3-5
Secondary symptoms can signal long-term degenerative disease
Stocking-and-glove distribution polyneuropathy with deterioration of tactile sensation is a common sequela of diabetes, especially as disease severity progresses.2 Although the exact pathogenesis remains unclear, it has been proposed that both diabetic polyneuropathy and increased skin thickness occur secondary to long-term degenerative microvascular disease.
Continue to: Specifically, prolonged...
Specifically, prolonged hyperglycemia and secondary chronic inflammation set the stage for protein glycation, with formation of advanced glycation end products (AGEs). It is thought that these AGEs in cutaneous and connective tissues stiffen collagen, leading to scleroderma-like skin changes.2
These microvascular and fibroproliferative changes are also considered important contributors in the etiology of DC and trigger finger, ultimately leading to increased collagen deposition and fascial thickening.4,5 In addition, increased activation of the polyol pathway may occur secondary to hyperglycemia, resulting in increased intracellular water and cellular edema.5
The differential is comprisedof components of systemic disease
The differential diagnosis includes tropical diabetic hand, autoimmune-related scleroderma (also called systemic sclerosis), complex regional pain syndrome, and diabetic scleredema.
Tropical diabetic hand, a potentially dangerous infection, is generally found only in tropical regions and in the setting of injury.5,6
Autoimmune-related scleroderma may be diagnosed alongside other signs and symptoms of CREST: calcinosis, Raynaud phenomenon, esophageal dysmotility, sclerodactyly, and telangiectasia. In the absence of other signs and symptoms, and in the presence of uncontrolled diabetes, biopsy would be needed to definitively diagnose it. Clinically, diabetic hand can be distinguished with concurrent involvement of the upper back.
Continue to: Complex regional pain syndrome
Complex regional pain syndrome is characterized by chronic, disabling pain, swelling, and motor impairment that frequently affect the hand, often secondary to surgery or trauma.5,7 This diagnosis differs from the generally painless skin hardening of diabetic hand.
The co-existence of diabetic scleredema and diabetic sclerodactyly has been previously reported, although the onset of each condition is often temporally distinct.8 In contrast to diabetic sclerodactyly, the firm indurated skin characteristic of diabetic scleredema (which our patient had) initially involves the shoulders and neck and may progress over the trunk, including the upper back, typically sparing the distal extremities. Of note, the dermis in scleredema is thickened with marked deposition of mucopolysaccharide.9
Glycemic control is paramount
Studies of patients with diabetes who have thick, waxy skin and LJM have shown that tight glycemic control may reduce skin thickness and palmar fascia fibrosis.3,5,9 Thus, in this patient with poorly controlled T1D, diabetic sclerodactyly, early DC, and second-degree burns attributable to advanced polyneuropathy, tightened glycemic control is logical and warranted. Such control could potentially impact the trajectory and morbidity of skin and musculoskeletal manifestations in this broad-reaching disease.
Although there are limited treatments for mobility-related symptoms of diabetic hand syndrome, physiotherapy is recommended in more severe stages of disease to increase joint range of motion.4,5 More severe cases of DC and trigger finger have been successfully treated with topical steroids, corticosteroid injections, and surgery.4,5 Simply stated—and in line with compulsive foot care—the diabetic milieu necessitates clinicians’ close attention to the hands. Components of diabetic hand, LJM, DC, or trigger finger may indicate a need to screen not only for diabetes in a patient previously undiagnosed but also, importantly, for other sequelae of diabetes, including retinopathy.4,5
Our patient was treated with a moderate-potency topical steroid, triamcinolone 0.1% cream, and was advised to continue optimizing glycemic control with the aid of his primary care physician. It was unclear whether the patient improved with use, as he was lost to follow-up.
1. Yosipovitch G, Hodak E, Vardi P, et al. The prevalence of cutaneous manifestations in IDDM patients and their association with diabetes risk factors and microvascular complications. Diabetes Care. 1998;21:506-509. doi: 10.2337/diacare.21.4.506
2. Redmond CL, Bain GI, Laslett LL, et al. Deteriorating tactile sensation in patients with hand syndromes associated with diabetes: a two-year observational study. J Diabetes Complications. 2012;26:313-318. doi: 10.1016/j.jdiacomp.2012.04.009
3. Rosen J, Yosipovitch G. Skin manifestations of diabetes mellitus. In: Feingold KR, Anawalt B, Boyce A, et al, eds. Endotext. 2018. South Dartmouth, MA. Accessed November 30, 2021. www.ncbi.nlm.nih.gov/books/NBK481900/
4. Goyal A, Tiwari V, Gupta Y. Diabetic hand: a neglected complication of diabetes mellitus. Cureus. 2018;10:e2772. doi: 10.7759/cureus.2772
5. Papanas N, Maltezos E. The diabetic hand: a forgotten complication? J Diabetes Complications. 2010;24:154-162. doi: 10.1016/j.jdiacomp.2008.12.009
6. Gill GV, Famuyiwa OO, Rolfe M, et al. Tropical diabetic hand syndrome. Lancet. 1998;351:113-114. doi: 10.1016/S0140-6736(05)78146-0
7. Goh EL, Chidambaram S, Ma D. Complex regional pain syndrome: a recent update. Burns Trauma. 2017;5:2. doi: 10.1186/s41038-016-0066-4
8. Gruson LM, Franks A Jr. Scleredema and diabetic sclerodactyly. Dermatol Online J. 2005;11:3.
9. Shazzad MN, Azad AK, Abdal SJ, et al. Scleredema diabeticorum – a case report. Mymensingh Med J. 2015;24:606-609.
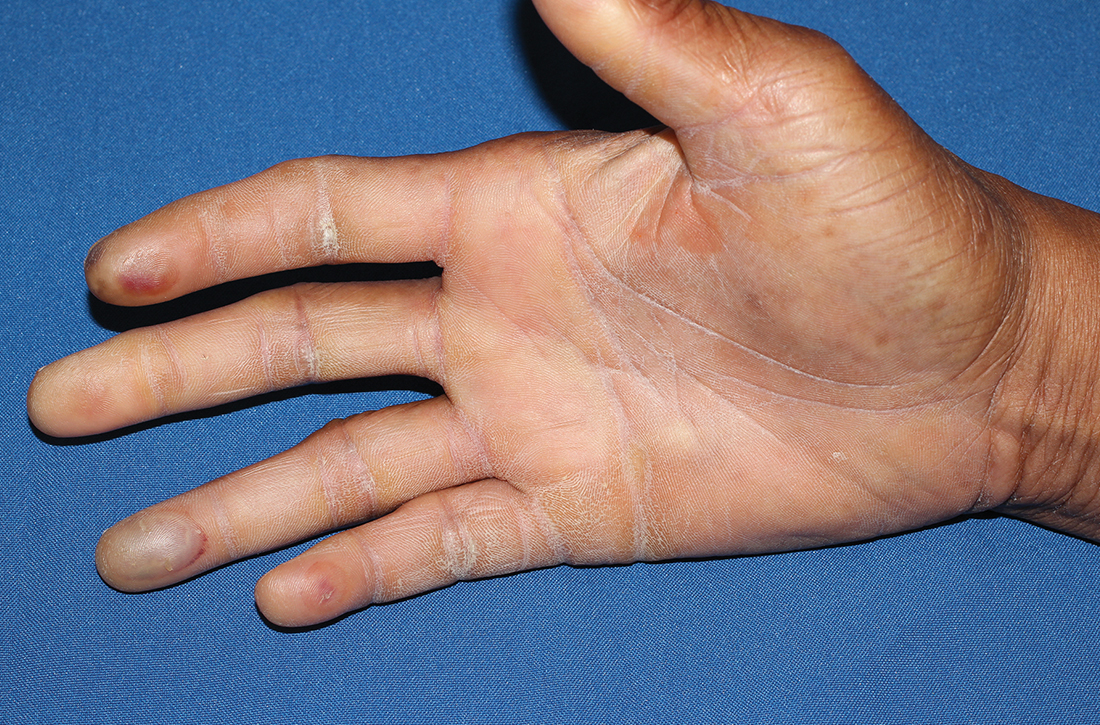
Cancer-related thyroidectomy linked to increased diabetes risk
People with thyroid cancer treated with thyroidectomy have as much as a 40% increased risk of developing type 2 diabetes, regardless of their age, with the elevated risk observed with low as well as high doses of postoperative levothyroxine, new research shows.
“This is the first population-based study to demonstrate an elevated risk of type 2 diabetes in postthyroidectomy patients with thyroid cancer, compared with that in matched controls,” wrote the authors of the research, published recently in the Journal of Clinical Endocrinology & Metabolism.
“Notably, there was a U-shaped relationship between postoperative levothyroxine dosage, a surrogate marker of TSH suppression, and the risk of type 2 diabetes,” said Hye Jin Yoo, MD, of the division of endocrinology and metabolism, Korea University College of Medicine, Seoul, and colleagues.
While other studies have linked thyroidectomy for thyroid cancer with an elevated risk for other metabolic conditions, including coronary heart disease and ischemic stroke, the relatively high diabetes risk is unexpected, said Tyler Drake, MD, an endocrinologist with the Minneapolis VA Health Care System.
“A 40% increased risk of diabetes is a big surprise,” he said in an interview.
“Diabetes is very common, with about one in 10 U.S. adults having type 2 diabetes, but a 40% increased risk in thyroid cancer patients is higher than I see in my clinical practice. [However], it is important to note that the [highest] risk was predominantly among the groups on the lowest and highest doses of levothyroxine,” said Dr. Drake, assistant professor of medicine at the University of Minnesota, Minneapolis.
U-shaped relationship between levothyroxine dose and diabetes risk
The findings are from a study of 36,377 patients with thyroid cancer in the National Health Insurance Service (NHIS) database in Korea who had undergone a thyroidectomy between 2004 and 2013.
The patients were matched 1:1 with controls who had nonthyroid cancers. Their mean age was 46.6 years, about 30% were male, and their mean body mass index was 23.8 kg/m2.
Over a mean follow-up of 6.6 years, the patients with thyroid cancer had a significantly higher risk of developing type 2 diabetes, at a rate of 47.5% (10,812) compared with 36.9% (9414; HR, 1.43; P < .001) in the control group, after adjustment for factors such as age, sex, BMI, smoking, drinking, systolic blood pressure, and fasting glucose.
The risk of type 2 diabetes among those with thyroid cancer was higher among the 83.2% of patients who underwent a total thyroidectomy compared with the 16.8% who had a unilateral lobectomy (HR, 1.06; P < .001).
In addition, those with thyroid cancer who received the lowest as well as highest dosages of levothyroxine had significantly higher risks of type 2 diabetes compared with controls (HR, 1.50 and 1.39, respectively; both P < .001).
A closer look at quartiles of levothyroxine dosing showed the first (lowest) quartile (defined as a mean levothyroxine dosage of < 101 mcg/day) was associated with an increased risk of type 2 diabetes compared with the second quartile group (101-127 mcg/day; HR, 1.45), as was the fourth quartile (≥ 150 mcg/day; HR, 1.37), while a decreased risk of type 2 diabetes was observed in the third quartile group (128-149 mcg/day versus the second quartile group; HR, 0.91).
“This result suggests a U-shaped relationship between the mean levothyroxine dosage and risk of type 2 diabetes in postthyroidectomy patients with thyroid cancer,” the authors said.
However, “consistent with previous studies, the present study showed that the highest risk of type 2 diabetes was observed in patients with thyroid cancer who were treated with the lowest mean dosage of levothyroxine,” they noted.
“This result suggests that inadequate supplementation of thyroid hormones may worsen glucose metabolism and should therefore be avoided.”
Potential mechanisms
Abnormal thyroid function, including hypo- and hyperthyroidism, following thyroidectomy and subsequent treatment with levothyroxine, is known to have potentially detrimental effects on glucose regulation among patients with thyroid cancer.
The potential mechanisms linking hypothyroidism with diabetes specifically include the possibility that insulin becomes unable to promote the utilization of glucose by muscles and adipose tissue. However, thyroid hormone replacement has been associated with a normalization of insulin sensitivity, the authors noted.
Meanwhile, glucose intolerance is common among patients with hyperthyroidism, largely due to an increase in hepatic glucose production, and likewise, the normalization of thyroid levels among those treated with methimazole has been linked to normalization of glucose and lipid metabolism alterations.
Dr. Drake noted that an important study limitation is that patients were analyzed based on their levothyroxine dose and not their TSH values, which the authors explain was due to the unavailability of the TSH values.
“By looking at levothyroxine doses, and not TSH values, it is possible some patients were being improperly treated with either too much or too little levothyroxine,” Dr. Drake noted.
Control group should have had hypothyroidism
The findings nevertheless shed light on the risk of diabetes following thyroidectomy for thyroid cancer, Anupam Kotwal, MD, commented on the study.
“This study is significant because it addresses an important topic exploring the link between thyroid dysfunction and metabolic disease, in this case ... hypothyroidism, due to surgery for thyroid cancer and type 2 diabetes,” Dr. Kotwal, assistant professor of medicine in the division of diabetes, endocrinology & metabolism at the University of Nebraska Medical Center, Omaha, said in an interview.
In terms of other limitations, Dr. Kotwal noted that the controls did not have hypothyroidism; therefore, “from this study, it is impossible to confirm whether hypothyroidism from any cause would be associated with higher incidence of diabetes or if it is specific to thyroid surgery for thyroid cancer.
“It would have been useful to have a control group of autoimmune primary hypothyroidism to evaluate the rate of diabetes during a similar follow-up duration,” Dr. Kotwal said.
“Hence, cohort studies with more granular data such as degree of TSH suppression and having a control group of hypothyroid patients due to autoimmune thyroid disease are needed to better understand this risk.”
Dr. Kotwal and Dr. Drake have reported no relevant financial relationships.
A version of this article first appeared on Medscape.com.