User login
Daycare Providers’ Little Helper
It is no secret that we have a daycare problem in this country. Twenty percent of families spend more than $36,000 for child care annually. Three quarters of a single parent’s income is spent on infant care. The result is that more than $122 billion is syphoned out of our economy in lost productivity and income.
How we got into this situation is less clear. Women who once were stay-at-home moms have moved into the workplace. Families are more mobile and grandparents who had been a source of childcare may live hours away. And, when they are nearby grandparents may themselves been forced to remain employed for economic reasons.

Despite the increase demand the market has failed to respond with more daycare providers because with a median hourly wage of less than $15.00 it is difficult to attract applicants from a pool of potential employees that is already in great demand.
And, let’s be honest, long hours cooped up inside with infants and toddlers isn’t the right job for everyone. For the most successful, although maybe not financially, providing daycare is truly a labor of love. There are high school and community college courses taught on child development and day care management. Experienced providers can be a source of tips-of-the trade to those just starting out. But, when there are three infants crying, two diapers to be changed, and a toddler heading toward a tantrum, two experienced providers may not be enough to calm the turbulent waters.
A recent article in my local newspaper provided stark evidence of how serious our daycare situation has become. Although the daycare owner denies the allegation, the Department of Health and Human Service told the parents that the investigation currently supports their complaints that the children had been given melatonin gummies without their permission. Final action is pending but it is likely the daycare will lose its license. Not surprisingly the parents have already removed their children.
Curious about whether this situation was an isolated event, it didn’t take Google too long to find evidence of other daycares in which children had been given sleep-related medications without their parents’ permission. In May 2024 a daycare provider and three of her employees in Manchester, New Hampshire, were arrested and charged with endangering the welfare of a child after allegedly spiking their charges food with melatonin. Lest you think drugging infants in daycare is just a New England thing, my research found a news story dating back to 2003 that reported on several cases in which daycare providers had been administering diphenhydramine without parents permission. In one instance there was a fatal outcome. While melatonin does not pose a health risk on a par with diphenhydramine, the issue is the fact that the parents were not consulted.
I suspect that these two incidents in Maine and New Hampshire are not isolated events and melatonin has replaced diphenhydramine as the daycare provider’s “little helper” nationwide. It’s not clear how we as pediatricians can help police this practice, other than suggesting to parents that they initiate dialogues about napping strategies with their daycare providers. Not with an accusatory tone but more of a sharing about what tricks each party uses to make napping happen. It may be that the daycare provider has some valuable and sound advice that the parents can adapt to their home situation. However, if the daycare provider’s explanation for why the child naps well doesn’t sound right or the child is unusually drowsy after daycare visits they should share their concerns with us a pediatric health care advisors.
Dr Wilkoff practiced primary care pediatrics in Brunswick, Maine, for nearly 40 years. He has authored several books on behavioral pediatrics, including “How to Say No to Your Toddler.” Other than a Littman stethoscope he accepted as a first-year medical student in 1966, Dr. Wilkoff reports having nothing to disclose. Email him at pdnews@mdedge.com.
It is no secret that we have a daycare problem in this country. Twenty percent of families spend more than $36,000 for child care annually. Three quarters of a single parent’s income is spent on infant care. The result is that more than $122 billion is syphoned out of our economy in lost productivity and income.
How we got into this situation is less clear. Women who once were stay-at-home moms have moved into the workplace. Families are more mobile and grandparents who had been a source of childcare may live hours away. And, when they are nearby grandparents may themselves been forced to remain employed for economic reasons.
Despite the increase demand the market has failed to respond with more daycare providers because with a median hourly wage of less than $15.00 it is difficult to attract applicants from a pool of potential employees that is already in great demand.
And, let’s be honest, long hours cooped up inside with infants and toddlers isn’t the right job for everyone. For the most successful, although maybe not financially, providing daycare is truly a labor of love. There are high school and community college courses taught on child development and day care management. Experienced providers can be a source of tips-of-the trade to those just starting out. But, when there are three infants crying, two diapers to be changed, and a toddler heading toward a tantrum, two experienced providers may not be enough to calm the turbulent waters.
A recent article in my local newspaper provided stark evidence of how serious our daycare situation has become. Although the daycare owner denies the allegation, the Department of Health and Human Service told the parents that the investigation currently supports their complaints that the children had been given melatonin gummies without their permission. Final action is pending but it is likely the daycare will lose its license. Not surprisingly the parents have already removed their children.
Curious about whether this situation was an isolated event, it didn’t take Google too long to find evidence of other daycares in which children had been given sleep-related medications without their parents’ permission. In May 2024 a daycare provider and three of her employees in Manchester, New Hampshire, were arrested and charged with endangering the welfare of a child after allegedly spiking their charges food with melatonin. Lest you think drugging infants in daycare is just a New England thing, my research found a news story dating back to 2003 that reported on several cases in which daycare providers had been administering diphenhydramine without parents permission. In one instance there was a fatal outcome. While melatonin does not pose a health risk on a par with diphenhydramine, the issue is the fact that the parents were not consulted.
I suspect that these two incidents in Maine and New Hampshire are not isolated events and melatonin has replaced diphenhydramine as the daycare provider’s “little helper” nationwide. It’s not clear how we as pediatricians can help police this practice, other than suggesting to parents that they initiate dialogues about napping strategies with their daycare providers. Not with an accusatory tone but more of a sharing about what tricks each party uses to make napping happen. It may be that the daycare provider has some valuable and sound advice that the parents can adapt to their home situation. However, if the daycare provider’s explanation for why the child naps well doesn’t sound right or the child is unusually drowsy after daycare visits they should share their concerns with us a pediatric health care advisors.
Dr Wilkoff practiced primary care pediatrics in Brunswick, Maine, for nearly 40 years. He has authored several books on behavioral pediatrics, including “How to Say No to Your Toddler.” Other than a Littman stethoscope he accepted as a first-year medical student in 1966, Dr. Wilkoff reports having nothing to disclose. Email him at pdnews@mdedge.com.
High-Dose Atropine Curbs Myopia in Kids Despite Side Effects
TOPLINE:
METHODOLOGY:
- Researchers conducted a secondary analysis of the 3-year results of the MOSAIC trial to investigate the efficacy and safety of different atropine regimens in treatment-naive children aged 6-16 years with a spherical equivalent ≤ −0.50 diopters (D).
- They analyzed data of 199 children in Europe with myopia (mean age, 13.9 years; 60.8% girls) who were randomly assigned to either group 1 (nightly placebo for 2 years followed by 0.05% atropine eye drops for 1 year; n = 66) or group 2 (nightly 0.01% atropine eye drops for 2 years followed by another random assignment to nightly placebo, tapering placebo, or tapering of 0.01% atropine eye drops for 1 year; n = 133).
- The nightly and tapered placebo groups were combined as a single treatment group for the sake of analysis.
- The primary outcome measures included observed changes in the progression of myopia, assessed using cycloplegic spherical equivalent refraction and axial length from month 24 to month 36.
TAKEAWAY:
- Children in the 0.01% atropine then placebo groups showed greater spherical equivalent progression (adjusted difference, –0.13 D; P = .01) and axial elongation (adjusted difference, 0.06 mm; P = .008) than those in the placebo then 0.05% atropine group.
- Children in the placebo then 0.05% atropine group also experienced less axial elongation (P = .04) than those in the 0.01% atropine then tapering 0.01% atropine group.
- Among participants using 0.05% atropine, 15% reported blurred near vision and 8% reported photophobia, whereas 3% reported blurred near vision and 0% reported photophobia in the 0.01% atropine then tapering 0.01% atropine group.
- Despite experiencing adverse events, no participants in the placebo then 0.05% atropine group discontinued treatment, with 92% completing the 36-month visit and 81% adhering to the treatment regimen.
IN PRACTICE:
“Recognizing a 2-year delay in treatment initiation in the group of children originally assigned to placebo, 0.05% atropine eyedrops slowed both myopia progression and axial eye growth over the course of a 1-year period,” the authors of the study wrote.
SOURCE:
This study was led by James Loughman, PhD, of the Centre for Eye Research Ireland, Dublin. It was published online in JAMA Ophthalmology.
LIMITATIONS:
Limitations included smaller sample sizes across treatment groups in year 3 and potential carry-over effects for participants transitioning from 0.01% atropine to placebo or tapered dosing. Because the study lacked an untreated control group, rebound myopia progression could be measured based only on the expected third-year results from the 0.01% atropine then placebo groups. The age of participants during the third year may have affected the ability to detect rebound progression.
DISCLOSURES:
This study was supported partly by a grant from the Health Research Board; Fighting Blindness, Ireland; and Vyluma. Some authors reported receiving grants, nonfinancial support, or consultant fees or having several other ties with Vyluma and other sources.
This article was created using several editorial tools, including artificial intelligence, as part of the process. Human editors reviewed this content before publication. A version of this article appeared on Medscape.com.
Tularemia: A Rare But Nationally Notifiable Disease
The pediatrician’s first patient of the day was an 8-year-old boy, accompanied by both of his parents. It was the boy’s third visit in just over a week for fever and left-sided neck swelling, and the family was understandably anxious for answers.
“The antibiotics don’t seem to be working,” the mother explained. “He still has fever every day, as high as 104, and his neck looks just as swollen.”
A quick review of the chart revealed the boy’s initial diagnosis had been bacterial lymphadenitis, for which amoxicillin-clavulanate had been prescribed. Three days later, given lack of clinical improvement, therapy was transitioned to clindamycin. On examination, the boy was febrile and ill-appearing with a 3-cm by 5-cm tender, non-fluctuant swelling over the left sternocleidomastoid muscle.

The pediatrician ran through a quick mental checklist of diagnostic possibilities for his patient’s continued symptoms. Staphylococcal lymphadenitis still seemed possible. Could the boy be infected with methicillin-resistant Staphylococcus aureus that was also clindamycin resistant? Alternately, perhaps the problem was “source control” and the boy had developed an occult neck abscess that needed to be drained. An ultrasound could help sort that out. Finally, the pediatrician considered less common bacterial causes of lymph node swelling and fever. He placed Bartonella henselae, the cause of cat scratch disease, near the top of his list. “I’ve never seen it,” he told the parents, “But we could also consider tularemia.”
On average, 200 cases of tularemia are reported in the United States each year, and the incidence of disease is increasing, according to a surveillance report released by the Centers for Disease Control and Prevention in December 2023.1
Between 2011 and 2022, 2462 tularemia cases were reported in the United States. That translated to an average annual incidence of 0.064 per 100,000 population, an increase of 56% compared with 2001-2010. Forty-seven states reported at least one case of tularemia, although half of all reported cases came from four states — Arkansas (18%), Kansas (11%), Missouri (11%), and Oklahoma (10%). The incidence of tularemia was highest in children ages 5-9 years old, older men, and American Indian or Alaska Natives individuals. Although cases occurred year-round, 78% had symptom onset May through September.
In the United States, most human cases of tularemia have been arthropod borne, transmitted by the bite of an infected tick or deer fly. Infection also can be spread through contact with infected animals or animal tissue, particularly rabbits, hares, muskrats, prairie dogs, and other rodents, including hamsters. Outbreaks of tularemia have occurred among pet store hamsters, and at least one child in the United States developed tularemia after being bitten by a pet hamster.
Tularemia is almost always associated with fever but other clinical manifestations vary by the type of exposure. Ulceroglandular disease occurs after a tick or deer fly bite or after handling an infected animal. An ulcer develops at the site where the bacteria entered the body, along with enlargement of regional lymph nodes. Less commonly, lymph node swelling can occur without the development of an ulcer. If the bacteria enter through the eye, symptoms include conjunctivitis and swelling of pre-auricular lymph nodes. Eating or drinking contaminated food or water is associated with sore throat, mouth ulcers, tonsillitis, and swelling of lymph glands in the neck. Pneumonic tularemia, the most serious form of the disease, typically happens after inhaling bacteria-containing dust or aerosols and is associated with cough, chest pain, and difficulty breathing. Pneumonic tularemia can develop if other forms of tularemia are untreated, and the bacteria spread to the lung.
Back in the exam room, the pediatrician carefully re-examined the boy’s scalp. A 1-cm poorly healing ulcer on the left occiput added support for the diagnosis of ulceroglandular tularemia, the most common form of the disease in children. Serologic testing ultimately confirmed the diagnosis and the boy’s symptoms resolved with treatment.
Gentamicin administered intravenously or intramuscularly is the drug of choice for the treatment of tularemia in children. Ciprofloxacin is considered an alternative but is not approved by the U.S. Food and Drug Administration for this indication.
The pediatrician reported the case of tularemia to his local health department. Tularemia is a nationally notifiable disease in the United States; state health departments report to the CDC through the National Notifiable Diseases Surveillance System. In turn, public health authorities shared information to prevent tularemia. Steps to prevent tick and deer fly bites include the use of an Environmental Protection Agency–registered insect repellent. Individuals who hunt, trap, or skin animals are encouraged to wear gloves when handling animals —especially rabbits, muskrats, and prairie dogs — and cook game meat thoroughly. Tularemia can be inadvertently aerosolized if an infected animal or carcass is run over with a tractor or lawnmower. Checking for carcasses before mowing may reduce the risk.
Bryant is a pediatrician specializing in infectious diseases at the University of Louisville (Ky.) and Norton Children’s Hospital, also in Louisville. She is a member of the AAP’s Committee on Infectious Diseases and one of the lead authors of the AAP’s Recommendations for Prevention and Control of Influenza in Children, 2022-2023. The opinions expressed in this article are her own. Bryant discloses that she has served as an investigator on clinical trials funded by Pfizer, Enanta and Gilead. Email her at pdnews@mdedge.com. (Also kristina.bryant@louisville.edu.)
Reference
1. Rich SN et al. Tularemia—United States, 2011-2022. MMWR Morb Mortal Wkly Rep 2025;73:1152–1156. doi:
The pediatrician’s first patient of the day was an 8-year-old boy, accompanied by both of his parents. It was the boy’s third visit in just over a week for fever and left-sided neck swelling, and the family was understandably anxious for answers.
“The antibiotics don’t seem to be working,” the mother explained. “He still has fever every day, as high as 104, and his neck looks just as swollen.”
A quick review of the chart revealed the boy’s initial diagnosis had been bacterial lymphadenitis, for which amoxicillin-clavulanate had been prescribed. Three days later, given lack of clinical improvement, therapy was transitioned to clindamycin. On examination, the boy was febrile and ill-appearing with a 3-cm by 5-cm tender, non-fluctuant swelling over the left sternocleidomastoid muscle.
The pediatrician ran through a quick mental checklist of diagnostic possibilities for his patient’s continued symptoms. Staphylococcal lymphadenitis still seemed possible. Could the boy be infected with methicillin-resistant Staphylococcus aureus that was also clindamycin resistant? Alternately, perhaps the problem was “source control” and the boy had developed an occult neck abscess that needed to be drained. An ultrasound could help sort that out. Finally, the pediatrician considered less common bacterial causes of lymph node swelling and fever. He placed Bartonella henselae, the cause of cat scratch disease, near the top of his list. “I’ve never seen it,” he told the parents, “But we could also consider tularemia.”
On average, 200 cases of tularemia are reported in the United States each year, and the incidence of disease is increasing, according to a surveillance report released by the Centers for Disease Control and Prevention in December 2023.1
Between 2011 and 2022, 2462 tularemia cases were reported in the United States. That translated to an average annual incidence of 0.064 per 100,000 population, an increase of 56% compared with 2001-2010. Forty-seven states reported at least one case of tularemia, although half of all reported cases came from four states — Arkansas (18%), Kansas (11%), Missouri (11%), and Oklahoma (10%). The incidence of tularemia was highest in children ages 5-9 years old, older men, and American Indian or Alaska Natives individuals. Although cases occurred year-round, 78% had symptom onset May through September.
In the United States, most human cases of tularemia have been arthropod borne, transmitted by the bite of an infected tick or deer fly. Infection also can be spread through contact with infected animals or animal tissue, particularly rabbits, hares, muskrats, prairie dogs, and other rodents, including hamsters. Outbreaks of tularemia have occurred among pet store hamsters, and at least one child in the United States developed tularemia after being bitten by a pet hamster.
Tularemia is almost always associated with fever but other clinical manifestations vary by the type of exposure. Ulceroglandular disease occurs after a tick or deer fly bite or after handling an infected animal. An ulcer develops at the site where the bacteria entered the body, along with enlargement of regional lymph nodes. Less commonly, lymph node swelling can occur without the development of an ulcer. If the bacteria enter through the eye, symptoms include conjunctivitis and swelling of pre-auricular lymph nodes. Eating or drinking contaminated food or water is associated with sore throat, mouth ulcers, tonsillitis, and swelling of lymph glands in the neck. Pneumonic tularemia, the most serious form of the disease, typically happens after inhaling bacteria-containing dust or aerosols and is associated with cough, chest pain, and difficulty breathing. Pneumonic tularemia can develop if other forms of tularemia are untreated, and the bacteria spread to the lung.
Back in the exam room, the pediatrician carefully re-examined the boy’s scalp. A 1-cm poorly healing ulcer on the left occiput added support for the diagnosis of ulceroglandular tularemia, the most common form of the disease in children. Serologic testing ultimately confirmed the diagnosis and the boy’s symptoms resolved with treatment.
Gentamicin administered intravenously or intramuscularly is the drug of choice for the treatment of tularemia in children. Ciprofloxacin is considered an alternative but is not approved by the U.S. Food and Drug Administration for this indication.
The pediatrician reported the case of tularemia to his local health department. Tularemia is a nationally notifiable disease in the United States; state health departments report to the CDC through the National Notifiable Diseases Surveillance System. In turn, public health authorities shared information to prevent tularemia. Steps to prevent tick and deer fly bites include the use of an Environmental Protection Agency–registered insect repellent. Individuals who hunt, trap, or skin animals are encouraged to wear gloves when handling animals —especially rabbits, muskrats, and prairie dogs — and cook game meat thoroughly. Tularemia can be inadvertently aerosolized if an infected animal or carcass is run over with a tractor or lawnmower. Checking for carcasses before mowing may reduce the risk.
Bryant is a pediatrician specializing in infectious diseases at the University of Louisville (Ky.) and Norton Children’s Hospital, also in Louisville. She is a member of the AAP’s Committee on Infectious Diseases and one of the lead authors of the AAP’s Recommendations for Prevention and Control of Influenza in Children, 2022-2023. The opinions expressed in this article are her own. Bryant discloses that she has served as an investigator on clinical trials funded by Pfizer, Enanta and Gilead. Email her at pdnews@mdedge.com. (Also kristina.bryant@louisville.edu.)
Reference
1. Rich SN et al. Tularemia—United States, 2011-2022. MMWR Morb Mortal Wkly Rep 2025;73:1152–1156. doi:
Meta-Analysis Finding of a Fluoride-IQ Link Controversial
Results published from a systematic review and meta-analysis find an inverse association and a dose-response link between fluoride exposure and children’s IQ scores.
Kyla W. Taylor, PhD, with the Division of Translational Toxicology at the National Institutes of Health, Morrisville, North Carolina, led the multicountry study published online in JAMA Pediatrics.
Two accompanying editorials offer two very different perspectives on how to interpret the researchers’ conclusions.
Study Results
The authors noted that, of the 74 studies included in the review (64 cross-sectional and 10 cohort studies), most (45) were conducted in China. Other countries included were Canada (3), Denmark (1), India (12), Iran (4), Mexico (4), New Zealand (1), Pakistan (2), Spain (1), and Taiwan (1). “Fifty-two studies were rated high risk of bias, and 22 were rated low risk of bias,” the authors stated.
Researchers found that 64 of the 74 studies reported inverse associations between fluoride exposure measures and children’s IQ scores. Their analysis of 59 studies with group-level measures of fluoride in drinking water, dental fluorosis, or other measures of fluoride exposure showed an inverse relationship between fluoride exposure and IQ (pooled standardized mean difference [SMD], −0.45; 95% CI, −0.57 to −0.33; P < .001). Of those 59 studies, encompassing 20,932 children, 47 had high risk for bias and 12 had low risk for bias.
In 31 studies that reported fluoride measurements in drinking water, a dose-response relationship was found between exposed and reference groups (SMD, –0.15; 95% CI, –0.20 to –0.11; P < .001). That relationship remained inverse when exposed groups were limited to less than 4 mg fluoride/L and less than 2 mg/L. However, the association was not seen at less than 1.5 mg/L.
In 20 studies reporting fluoride measured in urine, there was an inverse dose-response association (SMD, –0.15; 95% CI, –0.23 to –0.07; P < .001). Those inverse relationships held at levels less than 4 mg/L, less than 2 mg/L, and less than 1.5 mg/L fluoride in urine.
For perspective, in the United States, the US Public Health Service in 2015 lowered the recommended concentration of fluoride in drinking water from a range of 0.7-1.2 mg/L to 0.7 mg/L to reduce the risk for dental fluorosis while keeping its protective effect against dental caries.
When Taylor’s team analyzed 13 studies with individual-level measures, they found an IQ score decrease of 1.63 points (95% CI, –2.33 to –0.93; P < .001) per 1-mg/L increase in urinary fluoride. Among studies with a low risk for bias, they observed an IQ score decrease of 1.14 points (95% CI, –1.68 to –0.61; P < .001). The inverse relationship remained when stratified by factors including risk for bias, sex, age, country, outcome assessment type, exposure timing (prenatal or postnatal), and exposure matrix (urinary fluoride, intake and water fluoride), the authors wrote.
The authors conclude both that inverse relationships and a dose-response association between fluoride measured in urine and drinking water and children’s IQs were found across the literature examined but also that “there were limited data and uncertainty in the dose-response association between fluoride exposure and children’s IQ when fluoride exposure was estimated by drinking water alone at concentrations less than 1.5 mg/L.”
The authors point out that, “To our knowledge, no studies of fluoride exposure and children’s IQ have been performed in the United States and no nationally representative urinary fluoride levels are available, hindering application of these findings to the US population.”
Editorial: Time to Reassess Systemic Fluoride
Bruce P. Lanphear, MD, MPH, with Simon Fraser University, Vancouver, British Columbia, Canada, is the lead author on an editorial that suggests these data point to the need to reassess systemic fluoride exposure.
“Their study is the largest and includes the most rigorous series of meta-analyses of fluoride ever conducted,” Lanphear and colleagues wrote. “It is time for health organizations and regulatory bodies to reassess the risks and benefits of fluoride, particularly for pregnant women and infants.”
Lanphear’s team says distinguishing between water fluoride and urinary fluoride levels is important in these results “because regulatory and public health agencies must consider total fluoride intake when assessing risks.”
Taylor and colleagues’ finding that there was no statistically significant association between water fluoride les than 1.5 mg/L and children’s IQ scores in the dose-response meta-analysis doesn’t mean fluoride is not a potential risk for lower IQ scores in fluoridated communities, they wrote. “Water fluoride concentration does not capture the amount of water ingested or other sources of ingested fluoride. In contrast, urinary fluoride is a biological measure of total fluoride exposure, including the dynamic interface between bone fluoride stores and blood fluoride.”
Editorial: Be Cautious About the Conclusions
Steven M. Levy, DDS, MPH, cites “major areas of concern” in the meta-analysis in his editorial.
He points to the large majority of studies in the meta-analysis that were at “high risk of bias” (47 high risk vs 12 that were low risk). He also cited information from a further look at the low-risk-of-bias studies included in the supplement.
“The studies with lower risk of bias showed a negligible effect (standardized mean difference [SMD], −0.19; 95% CI, −0.35 to −0.04) with very high heterogeneity (I2 = 87%), and a majority of publications (8 of 12) did not show a negative association between fluoride and childhood IQ,” Levy wrote.
“Taylor et al do not adequately justify selection or omission of studies or explain or justify the calculated individual effect sizes presented in the main analysis. Also, readers are not told which studies with lower risk of bias are included in the subanalyses for water fluoride levels less than 1.5 mg/L, less than 2.0 mg/L, and less than 4.0 mg/L; therefore, readers cannot independently consider important differences across these studies.”
Levy also states that the magnitudes of the possible IQ differences are unfairly inflated. For the United Staes and most of the world, he points out, the recommended community water fluoridation level is 0.7 mg/L. Therefore, the difference between a community with low fluoride levels (about 0.2 mg/L) and one with optimal levels is about 0.5 mg/L.
“However, Taylor and colleagues use a difference of 1.0 mg/L in their calculations, artificially doubling the estimated impact on IQ,” Levy wrote.
The meta-analysis should not affect public policy on adding fluoride to community water systems “and the widespread use of fluoride for caries prevention should continue,” Levy concluded.
Concerns About Quality of Studies Included
Charlotte Lewis, MD, MPH, associate professor of pediatrics at the University of Washington School of Medicine and part of Seattle Children’s Multidisciplinary Infant Nutrition and Feeding Team, Seattle, who was not involved in the meta-analysis or editorials, said that systemic fluoridation should not change based on these results, citing what she said are problems with methodology.
“There are many concerns about the quality of studies included in this meta-analysis,” Lewis said. “Although the authors claim to have separated out low-bias studies, it is important to note that many of these same studies have substantial methodological flaws.”
She said studies deemed low-bias and included in the meta-analysis “relied on multiple examiners for cognitive testing without consideration for inter-rater variation or reliability measures.” She added that “a number of the studies failed to account for maternal IQ scores, breastfeeding, lead exposure, or other factors that could affect cognitive development, further contributing to biased conclusions.”
Importantly, she said, many of the studies, including one by Rivka Green and colleagues published in JAMA Pediatrics, relied on maternal spot urinary fluoride to assess fetal exposure to fluoride. “This is not a valid way to assess fetal exposure to fluoride and including such studies in this meta-analysis has led to inappropriate conclusions because they are based on studies using a flawed exposure measure.”
She pointed to recent longitudinal, population-based studies, including one by Jayant V Kumar and colleagues that have found no adverse impact on IQ, or other cognitive tests, of drinking water with low levels of fluoride present, comparable to US community water fluoridation standards.
“Relative to the small convenience-sample, cross-sectional studies included in this meta-analysis, longitudinal, population-based studies are considered significantly more reliable for establishing cause and effect,” she said.
Fluoride Levels Different Globally
Lewis said in some parts of the world fluoride is present in the environment in much higher levels than in fluoridated water in the United States.
“There are known adverse health effects of high fluoride ingestion in these endemic regions found primarily in China, India, and Iran. This points to the importance of dose response. What is beneficial at low levels can be toxic at high levels and that appears to be the case, not surprisingly, for fluoride as well. However, at 0.7 ppm, the level of fluoride in community water fluoridation, we experience fluoride’s beneficial effects when we regularly drink optimally fluoridated water.”
“Water fluoridation is an important public health approach available and beneficial to all, even those unable to afford or access dental care,” she said. “Water fluoridation diminishes oral health disparities, and its removal threatens to worsen disparities and increased suffering from dental disease. I remain confident in the benefits and safety of community water fluoridation.”
Taylor and colleagues reported no relevant financial relationships. Lanphear reported grants from the National Institute of Environmental Health Sciences and the Canadian Institute for Health Research and having served as a nonretained and unpaid expert witness in a federal fluoride suit against the US EPA. Levy reported past grants from the National Institute of Dental and Craniofacial Research related to fluoride, dental caries, dental fluorosis, and bone development. He reported small grant funding from the Centers for Disease Control and Prevention related to fluoride, dental caries, and fluorosis. He consults for the Centers for Disease Control and Prevention and the National Institute of Dental and Craniofacial Research and serves on the National Fluoride Advisory Committee for the American Dental Association.
A version of this article appeared on Medscape.com.
FROM JAMA PEDIATRICS
Management of Children and Adolescents With Long COVID
Current management of children and adolescents with long COVID was the focus of various presentations at the 3rd Long COVID Congress in Berlin in November 2024. The congress aimed to facilitate in-depth discussions on recent research projects, diagnostic procedures, and therapeutic approaches to enhance care for long COVID patients. This year, the focus was on research into long COVID in children and adolescents and how to improve their care.
Uta Behrends, MD, head of the Munich Chronic Fatigue Center, Center for Pediatric and Adolescent Medicine at the Technical University of Munich, Germany, and Nicole Toepfner, MD, a pediatrician at the University Hospital in Dresden, Germany, provided an initial overview.
Prevalence Data Are Limited
Data on the incidence and prevalence of the condition in children and adolescents are limited because most studies have primarily examined adults. A 2022 Swiss study estimated that it affects between 2% and 3.5% of children and adolescents who contract COVID-19. A recent study published in JAMA involving 5367 children and adolescents found that 20% of children aged 6-11 years and 14% of adolescents met the researchers’ criteria for long COVID.
Impaired Mental Health
Initial data from the latest wave of the population-based longitudinal COPSY (Corona and Psyche) study showed that compared with their peer group children and adolescents diagnosed with long COVID exhibit significantly higher rates of psychological issues and depressive symptoms. Although no significant differences were found in anxiety levels, study leader Ulrike Ravens-Sieberer, PhD, from the University Medical Center Hamburg-Eppendorf, Germany, told the congress that those with long COVID do also report more frequent somatic or psychological health complaints and lower health-related quality of life than peers.
Addressing Data Gaps
Another study due to launch in January 2025 and run through to 2028 is the COVYOUTH data study, which aims to better understand the nature, frequency, and risk factors of COVID-related sequelae in children and adolescents.
Study centers include Ruhr University Bochum, University Hospital Cologne, the Paul-Ehrlich-Institut, and University Medical Center Hamburg-Eppendorf. Using routine data from statutory health insurance and newly developed case definitions, researchers aim to investigate:
- Psychological stress caused by COVID-19 measures
- Post-COVID syndrome and myocarditis
- Adverse effects of COVID-19 vaccinations
Specialized Diagnostics and Care
The Post-COVID Kids Bavaria project offers specialized diagnostics and care for children and adolescents, including a day clinic, telemedical follow-ups, and an inpatient pain therapy module providing age-appropriate care as close to patients’ homes as possible.
MOVE-COVID is a model project for patient-focused research on long COVID and myalgic encephalomyelitis/chronic fatigue syndrome (ME/CFS) involving university pediatric hospitals in Freiburg, Heidelberg, Tübingen, and Ulm. It also aims to establish a care network across the state of Baden-Württemberg, including the establishment of long COVID outpatient clinics at social pediatric centers in the network hospitals, as well as enhanced telemedical support and standardized diagnostic and treatment protocols. “MOVE-COVID has successfully consolidated competencies and capacities in patient care, health services research, and patient-focused studies across multiple centers,” Behrends said.
Chronic Pain and Fatigue
Post-COVID syndromes in children and adolescents may feature profound fatigue, unrefreshing sleep, post-exertional malaise, cognitive dysfunction, and orthostatic intolerance and overlap with conditions such as ME/CFS. According to the German patient association Fatigatio, Berlin, research and studies for these conditions in children remain limited compared with those in adults. However, the US Centers for Disease Control estimates that around 2% of ME/CFS patients are children or adolescents, with the majority being teenagers.
Two inpatient treatment concepts, SHARK and TIGER, developed by Lea Höfel, PhD, head of the Centre for Pain Therapy for Young People and the Psychological Service at the Children’s Hospital in Garmisch-Partenkirchen, address chronic pain, fatigue, and ME/CFS in young people. These programs integrate structured breaks and flexible access to multiple therapists as needed. The TIGER program focuses on those with post-exertional malaise, while the SHARK program is designed for adolescents without this symptom. Both programs last 4.5-5 weeks and emphasize symptom reduction, education, and energy management.
Preliminary Results
SHARK included 30 participants (7 men; average age, 16 years), of whom 12 had a history of SARS-CoV-2 infection. TIGER involved 100 participants (24 men; average age, 16.7 years), of whom 32 had a SARS-CoV-2 infection as a triggering event. Other triggers included Epstein-Barr virus and other infections.
Preliminary findings from the projects indicate that optimized management with outpatient and follow-up care can yield positive, sometimes lasting effects. No significant differences between SARS-CoV-2 and other triggers emerged, but pain proved more manageable in the SHARK group than in the TIGER group, suggesting they may involve different pathological mechanisms.
Hope for Improved Outcomes
“It’s important to move away from the idea that nothing can be done,” Behrends said. This is a common attitude with children and adolescents displaying these types of symptoms, but it’s simply not true. “Even in pediatrics, we have numerous therapeutic options that may offer relief, from medication to psychosocial interventions,” she concluded.
This story was translated from Medscape’s German edition using several editorial tools, including artificial intelligence, as part of the process. Human editors reviewed this content before publication. A version of this article appeared on Medscape.com.
FROM THE 3RD LONG COVID CONGRESS
Why Aren’t More Primary Care Physicians Prescribing Contraceptives?
In 2024, the Guttmacher Institute reported that eight states enacted or proposed limits on contraceptive access. Currently, more than 19 million women aged 13-44 years in the United States live in “contraceptive deserts” or places that lack access to a full range of birth control methods. About 1.2 million of those women live in counties that don’t have a single health center that has complete birth control services.
Providing contraceptive care in primary care settings has long been deemed a best practice by the Centers for Disease Control and Prevention (CDC). But the percentage of primary care physicians (PCPs) prescribing contraception or offering contraceptive procedures is strikingly low.
Only Half of Family Physicians (FPs) Prescribe Contraceptives
Research by Candice Chen, MD, MPH, and colleagues found that while 73.1% of obstetrician-gynecologists (OB/GYNs) and 72.6% of nurse-midwives prescribed the pill, patch, or vaginal ring; only 51% of FPs, 32.4% of pediatricians, and 19.8% of internal medicine physicians did so. And while 92.8% of OB/GYNs provided intrauterine device (IUD) services, only 16.4% of FPs, 2.6% of internists, and 0.6% of pediatricians did so.
One reason primary care is positioned so well to fill contraception gaps is found in the sheer numbers of PCPs. Chen and colleagues found that while the percentage of FPs prescribing contraception was much smaller (51.4%) than the percentage of OB/GYN prescribers (72.6%), the numbers translate to 72,725 FPs prescribing contraceptives, which is nearly double the number of OB/GYNs prescribing them (36,887).
Access to contraception services took a big hit with the COVID-19 pandemic as did access to healthcare in general. And the 2022 Supreme Court ruling that struck down Roe V. Wade has shaken up the landscape for reproductive services with potential consequences for contraceptive access.
Why Aren’t More PCPs Offering Contraceptive Services?
Reasons for the relatively low numbers of PCPs prescribing contraceptives include lack of training in residency, health systems’ financial choices, insurance barriers, and expectation by some physicians and many patients that birth control belongs in the OB/GYN sector. Access, patient awareness that PCPs can provide the care, expectations, and options vary by states and regions.
Angeline Ti, MD, an FP who teaches in a residency program at Wellstar Douglasville Medical Center in Douglasville, Georgia, told this news organization that the awareness issue might be the easiest change for PCPs as many patients aren’t aware you can get contraceptive services in primary care.
Things PCPs ‘Could Do Tomorrow’
Those physicians who want to add those services might want to start with universal screening, Ti said — having conversations with patients about contraceptive needs and letting them know they don’t have to get those prescriptions from an OB/GYN. The conversations could center on laying out the options and counseling on risks and benefits of various options and providing referrals, if that is the best option. “There are definitely things that you could do tomorrow,” she said.
PCPs should be familiar with the CDC’s Contraceptive Guidance for Health Care Providers and the federal Office of Population Affairs’ Quality Family Planning Recommendations for providers, which offer practice-level information, Ti said.
PCPs should not feel they need to be able to provide same-day contraceptive care to get started. Having nurses and medical assistants and practice managers on board who are passionate about adding the services can also help bring about change with a team approach, she said.
Even when the provider is enthusiastic about providing the care and is trained to do so, however, insurance barriers may exist, Ti acknowledged. For example, at her clinic a common IUD insertion requires prior authorization.
Including Other Providers
Julia Strasser, DrPH, MPH, a member of the core faculty at the Fitzhugh Mullan Institute for Health Workforce Equity in Washington, DC, told this news organization that including other clinicians could help expand contraceptive services in primary care. Her research showed that the proportion of the contraception workforce that is made up of advanced practice clinicians and nurse practitioners is increasing, whereas the proportion that includes physicians is either static or declining.
A paper by her team found that although OB/GYNs and nurse-midwives were more likely to prescribe the pill, patch, or ring, the largest numbers of contraception prescribers were FPs (72,725) and advanced practice nurses (70,115).
“We also know that pharmacists can safely prescribe contraception, and some states have authorized this practice, but uptake is low and policies vary by state,” she said. “Some health systems have pharmacists embedded in their practice — for example in federally qualified health centers and others.”
It’s important, she said, not to frame the gaps in contraceptive care as a failure on the part of individual clinicians but rather as: “How can we change some of the system-level factors that have gotten us to this point?”
Yalda Jabbarpour, MD, an FP and director of the Robert Graham Center of the American Academy of Family Physicians, said sometimes it’s the health center’s cost analysis that stands in the way. She gave an example from her own health system.
“The health system doesn’t want to pay for us to have the IUDs stored in our offices and provide that procedure because they feel it’s more cost effective if the OB/GYNs do it.” IUD insertions take more appointment time than the standard appointment, which also goes into the cost analysis. “Even though you’re trained to do it, you can’t necessarily do it when you get to the real world,” Jabbarpour said.
She said the thinking is that while OB/GYNs focus on women, FPs cover all ages and family members, so having the equipment and the storage space is best left to the OB/GYNs. She said that thinking may be short sighted.
“We have good data that the highest number of office visits in the United States actually happen in the family physician’s office,” she said. Not providing the services injects a barrier into the system as women are being referred for a simple procedure to a physician they’ve never seen. “That’s not very patient centered,” Jabbarpour noted.
In systems that refer contraceptive procedures to OB/GYNs, doctors also can’t practice skills they learned in residency and then may not feel comfortable performing the procedures when they enter a health system that offers the procedures in primary care.
Number of FPs Prescribing Long-Acting Contraception Growing
Jabbarpour said there has been some improvement in that area in terms of long-acting reversible contraception.
She pointed to a study of recertifying FPs that found that the percent of FPs who offer either IUDs or implants increased from 23.9% in 2018 to 30% in 2022. The share of FPs providing implant insertion increased from 12.9% to 20.8%; those providing IUDs also increased from 22.9% to 25.5% from 2018 to 2022.
FPs also have the advantage of being more widely distributed in rural and remote areas than OB/GYNs, she noted. “They are in almost every county in the United States.”
Jabbarpour said the education must start with health system leaders. If they deem it important to offer these services in primary care, then residency programs will see that their residents must be appropriately trained to provide it.
“Right now, it’s not an expectation of many of the employers that primary care physicians should do this,” she said.
Ti said that expectation should change. The value proposition for all PCPs and health systems, she said, is this: “Most of contraceptive care is well within the scope of primary care providers. This is care that we can do, and it’s care that we should be doing. So why aren’t we doing it?”
Ti, Strasser, and Jabbarpour reported no relevant financial disclosures.
A version of this article appeared on Medscape.com.
ADHD Myths
In the second half of the school year, you may find that there is a surge of families coming to appointments with concerns about school performance, wondering if their child has ADHD. We expect you are very familiar with this condition, both diagnosing and treating it. So this month we will offer “mythbusters” for ADHD: Responding to common misperceptions about ADHD with a summary of what the research has demonstrated as emerging facts, what is clearly fiction and what falls into the gray space between.
Demographics
A CDC survey of parents from 2022 indicates that 11.4% of children aged 3-17 have ever been diagnosed with ADHD in the United States. This is more than double the ADHD global prevalence of 5%, suggesting that there is overdiagnosis of this condition in this country. Boys are almost twice as likely to be diagnosed (14.5%) as girls (8%), and White children were more likely to be diagnosed than were Black and Hispanic children. The prevalence of ADHD diagnosis decreases as family income increases, and the condition is more frequently diagnosed in 12- to 17-year-olds than in children 11 and younger. The great majority of youth with an ADHD diagnosis (78%) have at least one co-occurring psychiatric condition. Of the children diagnosed with ADHD, slightly over half receive medication treatment (53.6%) whereas nearly a third (30.1%) receive no ADHD-specific treatment.

The Multimodal Treatment of ADHD Study (MTA), a large (600 children, aged 7-9 years), multicenter, longitudinal study of treatment outcomes for medication as well as behavioral and combination therapies demonstrated in every site that medication alone and combination therapy were significantly superior to intensive behavioral treatment alone and to routine community care in the reduction of ADHD symptoms. Of note, problems commonly associated with ADHD (parent-child conflict, anxiety symptoms, poor academic performance, and limited social skills) improved only with the combination treatment. This suggests that while core ADHD symptoms require medication, associated problems will also require behavioral treatment.

The American Academy of Pediatrics has a useful resource guide (healthychildren.org) highlighting the possible symptoms of inattention, hyperactivity, and impulsivity that should be investigated when considering this diagnosis. It is a clinical diagnosis, but screening instruments (such as the Vanderbilt) can be very helpful to identifying symptoms that should be present in more than one setting (home and school). While a child with ADHD can appear calm and focused when receiving direct one-to-one attention (as during a pediatrician’s appointment), symptoms may flourish in less structured or supervised settings. Sometimes parents are keen reporters of a child’s behaviors, but some loving (and exhausted) parents may overreact to a normal degree of inattention or disobedience. This can be especially true when a parent has a more detail-oriented temperament than the child, or with younger children and first-time parents. It is important to consider ADHD when you hear about social difficulties as well as academic ones, where there is a family history of ADHD or when a child is more impulsive, hyperactive, or inattentive than you would expect given their age and developmental stage. Confirm your clinical exam with teacher and parent reports. If the reports don’t line up or there are persistent learning problems in school, consider neuropsychological testing to root out a learning disability.
Myth 1: “ADHD never starts in adolescence; you can’t diagnose it after elementary school.”
Diagnostic criteria used to require that symptoms were present before the age of 7 (DSM 3). But current criteria allow for diagnosis before 12 years of age or after. While the consensus is that ADHD is present in childhood, its symptoms are often not apparent. This is because normal development in much younger children is marked by higher levels of activity, distractibility, and impulsivity. Also, children with inattentive-type ADHD may not be apparent to adults if they are performing adequately in school. These youth often do not present for assessment until the challenges of a busy course load make their inattention and consequent inefficiency apparent, in high school or even college. Certainly, when a teenager presents complaining of trouble performing at school, it is critical to rule out an overburdened schedule, anxiety or mood disorder, poor sleep habits or sleep disorder, and substance use disorders, all of which are more common in adolescence. But inattentive-type ADHD that was previously missed is also a possibility worth investigating.
Myth 2: “Most children outgrow ADHD; it’s best to find natural solutions and wait it out.”
Early epidemiological studies suggested that as many as 30% of ADHD cases remitted by adulthood, but more recent data has adjusted that number down substantially, closer to 9%. Interestingly, it appears that 10% of patients will experience sustained symptoms, 9% will experience recovery (sustained remission without treatment), and a large majority will have a remitting and relapsing course into adulthood.1
This emerging evidence suggests that ADHD is almost always a lifelong condition. Untreated, it can threaten healthy development (including social skills and self-esteem) and day-to-day function (academic, social and athletic performance and even vulnerability to accidents) in ways that can be profound. The MTA Study has powerfully demonstrated the efficacy of pharmacological treatment and of specific behavioral treatments for ADHD and associated problems.
Myth 3: “You should exhaust natural cures first before trying medications.”
There has been a large amount of research into a variety of “natural” treatments for ADHD: special diets, supplements, increased exercise, and interventions like neurofeedback. While high-dose omega 3 fatty acid supplementation has demonstrated mild improvement in ADHD symptoms, no “natural” treatment has come close to the efficacy of stimulant medications. Interventions such as neurofeedback are expensive and time-consuming without any demonstrated efficacy. That said, improving a child’s routines around sleep, nutrition, and regular exercise are broadly useful strategies to improve any child’s (or adult’s) energy, impulse control, attention, motivation, and capacity to manage adversity and stress. Start any treatment by addressing sleep and exercise, including moderating time spent on screens, to support healthy function. But only medication will achieve symptom remission if your patient has underlying ADHD.
Myth 4: “All medications are equally effective in ADHD.”
It is well-established that stimulants are more effective than non-stimulants in the treatment of ADHD symptoms, with an effect size that is almost double that of non-stimulants.2
Amphetamine-based medications are slightly more effective than methylphenidate-based medications, but they are also generally less well-tolerated. Individual patients commonly have a better response to one class than the other, but you will need a trial to determine which one. It is reasonable to start a patient with an extended formulation of one class, based on your assessment of their vulnerability to side effects or a family history of medication response. Non-stimulants are of use when stimulants are not tolerated (ie, use of atomoxetine with patients who have comorbid anxiety), or to target specific symptoms, such as guanfacine or clonidine for hyperactivity.
Myth 5: “You can’t treat ADHD in substance abusing teens, stimulant medications are addictive.”
ADHD itself (not medications) increases the risk for addiction; those with ADHD are almost twice as likely to develop a substance use disorder, with highest risk for marijuana, alcohol, and nicotine abuse.3
This may be a function of limited impulse control or increased sensitivity in the ADHD brain to a drug’s addictive potential. Importantly, there is growing evidence that youth whose ADHD is treated pharmacologically are at lower risk for addiction than their peers with untreated ADHD.4
Those youth who have both ADHD and addiction are more likely to stay engaged in treatment for addiction when their ADHD is effectively treated, and there are medication formulations (lisdexamfetamine) that are safe in addiction (cannot be absorbed nasally or intravenously). It is important for you to talk about the heightened vulnerability to addiction with your ADHD patients and their parents, and the value of effective treatment in preventing this complication.
Myth 6: “ADHD is usually behavioral. Help parents to set rules, expectations, and limits instead of medicating the problem.”
Bad parenting does not cause ADHD. ADHD is marked by difficulties with impulse control, hyperactivity, and sustaining attention with matters that are not intrinsically engaging. “Behavioral issues” are patterns of behavior children learn to seek rewards or avoid negative consequences. Youth with ADHD can develop behavioral problems, but these are usually driven by negative feedback about their activity level, forgetfulness, or impulse control, which they are not able to change. This can lead to frustration and irritability, poor self-esteem, and even hopelessness — in parents and children both!
While parents are not the source of ADHD symptoms, there is a great deal of parent education and support that can be powerfully effective for these families. Parents benefit from learning strategies that can help their children to shift their attention, plan ahead, and manage frustration, especially for times when their children are unmedicated (vacations and bedtime). It is worth noting that ADHD is among the most heritable of youth psychiatric illnesses, so it is not uncommon for a parent of a child with ADHD to have similar symptoms. If the parents’ ADHD is untreated, they may be more impulsive themselves. They may also be extra sensitive to the qualities they dislike in themselves, inadvertently adding to their children’s sense of shame. ADHD is very treatable, and those with it can learn executive function skills and organizational strategies that can equip them to manage residual symptoms. Parents will benefit from strategies to understand their children and to help them learn adaptive skills in a realistic way. Your discussions with parents could help the families in your practice make adjustments that can translate into big differences in their child’s healthiest development.
Swick is physician in chief at Ohana, Center for Child and Adolescent Behavioral Health, Community Hospital of the Monterey (Calif.) Peninsula. Jellinek is professor emeritus of psychiatry and pediatrics, Harvard Medical School, Boston. Email them at pdnews@mdedge.com.
References
1. Sibley MH et al. MTA Cooperative Group. Variable Patterns of Remission From ADHD in the Multimodal Treatment Study of ADHD. Am J Psychiatry. 2022 Feb;179(2):142-151. doi: 10.1176/appi.ajp.2021.21010032.
2. Cortese S et al. Comparative Efficacy and Tolerability of Medications for Attention-Deficit Hyperactivity Disorder in Children, Adolescents, and Adults: A Systematic Review and Network Meta-Analysis. Lancet Psychiatry. 2018 Sep;5(9):727-738. doi: 10.1016/S2215-0366(18)30269-4.
3. Lee SS et al. Prospective Association of Childhood Attention-Deficit/Hyperactivity Disorder (ADHD) and Substance Use and Abuse/Dependence: A Meta-Analytic Review. Clin Psychol Rev. 2011 Apr;31(3):328-41. doi: 10.1016/j.cpr.2011.01.006.
4. Chorniy A, Kitashima L. Sex, Drugs, and ADHD: The Effects of ADHD Pharmacological Treatment on Teens’ Risky Behaviors. Labour Economics. 2016;43:87-105. doi.org/10.1016/j.labeco.2016.06.014.
In the second half of the school year, you may find that there is a surge of families coming to appointments with concerns about school performance, wondering if their child has ADHD. We expect you are very familiar with this condition, both diagnosing and treating it. So this month we will offer “mythbusters” for ADHD: Responding to common misperceptions about ADHD with a summary of what the research has demonstrated as emerging facts, what is clearly fiction and what falls into the gray space between.
Demographics
A CDC survey of parents from 2022 indicates that 11.4% of children aged 3-17 have ever been diagnosed with ADHD in the United States. This is more than double the ADHD global prevalence of 5%, suggesting that there is overdiagnosis of this condition in this country. Boys are almost twice as likely to be diagnosed (14.5%) as girls (8%), and White children were more likely to be diagnosed than were Black and Hispanic children. The prevalence of ADHD diagnosis decreases as family income increases, and the condition is more frequently diagnosed in 12- to 17-year-olds than in children 11 and younger. The great majority of youth with an ADHD diagnosis (78%) have at least one co-occurring psychiatric condition. Of the children diagnosed with ADHD, slightly over half receive medication treatment (53.6%) whereas nearly a third (30.1%) receive no ADHD-specific treatment.
The Multimodal Treatment of ADHD Study (MTA), a large (600 children, aged 7-9 years), multicenter, longitudinal study of treatment outcomes for medication as well as behavioral and combination therapies demonstrated in every site that medication alone and combination therapy were significantly superior to intensive behavioral treatment alone and to routine community care in the reduction of ADHD symptoms. Of note, problems commonly associated with ADHD (parent-child conflict, anxiety symptoms, poor academic performance, and limited social skills) improved only with the combination treatment. This suggests that while core ADHD symptoms require medication, associated problems will also require behavioral treatment.
The American Academy of Pediatrics has a useful resource guide (healthychildren.org) highlighting the possible symptoms of inattention, hyperactivity, and impulsivity that should be investigated when considering this diagnosis. It is a clinical diagnosis, but screening instruments (such as the Vanderbilt) can be very helpful to identifying symptoms that should be present in more than one setting (home and school). While a child with ADHD can appear calm and focused when receiving direct one-to-one attention (as during a pediatrician’s appointment), symptoms may flourish in less structured or supervised settings. Sometimes parents are keen reporters of a child’s behaviors, but some loving (and exhausted) parents may overreact to a normal degree of inattention or disobedience. This can be especially true when a parent has a more detail-oriented temperament than the child, or with younger children and first-time parents. It is important to consider ADHD when you hear about social difficulties as well as academic ones, where there is a family history of ADHD or when a child is more impulsive, hyperactive, or inattentive than you would expect given their age and developmental stage. Confirm your clinical exam with teacher and parent reports. If the reports don’t line up or there are persistent learning problems in school, consider neuropsychological testing to root out a learning disability.
Myth 1: “ADHD never starts in adolescence; you can’t diagnose it after elementary school.”
Diagnostic criteria used to require that symptoms were present before the age of 7 (DSM 3). But current criteria allow for diagnosis before 12 years of age or after. While the consensus is that ADHD is present in childhood, its symptoms are often not apparent. This is because normal development in much younger children is marked by higher levels of activity, distractibility, and impulsivity. Also, children with inattentive-type ADHD may not be apparent to adults if they are performing adequately in school. These youth often do not present for assessment until the challenges of a busy course load make their inattention and consequent inefficiency apparent, in high school or even college. Certainly, when a teenager presents complaining of trouble performing at school, it is critical to rule out an overburdened schedule, anxiety or mood disorder, poor sleep habits or sleep disorder, and substance use disorders, all of which are more common in adolescence. But inattentive-type ADHD that was previously missed is also a possibility worth investigating.
Myth 2: “Most children outgrow ADHD; it’s best to find natural solutions and wait it out.”
Early epidemiological studies suggested that as many as 30% of ADHD cases remitted by adulthood, but more recent data has adjusted that number down substantially, closer to 9%. Interestingly, it appears that 10% of patients will experience sustained symptoms, 9% will experience recovery (sustained remission without treatment), and a large majority will have a remitting and relapsing course into adulthood.1
This emerging evidence suggests that ADHD is almost always a lifelong condition. Untreated, it can threaten healthy development (including social skills and self-esteem) and day-to-day function (academic, social and athletic performance and even vulnerability to accidents) in ways that can be profound. The MTA Study has powerfully demonstrated the efficacy of pharmacological treatment and of specific behavioral treatments for ADHD and associated problems.
Myth 3: “You should exhaust natural cures first before trying medications.”
There has been a large amount of research into a variety of “natural” treatments for ADHD: special diets, supplements, increased exercise, and interventions like neurofeedback. While high-dose omega 3 fatty acid supplementation has demonstrated mild improvement in ADHD symptoms, no “natural” treatment has come close to the efficacy of stimulant medications. Interventions such as neurofeedback are expensive and time-consuming without any demonstrated efficacy. That said, improving a child’s routines around sleep, nutrition, and regular exercise are broadly useful strategies to improve any child’s (or adult’s) energy, impulse control, attention, motivation, and capacity to manage adversity and stress. Start any treatment by addressing sleep and exercise, including moderating time spent on screens, to support healthy function. But only medication will achieve symptom remission if your patient has underlying ADHD.
Myth 4: “All medications are equally effective in ADHD.”
It is well-established that stimulants are more effective than non-stimulants in the treatment of ADHD symptoms, with an effect size that is almost double that of non-stimulants.2
Amphetamine-based medications are slightly more effective than methylphenidate-based medications, but they are also generally less well-tolerated. Individual patients commonly have a better response to one class than the other, but you will need a trial to determine which one. It is reasonable to start a patient with an extended formulation of one class, based on your assessment of their vulnerability to side effects or a family history of medication response. Non-stimulants are of use when stimulants are not tolerated (ie, use of atomoxetine with patients who have comorbid anxiety), or to target specific symptoms, such as guanfacine or clonidine for hyperactivity.
Myth 5: “You can’t treat ADHD in substance abusing teens, stimulant medications are addictive.”
ADHD itself (not medications) increases the risk for addiction; those with ADHD are almost twice as likely to develop a substance use disorder, with highest risk for marijuana, alcohol, and nicotine abuse.3
This may be a function of limited impulse control or increased sensitivity in the ADHD brain to a drug’s addictive potential. Importantly, there is growing evidence that youth whose ADHD is treated pharmacologically are at lower risk for addiction than their peers with untreated ADHD.4
Those youth who have both ADHD and addiction are more likely to stay engaged in treatment for addiction when their ADHD is effectively treated, and there are medication formulations (lisdexamfetamine) that are safe in addiction (cannot be absorbed nasally or intravenously). It is important for you to talk about the heightened vulnerability to addiction with your ADHD patients and their parents, and the value of effective treatment in preventing this complication.
Myth 6: “ADHD is usually behavioral. Help parents to set rules, expectations, and limits instead of medicating the problem.”
Bad parenting does not cause ADHD. ADHD is marked by difficulties with impulse control, hyperactivity, and sustaining attention with matters that are not intrinsically engaging. “Behavioral issues” are patterns of behavior children learn to seek rewards or avoid negative consequences. Youth with ADHD can develop behavioral problems, but these are usually driven by negative feedback about their activity level, forgetfulness, or impulse control, which they are not able to change. This can lead to frustration and irritability, poor self-esteem, and even hopelessness — in parents and children both!
While parents are not the source of ADHD symptoms, there is a great deal of parent education and support that can be powerfully effective for these families. Parents benefit from learning strategies that can help their children to shift their attention, plan ahead, and manage frustration, especially for times when their children are unmedicated (vacations and bedtime). It is worth noting that ADHD is among the most heritable of youth psychiatric illnesses, so it is not uncommon for a parent of a child with ADHD to have similar symptoms. If the parents’ ADHD is untreated, they may be more impulsive themselves. They may also be extra sensitive to the qualities they dislike in themselves, inadvertently adding to their children’s sense of shame. ADHD is very treatable, and those with it can learn executive function skills and organizational strategies that can equip them to manage residual symptoms. Parents will benefit from strategies to understand their children and to help them learn adaptive skills in a realistic way. Your discussions with parents could help the families in your practice make adjustments that can translate into big differences in their child’s healthiest development.
Swick is physician in chief at Ohana, Center for Child and Adolescent Behavioral Health, Community Hospital of the Monterey (Calif.) Peninsula. Jellinek is professor emeritus of psychiatry and pediatrics, Harvard Medical School, Boston. Email them at pdnews@mdedge.com.
References
1. Sibley MH et al. MTA Cooperative Group. Variable Patterns of Remission From ADHD in the Multimodal Treatment Study of ADHD. Am J Psychiatry. 2022 Feb;179(2):142-151. doi: 10.1176/appi.ajp.2021.21010032.
2. Cortese S et al. Comparative Efficacy and Tolerability of Medications for Attention-Deficit Hyperactivity Disorder in Children, Adolescents, and Adults: A Systematic Review and Network Meta-Analysis. Lancet Psychiatry. 2018 Sep;5(9):727-738. doi: 10.1016/S2215-0366(18)30269-4.
3. Lee SS et al. Prospective Association of Childhood Attention-Deficit/Hyperactivity Disorder (ADHD) and Substance Use and Abuse/Dependence: A Meta-Analytic Review. Clin Psychol Rev. 2011 Apr;31(3):328-41. doi: 10.1016/j.cpr.2011.01.006.
4. Chorniy A, Kitashima L. Sex, Drugs, and ADHD: The Effects of ADHD Pharmacological Treatment on Teens’ Risky Behaviors. Labour Economics. 2016;43:87-105. doi.org/10.1016/j.labeco.2016.06.014.
Early Patching Benefits Kids Born With Cataract in One Eye
TOPLINE:
particularly in the morning or at regular times every day.
METHODOLOGY:
- Researchers conducted a post hoc analysis of the Infant Aphakia Treatment Study to examine the association between the reported consistency in patching during the first year after unilateral cataract surgery and visual acuity.
- They included data from 101 children whose caregivers completed 7-day patching diaries at 2 months after surgery or at age 13 months.
- The treatment protocol required caregivers to have their child wear a patch over the fellow eye for 1 hour daily from the second week after cataract surgery until age 8 months, followed by patching for 50% of waking hours until age 5 years.
- Consistent patching was defined as daily patching with an average start time before 9 AM or an interquartile range of the first application time of 60 minutes or less.
- Visual acuity in the treated eye was the primary outcome, assessed at ages 54 + 1 months and 10.5 years; participants with a visual acuity of 20/40 or better were said to have near-normal vision.
TAKEAWAY:
- Children whose caregivers reported consistent patching patterns demonstrated better average visual acuity at age 54 months than those whose caregivers reported inconsistent patching patterns (mean difference in logMAR visual acuity, 0.55; 95% CI, 0.22-0.87); the results were promising for children aged 10.5 years, as well.
- Data from the diary completed at age 13 months showed children whose caregivers reported patching before 9 AM or around the same time daily were more likely to achieve near-normal vision at age 54 + 1 months and 10.5 years (relative risk, 3.55; 95% CI, 1.61-7.80, and 2.31; 95% CI, 1.12-4.78, respectively) than those whose caregivers did not report such behavior.
- Children whose caregivers reported consistent vs inconsistent patching patterns achieved more average daily hours of patching both during the first year (4.82 h vs 3.50 h) and between ages 12 and 48 months (4.96 h vs 3.03 h).
IN PRACTICE:
“This information can be used by healthcare providers to motivate caregivers to develop consistent patching habits. Further, providers can present caregivers with simple advice: Apply the patch every day either first thing in the morning or about the same time every day,” the authors of the study wrote.
SOURCE:
The study was led by Carolyn Drews-Botsch, PhD, MPH, of the Department of Global and Community Health at George Mason University, in Fairfax, Virginia. It was published online in Ophthalmology.
LIMITATIONS:
The diaries covered only 14 days of the first year following surgery, which may not have fully represented patching patterns during other periods. The researchers noted that establishing a routine for patching was particularly challenging for infants aged less than 5 months at the time of the first diary completion as these infants may not yet have established regular sleep and feeding routines. Parents who participated in this trial may have differed from those in routine practice, potentially affecting the generalizability of the findings to general clinical populations.
DISCLOSURES:
This study was supported by the following grants: 1 R21 EY032152, 2 UG1 EY031287, 5 U10 EY013287, 5 UG1 EY02553, and 7 UG1 EY013272. The authors declared having no conflicts of interest.
This article was created using several editorial tools, including AI, as part of the process. Human editors reviewed this content before publication. A version of this article first appeared on Medscape.com.
Group A Streptococcal Pharyngitis Diagnosis
It’s wintertime, peak season for GAS pharyngitis, and you’d think that this far into the 21st century we would have a foolproof process for diagnosing which among the many patients with pharyngitis have true GAS pharyngitis. Thinking back to the 1980s, we have come a long way from simple throat cultures for detecting GAS, e.g., numerous point of care (POC) Clinical Laboratory Improvement Amendments (CLIA), waved rapid antigen detection tests (RADT), and numerous highly sensitive molecular assays, e.g. nucleic acid amplification tests (NAAT). But if you think the issues surrounding management of GAS pharyngitis have been solved by these newer tests, think again.

Several good reviews1-3 are excellent resources for those wishing a refresher on GAS diagnosis/management issues. They present nitty gritty details on comparative advantages/disadvantages of the many testing options while reminding us of the nuts and bolts of GAS pharyngitis. The following are a few nuggets from these articles.
Properly collected throat specimen. A quality throat specimen involves swabbing both tonsillar pillars plus posterior pharynx without touching tongue or inner cheeks. Two swab collections increase sensitivity by almost 10% compared with a single swab. Transport media is preferred if samples will not be cultured within 24 hours. Caveat: RADT testing of a transport media-diluted sample lowers sensitivity compared with direct swab use.
Reliable GAS detection. Commercially available tests in 2025 are well studied. Culture is considered a gold standard for detecting clinically relevant GAS by CDC.4 Culture has good sensitivity (estimated 80%-90% varying among studies and by quality of specimens) and 99% specificity but requires 16-24 hours for results. RADT solves the time-delay issues and has near 100% specificity but sensitivity used to be as low as 65%, hence the 2012 Infectious Diseases Society of America guideline recommendation for backup throat culture for negative tests.5 However, current RADT have sensitivities in the 85%-90% range.3,4 So a positive RADT reliably and quickly indicates GAS antigens are present. NAAT have the highest combined sensitivity and specificity, near 100% for each, and a positive reliably indicates GAS nucleic acids are present.
So why not simply always use NAAT? First, it’s a “be careful what you wish for” scenario. NAAT can, and do, detect dead remnants and colonizing GAS way more than culture.2,3 So NAAT are overly sensitive, adding an extra layer of interpretation difficulty, ie, as many as 20% of positive NAAT detections may be carriers or dead GAS. Second, NAAT often requires special instrumentation and kits are more expensive. That said, reimbursement is often higher for NAAT.
Choice based on accuracy in detecting GAS. If time delays were not a problem, culture would still seem the answer. If more rapid detection is needed, either RADT with culture back up or NAAT could be the answer. That said, consider that in the real world, throat cultures are less sensitive and RADT are less specific than indicated by some published data.6 So, the ideal answer, it seems, would be NAAT GAS detection coupled with a confirmatory biomarker of GAS infection. Such innate immune biomarkers may be on the horizon.3
But first, pretest screening. In 2025 what do we do with a positive result? Do we prescribe antibiotics? Do we think the detected GAS bacteria/antigens/nucleic acids represent the cause of the pharyngitis? Or did we just detect dead GAS or even a carrier, while a virus is the true cause? Challenges for this decision include most pharyngitis (up to 70%) being due to viruses, not GAS, plus up to 20% of GAS detections even by less sensitive culture or RADT can be carriers, plus an added 10%-20% of RADT and NAAT detections are dead GAS. Thus, with indiscriminate testing of all pharyngitis patients, the number of truly positive GAS detections that are actually “false positives” (GAS in some form is present but not causing pharyngitis) may be almost as high as for those representing true GAS pharyngitis.
Some tool is needed to minimize testing patients who are likely to have viral pharyngitis to reduce test-positive/GAS-pharyngitis-negative scenarios. Pretest patient screening therefore is critical to increase the positive predictive value of positive GAS testing results. The history and physical can be helpful. In the simplest form of pretest screening, eliminate those younger than 3 years old* or those with viral type sign/symptoms, eg conjunctivitis, cough, coryza.7 This could cut “false” positives by as much as a half. More complete validated scoring systems are also available but remain imperfect. The most published is the McIsaac score (modified Centor score).3-5,8 (See Table and Figure.)
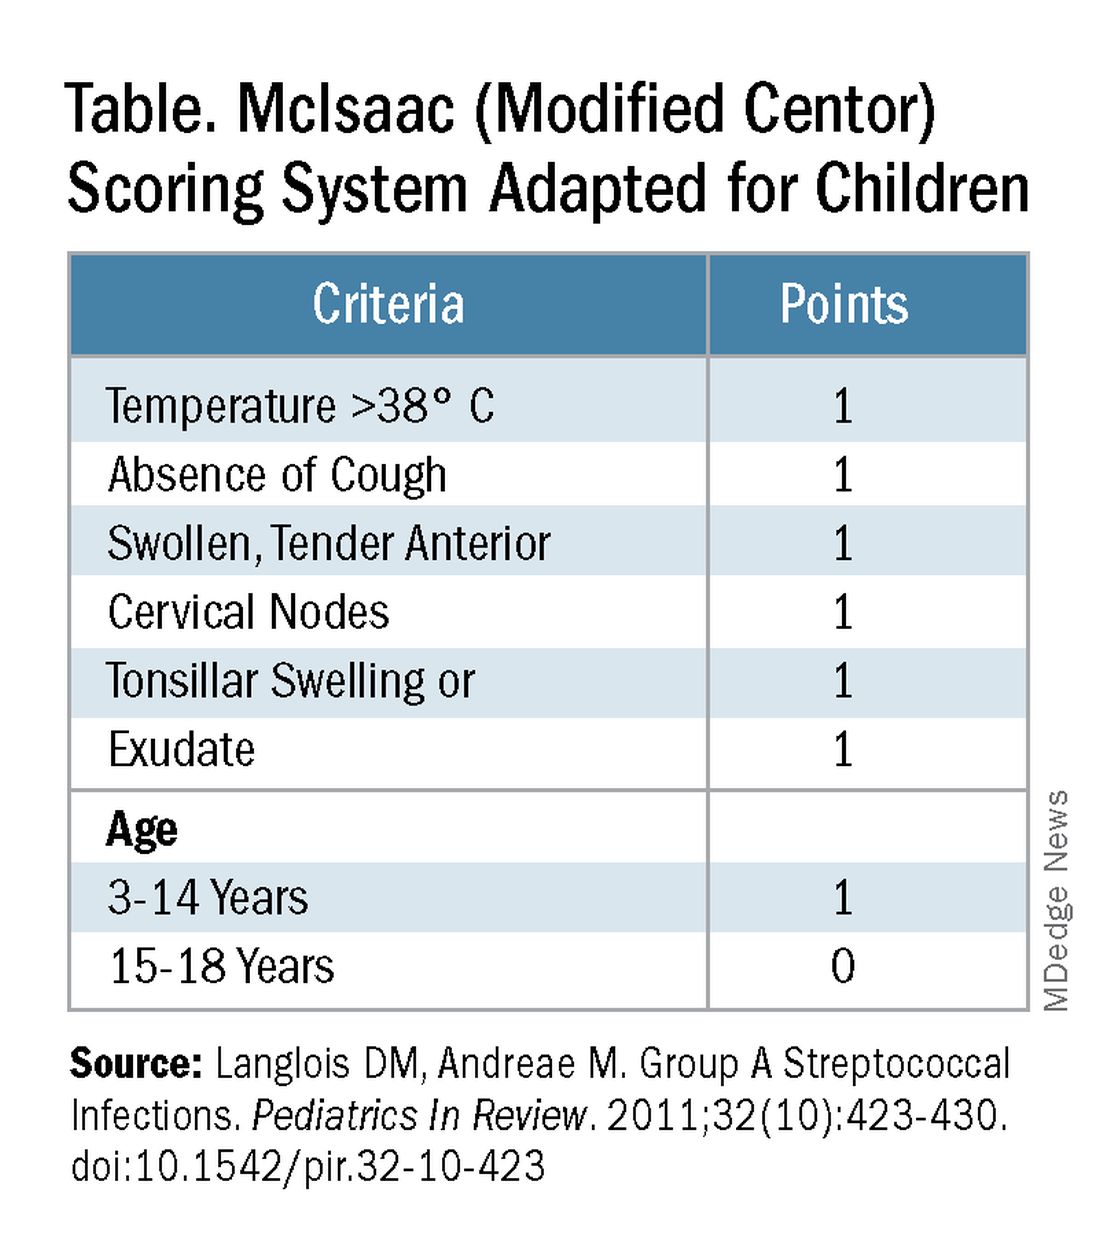
However, even with this validated scoring system, misdiagnoses and some antibiotic misuse will likely occur, particularly if the controversial option to treat a patient with a score above 4 without testing is used. For example, a 2004 study in patients older than 3 years old revealed that 45% with a score above 4 points did not have GAS pharyngitis. (McIsaac et al.) A 2012 study showed similar potential overdiagnosis from using the score without testing (45% with > 4 points did not have GAS pharyngitis). Of note, clinical scores of below 2 comprised up to 10% and would be neither tested nor treated. (Figure.)
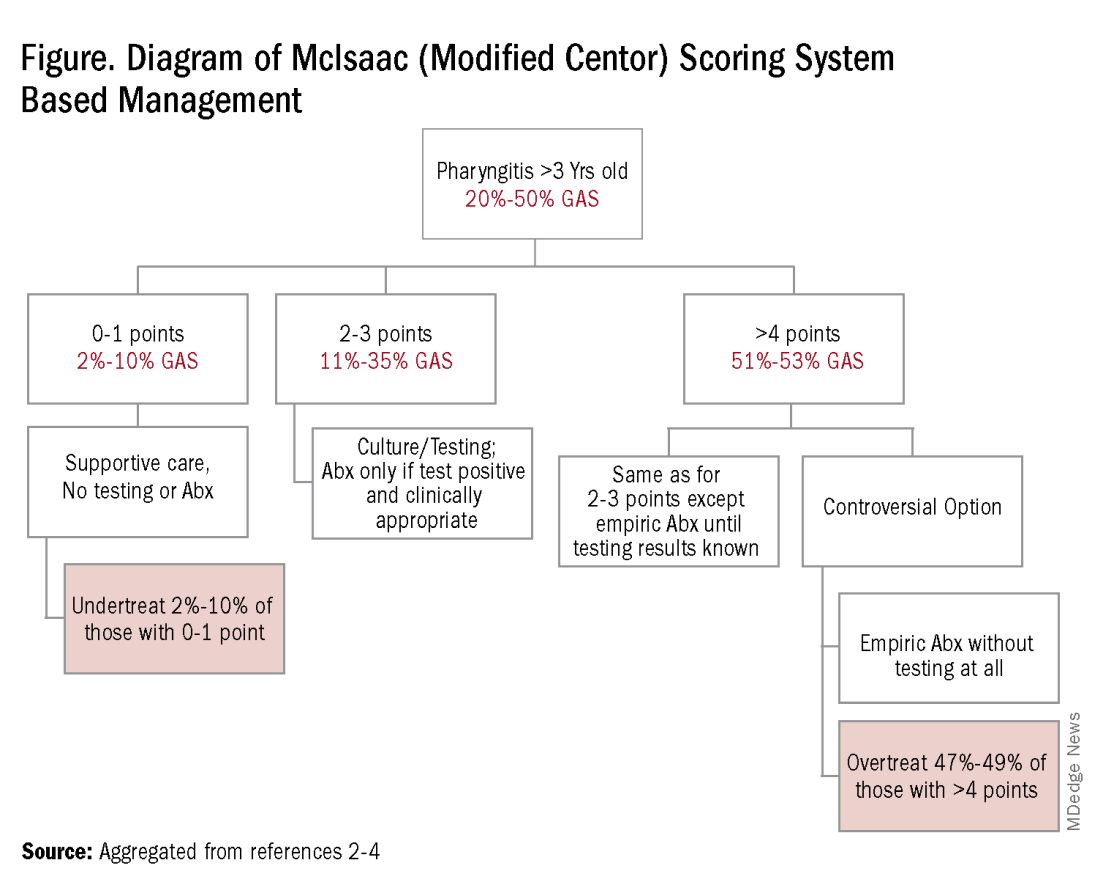
Best clinical judgment. Regardless of the chosen test, we still need to interpret positive results, ie, use best clinical judgment. We know that even with pretest screening some positives tests will represent carriers or nonviable GAS. Yet true GAS pharyngitis needs antibiotic treatment to minimize nonpyogenic and pyogenic complications, plus reduce contagion/transmission risk and days of illness. Thus, we are forced to use best clinical judgment when considering if what could be GAS pharyngitis, particularly exudative pharyngitis, could actually be due to EBV, adenovirus, or gonococcus, each of which can mimic GAS findings. Differentiating these requires discussion beyond the scope of this article, but clues are often found in the history, the patient’s age, associated symptoms and distribution of tonsillopharyngeal exudate. Likewise Group C and G streptococcal pharyngitis can mimic GAS. Note: A comprehensive throat culture can identify these streptococci but requires a special order and likely a call to the laboratory.
Summary: The age-old problem persists, ie, differentiating the minority (~30%) of pharyngitis cases needing antibiotics from the majority that do not. We all wish to promptly treat true GAS pharyngitis; however our current tools remain imperfect. That said, we should strive to correctly diagnose/manage as many patients with pharyngitis as possible. I, for one, can’t wait until we get a validated biomarker that confirms GAS as the culprit in pharyngitis episodes. In the meantime, most providers likely have clinic or hospital approved pathways for managing GAS pharyngitis, many of which are at least in part based on data from sources for this discussion. If not, a firm foundation for creating one can be found in sources among the reference list below. Finally, if you think such pathways somehow interfere with patient flow, consider that a busy multi-provider private practice successfully integrated pretest screening and a pathway while maintaining patient flow and improving antibiotic stewardship.7
*Focal pharyngotonsillar GAS infection is rare in children younger than 3 years old, when GAS nasal passage infection may manifest as streptococcosis.9
Dr Harrison is professor of pediatrics and pediatric infectious diseases at Children’s Mercy Hospitals and Clinics, Kansas City, Missouri. He has no relevant financial disclosures. Email him at pdnews@mdedge.com.
References
1. Bannerjee D, Selvarangan RS. The Evolution of Group A Streptococcus Pharyngitis Testing. Association for Diagnostics and Laboratory Medicine, 2018, Sep 1.
2. Cohen JF et al. Group A Streptococcus Pharyngitis in Children: New Perspectives on Rapid Diagnostic Testing and Antimicrobial Stewardship. J Pediatric Infect Dis Soc. 2024 Apr 24;13(4):250-256. doi: 10.1093/jpids/piae0223.
3. Boyanton Jr BL et al. Current Laboratory and Point-of-Care Pharyngitis Diagnostic Testing and Knowledge Gaps. J Infect Dis. 2024 Oct 23;230(Suppl 3):S182–S189. doi: 10.1093/infdis/jiae415.
4. Group A Strep Infection. Centers for Disease Control and Prevention, 2024, Mar 1.
5. Shulman ST et al. Clinical Practice Guideline for the Diagnosis and Management of Group A Streptococcal Pharyngitis: 2012 Update by the Infectious Diseases Society of America. Clin Infect Dis. 2012 Nov 15;55(10):e86-102. doi: 10.1093/cid/cis629.
6. Rao A et al. Diagnosis and Antibiotic Treatment of Group A Streptococcal Pharyngitis in Children in a Primary Care Setting: Impact of Point-of-Care Polymerase Chain Reaction. BMC Pediatr. 2019 Jan 16;19(1):24. doi: 10.1186/s12887-019-1393-y.
7. Norton LE et al. Improving Guideline-Based Streptococcal Pharyngitis Testing: A Quality Improvement Initiative. Pediatrics. 2018 Jul;142(1):e20172033. doi: 10.1542/peds.2017-2033.
8. MD+ Calc website. Centor Score (Modified/McIsaac) for Strep Pharyngitis.
9. Langlois DM, Andreae M. Group A Streptococcal Infections. Pediatr Rev. 2011 Oct;32(10):423-9; quiz 430. doi: 10.1542/pir.32-10-423.
It’s wintertime, peak season for GAS pharyngitis, and you’d think that this far into the 21st century we would have a foolproof process for diagnosing which among the many patients with pharyngitis have true GAS pharyngitis. Thinking back to the 1980s, we have come a long way from simple throat cultures for detecting GAS, e.g., numerous point of care (POC) Clinical Laboratory Improvement Amendments (CLIA), waved rapid antigen detection tests (RADT), and numerous highly sensitive molecular assays, e.g. nucleic acid amplification tests (NAAT). But if you think the issues surrounding management of GAS pharyngitis have been solved by these newer tests, think again.
Several good reviews1-3 are excellent resources for those wishing a refresher on GAS diagnosis/management issues. They present nitty gritty details on comparative advantages/disadvantages of the many testing options while reminding us of the nuts and bolts of GAS pharyngitis. The following are a few nuggets from these articles.
Properly collected throat specimen. A quality throat specimen involves swabbing both tonsillar pillars plus posterior pharynx without touching tongue or inner cheeks. Two swab collections increase sensitivity by almost 10% compared with a single swab. Transport media is preferred if samples will not be cultured within 24 hours. Caveat: RADT testing of a transport media-diluted sample lowers sensitivity compared with direct swab use.
Reliable GAS detection. Commercially available tests in 2025 are well studied. Culture is considered a gold standard for detecting clinically relevant GAS by CDC.4 Culture has good sensitivity (estimated 80%-90% varying among studies and by quality of specimens) and 99% specificity but requires 16-24 hours for results. RADT solves the time-delay issues and has near 100% specificity but sensitivity used to be as low as 65%, hence the 2012 Infectious Diseases Society of America guideline recommendation for backup throat culture for negative tests.5 However, current RADT have sensitivities in the 85%-90% range.3,4 So a positive RADT reliably and quickly indicates GAS antigens are present. NAAT have the highest combined sensitivity and specificity, near 100% for each, and a positive reliably indicates GAS nucleic acids are present.
So why not simply always use NAAT? First, it’s a “be careful what you wish for” scenario. NAAT can, and do, detect dead remnants and colonizing GAS way more than culture.2,3 So NAAT are overly sensitive, adding an extra layer of interpretation difficulty, ie, as many as 20% of positive NAAT detections may be carriers or dead GAS. Second, NAAT often requires special instrumentation and kits are more expensive. That said, reimbursement is often higher for NAAT.
Choice based on accuracy in detecting GAS. If time delays were not a problem, culture would still seem the answer. If more rapid detection is needed, either RADT with culture back up or NAAT could be the answer. That said, consider that in the real world, throat cultures are less sensitive and RADT are less specific than indicated by some published data.6 So, the ideal answer, it seems, would be NAAT GAS detection coupled with a confirmatory biomarker of GAS infection. Such innate immune biomarkers may be on the horizon.3
But first, pretest screening. In 2025 what do we do with a positive result? Do we prescribe antibiotics? Do we think the detected GAS bacteria/antigens/nucleic acids represent the cause of the pharyngitis? Or did we just detect dead GAS or even a carrier, while a virus is the true cause? Challenges for this decision include most pharyngitis (up to 70%) being due to viruses, not GAS, plus up to 20% of GAS detections even by less sensitive culture or RADT can be carriers, plus an added 10%-20% of RADT and NAAT detections are dead GAS. Thus, with indiscriminate testing of all pharyngitis patients, the number of truly positive GAS detections that are actually “false positives” (GAS in some form is present but not causing pharyngitis) may be almost as high as for those representing true GAS pharyngitis.
Some tool is needed to minimize testing patients who are likely to have viral pharyngitis to reduce test-positive/GAS-pharyngitis-negative scenarios. Pretest patient screening therefore is critical to increase the positive predictive value of positive GAS testing results. The history and physical can be helpful. In the simplest form of pretest screening, eliminate those younger than 3 years old* or those with viral type sign/symptoms, eg conjunctivitis, cough, coryza.7 This could cut “false” positives by as much as a half. More complete validated scoring systems are also available but remain imperfect. The most published is the McIsaac score (modified Centor score).3-5,8 (See Table and Figure.)
However, even with this validated scoring system, misdiagnoses and some antibiotic misuse will likely occur, particularly if the controversial option to treat a patient with a score above 4 without testing is used. For example, a 2004 study in patients older than 3 years old revealed that 45% with a score above 4 points did not have GAS pharyngitis. (McIsaac et al.) A 2012 study showed similar potential overdiagnosis from using the score without testing (45% with > 4 points did not have GAS pharyngitis). Of note, clinical scores of below 2 comprised up to 10% and would be neither tested nor treated. (Figure.)
Best clinical judgment. Regardless of the chosen test, we still need to interpret positive results, ie, use best clinical judgment. We know that even with pretest screening some positives tests will represent carriers or nonviable GAS. Yet true GAS pharyngitis needs antibiotic treatment to minimize nonpyogenic and pyogenic complications, plus reduce contagion/transmission risk and days of illness. Thus, we are forced to use best clinical judgment when considering if what could be GAS pharyngitis, particularly exudative pharyngitis, could actually be due to EBV, adenovirus, or gonococcus, each of which can mimic GAS findings. Differentiating these requires discussion beyond the scope of this article, but clues are often found in the history, the patient’s age, associated symptoms and distribution of tonsillopharyngeal exudate. Likewise Group C and G streptococcal pharyngitis can mimic GAS. Note: A comprehensive throat culture can identify these streptococci but requires a special order and likely a call to the laboratory.
Summary: The age-old problem persists, ie, differentiating the minority (~30%) of pharyngitis cases needing antibiotics from the majority that do not. We all wish to promptly treat true GAS pharyngitis; however our current tools remain imperfect. That said, we should strive to correctly diagnose/manage as many patients with pharyngitis as possible. I, for one, can’t wait until we get a validated biomarker that confirms GAS as the culprit in pharyngitis episodes. In the meantime, most providers likely have clinic or hospital approved pathways for managing GAS pharyngitis, many of which are at least in part based on data from sources for this discussion. If not, a firm foundation for creating one can be found in sources among the reference list below. Finally, if you think such pathways somehow interfere with patient flow, consider that a busy multi-provider private practice successfully integrated pretest screening and a pathway while maintaining patient flow and improving antibiotic stewardship.7
*Focal pharyngotonsillar GAS infection is rare in children younger than 3 years old, when GAS nasal passage infection may manifest as streptococcosis.9
Dr Harrison is professor of pediatrics and pediatric infectious diseases at Children’s Mercy Hospitals and Clinics, Kansas City, Missouri. He has no relevant financial disclosures. Email him at pdnews@mdedge.com.
References
1. Bannerjee D, Selvarangan RS. The Evolution of Group A Streptococcus Pharyngitis Testing. Association for Diagnostics and Laboratory Medicine, 2018, Sep 1.
2. Cohen JF et al. Group A Streptococcus Pharyngitis in Children: New Perspectives on Rapid Diagnostic Testing and Antimicrobial Stewardship. J Pediatric Infect Dis Soc. 2024 Apr 24;13(4):250-256. doi: 10.1093/jpids/piae0223.
3. Boyanton Jr BL et al. Current Laboratory and Point-of-Care Pharyngitis Diagnostic Testing and Knowledge Gaps. J Infect Dis. 2024 Oct 23;230(Suppl 3):S182–S189. doi: 10.1093/infdis/jiae415.
4. Group A Strep Infection. Centers for Disease Control and Prevention, 2024, Mar 1.
5. Shulman ST et al. Clinical Practice Guideline for the Diagnosis and Management of Group A Streptococcal Pharyngitis: 2012 Update by the Infectious Diseases Society of America. Clin Infect Dis. 2012 Nov 15;55(10):e86-102. doi: 10.1093/cid/cis629.
6. Rao A et al. Diagnosis and Antibiotic Treatment of Group A Streptococcal Pharyngitis in Children in a Primary Care Setting: Impact of Point-of-Care Polymerase Chain Reaction. BMC Pediatr. 2019 Jan 16;19(1):24. doi: 10.1186/s12887-019-1393-y.
7. Norton LE et al. Improving Guideline-Based Streptococcal Pharyngitis Testing: A Quality Improvement Initiative. Pediatrics. 2018 Jul;142(1):e20172033. doi: 10.1542/peds.2017-2033.
8. MD+ Calc website. Centor Score (Modified/McIsaac) for Strep Pharyngitis.
9. Langlois DM, Andreae M. Group A Streptococcal Infections. Pediatr Rev. 2011 Oct;32(10):423-9; quiz 430. doi: 10.1542/pir.32-10-423.
Crying Tolerance
Most of the papers I review merely validate a relationship that most of us, including the investigators, have already assumed based on common sense. However, every now and then I encounter a study whose findings clearly don’t support the researchers’ initial thesis. The most recent example of this unexpected finding is a paper designed to determine whether the sound of a crying infant would have an effect on a parent’s ability to accurately mix formula.
After a cursory reading of the investigators’ plan, most of us would have assumed from our own difficulties trying to accomplish something while our infant is crying that the crying would have a negative effect on our accuracy. Especially if it was a task that required careful measurement. However, when I skipped ahead to read the paper’s conclusion I was surprised that the investigators could found no significant negative relationship.
The explanation for this counterintuitive finding became readily apparent when I read the details of the study’s design more carefully. The investigators had chosen to use a generic recording of an infant crying, not the parent’s child nor even a live generic child on site.
No one enjoys listening to a child cry. It is certainly not a pleasant sound to the human ear. We seem to be hardwired to find it irritating. But, listening to our own child cry raises an entirely different suite of emotions, particularly if the child is close enough for us to intervene.
I’m not sure exactly what made the investigators choose a generic recording, but I suspect it was less expensive. Otherwise it would have required that the parents agree to subjecting their child to some stimulus that would have predictably induced the child to cry. Fortunately, the investigators were able to regroup in the wake of this lack of common sense in their experimental design and realized that, while their data failed to show a negative association with crying, it did provide an important message. Formula mixing errors, some with potentially harmful consequences, are far too common. In a commentary accompanying this paper, a pediatrician not involved in the study observes that, in our efforts to promote breastfeeding, we have given short shrift to teaching parents about accurate and safe formula preparation.
But, let’s return to the crying piece. Why is it so difficult for parents to tolerate their own crying infant? Common sense should tell us that we know our infant is helpless. The little child is totally reliant on us to for nutrition and protection from the ever-present environmental threats to its health and safety in the environment. In short, whether we are parents, daycare providers, or the mother’s boyfriend who has been left in charge, we are totally responsible for the life of that infant, at times a heavy burden.
That example of biologic variability is just one of the reasons why so many families find it difficult to set limits and follow through with consequences. When I have written about and spoken to parents in the office about discipline, I am happy if I can convince both parents to be on the same page (literally sometimes) in how they respond to their crying child.
Helping an infant learn to put itself to sleep is usually the first challenge that requires some agreement between parents on how long they can tolerate crying. Although allowing the infant to cry itself to sleep may be the best and most efficient strategy, it isn’t going to work when two parents and/or caregivers have widely different cry tolerances. In some situations these discrepancies can be managed by having the less tolerant parent temporarily move himself/herself to a location out of earshot. Something often easier said than accomplished.
At the heart of the solution is an acceptance by both parents that differing cry intolerances are not unusual and don’t imply that one partner is a better parent. As advisors we also must accept this reality and help the family find some other solution. Nothing is gained by allowing a disagreement between parents to make an already uncomfortable situation any worse.
While we don’t give out merit badges for it, being able to tolerate one’s own child crying for brief periods of time is a gift that can be helpful in certain situations. It is not a skill listed in the curriculum of most parenting classes, but learning more about what prompts babies to cry can be very helpful. This educational approach is exemplified by a Pediatrics Patient Page in a recent issue of JAMA Pediatrics. It’s rarely hunger and most often is sleep deprivation. It’s rarely the result of an undiscovered injury or medical condition, but may be a response to an overstimulating environment.
For those of us who are advisers, one of our responsibilities is to be alert to those few individuals whose intolerance to crying is so great that they are likely to injure the child or its mother to stop the crying. The simple question at an early well-child visit should be something like “How is everyone in the house when the child starts crying” might save a life. The stereotypic example is the young boyfriend of the mother, who may suspect that he is not the biologic father. However, any parent who is feeling insecure because of a financial situation, poor physical or mental health, or fatigue may lash out to achieve quiet. Crying is one of the realities of infancy. It is our job to help parents cope with it safely.
Dr. Wilkoff practiced primary care pediatrics in Brunswick, Maine, for nearly 40 years. He has authored several books on behavioral pediatrics, including “How to Say No to Your Toddler.” Other than a Littman stethoscope he accepted as a first-year medical student in 1966, Dr. Wilkoff reports having nothing to disclose. Email him at pdnews@mdedge.com.