User login
Inflammatory markers predict vaccine response in HCV, HIV
In patients with chronic hepatitis C (HCV) and HIV infection, blood protein markers showing evidence of systemic inflammation were associated with a poor immune response to hepatitis A/hepatitis B vaccination, according to a study of blood samples obtained in two small clinical trials.
Prevaccination plasma levels of inflammatory proteins IP10, IL-6, and sCD14 were elevated in both HCV- and HIV-infected patients, while sCD163 was also elevated in HCV-infected patients, according to the report in Vaccine.
Fifteen HCV-infected, 24 HIV-infected, and 10 uninfected control patients followed an appropriate vaccination course for a combined hepatitis A–hepatitis B vaccine. Antibody levels against the challenging vaccine proteins were assessed and quantified by ELISA, according to Carey L. Shive, PhD, of Louis Stokes Cleveland VA Medical Center, and her colleagues.
After HAV/HBV vaccination, HCV- and HIV-infected patients had lower and less durable HAV and HBV antibody responses than those of uninfected control patients. This was inversely correlated with the level of the inflammatory proteins seen in HCV-infected patients. The level of the HAV/HBV antibody response was too low in the HIV-infected patients to assess correlations with the inflammatory protein levels.
The researchers speculated that the elevated blood inflammatory markers indicated similar elevation in lymph node tissues, where high levels of the proteins may effect the survival and function of T follicular helper cells that may influence the generation of B cell antibody response and B cell memory activation to vaccination.
“Understanding mechanisms underlying immune impairment during chronic viral infection is needed to guide strategies to improve immune health during these morbid infections,” the researchers concluded.
The authors reported having no conflicts. The study was funded by U.S. government grants.
Source: Shive, CL et al. Vaccine 2018;38:453-60.
FROM VACCINE
Key clinical point:
Major finding: HCV/HIV-associated inflammatory markers reflect immune dysfunction and poor performance of subsequent vaccinations.
Study details: Clinical trials comparing 15 HCV-infected, 24 HIV-infected, and 10 uninfected control patients.
Disclosures: The authors reported having no conflicts. The study was funded by U.S. government grants.
Source: Shive, CL et al. Vaccine 2018;38:453-60.
MMWR: Current flu vaccine does not protect elderly
, according to the Feb. 16 issue of Morbidity and Mortality Weekly Report.
The elderly are not among them. Although the vaccine was somewhat protective in children and adults up to 49 years old, “no statistically significant protection was observed in other age groups,” including people 65 years and older, reported investigators led by Brendan Flannery, PhD, of the Centers for Disease Control and Prevention influenza division.![]()
They also reported that the cumulative hospitalization rate attributed to laboratory-confirmed influenza for the week ending Feb. 3, 2018 (59.9/100,000), exceeded the rate for the same week in 2014-2015 (50.9/100,000), an A(H3N2) virus–predominant season, and is the highest rate observed for this week since the system expanded to include adults during the 2005-2006 season.
This year’s overall effectiveness rating was in contrast to the 2016-2017 seasonal effectiveness of 48% (MMWR. 2017 Feb 17;66[6];167-71).
The CDC noted that influenza is going to be active for several more weeks, so “vaccination is still recommended,” but “treatment with influenza antiviral medications, where appropriate, is especially important this season.” Meanwhile, “influenza vaccines with improved effectiveness are needed,” the CDC said.
The estimates are based on 4,562 patients 6 months to over 65 years old presenting with acute respiratory illness in 2018 from Nov. 2 to Feb. 3 at five outpatient medical clinics scattered across the United States. Nasal and oropharyngeal swabs were tested with reverse transcription polymerase chain reaction for the presence of influenza viruses; 413 subjects were 65 years or older.

Vaccine effectiveness against the less common virus A(H1N1)pdm09 was 67%, and 42% against the even rarer influenza B viruses. Estimates were adjusted for a range of confounders, including study site, age, general health, and week of illness. Vaccination rates ranged from 45% to 59% across the study sites; 38% of the subjects tested positive for influenza, most for type A viruses. The shot didn’t work too well: 43% of the influenza cases had gotten it.
The 25% effectiveness against A(H3N2) is a bit higher than recent reports of 17% from Canada and 10% from Australia, but similar to the 32% efficacy reported in the United States for the 2016-2017 season.
“These interim estimates reflect ongoing challenges with the A(H3N2) vaccine component since the 2011-12 season,” the investigators wrote. “Multiple factors might be contributing to the reported [vaccine effectiveness] against A(H3N2) viruses this season. … Genetic changes in the vaccine virus hemagglutinin protein that arise during passage in eggs might result in a vaccine immune response that is less effective against circulating viruses.”
On a related note, on Feb. 18, Senators Edward J. Markey (D-Mass.), Richard Blumenthal (D-Conn.), and Amy Klobuchar (D-Minn.) held a press conference to announce they were introducing the Flu Vaccine Bill to dedicate $1 billion over a 5-year period in order to develop a flu vaccine that could provide lifetime protection.
The investigators had no conflicts of interest.
SOURCE: Flannery B. et al. MMWR. 2018 Feb 16;67(6):180-5; Budd A. et al. MMWR. 2018 Feb 16;67(6):169-79.
, according to the Feb. 16 issue of Morbidity and Mortality Weekly Report.
The elderly are not among them. Although the vaccine was somewhat protective in children and adults up to 49 years old, “no statistically significant protection was observed in other age groups,” including people 65 years and older, reported investigators led by Brendan Flannery, PhD, of the Centers for Disease Control and Prevention influenza division.![]()
They also reported that the cumulative hospitalization rate attributed to laboratory-confirmed influenza for the week ending Feb. 3, 2018 (59.9/100,000), exceeded the rate for the same week in 2014-2015 (50.9/100,000), an A(H3N2) virus–predominant season, and is the highest rate observed for this week since the system expanded to include adults during the 2005-2006 season.
This year’s overall effectiveness rating was in contrast to the 2016-2017 seasonal effectiveness of 48% (MMWR. 2017 Feb 17;66[6];167-71).
The CDC noted that influenza is going to be active for several more weeks, so “vaccination is still recommended,” but “treatment with influenza antiviral medications, where appropriate, is especially important this season.” Meanwhile, “influenza vaccines with improved effectiveness are needed,” the CDC said.
The estimates are based on 4,562 patients 6 months to over 65 years old presenting with acute respiratory illness in 2018 from Nov. 2 to Feb. 3 at five outpatient medical clinics scattered across the United States. Nasal and oropharyngeal swabs were tested with reverse transcription polymerase chain reaction for the presence of influenza viruses; 413 subjects were 65 years or older.
Vaccine effectiveness against the less common virus A(H1N1)pdm09 was 67%, and 42% against the even rarer influenza B viruses. Estimates were adjusted for a range of confounders, including study site, age, general health, and week of illness. Vaccination rates ranged from 45% to 59% across the study sites; 38% of the subjects tested positive for influenza, most for type A viruses. The shot didn’t work too well: 43% of the influenza cases had gotten it.
The 25% effectiveness against A(H3N2) is a bit higher than recent reports of 17% from Canada and 10% from Australia, but similar to the 32% efficacy reported in the United States for the 2016-2017 season.
“These interim estimates reflect ongoing challenges with the A(H3N2) vaccine component since the 2011-12 season,” the investigators wrote. “Multiple factors might be contributing to the reported [vaccine effectiveness] against A(H3N2) viruses this season. … Genetic changes in the vaccine virus hemagglutinin protein that arise during passage in eggs might result in a vaccine immune response that is less effective against circulating viruses.”
On a related note, on Feb. 18, Senators Edward J. Markey (D-Mass.), Richard Blumenthal (D-Conn.), and Amy Klobuchar (D-Minn.) held a press conference to announce they were introducing the Flu Vaccine Bill to dedicate $1 billion over a 5-year period in order to develop a flu vaccine that could provide lifetime protection.
The investigators had no conflicts of interest.
SOURCE: Flannery B. et al. MMWR. 2018 Feb 16;67(6):180-5; Budd A. et al. MMWR. 2018 Feb 16;67(6):169-79.
FROM MORBIDITY AND MORTALITY WEEKLY REPORT
Pediatrician blogs generally provide accurate vaccine information
Pediatrician blogs frequently provide accurate information to parents concerning vaccines, although some blogs do provide information inconsistent with Centers for Disease Control and Prevention guidelines, a study found.
“ However, we identified two exceptions in which pediatrician blogs conveyed extremely inaccurate, antivaccine information,” wrote Mersine A. Bryan, MD, of the University of Washington, Seattle, and her colleagues. “These two extreme blogs were the only blogs that contained any information that was not consistent with CDC information. This finding is important because pediatricians are viewed by parents as a trusted source of information about vaccines.”
Ultimately, the researchers examined 31 blogs with 324 posts related to vaccine content. Most of the information addressed “specific vaccines,” which accounted for 36% of all vaccine-related blog posts. The two most discussed vaccines were MMR (41% of vaccine-specific posts) and influenza (35%). Pediatrician bloggers also commonly addressed “activism against antivaccination,” which was the second most popular topic category.
The analysis revealed that many of the blog posts (91%) on 29 pediatrician blogs provided CDCC information. Only two blogs contained inaccurate vaccine information. Vaccine safety was the most commonly refuted CDCC information, with inaccurate information such as, “We are literally poisoning unborn children with the Tdap now being given to pregnant women with no testing ever done to inject that much aluminum into pregnant animals even!”
Vaccine-scheduling CDCC information was another topic that was addressed inaccurately, with statements such as, “Routine administration of hepatitis B vaccine to 1-day-old infants, which began in 1991, is an unwarranted practice that needs to stopped as soon as possible.” Delayed vaccinations also were inaccurately discussed in 5% of blog posts from two bloggers, who recommended that hepatitis B and MMR vaccines be delayed.
The study had several limitations, including how the blogs were selected for analysis; all were identified using common search engines, which may have caused researchers to miss an unknown number of blogs. In addition, information may have been augmented by “hyperbloggers,” who account for a large proportion of blog posts about vaccines, the researchers reported in Vaccine.
“While uncommon, the presentation of inaccurate, antivaccine information on pediatrician blogs may be persuasive to parents reading vaccine information online. Parents who delay immunizations due to safety concerns are more likely to use the Internet to learn more about vaccines,” wrote Dr. Bryan and her colleagues. “While these negative pediatrician bloggers are the exception, their impact may be disproportionate as people exposed to negative vaccine information in blog format have a more negative view of vaccinations than those exposed to positive vaccine information. Half of parents do not cross-check the information they read online with their doctor.”
The authors had no relevant financial disclosures.
SOURCE: Bryan MA et al. Vaccine. 2018 Jan 29;36(5):765-70.
Facebook and Twitter are useful tools for spreading vaccine information to families, but refuting “antivaccine” information can cause pushback.
“I use social media to disseminate information to families in my practice via a practice Facebook page, as well as to a larger audience via Twitter. I also share information with personal comments on my personal Facebook page,” Deborah Greenhouse, MD, said in an interview. “I have definitely run into questions over concerns with specific vaccines, particularly HPV [human papillomavirus] vaccine and MMR vaccine. Most of these originate with anecdotal posts about vaccine adverse effects.”
When addressing vaccine fears, Dr. Greenhouse presents current, fact-based information from credible sources, stressing the fact that correlation does not equal causation. To keep the lines of communication open, she encourages her patients to call with vaccine safety related questions.
While she has had some positive experiences with refuting “antivaccine” information, it also has been unpleasant. “Sometimes my posts and tweets have led to good interactive discussion. But sometimes they have led to extremely hostile and sometimes obscenity-laden responses by antivaccine activists.”
Despite “antivaccine” concern and pushback via social media, “alternative scheduling” is not viewed as “better than nothing,” she said. The vaccine schedule is based on solid science and should be adhered to. Deviating from a recommended vaccine schedule can put a child at unnecessary, and unacceptable, risk.
Dr. Greenhouse has used social media outreach to effectively provide information to her patients, but also has noted that some pediatricians provide inaccurate information online. “They are tougher to refute than the typical layperson because their credentials make them seem credible.”
Dr. Deborah Greenhouse is a board-certified pediatrician at the Palmetto Pediatric and Adolescent Clinic in Columbia, S.C. She is also a fellow of the American Academy of Pediatrics.
Pediatrician blogs frequently provide accurate information to parents concerning vaccines, although some blogs do provide information inconsistent with Centers for Disease Control and Prevention guidelines, a study found.
“ However, we identified two exceptions in which pediatrician blogs conveyed extremely inaccurate, antivaccine information,” wrote Mersine A. Bryan, MD, of the University of Washington, Seattle, and her colleagues. “These two extreme blogs were the only blogs that contained any information that was not consistent with CDC information. This finding is important because pediatricians are viewed by parents as a trusted source of information about vaccines.”
Ultimately, the researchers examined 31 blogs with 324 posts related to vaccine content. Most of the information addressed “specific vaccines,” which accounted for 36% of all vaccine-related blog posts. The two most discussed vaccines were MMR (41% of vaccine-specific posts) and influenza (35%). Pediatrician bloggers also commonly addressed “activism against antivaccination,” which was the second most popular topic category.
The analysis revealed that many of the blog posts (91%) on 29 pediatrician blogs provided CDCC information. Only two blogs contained inaccurate vaccine information. Vaccine safety was the most commonly refuted CDCC information, with inaccurate information such as, “We are literally poisoning unborn children with the Tdap now being given to pregnant women with no testing ever done to inject that much aluminum into pregnant animals even!”
Vaccine-scheduling CDCC information was another topic that was addressed inaccurately, with statements such as, “Routine administration of hepatitis B vaccine to 1-day-old infants, which began in 1991, is an unwarranted practice that needs to stopped as soon as possible.” Delayed vaccinations also were inaccurately discussed in 5% of blog posts from two bloggers, who recommended that hepatitis B and MMR vaccines be delayed.
The study had several limitations, including how the blogs were selected for analysis; all were identified using common search engines, which may have caused researchers to miss an unknown number of blogs. In addition, information may have been augmented by “hyperbloggers,” who account for a large proportion of blog posts about vaccines, the researchers reported in Vaccine.
“While uncommon, the presentation of inaccurate, antivaccine information on pediatrician blogs may be persuasive to parents reading vaccine information online. Parents who delay immunizations due to safety concerns are more likely to use the Internet to learn more about vaccines,” wrote Dr. Bryan and her colleagues. “While these negative pediatrician bloggers are the exception, their impact may be disproportionate as people exposed to negative vaccine information in blog format have a more negative view of vaccinations than those exposed to positive vaccine information. Half of parents do not cross-check the information they read online with their doctor.”
The authors had no relevant financial disclosures.
SOURCE: Bryan MA et al. Vaccine. 2018 Jan 29;36(5):765-70.
FROM VACCINE
Key clinical point: Pediatricians usually provide accurate information via blogs.
Major finding: 91% of blog posts on 29 pediatrician blogs contained only CDC-consistent information.
Study details: A content analysis of 31 pediatrician blogs from Jan. 1, 2014, to Feb. 28, 2015.
Disclosures: The authors had no relevant financial disclosures.
Source: Bryan MA et al. Vaccine. 2018 Jan 29;36(5):765-70.
Management of Community-Acquired Pneumonia in Adults
From the University of North Dakota School of Medicine & Health Sciences, Fargo, ND.
Abstract
- Objective: To review the management of community-acquired pneumonia (CAP) in adults.
- Methods: Review of the literature.
- Results: Approximately 4 to 5 million cases of CAP are diagnosed in the United States annually, accounting for significant morbidity and mortality. While numerous studies have previously shown pneumococcus to be the most common causative pathogen, the 2015 EPIC study found that in nearly two-thirds of patients with CAP who required hospitalization, no pathogen was detected. Symptoms and signs of respiratory tract infection are useful in helping to diagnose pneumonia; however, they are less sensitive than chest imaging studies. Laboratory tests used in diagnosing pneumonia include sputum Gram stain and culture, blood culture, urinary antigen, polymerase chain reaction, and biologic markers. In empiric treatment of CAP, both the typical and atypical pathogens should be targeted. Influenza vaccine and pneumococcal polysaccharide and conjugate vaccines should be administered as recommended by the CDC to reduce risk of CAP.
- Conclusion: CAP is a common illness with high rates of morbidity and mortality. Treatment is for the most part empirical; diagnostic testing can be used to identify the causative organism and guide pathogen-specific therapy.
Key words: community-acquired pneumonia; adults; management; vaccines.
Despite advances in medical science, pneumonia remains a major cause of morbidity and mortality. In 2014, 50,620 patients in the United States died from the disease [1]. Pneumonia can be classified as community-acquired, hospital-acquired, or ventilator-associated. Another category, healthcare-associated pneumonia, was included in an earlier American Thoracic Society (ATS) and Infectious Diseases Society of America (IDSA) guideline but was removed from the 2016 guideline because there was no clear evidence that patients diagnosed with healthcare-associated pneumonia were at higher risk for harboring multidrug-resistant pathogens [2]. In this article, we review the epidemiology, microbiology, predisposing factors, diagnosis, treatment, and prevention of community-acquired pneumonia (CAP).
Definition and Epidemiology
CAP is defined as an acute infection of the lungs that develops in patients who have not been hospitalized recently and have not had regular exposure to the health care system [3]. A previously ambulatory patient who is diagnosed with pneumonia within 48 hours after admission also meets the criteria for CAP. Approximately 4 to 5 million cases of CAP are diagnosed in the United States annually [4]. About 25% of CAP patients require hospitalization, and about 5% to 10% of these patients are admitted to the intensive care unit (ICU) [5]. In-hospital mortality is considerable (~10% in population-based studies) [6] and 30-day mortality was found to be as high as 23% in a review by File and Marrie [7]. CAP also confers a high risk of long-term morbidity and mortality compared with the general population who have never had CAP, irrespective of age [8].
Causative Organisms
Numerous microorganisms can cause CAP. Common causes and less common causes are delineated in Table 1. 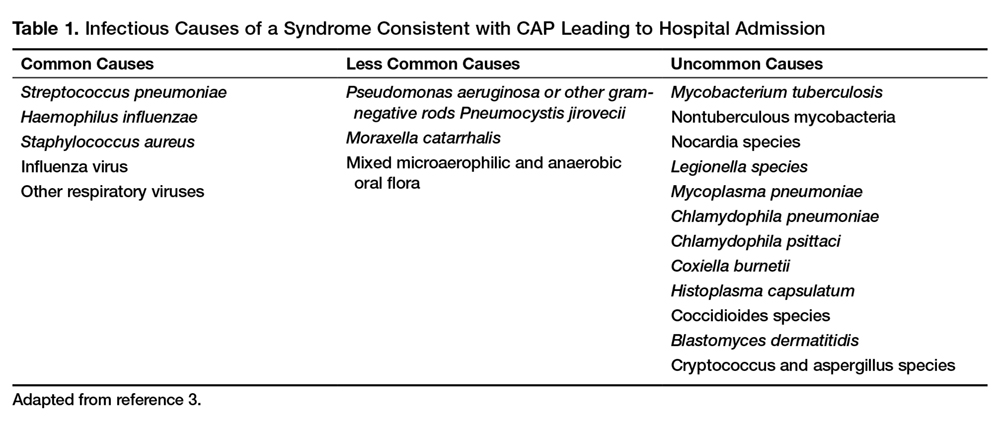
Predisposing Factors
Most people diagnosed with CAP have one or more predisposing factors [12,13] (Table 2). 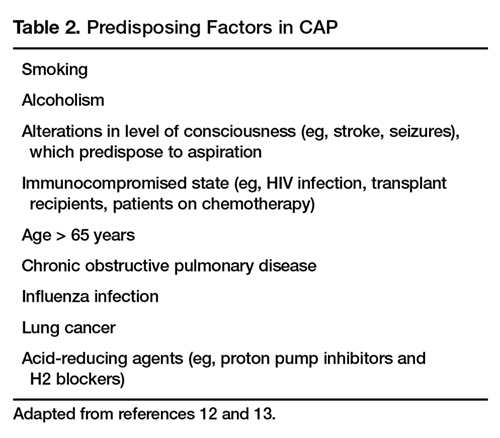
Clinical Signs and Symptoms
Symptoms of CAP include fever, chills, rigors, fatigue, anorexia, diaphoresis, dyspnea, cough (with or without sputum production), and pleuritic chest pain. There is no individual symptom or cluster of symptoms that can absolutely differentiate pneumonia from other acute respiratory diseases, including upper and lower respiratory infections. However, if a patient presents with the constellation of symptoms of fever ≥ 1000F (37.80C), productive cough, and tachycardia, it is more suggestive of pneumonia [14]. Abnormal vital signs include fever, hypothermia, tachypnea, tachycardia, and oxygen desaturation. Auscultation of the chest reveals crackles or other adventitious breath sounds. Elderly patients with pneumonia report a significantly lower number of both respiratory and nonrespiratory symptoms compared with younger patients. Clinicians should be aware of this phenomenon so it does not lead to delayed diagnosis and treatment [15].
Imaging Evaluation
The presence of a pulmonary consolidation or an infiltrate on chest radiograph is required to diagnose CAP, and a chest radiograph should be obtained when CAP is suspected [16]. It should be noted that there is no pattern of radiographic abnormalities reliable enough to differentiate infectious pneumonia from noninfectious causes [17].
There are case reports and case series demonstrating false-negative plain chest radiographs existing in dehydrated patients [18] or in neutropenic state. However, animal studies have shown that dogs challenged with pneumococcus showed abnormal pulmonary shadow, suggestive of pneumonia, regardless of hydration status [19]. There is also no reliable scientific evidence to support the notion that severe neutropenia can cause false-negative radiographs because of the inability to develop an acute inflammatory reaction in the lungs [20].
A chest CT scan is more sensitive than a plain chest radiograph in detecting pneumonia. Therefore, a chest CT should be performed in a patient with negative plain chest radiograph when pneumonia is still highly suspected [21]. A chest CT scan is also more sensitive in detecting cavitation, adenopathy, interstitial disease and empyema. It also has the advantage of better defining anatomical changes than plain films [22].
Because improvement of pulmonary opacities in patients with CAP lags behind clinical improvement, repeating chest imaging studies is not recommended in patients who demonstrate clinical improvement. Sometimes clearing of pulmonary infiltrate or consolidation can take 6 weeks or longer [23].
Laboratory Evaluation
Generally the etiologic agent of CAP cannot be determined solely on the basis of clinical signs and symptoms or imaging studies. Although routine microbiological testing for patients suspicious for CAP is not necessary for empirical treatment, by determining the etiologic agent of the pneumonia, a clinician will be able to narrow the antibiotics from a broad-spectrum empirical regimen to specific pathogen-directed therapy. Determination of certain etiologic agents causing the pneumonia can have important public health implications (eg, Mycobacterium tuberculosis and influenza virus) [24].
Sputum Gram Stain and Culture
Sputum Gram stain is an inexpensive test that may identify pathogens that cause CAP (eg, S. pneumonia and Haemophilus influenzae). A quality specimen is required. A sputum sample must contain > 25 neutrophils and < 10 squamous epithelial cells/low power field on Gram stain to be considered suitable for culture.
The sensitivity and specificity of sputum Gram stain and culture are highly variable in different clinical settings (eg, outpatient setting, nursing home, ICU). Reed et al’s meta-analysis of patients diagnosed with CAP in the United States showed the sensitivity and specificity of sputum Gram stain (compared with sputum culture) ranged from 15% to 100% and 11% to 100%, respectively [24]. In cases of proven bacteremic pneumococcal pneumonia, positive cultures from sputum samples were positive less than 50% of the time [25].
For patients who cannot provide sputum samples or are intubated, a deep-suction aspirate or bronchoalveolar lavage through a bronchoscopic procedure might be necessary to obtain pulmonary secretion for Gram stain and culture. Besides bacterial culture, sputum samples can also be sent for fungal and mycobacterial cultures and acid-fast stain if deemed clinically necessary.
Blood Culture
Because the positivity rate of blood culture in patients who are suspected to have pneumonia but not exposed to antimicrobial agents is disappointingly low (5%–14%), blood cultures are no longer recommended in patients hospitalized for CAP. Another reason for not recommending blood culture is positive culture rarely leads to changes in antibiotic regimen in patients without underlying diseases [26]. However, high-risk patients, including patients with severe CAP or in immunocompromised patients (eg, patients with neutropenia, asplenia or complement deficiencies) should have a blood culture done [24].
A multinational study published in 2008 examined 125 patients with pneumococcal bacteremic CAP versus 1847 patients with non-bacteremic CAP [27]. Analysis of the data demonstrated no association of pneumococcal bacteremic CAP and time to clinical stability, length of hospital stay, all-cause mortality or CAP-related mortality. The authors concluded that pneumococcal bacteremia does not increase the risk of poor outcomes in patients with CAP compared to non-bacteremic patients, and the presence of pneumococcal bacteremia should not deter de-escalation of therapy in clinically stable patients.
Urinary Antigen Tests
Urinary antigen tests may assist clinicians in narrowing antibiotic therapy when test results are positive. There are 2 U.S. Food and Drug Administration–approved tests available to clinicians for detecting pneumococcal and Legionella antigen in urine. The test for Legionella pneumophila detects disease due to serogroup 1 only, which accounts for 80% of community-acquired Legionnaires disease. The sensitivity and specificity of the Legionella urine antigen test are 90% and 99%, respectively. The pneumococcal urine antigen test is less sensitive and specific than the Legionella urine antigen test (sensitivity 80% and specificity > 90%) [28,29].
Advantages of the urinary antigen tests are that they are easily performed, results are available in less than an hour if done in-house, and results are not affected by prior exposure to antibiotics. However, the tests do not meet Clinical Laboratory Improvements Amendments criteria for waiver and must be performed by a technician in the laboratory.
Polymerase Chain Reaction
There are several FDA-approved polymerase chain reaction (PCR) tests commercially available to assist clinicians in diagnosing pneumonia. PCR test of nasopharyngeal swabs for diagnosing influenza have become standard in many medical U.S. facilities. The great advantage of using PCR to diagnose influenza is its high sensitivity and specificity and rapid turnaround time. PCR can also be used to detect Legionella species, S. pneumonia, Mycoplasma pneumoniae, Chlamydophila pneumonia and mycobacterial species [24].
One limitation of using PCR tests on respiratory specimens is that specimens can be contaminated with oral or upper airway flora, so the results must be interpreted with caution, bearing in mind that some of the pathogens isolated may be colonizers of the oral or upper airway flora [30].
Biologic Markers
Two biologic markers—procalcitonin and C-reactive protein (CRP)—can be used in conjunction with history, physical examination, laboratory tests and imaging studies to assist in the diagnosis and treatment of CAP [24]. Procalcitonin is a peptide precursor of the hormone calcitonin that is released by parenchymal cells into the bloodstream resulting in increased serum level in patients with bacterial infections. In contrast, there is no remarkable proclacitonin level increase with viral or noninfectious inflammation. The reference value of procalcitonin in the blood of an adult individual without infection or inflammation is < 0.15 ng/mL. In the blood, procalcitonin has a half-life of 25 to 30 hours. The quantitative immunoluminometric method (LUMI test, Brahms PCT, Berlin, Germany ) is the preferred test to use because of its high sensitivity [31].
A 2012 Cochrane meta-analysis that involved 4221 patients with acute respiratory infections (with half of the patients diagnosed with CAP) from 14 prospective trials found the use of procalcitonin test for antibiotic use significantly decreased median antibiotic exposure from 8 to 4 days without an increase in treatment failure, mortality rates in any clinical setting (eg, outpatient clinic, emergency room), or length of hospitalization [32]. A prospective study conducted in France on 100 ICU patients showed that increased procalcitonin from day 1 to day 3 has a poor prognosis factor for severe CAP whereas decreasing procalcitonin levels is associated with a favorable outcome [33].
CRP is an acute phase protein produced by the liver. CRP level in the blood increases in response to acute infection or inflammation. Use of CRP in assisting diagnosis and guiding treatment of CAP is more limited in part due to its poor specificity. A prospective study conducted on 168 consecutive patients presented with cough showed that a CRP > 40 mg/L had a sensitivity and specificity of 70% and 90%, respectively [34].
T reatment
Site of Care Decision
For patients with CAP, the clinician must decide whether the patient will be treated in an outpatient or inpatient setting, and for those in the inpatient setting, whether they can safely be treated on the general medical ward or should be the ICU. Two common scoring systems that can be used to aid the clinician in determining severity of the infection and guiding site-of-care decisions are the Pneumonia Severity Index (PSI) and CURB-65 scores.
The PSI score uses 20 different parameters, including comorbidities, laboratory parameters and radiographic findings to stratify patients into 5 mortality risk classes [35]. On the basis of associated mortality rates, it has been suggested that risk class I and II patients should be treated as outpatients, risk class III patients should be treated in an observation unit or with a short hospitalization, and risk class IV and V patients should be treated as inpatients [35].
The CURB-65 method of risk stratification is based on 5 clinical parameters: confusion, urea level, respiratory rate, systolic blood pressure and age ≥ 65 (Table 3) [36]. 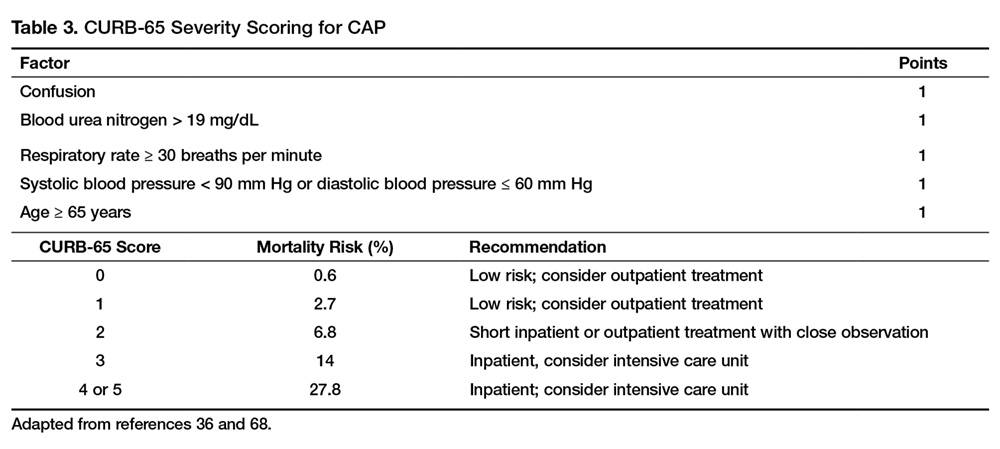
Patients with CURB-65 scores of 4 or 5 are considered to have severe pneumonia and admission to the ICU should be considered. Aside from the CURB-65 score, anyone requiring vasopressor support or mechanical ventilation merits admission to the ICU [16]. IDSA/ATS guidelines also recommend the use of “minor criteria” for making ICU admission decisions; these include respiratory rate ≥ 30 breaths / minute, PaO2 fraction ≤ 250, multilobar infiltrates, confusion, blood urea nitrogen ≥ 20 mg/dL, leukopenia, thrombocytopenia, hypothermia and hypotension [16]. These factors are associated with increased mortality due to CAP and admission to an ICU is indicated if 3 of the minor criteria for severe CAP are present.
Similar to CURB-65, another clinical calculator that can be used for assessing severity of CAP is SMART-COP [39]. This scoring system uses 8 weighted criteria to predict which patients will require intensive respiratory or vasopressor support. SMART-COP has a sensitivity of 79% and specificity 64% in predicting ICU admission, whereas CURB-65 had a pooled sensitivity of 57.2% and specificity of 77.2% [40].
Antibiotic Therapy
Antibiotics are the mainstay of treatment for CAP, with the majority of patients with CAP treated empirically taking into account the site of care, likely pathogen, and antimicrobial resistance issues. Patients with pneumonia who are treated as outpatients usually respond well to empiric antibiotic treatment and a causative pathogen is not usually sought. Patients who are hospitalized for treatment of CAP usually receive empiric antibiotic on admission. Once the etiology has been determined by microbiologic or serologic means, antimicrobial therapy should be adjusted accordingly. As noted previously, a CDC study found that the burden of viral etiologies was higher than previously thought, with rhinovirus and influenza accounting for 15% of cases and S. pneumoniae for only 5% [9]. This study highlighted the fact that despite advances in molecular techniques, most patients with pneumonia have no pathogen identified [9]. Given the lack of discernable pathogens in the majority of cases, unless a nonbacterial etiology is found patients should continue to be treated with antibiotics.
Outpatients without comorbidities or risk factors for drug-resistant S. pneumoniae (Table 4) 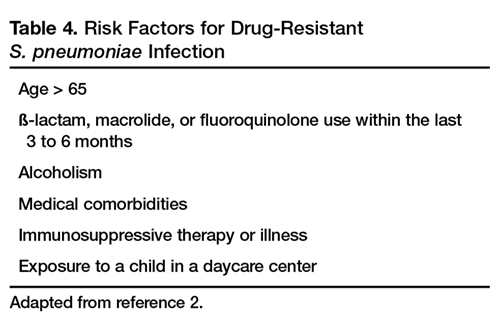
As previously mentioned, antibiotic therapy is typically empiric; neither clinical features nor radiographic features are sufficient to include or exclude infectious etiologies. Epidemiologic risk factors should be considered and, in certain cases, expanded antimicrobial coverage to include those entities; for example, treatment of anaerobes in the setting of lung abscess and antipseudomonal antibiotics for patients with bronchiectasis.
Of concern in the treatment of CAP is the increased prevalence of antimicrobial resistance among S. pneumoniae. The IDSA guidelines report that drug-resistant S. pneumoniae is more common in persons aged < 2 or > 65 years, and those with ß-lactam therapy within the previous 3 months, alcoholism, medical comorbidities, immunosuppressive illness or therapy, or exposure to a child who attends a day care center [16].
S. aureus should be considered during influenza outbreaks, with either vancomycin or linezolid being the recommended agents in the setting of methicillin-resistant S. aureus (MRSA). In a study comparing vancomycin versus linezolid for nosocomial pneumonia, the all-cause 60-day mortality was similar for both agents [41]. Datpomycin is another agent used against MRSA; however, its use in the setting of pneumonia is not indicated as daptomycin binds to surfactant, yielding it ineffective in the treatment of pneumonia [42]. Ceftaroline is a newer cephalosporin with activity against MRSA; its role in treatment of community-acquired MRSA pneumonia has not been fully elucidated, but it appears to be a useful agent for this indication [43,44]. 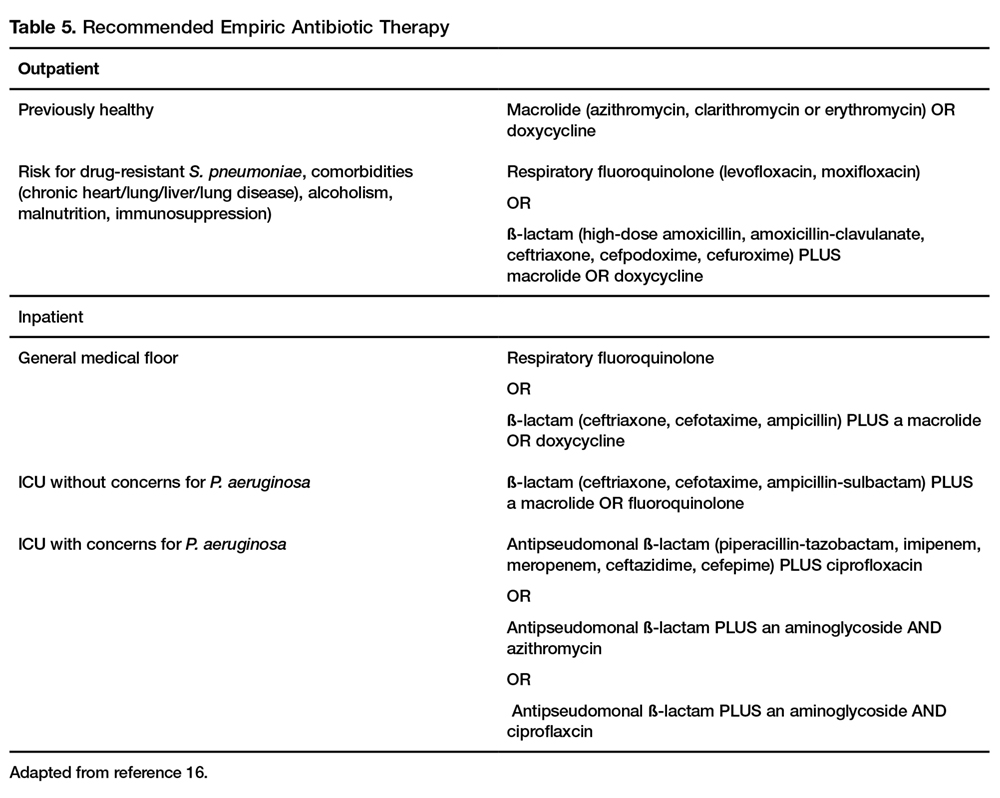
A summary of recommended empiric antibiotic therapy is presented in Table 5.
Antibiotic Therapy for Selected Pathogens
S. pneumoniae
Patients with pneumococcal pneumonia who have penicillin-susceptible strains can be treated with intravenous penicillin (2 or 3 million units every 4 hours) or ceftriaxone. Once a patient meets criteria of stability, they can then be transitioned to oral penicillin, amoxicillin, or clarithromycin. Those with strains with reduced susceptibility can still be treated with penicillin but at a higher dose (4 million units IV every 4 hours) or a third-generation cephalosporin. Those whose pneumococcal pneumonia is complicated by bacteremia will benefit from dual therapy if severely ill, requiring ICU monitoring. Those not severely ill can be treated with monotherapy [46].
S. aureus
S. aureus is more commonly associated with hospital-acquired pneumonia but may also be seen during the influenza season and in those with severe necrotizing CAP. Both linezolid and vancomycin can be used to treat MRSA CAP. As noted above, ceftaroline has activity against MRSA and is approved for treatment of CAP, but is not approved by the FDA for MRSA CAP treatment. Similarly, tigecycline is approved for CAP and has activity against MRSA, but is not approved for MRSA CAP. Moreover, the FDA has warned of increased risk of death with tigecycline and has a black box warning to that effect [47].
Legionella
Treatment of legionellosis can be achieved with tetracyclines, macrolides, or fluoroquinolones. For nonimmunosuppressed patients with mild pneumonia, any of the listed antibiotics is considered appropriate. However, patients with severe infection or those with immunosuppression should be treated with either levofloxacin or azithromycin for 7 to 10 days [48].
C. pneumoniae
As with other atypical organisms, C. pneumoniae can be treated with doxycycline, a macrolide, or respiratory fluoroquinolones. However, length of therapy varies by regimen used; whereas treating with doxycycline 100 mg twice daily generally requires 14–21 days, moxifloxacin 400 mg daily only requires 10 days [49].
M. pneumoniae
As with C. pneumoniae, length of therapy of M. pneumoniae varies by antimicrobial used. Shortest courses are seen with the use of macrolides for 5 days, whereas 14 days is considered standard for doxycycline or a respiratory fluoroquinolone [50]. It should be noted that there has been increasingly documented resistance to macrolides, with known resistance of 8.2% in the United States [51].
Duration of Treatment
Most patients with CAP respond within 72 hours to appropriate therapy. IDSA/ATS guidelines recommend that patients be treated for a minimum of 5 days, and before discontinuing antibiotics patients should be afebrile a minimum of 48-72 hours and be clinically stable (Table 6) [16]. 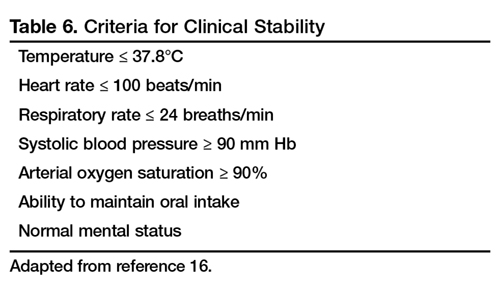
Hospitalized patients do not need to be monitored for an additional day once they have reached clinical stability (Table 6), are able to maintain oral intake, and have normal mentation, provided that other comorbidities are stable and social needs have been met [16]. Patients discharged from the hospital with instability have higher risk of readmission or death [55].
Transition to Oral Therapy
IDSA/ATS guidelines [16] recommend that patients should be transitioned from IV to oral antibiotics when they are improving clinically, have stable vital signs, and are able to ingest food/fluids and medications.
Management of Nonresponders
Although the majority of patients respond to antibiotics within 72 hours, treatment failure occurs in up to 15% of patients [45]. Nonresponding pneumonia is generally seen in 2 patterns: worsening of clinical status despite empiric antibiotics OR delay in achieving clinical stability as defined in Table 5 after 72 hours of treatment [13]. Risk factors associated with nonresponding pneumonia [56] are:
- Radiographic: multilobar infiltrates, pleural effusion, cavitation
- Bacteriologic: MRSA, gram-negative or Legionella pneumonia
- Severity index: PSI > 90
- Pharmacologic: incorrect antibiotic choice based on susceptibility
Patients with acute deterioration of clinical status will prompt transfer to a higher level of care and may require mechanical ventilator support. In those with delay in achieving clinical stability, question centers on whether the same antibiotics can be continued while doing further radiographic/microbiologic workup and/or changing antibiotics.
History should be reviewed with particular attention to exposures, travel history, and microbiologic and radiographic data. Clinicians should recall that viral causes account for up to 20% of pneumonias and there are also noninfectious causes that can mimic pyogenic infections [57]. If adequate initial cultures were not obtained, they should be obtained; however, care must be taken in reviewing new sets of cultures while on antibiotics as they may reveal colonization selected out by antibiotics and not a true pathogen. If repeat evaluation is unrevealing, then further evaluation with CT scan and bronchoscopy with bronchoalveolar lavage and biopsy is warranted. CT scans can show pleural effusions, bronchial obstructions or pattern suggestive of cryptogenic pneumonia. A bronchoscopy might yield a microbiologic diagnosis and with biopsy can also evaluate for noninfectious causes.
As with other infections, if escalation of antibiotics is undertaken, clinicians should be mindful to ensure that efforts are being made to elucidate the reason for nonresponse. To simply broaden antimicrobial therapy without attempts at establishing a microbiologic or radiographic cause for nonresponse may lead to inappropriate treatment recurrence of infection. Aside from patients who have bacteremic pneumococcal pneumonia in an ICU setting, there are no published reports pointing to superiority of combination antibiotics [46].
Other Treatment
Because of the inflammatory response associated with pneumonia, several agents have been evaluated as adjunctive treatment of pneumonia to decrease this inflammatory state; namely, steroids, macrolide antibiotics and statins. To date, only the use of steroids (methylprednisolone 0.5 mg/kg every 12 hours for 5 days) in those with severe CAP and high initial anti-inflammatory response (CRP > 150) was shown to decrease treatment failure, decreased risk of ARDS, possibly reduce length of stay, duration of intravenous antibiotics and clinical stability, without effect on mortality or adverse side effects [58,59].
Other adjunctive methods have not been found to have significant impact [16].
Prevention of Pneumonia
Prevention of pneumococcal pneumonia is twofold: prevention of infection caused by S. pneumoniae and prevention of influenza infection. As influenza infection is a risk factor for bacterial infection, specifically with S. pneumoniae, influenza vaccination can prevent bacterial pneumonia [60]. In their most recent recommendations, the CDC continues to recommend routine influenza vaccination for all persons aged greater than 6 months, unless otherwise contraindicated [61].
There are 2 vaccines for prevention of pneumococcal disease: the pneumococcal polysaccharide vaccine (PPSV23) and a conjugate vaccine (PCV13). Following vaccination with PPSV23, 80% of adults develop antibodies against at least 18 of the 23 serotypes [62]. Despite this response, PPSV23 is reported to be protective against invasive pneumococcal infection; yet there is no consensus regarding PPSV23 leading to decreased rates of pneumonia [63]. On the other hand, PCV13 vaccination was associated with prevention of both invasive disease and community-acquired pneumonia in adults 65 years or older [64]. The CDC recommends that all children aged 2 or under receive PCV13, whereas those aged 65 or older should receive PCV13 followed by a dose of PPSV23 [65]. The dose of PPSV23 should be given ≥1 year following the dose of PCV13 [66].Persons < 65 years of age with immunocompromising and certain other conditions should also receive vaccination [67] (Table 7). Full details, many scenarios, and timing of vaccinations can be found at www.cdc.gov/vaccines/schedules/downloads/adult/adult-schedule.pdf. 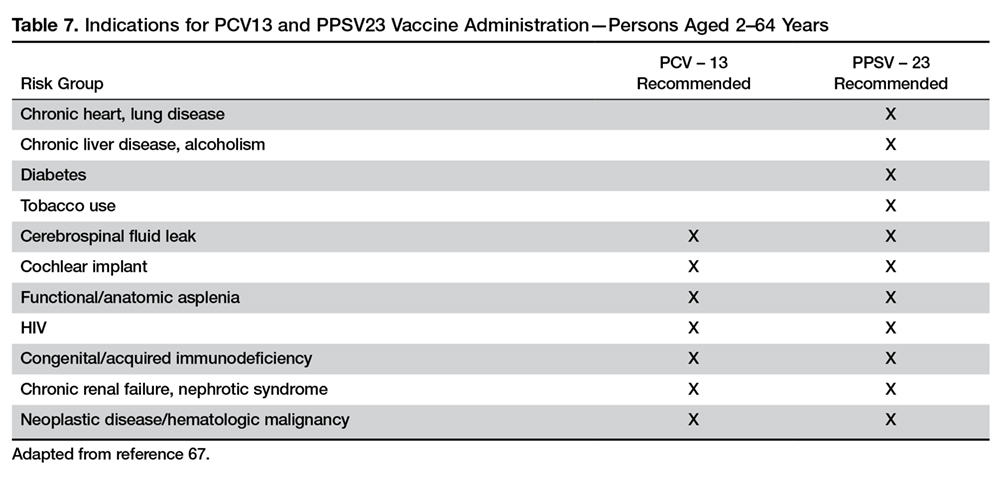
Cigarette smoking increases the risk of respiratory infections as evidenced by smokers accounting for almost half of all patients with invasive pneumococcal disease [11]. As this is a modifiable risk factor it should be a goal of a comprehensive approach towards prevention of pneumonia.
Summary
CAP remains a leading cause of hospitalization and death in the 21st century. Traditionally, pneumococcus has been considered the major pathogen causing CAP; however, the 2015 EPIC study found that in only 5% of patients diagnosed with CAP was S. pneumoniae detected. Despite the new findings, it is still recommended that empiric treatment for CAP target common typical bacteria (pneumococcus, H. influenzae, Moraxella catarrhalis) and atypical bacteria (M. pneumonia, C. pneumoniae, L. pneumophila).
Because diagnosing pneumonia through history and clinical examination is less than 50% sensitive, a chest imaging study (a plain chest radiograph or a chest CT scan) is usually required to make the diagnosis. Laboratory tests, such as sputum Gram stain/culture, blood culture, urinary antigen tests, PCR test, procalcitonin, and CRP are important adjunctive diagnostic modalities to assist in the diagnosis and management of CAP. However, no single test is sensitive and specific enough to be a stand-alone test. They should be used in conjunction with history, physical examination, and imaging studies. Because vaccination (PPSV23, PCV13, and influenza vaccine) remains the most effective tool in preventing the development of CAP, clinicians, should strive for 100% vaccination rates in appropriate persons.
Corresponding author: Tze Shein Lo, MD, University of North Dakota, 1919 Elm Street, Fargo, ND 58102, tzeshein.lo@med.und.edu.
Financial disclosures: None.
Author contributions: drafting of article, PM, TSL; critical revision of the article, PM, TSL.
1. Centers for Disease Control and Prevention. National Center for Health Statistics. FastStats - Pneumonia. Accessed 6 Oct 2016 at www.cdc.gov/nchs/fastats/pneumonia.htm.
2. Kalil AC, Metersky ML, Klompas M, et al. Management of adults with hospital-acquired and ventilator-associated pneumonia: 2016 Clinical Practice Guidelines by the Infectious Diseases Society of America and the American Thoracic Society. Clin Infect Dis 2016;63:e61-e111.
3. Musher DM, Thorner AR. Community-acquired pneumonia. N Engl J Med 2014;371:1619–28.
4. Mandell LA. Epidemiology and etiology of community-acquired pneumonia. Infect Dis
5. Hoare Z, Lim WS. Pneumonia: update on diagnosis and management. BMJ 2006;332:1077–9.
6. Johnstone J, Marrie TJ, Eurich DT, Majumdar SR. Effect of pneumococcal vaccination in hospitalized adults with community-acquired pneumonia. Arch Intern Med 2007;167:1938–43
7. File TM Jr, Marrie TJ. Burden of community-acquired pneumonia in North American adults. Postgrad Med 2010;122:130–41.
8. Eurich DT, Marrie TJ, Minhas-Sandhu JK, Majumdar SR. Ten-year mortality after community-acquired pneumonia. a prospective cohort. Am J Respir Crit Care Med 2015;192:597-604.
9. Jain S, Self WH, Wunderink RG, et al. Community-acquired pneumonia requiring hospitalization among U.S. adults. N Engl J Med 2015;373:415–27.
10. Griffin MR, Zhu Y, Moore MR, et al. U.S. hospitalizations for pneumonia after a decade of pneumococcal vaccination. N Engl J Med 2013;369:155–63.
11. Nuorti JP, Butler JC, Farley MM, et al. Cigarette smoking and invasive pneumococcal disease. Active Bacterial Core Surveillance Team. N Engl J Med 2000;342:681–9.
12. Almirall J, Serra-Prat M, Bolíbar I, BalassoV. Risk factors for community-acquired pneumonia in adults: a systemic review of observational studies. Respiration 2017;94:299–311.
13. Janoff EM.Streptococcus pneumonia. In: Bennett JE, Dolin R, Blaser MJ, editors. Mandell, Douglas and Bennett’s principles and practice of infectioius diseases. 8th ed. Philadelphia: Sauders; 2015: 2310–27.
14. Diehr P, Wood RW, Bushyhead J, et al. Prediction of pneumonia in outpatients with acute cough--a statistical approach. J Chronic Dis 1984;37:215–25.
15. Metlay JP, Schulz R, Li YH, et al. Influence of age on symptoms at presentation in patients with community-acquired pneumonia. Arch Intern Med 1997;157:1453–9.
16. Mandell LA, Wunderink RG, Anzueto A, et al. Infectious Diseases Society of America/American Thoracic Society consensus guidelines on the management of community-acquired pneumonia in adults. Clin Infect Dis 2007;44 Suppl 2:S27–72.
17. Jartti A, Rauvala E, Kauma H, et al. Chest imaging findings in hospitalized patients with H1N1 influenza. Acta Radiol 2011;52:297–304.
18. Basi SK, Marrie TJ, Huang JQ, Majumdar SR. Patients admitted to hospital with suspected pneumonia and normal chest radiographs: epidemiology, microbiology, and outcomes. Am J Med 2004;117:305–11.
19. Caldwell A, Glauser FL, Smith WR, et al. The effects of dehydration on the radiologic and pathologic appearance of experimental canine segmental pneumonia. Am Rev Respir Dis 1975;112:651–6.
20. Bartlett JG. Pneumonia. In: Barlett JG, editor. Management of respiratory tract infections. Philadelphia: Lippincott, Williams & Wilkins; 2001: 1–122.
21. Claessens YE, Debray MP, Tubach F, et al. Early chest computed tomography scan to assist diagnosis and guide treatment decision for suspected community-acquired pneumonia. Am J Respir Crit Care Med 2015;192:974–82.
22. Wheeler JH, Fishman EK. Computed tomography in the management of chest infections: current status. Clin Infect Dis 1996;23:232–40.
23. Chesnutt MP. Pulmonary disorders. In: Papadakis MM, editor. Current medical diagnosis and treatment. New York: McGraw-Hill; 2016: 242–320.
24. Mandell LW. Pneumonia. In: Kasper DF, editor. Harrison’s infectious diseases. 1st ed. New York: McGraw-Hill; 2010: 188–201.
25. Reed WW, Byrd GS, Gates RH Jr, et al. Sputum gram’s stain in community-acquired pneumococcal pneumonia. A meta-analysis. West J Med 1996;165:197–204.
26. Chalasani NP, Valdecanas MA, Gopal AK, et al. Clinical utility of blood cultures in adult patients with community-acquired pneumonia without defined underlying risks. Chest 1995;108:932–6.
27. Bordon J, Peyrani P, Brock GN, et al. The presence of pneumococcal bacteremia does not influence clinical outcomes in patients with community-acquired pneumonia: results from the Community-Acquired Pneumonia Organization (CAPO) International Cohort study. Chest 2008;133:618–24.
28. Helbig JH, Uldum SA, Bernander S, et al. Clinical utility of urinary antigen detection for diagnosis of community-acquired, travel-associated, and nosocomial legionnaires’ disease. J Clin Microbiol 2003;41:838–40.
29. Smith MD, Derrington P, Evans R, et al. Rapid diagnosis of bacteremic pneumococcal infections in adults by using the Binax NOW Streptococcus pneumoniae urinary antigen test: a prospective, controlled clinical evaluation. J Clin Microbiol 2003;41:2810–3.
30. Johansson N, Kalin M, Tiveljung-Lindell A, et al. Etiology of community-acquired pneumonia: increased microbiological yield with new diagnostic methods. Clin Infect Dis 2010;50:202–9.
31. Gilbert DN. Procalcitonin as a biomarker in respiratory tract infection. Clin Infect Dis 2011;52 Suppl 4:S346–50.
32. Schuetz P, Muller B, Christ-Crain M, et al. Procalcitonin to initiate or discontinue antibiotics in acute respiratory tract infections. Cochrane Database Syst Rev 2012;(9):CD007498.
33. Boussekey N, Leroy O, Alfandari S, et al. Procalcitonin kinetics in the prognosis of severe community-acquired pneumonia. Intensive Care Med 2006;32:469–72.
34. Flanders SA, Stein J, Shochat G, et al. Performance of a bedside C-reactive protein test in the diagnosis of community-acquired pneumonia in adults with acute cough. Am J Med 2004;116:529–35.
35. Fine MJ, et al A prediction rule to identify low-risk patients with community-acquired pneumonia.N Engl J Med.1997;336:243-50.
36. Lim WS, van der Eerden MM, Laing R, et al. Defining community acquired pneumonia severity on presentation to hospital: an international derivation and validation study. Thorax 2003;58:377–82.
37. Arnold FW, Ramirez JA, McDonald LC, Xia EL. Hospitalization for community-acquired pneumonia: the pneumonia severity index vs clinical judgment. Chest 2003;124:121–4.
38. Aujesky D, McCausland JB, Whittle J, et al. Reasons why emergency department providers do not rely on the pneumonia severity index to determine the initial site of treatment for patients with pneumonia. Clin Infect Dis 2009;49:e100–8.
39. Charles PG, Wolfe R, Whitby M, et al. SMART-COP: a tool for predicting the need for intensive respiratory or vasopressor support in community-acquired pneumonia. Clin Infect Dis 2008;47:375–84.
40. Marti C, Garin N, Grosgurin O, et al. Prediction of severe community-acquired pneumonia: a systematic review and meta-analysis. Crit Care 2012;16:R141.
41. Wunderink RG, Niederman MS, Kollef MH, et al. Linezolid in methicillin-resistant Staphylococcus aureus nosocomial pneumonia: a randomized, controlled study. Clin Infect Dis 2012;54:621–9.
42. Silverman JA, Mortin LI, Vanpraagh AD, et al. Inhibition of daptomycin by pulmonary surfactant: in vitro modeling and clinical impact. J Infect Dis 2005;191:2149–52.
43. El Hajj MS, Turgeon RD, Wilby KJ. Ceftaroline fosamil for community-acquired pneumonia and skin and skin structure infections: a systematic review. Int J Clin Pharm 2017 Jan 5.
44. Taboada M, Melnick D, Iaconis JP, et al. Ceftaroline fosamil versus ceftriaxone for the treatment of community-acquired pneumonia: individual patient data meta-analysis of randomized controlled trials. J Antimicrob Chemother 2016;71:862–70.
45. Liu C, Bayer A, Cosgrove SE, et al. Clinical practice guidelines by the infectious diseases society of america for the treatment of methicillin-resistant Staphylococcus aureus infections in adults and children: executive summary. Clin Infect Dis 2011;52:285–92.
46. Baddour LM, Yu VL, Klugman KP, et al. Combination antibiotic therapy lowers mortality among severely ill patients with pneumococcal bacteremia. Am J Respir Crit Care Med 2004;170:440–4.
47. FDA Drug Safety Communication: FDA warns of increased risk of death with IV antibacterial Tygacil (tigecycline) and approves new boxed warning [Internet]. 15 Jan 2016. Available at www.fda.gov/Drugs/DrugSafety/ucm369580.htm.
48. Edelstein PR, CR. Legionnaires’ Disease and Pontiac Fever. In: Kasper DF, editor. Harrison’s infectious diseases. 1st ed. New York: McGraw-Hill; 2010: 2633.
49. Hammerschlag MR, Kohlhoff SA, Gaydos, CA. Chlamydia pneumoniae. In: Kasper DF, editor. Harrison’s infectious diseases. 1st ed. New York: McGraw-Hill; 2010: 2174.
50. Holzman RS, MS. Mycoplasma pneumoniae and Atypical Pneumonia. In: Kasper DF, editor. Harrison’s infectious diseases. 1st ed. New York: McGraw-Hill; 2010: 2183.
51. Yamada M, Buller R, Bledsoe S, Storch GA. Rising rates of macrolide-resistant Mycoplasma pneumoniae in the central United States. Pediatr Infect Dis J 2012;31:409–10.
52. Yi SH, Hatfield KM, Baggs J, et al. Duration of antibiotic use among adults with uncomplicated community-acquired pneumonia requiring hospitalization in the United States. Clin Infect Dis 2017 Nov 6.
53. Hayashi Y, Paterson DL. Strategies for reduction in duration of antibiotic use in hospitalized patients. Clin Infect Dis 2011;52:1232–40.
54. Akram AR, Chalmers JD, Taylor JK, et al. An evaluation of clinical stability criteria to predict hospital course in community-acquired pneumonia. Clin Microbiol Infect 2013;19:1174–80.
55. Halm EA, Fine MJ, Kapoor WN, et al. Instability on hospital discharge and the risk of adverse outcomes in patients with pneumonia. Arch Intern Med 2002;162:1278–84.
56. Roson B, Carratala J, Fernandez-Sabe N, et al. Causes and factors associated with early failure in hospitalized patients with community-acquired pneumonia. Arch Intern Med 2004;164:502–8.
57. El-Solh AA, Pietrantoni C, Bhat A, et al. Microbiology of severe aspiration pneumonia in institutionalized elderly. Am J Respir Crit Care Med 2003;167:1650–4.
58. Wan YD, Sun TW, Liu ZQ, et al. Efficacy and safety of corticosteroids for community-acquired pneumonia: a systematic review and meta-analysis. Chest 2016;149:209–19.
59. Torres A, Sibila O, Ferrer M, et al. Effect of corticosteroids on treatment failure among hospitalized patients with severe community-acquired pneumonia and high inflammatory response: a randomized clinical trial. JAMA 2015;313:677–86.
60. McCullers JA. Insights into the interaction between influenza virus and pneumococcus. Clin Microbiol Rev 2006;19:571–82.
61. Grohskopf LA, Sokolow LZ, Broder KR, et al. Prevention and control of seasonal influenza with vaccines. MMWR Recomm Rep 2016;65:1–54.
62. Rubins JB, Alter M, Loch J, Janoff EN. Determination of antibody responses of elderly adults to all 23 capsular polysaccharides after pneumococcal vaccination. Infect Immun 1999;67:5979–84.
63. Centers for Disease Control. Vaccines and preventable diseases [Internet]. 22 Nov 2016. Available at www.cdc.gov/vaccines/vpd/pneumo/hcp/about-vaccine.html.
64. Bonten MJ, Huijts SM, Bolkenbaas M, et al. Polysaccharide conjugate vaccine against pneumococcal pneumonia in adults. N Engl J Med 2015;372:1114–25.
65. Centers for Disease Control. Recommended adult immunization schedule -- United States -- 2016 [Internet]. 2016. Available at www.cdc.gov/vaccines/schedules/downloads/adult/adult-schedule.pdf.
66. Kobayashi M, Bennett NM, Gierke R, et al. Intervals between PCV13 and PPSV23 vaccines: recommendations of the Advisory Committee on Immunization Practices (ACIP). MMWR Morb Mortal Wkly Rep 2015;64:944–7.
67. Centers for Disease Control and Prevention (CDC). Use of 13-valent pneumococcal conjugate vaccine and 23-valent pneumococcal polysaccharide vaccine for adults with immunocompromising conditions: recommendations of the Advisory Committee on Immunization Practices (ACIP). MMWR Morb Mortal Wkly Rep 2012;61:816–9.
68. Aujesky D, Auble TE, Yealy DM, et al. Prospective comparison of three validated prediction rules for prognosis in community-acquired pneumonia. Am J Med 2005;118:384–92.
From the University of North Dakota School of Medicine & Health Sciences, Fargo, ND.
Abstract
- Objective: To review the management of community-acquired pneumonia (CAP) in adults.
- Methods: Review of the literature.
- Results: Approximately 4 to 5 million cases of CAP are diagnosed in the United States annually, accounting for significant morbidity and mortality. While numerous studies have previously shown pneumococcus to be the most common causative pathogen, the 2015 EPIC study found that in nearly two-thirds of patients with CAP who required hospitalization, no pathogen was detected. Symptoms and signs of respiratory tract infection are useful in helping to diagnose pneumonia; however, they are less sensitive than chest imaging studies. Laboratory tests used in diagnosing pneumonia include sputum Gram stain and culture, blood culture, urinary antigen, polymerase chain reaction, and biologic markers. In empiric treatment of CAP, both the typical and atypical pathogens should be targeted. Influenza vaccine and pneumococcal polysaccharide and conjugate vaccines should be administered as recommended by the CDC to reduce risk of CAP.
- Conclusion: CAP is a common illness with high rates of morbidity and mortality. Treatment is for the most part empirical; diagnostic testing can be used to identify the causative organism and guide pathogen-specific therapy.
Key words: community-acquired pneumonia; adults; management; vaccines.
Despite advances in medical science, pneumonia remains a major cause of morbidity and mortality. In 2014, 50,620 patients in the United States died from the disease [1]. Pneumonia can be classified as community-acquired, hospital-acquired, or ventilator-associated. Another category, healthcare-associated pneumonia, was included in an earlier American Thoracic Society (ATS) and Infectious Diseases Society of America (IDSA) guideline but was removed from the 2016 guideline because there was no clear evidence that patients diagnosed with healthcare-associated pneumonia were at higher risk for harboring multidrug-resistant pathogens [2]. In this article, we review the epidemiology, microbiology, predisposing factors, diagnosis, treatment, and prevention of community-acquired pneumonia (CAP).
Definition and Epidemiology
CAP is defined as an acute infection of the lungs that develops in patients who have not been hospitalized recently and have not had regular exposure to the health care system [3]. A previously ambulatory patient who is diagnosed with pneumonia within 48 hours after admission also meets the criteria for CAP. Approximately 4 to 5 million cases of CAP are diagnosed in the United States annually [4]. About 25% of CAP patients require hospitalization, and about 5% to 10% of these patients are admitted to the intensive care unit (ICU) [5]. In-hospital mortality is considerable (~10% in population-based studies) [6] and 30-day mortality was found to be as high as 23% in a review by File and Marrie [7]. CAP also confers a high risk of long-term morbidity and mortality compared with the general population who have never had CAP, irrespective of age [8].
Causative Organisms
Numerous microorganisms can cause CAP. Common causes and less common causes are delineated in Table 1.
Predisposing Factors
Most people diagnosed with CAP have one or more predisposing factors [12,13] (Table 2).
Clinical Signs and Symptoms
Symptoms of CAP include fever, chills, rigors, fatigue, anorexia, diaphoresis, dyspnea, cough (with or without sputum production), and pleuritic chest pain. There is no individual symptom or cluster of symptoms that can absolutely differentiate pneumonia from other acute respiratory diseases, including upper and lower respiratory infections. However, if a patient presents with the constellation of symptoms of fever ≥ 1000F (37.80C), productive cough, and tachycardia, it is more suggestive of pneumonia [14]. Abnormal vital signs include fever, hypothermia, tachypnea, tachycardia, and oxygen desaturation. Auscultation of the chest reveals crackles or other adventitious breath sounds. Elderly patients with pneumonia report a significantly lower number of both respiratory and nonrespiratory symptoms compared with younger patients. Clinicians should be aware of this phenomenon so it does not lead to delayed diagnosis and treatment [15].
Imaging Evaluation
The presence of a pulmonary consolidation or an infiltrate on chest radiograph is required to diagnose CAP, and a chest radiograph should be obtained when CAP is suspected [16]. It should be noted that there is no pattern of radiographic abnormalities reliable enough to differentiate infectious pneumonia from noninfectious causes [17].
There are case reports and case series demonstrating false-negative plain chest radiographs existing in dehydrated patients [18] or in neutropenic state. However, animal studies have shown that dogs challenged with pneumococcus showed abnormal pulmonary shadow, suggestive of pneumonia, regardless of hydration status [19]. There is also no reliable scientific evidence to support the notion that severe neutropenia can cause false-negative radiographs because of the inability to develop an acute inflammatory reaction in the lungs [20].
A chest CT scan is more sensitive than a plain chest radiograph in detecting pneumonia. Therefore, a chest CT should be performed in a patient with negative plain chest radiograph when pneumonia is still highly suspected [21]. A chest CT scan is also more sensitive in detecting cavitation, adenopathy, interstitial disease and empyema. It also has the advantage of better defining anatomical changes than plain films [22].
Because improvement of pulmonary opacities in patients with CAP lags behind clinical improvement, repeating chest imaging studies is not recommended in patients who demonstrate clinical improvement. Sometimes clearing of pulmonary infiltrate or consolidation can take 6 weeks or longer [23].
Laboratory Evaluation
Generally the etiologic agent of CAP cannot be determined solely on the basis of clinical signs and symptoms or imaging studies. Although routine microbiological testing for patients suspicious for CAP is not necessary for empirical treatment, by determining the etiologic agent of the pneumonia, a clinician will be able to narrow the antibiotics from a broad-spectrum empirical regimen to specific pathogen-directed therapy. Determination of certain etiologic agents causing the pneumonia can have important public health implications (eg, Mycobacterium tuberculosis and influenza virus) [24].
Sputum Gram Stain and Culture
Sputum Gram stain is an inexpensive test that may identify pathogens that cause CAP (eg, S. pneumonia and Haemophilus influenzae). A quality specimen is required. A sputum sample must contain > 25 neutrophils and < 10 squamous epithelial cells/low power field on Gram stain to be considered suitable for culture.
The sensitivity and specificity of sputum Gram stain and culture are highly variable in different clinical settings (eg, outpatient setting, nursing home, ICU). Reed et al’s meta-analysis of patients diagnosed with CAP in the United States showed the sensitivity and specificity of sputum Gram stain (compared with sputum culture) ranged from 15% to 100% and 11% to 100%, respectively [24]. In cases of proven bacteremic pneumococcal pneumonia, positive cultures from sputum samples were positive less than 50% of the time [25].
For patients who cannot provide sputum samples or are intubated, a deep-suction aspirate or bronchoalveolar lavage through a bronchoscopic procedure might be necessary to obtain pulmonary secretion for Gram stain and culture. Besides bacterial culture, sputum samples can also be sent for fungal and mycobacterial cultures and acid-fast stain if deemed clinically necessary.
Blood Culture
Because the positivity rate of blood culture in patients who are suspected to have pneumonia but not exposed to antimicrobial agents is disappointingly low (5%–14%), blood cultures are no longer recommended in patients hospitalized for CAP. Another reason for not recommending blood culture is positive culture rarely leads to changes in antibiotic regimen in patients without underlying diseases [26]. However, high-risk patients, including patients with severe CAP or in immunocompromised patients (eg, patients with neutropenia, asplenia or complement deficiencies) should have a blood culture done [24].
A multinational study published in 2008 examined 125 patients with pneumococcal bacteremic CAP versus 1847 patients with non-bacteremic CAP [27]. Analysis of the data demonstrated no association of pneumococcal bacteremic CAP and time to clinical stability, length of hospital stay, all-cause mortality or CAP-related mortality. The authors concluded that pneumococcal bacteremia does not increase the risk of poor outcomes in patients with CAP compared to non-bacteremic patients, and the presence of pneumococcal bacteremia should not deter de-escalation of therapy in clinically stable patients.
Urinary Antigen Tests
Urinary antigen tests may assist clinicians in narrowing antibiotic therapy when test results are positive. There are 2 U.S. Food and Drug Administration–approved tests available to clinicians for detecting pneumococcal and Legionella antigen in urine. The test for Legionella pneumophila detects disease due to serogroup 1 only, which accounts for 80% of community-acquired Legionnaires disease. The sensitivity and specificity of the Legionella urine antigen test are 90% and 99%, respectively. The pneumococcal urine antigen test is less sensitive and specific than the Legionella urine antigen test (sensitivity 80% and specificity > 90%) [28,29].
Advantages of the urinary antigen tests are that they are easily performed, results are available in less than an hour if done in-house, and results are not affected by prior exposure to antibiotics. However, the tests do not meet Clinical Laboratory Improvements Amendments criteria for waiver and must be performed by a technician in the laboratory.
Polymerase Chain Reaction
There are several FDA-approved polymerase chain reaction (PCR) tests commercially available to assist clinicians in diagnosing pneumonia. PCR test of nasopharyngeal swabs for diagnosing influenza have become standard in many medical U.S. facilities. The great advantage of using PCR to diagnose influenza is its high sensitivity and specificity and rapid turnaround time. PCR can also be used to detect Legionella species, S. pneumonia, Mycoplasma pneumoniae, Chlamydophila pneumonia and mycobacterial species [24].
One limitation of using PCR tests on respiratory specimens is that specimens can be contaminated with oral or upper airway flora, so the results must be interpreted with caution, bearing in mind that some of the pathogens isolated may be colonizers of the oral or upper airway flora [30].
Biologic Markers
Two biologic markers—procalcitonin and C-reactive protein (CRP)—can be used in conjunction with history, physical examination, laboratory tests and imaging studies to assist in the diagnosis and treatment of CAP [24]. Procalcitonin is a peptide precursor of the hormone calcitonin that is released by parenchymal cells into the bloodstream resulting in increased serum level in patients with bacterial infections. In contrast, there is no remarkable proclacitonin level increase with viral or noninfectious inflammation. The reference value of procalcitonin in the blood of an adult individual without infection or inflammation is < 0.15 ng/mL. In the blood, procalcitonin has a half-life of 25 to 30 hours. The quantitative immunoluminometric method (LUMI test, Brahms PCT, Berlin, Germany ) is the preferred test to use because of its high sensitivity [31].
A 2012 Cochrane meta-analysis that involved 4221 patients with acute respiratory infections (with half of the patients diagnosed with CAP) from 14 prospective trials found the use of procalcitonin test for antibiotic use significantly decreased median antibiotic exposure from 8 to 4 days without an increase in treatment failure, mortality rates in any clinical setting (eg, outpatient clinic, emergency room), or length of hospitalization [32]. A prospective study conducted in France on 100 ICU patients showed that increased procalcitonin from day 1 to day 3 has a poor prognosis factor for severe CAP whereas decreasing procalcitonin levels is associated with a favorable outcome [33].
CRP is an acute phase protein produced by the liver. CRP level in the blood increases in response to acute infection or inflammation. Use of CRP in assisting diagnosis and guiding treatment of CAP is more limited in part due to its poor specificity. A prospective study conducted on 168 consecutive patients presented with cough showed that a CRP > 40 mg/L had a sensitivity and specificity of 70% and 90%, respectively [34].
T reatment
Site of Care Decision
For patients with CAP, the clinician must decide whether the patient will be treated in an outpatient or inpatient setting, and for those in the inpatient setting, whether they can safely be treated on the general medical ward or should be the ICU. Two common scoring systems that can be used to aid the clinician in determining severity of the infection and guiding site-of-care decisions are the Pneumonia Severity Index (PSI) and CURB-65 scores.
The PSI score uses 20 different parameters, including comorbidities, laboratory parameters and radiographic findings to stratify patients into 5 mortality risk classes [35]. On the basis of associated mortality rates, it has been suggested that risk class I and II patients should be treated as outpatients, risk class III patients should be treated in an observation unit or with a short hospitalization, and risk class IV and V patients should be treated as inpatients [35].
The CURB-65 method of risk stratification is based on 5 clinical parameters: confusion, urea level, respiratory rate, systolic blood pressure and age ≥ 65 (Table 3) [36].
Patients with CURB-65 scores of 4 or 5 are considered to have severe pneumonia and admission to the ICU should be considered. Aside from the CURB-65 score, anyone requiring vasopressor support or mechanical ventilation merits admission to the ICU [16]. IDSA/ATS guidelines also recommend the use of “minor criteria” for making ICU admission decisions; these include respiratory rate ≥ 30 breaths / minute, PaO2 fraction ≤ 250, multilobar infiltrates, confusion, blood urea nitrogen ≥ 20 mg/dL, leukopenia, thrombocytopenia, hypothermia and hypotension [16]. These factors are associated with increased mortality due to CAP and admission to an ICU is indicated if 3 of the minor criteria for severe CAP are present.
Similar to CURB-65, another clinical calculator that can be used for assessing severity of CAP is SMART-COP [39]. This scoring system uses 8 weighted criteria to predict which patients will require intensive respiratory or vasopressor support. SMART-COP has a sensitivity of 79% and specificity 64% in predicting ICU admission, whereas CURB-65 had a pooled sensitivity of 57.2% and specificity of 77.2% [40].
Antibiotic Therapy
Antibiotics are the mainstay of treatment for CAP, with the majority of patients with CAP treated empirically taking into account the site of care, likely pathogen, and antimicrobial resistance issues. Patients with pneumonia who are treated as outpatients usually respond well to empiric antibiotic treatment and a causative pathogen is not usually sought. Patients who are hospitalized for treatment of CAP usually receive empiric antibiotic on admission. Once the etiology has been determined by microbiologic or serologic means, antimicrobial therapy should be adjusted accordingly. As noted previously, a CDC study found that the burden of viral etiologies was higher than previously thought, with rhinovirus and influenza accounting for 15% of cases and S. pneumoniae for only 5% [9]. This study highlighted the fact that despite advances in molecular techniques, most patients with pneumonia have no pathogen identified [9]. Given the lack of discernable pathogens in the majority of cases, unless a nonbacterial etiology is found patients should continue to be treated with antibiotics.
Outpatients without comorbidities or risk factors for drug-resistant S. pneumoniae (Table 4)
As previously mentioned, antibiotic therapy is typically empiric; neither clinical features nor radiographic features are sufficient to include or exclude infectious etiologies. Epidemiologic risk factors should be considered and, in certain cases, expanded antimicrobial coverage to include those entities; for example, treatment of anaerobes in the setting of lung abscess and antipseudomonal antibiotics for patients with bronchiectasis.
Of concern in the treatment of CAP is the increased prevalence of antimicrobial resistance among S. pneumoniae. The IDSA guidelines report that drug-resistant S. pneumoniae is more common in persons aged < 2 or > 65 years, and those with ß-lactam therapy within the previous 3 months, alcoholism, medical comorbidities, immunosuppressive illness or therapy, or exposure to a child who attends a day care center [16].
S. aureus should be considered during influenza outbreaks, with either vancomycin or linezolid being the recommended agents in the setting of methicillin-resistant S. aureus (MRSA). In a study comparing vancomycin versus linezolid for nosocomial pneumonia, the all-cause 60-day mortality was similar for both agents [41]. Datpomycin is another agent used against MRSA; however, its use in the setting of pneumonia is not indicated as daptomycin binds to surfactant, yielding it ineffective in the treatment of pneumonia [42]. Ceftaroline is a newer cephalosporin with activity against MRSA; its role in treatment of community-acquired MRSA pneumonia has not been fully elucidated, but it appears to be a useful agent for this indication [43,44].
A summary of recommended empiric antibiotic therapy is presented in Table 5.
Antibiotic Therapy for Selected Pathogens
S. pneumoniae
Patients with pneumococcal pneumonia who have penicillin-susceptible strains can be treated with intravenous penicillin (2 or 3 million units every 4 hours) or ceftriaxone. Once a patient meets criteria of stability, they can then be transitioned to oral penicillin, amoxicillin, or clarithromycin. Those with strains with reduced susceptibility can still be treated with penicillin but at a higher dose (4 million units IV every 4 hours) or a third-generation cephalosporin. Those whose pneumococcal pneumonia is complicated by bacteremia will benefit from dual therapy if severely ill, requiring ICU monitoring. Those not severely ill can be treated with monotherapy [46].
S. aureus
S. aureus is more commonly associated with hospital-acquired pneumonia but may also be seen during the influenza season and in those with severe necrotizing CAP. Both linezolid and vancomycin can be used to treat MRSA CAP. As noted above, ceftaroline has activity against MRSA and is approved for treatment of CAP, but is not approved by the FDA for MRSA CAP treatment. Similarly, tigecycline is approved for CAP and has activity against MRSA, but is not approved for MRSA CAP. Moreover, the FDA has warned of increased risk of death with tigecycline and has a black box warning to that effect [47].
Legionella
Treatment of legionellosis can be achieved with tetracyclines, macrolides, or fluoroquinolones. For nonimmunosuppressed patients with mild pneumonia, any of the listed antibiotics is considered appropriate. However, patients with severe infection or those with immunosuppression should be treated with either levofloxacin or azithromycin for 7 to 10 days [48].
C. pneumoniae
As with other atypical organisms, C. pneumoniae can be treated with doxycycline, a macrolide, or respiratory fluoroquinolones. However, length of therapy varies by regimen used; whereas treating with doxycycline 100 mg twice daily generally requires 14–21 days, moxifloxacin 400 mg daily only requires 10 days [49].
M. pneumoniae
As with C. pneumoniae, length of therapy of M. pneumoniae varies by antimicrobial used. Shortest courses are seen with the use of macrolides for 5 days, whereas 14 days is considered standard for doxycycline or a respiratory fluoroquinolone [50]. It should be noted that there has been increasingly documented resistance to macrolides, with known resistance of 8.2% in the United States [51].
Duration of Treatment
Most patients with CAP respond within 72 hours to appropriate therapy. IDSA/ATS guidelines recommend that patients be treated for a minimum of 5 days, and before discontinuing antibiotics patients should be afebrile a minimum of 48-72 hours and be clinically stable (Table 6) [16].
Hospitalized patients do not need to be monitored for an additional day once they have reached clinical stability (Table 6), are able to maintain oral intake, and have normal mentation, provided that other comorbidities are stable and social needs have been met [16]. Patients discharged from the hospital with instability have higher risk of readmission or death [55].
Transition to Oral Therapy
IDSA/ATS guidelines [16] recommend that patients should be transitioned from IV to oral antibiotics when they are improving clinically, have stable vital signs, and are able to ingest food/fluids and medications.
Management of Nonresponders
Although the majority of patients respond to antibiotics within 72 hours, treatment failure occurs in up to 15% of patients [45]. Nonresponding pneumonia is generally seen in 2 patterns: worsening of clinical status despite empiric antibiotics OR delay in achieving clinical stability as defined in Table 5 after 72 hours of treatment [13]. Risk factors associated with nonresponding pneumonia [56] are:
- Radiographic: multilobar infiltrates, pleural effusion, cavitation
- Bacteriologic: MRSA, gram-negative or Legionella pneumonia
- Severity index: PSI > 90
- Pharmacologic: incorrect antibiotic choice based on susceptibility
Patients with acute deterioration of clinical status will prompt transfer to a higher level of care and may require mechanical ventilator support. In those with delay in achieving clinical stability, question centers on whether the same antibiotics can be continued while doing further radiographic/microbiologic workup and/or changing antibiotics.
History should be reviewed with particular attention to exposures, travel history, and microbiologic and radiographic data. Clinicians should recall that viral causes account for up to 20% of pneumonias and there are also noninfectious causes that can mimic pyogenic infections [57]. If adequate initial cultures were not obtained, they should be obtained; however, care must be taken in reviewing new sets of cultures while on antibiotics as they may reveal colonization selected out by antibiotics and not a true pathogen. If repeat evaluation is unrevealing, then further evaluation with CT scan and bronchoscopy with bronchoalveolar lavage and biopsy is warranted. CT scans can show pleural effusions, bronchial obstructions or pattern suggestive of cryptogenic pneumonia. A bronchoscopy might yield a microbiologic diagnosis and with biopsy can also evaluate for noninfectious causes.
As with other infections, if escalation of antibiotics is undertaken, clinicians should be mindful to ensure that efforts are being made to elucidate the reason for nonresponse. To simply broaden antimicrobial therapy without attempts at establishing a microbiologic or radiographic cause for nonresponse may lead to inappropriate treatment recurrence of infection. Aside from patients who have bacteremic pneumococcal pneumonia in an ICU setting, there are no published reports pointing to superiority of combination antibiotics [46].
Other Treatment
Because of the inflammatory response associated with pneumonia, several agents have been evaluated as adjunctive treatment of pneumonia to decrease this inflammatory state; namely, steroids, macrolide antibiotics and statins. To date, only the use of steroids (methylprednisolone 0.5 mg/kg every 12 hours for 5 days) in those with severe CAP and high initial anti-inflammatory response (CRP > 150) was shown to decrease treatment failure, decreased risk of ARDS, possibly reduce length of stay, duration of intravenous antibiotics and clinical stability, without effect on mortality or adverse side effects [58,59].
Other adjunctive methods have not been found to have significant impact [16].
Prevention of Pneumonia
Prevention of pneumococcal pneumonia is twofold: prevention of infection caused by S. pneumoniae and prevention of influenza infection. As influenza infection is a risk factor for bacterial infection, specifically with S. pneumoniae, influenza vaccination can prevent bacterial pneumonia [60]. In their most recent recommendations, the CDC continues to recommend routine influenza vaccination for all persons aged greater than 6 months, unless otherwise contraindicated [61].
There are 2 vaccines for prevention of pneumococcal disease: the pneumococcal polysaccharide vaccine (PPSV23) and a conjugate vaccine (PCV13). Following vaccination with PPSV23, 80% of adults develop antibodies against at least 18 of the 23 serotypes [62]. Despite this response, PPSV23 is reported to be protective against invasive pneumococcal infection; yet there is no consensus regarding PPSV23 leading to decreased rates of pneumonia [63]. On the other hand, PCV13 vaccination was associated with prevention of both invasive disease and community-acquired pneumonia in adults 65 years or older [64]. The CDC recommends that all children aged 2 or under receive PCV13, whereas those aged 65 or older should receive PCV13 followed by a dose of PPSV23 [65]. The dose of PPSV23 should be given ≥1 year following the dose of PCV13 [66].Persons < 65 years of age with immunocompromising and certain other conditions should also receive vaccination [67] (Table 7). Full details, many scenarios, and timing of vaccinations can be found at www.cdc.gov/vaccines/schedules/downloads/adult/adult-schedule.pdf.
Cigarette smoking increases the risk of respiratory infections as evidenced by smokers accounting for almost half of all patients with invasive pneumococcal disease [11]. As this is a modifiable risk factor it should be a goal of a comprehensive approach towards prevention of pneumonia.
Summary
CAP remains a leading cause of hospitalization and death in the 21st century. Traditionally, pneumococcus has been considered the major pathogen causing CAP; however, the 2015 EPIC study found that in only 5% of patients diagnosed with CAP was S. pneumoniae detected. Despite the new findings, it is still recommended that empiric treatment for CAP target common typical bacteria (pneumococcus, H. influenzae, Moraxella catarrhalis) and atypical bacteria (M. pneumonia, C. pneumoniae, L. pneumophila).
Because diagnosing pneumonia through history and clinical examination is less than 50% sensitive, a chest imaging study (a plain chest radiograph or a chest CT scan) is usually required to make the diagnosis. Laboratory tests, such as sputum Gram stain/culture, blood culture, urinary antigen tests, PCR test, procalcitonin, and CRP are important adjunctive diagnostic modalities to assist in the diagnosis and management of CAP. However, no single test is sensitive and specific enough to be a stand-alone test. They should be used in conjunction with history, physical examination, and imaging studies. Because vaccination (PPSV23, PCV13, and influenza vaccine) remains the most effective tool in preventing the development of CAP, clinicians, should strive for 100% vaccination rates in appropriate persons.
Corresponding author: Tze Shein Lo, MD, University of North Dakota, 1919 Elm Street, Fargo, ND 58102, tzeshein.lo@med.und.edu.
Financial disclosures: None.
Author contributions: drafting of article, PM, TSL; critical revision of the article, PM, TSL.
1. Centers for Disease Control and Prevention. National Center for Health Statistics. FastStats - Pneumonia. Accessed 6 Oct 2016 at www.cdc.gov/nchs/fastats/pneumonia.htm.
2. Kalil AC, Metersky ML, Klompas M, et al. Management of adults with hospital-acquired and ventilator-associated pneumonia: 2016 Clinical Practice Guidelines by the Infectious Diseases Society of America and the American Thoracic Society. Clin Infect Dis 2016;63:e61-e111.
3. Musher DM, Thorner AR. Community-acquired pneumonia. N Engl J Med 2014;371:1619–28.
4. Mandell LA. Epidemiology and etiology of community-acquired pneumonia. Infect Dis
5. Hoare Z, Lim WS. Pneumonia: update on diagnosis and management. BMJ 2006;332:1077–9.
6. Johnstone J, Marrie TJ, Eurich DT, Majumdar SR. Effect of pneumococcal vaccination in hospitalized adults with community-acquired pneumonia. Arch Intern Med 2007;167:1938–43
7. File TM Jr, Marrie TJ. Burden of community-acquired pneumonia in North American adults. Postgrad Med 2010;122:130–41.
8. Eurich DT, Marrie TJ, Minhas-Sandhu JK, Majumdar SR. Ten-year mortality after community-acquired pneumonia. a prospective cohort. Am J Respir Crit Care Med 2015;192:597-604.
9. Jain S, Self WH, Wunderink RG, et al. Community-acquired pneumonia requiring hospitalization among U.S. adults. N Engl J Med 2015;373:415–27.
10. Griffin MR, Zhu Y, Moore MR, et al. U.S. hospitalizations for pneumonia after a decade of pneumococcal vaccination. N Engl J Med 2013;369:155–63.
11. Nuorti JP, Butler JC, Farley MM, et al. Cigarette smoking and invasive pneumococcal disease. Active Bacterial Core Surveillance Team. N Engl J Med 2000;342:681–9.
12. Almirall J, Serra-Prat M, Bolíbar I, BalassoV. Risk factors for community-acquired pneumonia in adults: a systemic review of observational studies. Respiration 2017;94:299–311.
13. Janoff EM.Streptococcus pneumonia. In: Bennett JE, Dolin R, Blaser MJ, editors. Mandell, Douglas and Bennett’s principles and practice of infectioius diseases. 8th ed. Philadelphia: Sauders; 2015: 2310–27.
14. Diehr P, Wood RW, Bushyhead J, et al. Prediction of pneumonia in outpatients with acute cough--a statistical approach. J Chronic Dis 1984;37:215–25.
15. Metlay JP, Schulz R, Li YH, et al. Influence of age on symptoms at presentation in patients with community-acquired pneumonia. Arch Intern Med 1997;157:1453–9.
16. Mandell LA, Wunderink RG, Anzueto A, et al. Infectious Diseases Society of America/American Thoracic Society consensus guidelines on the management of community-acquired pneumonia in adults. Clin Infect Dis 2007;44 Suppl 2:S27–72.
17. Jartti A, Rauvala E, Kauma H, et al. Chest imaging findings in hospitalized patients with H1N1 influenza. Acta Radiol 2011;52:297–304.
18. Basi SK, Marrie TJ, Huang JQ, Majumdar SR. Patients admitted to hospital with suspected pneumonia and normal chest radiographs: epidemiology, microbiology, and outcomes. Am J Med 2004;117:305–11.
19. Caldwell A, Glauser FL, Smith WR, et al. The effects of dehydration on the radiologic and pathologic appearance of experimental canine segmental pneumonia. Am Rev Respir Dis 1975;112:651–6.
20. Bartlett JG. Pneumonia. In: Barlett JG, editor. Management of respiratory tract infections. Philadelphia: Lippincott, Williams & Wilkins; 2001: 1–122.
21. Claessens YE, Debray MP, Tubach F, et al. Early chest computed tomography scan to assist diagnosis and guide treatment decision for suspected community-acquired pneumonia. Am J Respir Crit Care Med 2015;192:974–82.
22. Wheeler JH, Fishman EK. Computed tomography in the management of chest infections: current status. Clin Infect Dis 1996;23:232–40.
23. Chesnutt MP. Pulmonary disorders. In: Papadakis MM, editor. Current medical diagnosis and treatment. New York: McGraw-Hill; 2016: 242–320.
24. Mandell LW. Pneumonia. In: Kasper DF, editor. Harrison’s infectious diseases. 1st ed. New York: McGraw-Hill; 2010: 188–201.
25. Reed WW, Byrd GS, Gates RH Jr, et al. Sputum gram’s stain in community-acquired pneumococcal pneumonia. A meta-analysis. West J Med 1996;165:197–204.
26. Chalasani NP, Valdecanas MA, Gopal AK, et al. Clinical utility of blood cultures in adult patients with community-acquired pneumonia without defined underlying risks. Chest 1995;108:932–6.
27. Bordon J, Peyrani P, Brock GN, et al. The presence of pneumococcal bacteremia does not influence clinical outcomes in patients with community-acquired pneumonia: results from the Community-Acquired Pneumonia Organization (CAPO) International Cohort study. Chest 2008;133:618–24.
28. Helbig JH, Uldum SA, Bernander S, et al. Clinical utility of urinary antigen detection for diagnosis of community-acquired, travel-associated, and nosocomial legionnaires’ disease. J Clin Microbiol 2003;41:838–40.
29. Smith MD, Derrington P, Evans R, et al. Rapid diagnosis of bacteremic pneumococcal infections in adults by using the Binax NOW Streptococcus pneumoniae urinary antigen test: a prospective, controlled clinical evaluation. J Clin Microbiol 2003;41:2810–3.
30. Johansson N, Kalin M, Tiveljung-Lindell A, et al. Etiology of community-acquired pneumonia: increased microbiological yield with new diagnostic methods. Clin Infect Dis 2010;50:202–9.
31. Gilbert DN. Procalcitonin as a biomarker in respiratory tract infection. Clin Infect Dis 2011;52 Suppl 4:S346–50.
32. Schuetz P, Muller B, Christ-Crain M, et al. Procalcitonin to initiate or discontinue antibiotics in acute respiratory tract infections. Cochrane Database Syst Rev 2012;(9):CD007498.
33. Boussekey N, Leroy O, Alfandari S, et al. Procalcitonin kinetics in the prognosis of severe community-acquired pneumonia. Intensive Care Med 2006;32:469–72.
34. Flanders SA, Stein J, Shochat G, et al. Performance of a bedside C-reactive protein test in the diagnosis of community-acquired pneumonia in adults with acute cough. Am J Med 2004;116:529–35.
35. Fine MJ, et al A prediction rule to identify low-risk patients with community-acquired pneumonia.N Engl J Med.1997;336:243-50.
36. Lim WS, van der Eerden MM, Laing R, et al. Defining community acquired pneumonia severity on presentation to hospital: an international derivation and validation study. Thorax 2003;58:377–82.
37. Arnold FW, Ramirez JA, McDonald LC, Xia EL. Hospitalization for community-acquired pneumonia: the pneumonia severity index vs clinical judgment. Chest 2003;124:121–4.
38. Aujesky D, McCausland JB, Whittle J, et al. Reasons why emergency department providers do not rely on the pneumonia severity index to determine the initial site of treatment for patients with pneumonia. Clin Infect Dis 2009;49:e100–8.
39. Charles PG, Wolfe R, Whitby M, et al. SMART-COP: a tool for predicting the need for intensive respiratory or vasopressor support in community-acquired pneumonia. Clin Infect Dis 2008;47:375–84.
40. Marti C, Garin N, Grosgurin O, et al. Prediction of severe community-acquired pneumonia: a systematic review and meta-analysis. Crit Care 2012;16:R141.
41. Wunderink RG, Niederman MS, Kollef MH, et al. Linezolid in methicillin-resistant Staphylococcus aureus nosocomial pneumonia: a randomized, controlled study. Clin Infect Dis 2012;54:621–9.
42. Silverman JA, Mortin LI, Vanpraagh AD, et al. Inhibition of daptomycin by pulmonary surfactant: in vitro modeling and clinical impact. J Infect Dis 2005;191:2149–52.
43. El Hajj MS, Turgeon RD, Wilby KJ. Ceftaroline fosamil for community-acquired pneumonia and skin and skin structure infections: a systematic review. Int J Clin Pharm 2017 Jan 5.
44. Taboada M, Melnick D, Iaconis JP, et al. Ceftaroline fosamil versus ceftriaxone for the treatment of community-acquired pneumonia: individual patient data meta-analysis of randomized controlled trials. J Antimicrob Chemother 2016;71:862–70.
45. Liu C, Bayer A, Cosgrove SE, et al. Clinical practice guidelines by the infectious diseases society of america for the treatment of methicillin-resistant Staphylococcus aureus infections in adults and children: executive summary. Clin Infect Dis 2011;52:285–92.
46. Baddour LM, Yu VL, Klugman KP, et al. Combination antibiotic therapy lowers mortality among severely ill patients with pneumococcal bacteremia. Am J Respir Crit Care Med 2004;170:440–4.
47. FDA Drug Safety Communication: FDA warns of increased risk of death with IV antibacterial Tygacil (tigecycline) and approves new boxed warning [Internet]. 15 Jan 2016. Available at www.fda.gov/Drugs/DrugSafety/ucm369580.htm.
48. Edelstein PR, CR. Legionnaires’ Disease and Pontiac Fever. In: Kasper DF, editor. Harrison’s infectious diseases. 1st ed. New York: McGraw-Hill; 2010: 2633.
49. Hammerschlag MR, Kohlhoff SA, Gaydos, CA. Chlamydia pneumoniae. In: Kasper DF, editor. Harrison’s infectious diseases. 1st ed. New York: McGraw-Hill; 2010: 2174.
50. Holzman RS, MS. Mycoplasma pneumoniae and Atypical Pneumonia. In: Kasper DF, editor. Harrison’s infectious diseases. 1st ed. New York: McGraw-Hill; 2010: 2183.
51. Yamada M, Buller R, Bledsoe S, Storch GA. Rising rates of macrolide-resistant Mycoplasma pneumoniae in the central United States. Pediatr Infect Dis J 2012;31:409–10.
52. Yi SH, Hatfield KM, Baggs J, et al. Duration of antibiotic use among adults with uncomplicated community-acquired pneumonia requiring hospitalization in the United States. Clin Infect Dis 2017 Nov 6.
53. Hayashi Y, Paterson DL. Strategies for reduction in duration of antibiotic use in hospitalized patients. Clin Infect Dis 2011;52:1232–40.
54. Akram AR, Chalmers JD, Taylor JK, et al. An evaluation of clinical stability criteria to predict hospital course in community-acquired pneumonia. Clin Microbiol Infect 2013;19:1174–80.
55. Halm EA, Fine MJ, Kapoor WN, et al. Instability on hospital discharge and the risk of adverse outcomes in patients with pneumonia. Arch Intern Med 2002;162:1278–84.
56. Roson B, Carratala J, Fernandez-Sabe N, et al. Causes and factors associated with early failure in hospitalized patients with community-acquired pneumonia. Arch Intern Med 2004;164:502–8.
57. El-Solh AA, Pietrantoni C, Bhat A, et al. Microbiology of severe aspiration pneumonia in institutionalized elderly. Am J Respir Crit Care Med 2003;167:1650–4.
58. Wan YD, Sun TW, Liu ZQ, et al. Efficacy and safety of corticosteroids for community-acquired pneumonia: a systematic review and meta-analysis. Chest 2016;149:209–19.
59. Torres A, Sibila O, Ferrer M, et al. Effect of corticosteroids on treatment failure among hospitalized patients with severe community-acquired pneumonia and high inflammatory response: a randomized clinical trial. JAMA 2015;313:677–86.
60. McCullers JA. Insights into the interaction between influenza virus and pneumococcus. Clin Microbiol Rev 2006;19:571–82.
61. Grohskopf LA, Sokolow LZ, Broder KR, et al. Prevention and control of seasonal influenza with vaccines. MMWR Recomm Rep 2016;65:1–54.
62. Rubins JB, Alter M, Loch J, Janoff EN. Determination of antibody responses of elderly adults to all 23 capsular polysaccharides after pneumococcal vaccination. Infect Immun 1999;67:5979–84.
63. Centers for Disease Control. Vaccines and preventable diseases [Internet]. 22 Nov 2016. Available at www.cdc.gov/vaccines/vpd/pneumo/hcp/about-vaccine.html.
64. Bonten MJ, Huijts SM, Bolkenbaas M, et al. Polysaccharide conjugate vaccine against pneumococcal pneumonia in adults. N Engl J Med 2015;372:1114–25.
65. Centers for Disease Control. Recommended adult immunization schedule -- United States -- 2016 [Internet]. 2016. Available at www.cdc.gov/vaccines/schedules/downloads/adult/adult-schedule.pdf.
66. Kobayashi M, Bennett NM, Gierke R, et al. Intervals between PCV13 and PPSV23 vaccines: recommendations of the Advisory Committee on Immunization Practices (ACIP). MMWR Morb Mortal Wkly Rep 2015;64:944–7.
67. Centers for Disease Control and Prevention (CDC). Use of 13-valent pneumococcal conjugate vaccine and 23-valent pneumococcal polysaccharide vaccine for adults with immunocompromising conditions: recommendations of the Advisory Committee on Immunization Practices (ACIP). MMWR Morb Mortal Wkly Rep 2012;61:816–9.
68. Aujesky D, Auble TE, Yealy DM, et al. Prospective comparison of three validated prediction rules for prognosis in community-acquired pneumonia. Am J Med 2005;118:384–92.
This is what a flu pandemic looks like
For the week ending Feb. 3, 2018, the proportion of outpatient visits for influenza-like illness (ILI) was 7.7%, which would appear to equal the mark of 7.7% set in October of 2009. The earlier 7.7%, however, is rounded down from 7.715%, while the current mark is rounded up from 7.653%, data from the CDC’s Fluview website show.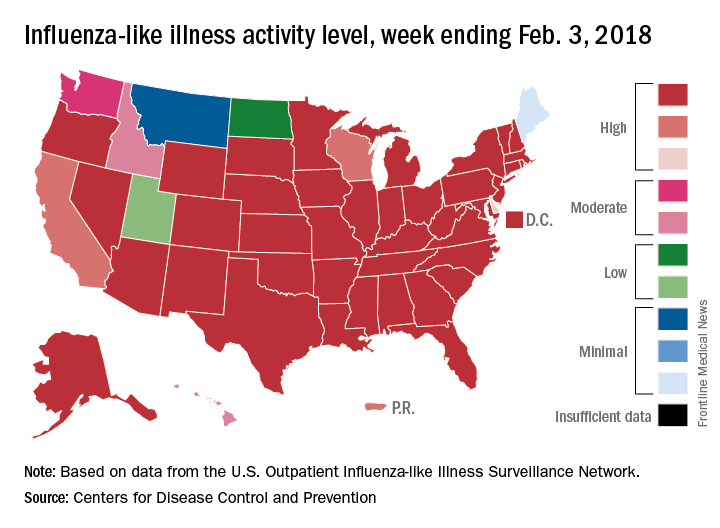
Deaths attributed to pneumonia and influenza were above the epidemic threshold set by the National Center for Health Statistics Mortality Surveillance system, acting CDC director Anne Schuchat, MD, said in a teleconference sponsored by the agency.
ILI activity was at level 10 on the CDC’s 1-10 scale in 41 states, compared with 34 the week before, and was categorized in the “high” range (levels 8-10) in another 3 states and Puerto Rico, according to data from the CDC’s Outpatient Influenza-like Illness Surveillance Network. In California, which was noted as a possible bright spot last week by Dr. Schuchat because activity there had been decreasing, the ILI level went back up to level 9 after being at 7 the week before.
Flu-related hospitalizations are continuing to rise at a record clip, with the cumulative rate for the week of Feb. 3 at 59.9 per 100,000 population, the CDC reported. A total of 1 in 10 hospital-based deaths last week were related to influenza. At this point in the 2014-2015 flu season – which has the highest number of hospitalizations at 710,000 – the hospitalization rate was only 50.9 per 100,000 population.
There were 10 pediatric deaths reported for the week ending Feb. 3, although 9 occurred in previous weeks. There have been 63 flu-related deaths among children so far during the 2017-2018 season.
Dr. Schuchat continued to recommend members of the public to get a flu shot and to stay home if they are feeling sick.
“What could be mild symptoms for you could be deadly for someone else,” Dr. Schuchat said, adding that antiviral medications remain important. “Physicians do not have to wait for confirmatory flu testing. They should begin treatment with antiviral drugs immediately in they suspect they have a severely ill or a high risk patient.”
“Flu vaccines often have lower effectiveness against H3N1 viruses. However, some protection is better than none. The vaccine’s effectiveness against other flu viruses, like B and H1N1, is better. Because of the ongoing intensity of the flu season and the increasing circulation of influenza B and h1n1, we do continue to recommend vaccination even this late in the season.”
Dr. Schuchat stressed the importance of the pneumococcal pneumonia vaccine. “Flu can make people more vulnerable to secondary infections like bacterial pneumonia. We recommend people aged 65 and over get a pneumococcal pneumonia vaccine,” she said.
FROM A CDC TELECONFERENCE
Children with sickle cell anemia fall short on antibiotic adherence
Despite the increased risk for invasive pneumococcal disease, prophylactic antibiotics are underused in children with sickle cell anemia, according to data from more than 2,000 children in six states.
Less than one-fifth (18%) of young children (aged 3 months to 5 years) with sickle cell anemia (SCA) receive at least 300 days of prophylactic antibiotics to reduce their risk of pneumococcal infections, the analysis found.
“Although the effectiveness of daily penicillin prophylaxis has been known for decades, limited evidence indicates low rates of compliance among children,” wrote Sarah L. Reeves, PhD, of the University of Michigan, Ann Arbor, and her colleagues. The report was published in Pediatrics.
The researchers reviewed Medicaid claims for 2,821 children with SCA from the period of 2005-2012 for a total of 5,014 person-years. The data were taken from six states: Florida, Illinois, Louisiana, Michigan, South Carolina, and Texas. Antibiotic prophylaxis was defined as four different treatment protocols: oral penicillin; oral penicillin or erythromycin; oral penicillin, erythromycin, or amoxicillin; or any antibiotic that could protect against Streptococcus pneumoniae.
Overall, the children in the study averaged 1.7 sickle cell disease–related inpatient hospitalizations annually, as well as 13.2 sickle cell disease–related outpatient visits and 3.8 emergency department visits per year.
The proportion of children who received 300 days or more of prophylactic antibiotics varied by state, by year, and by type of treatment. “In this multistate analysis, receipt of antibiotic prophylaxis among children with SCA was persistently low, irrespective of year or state,” the researchers noted.
The odds that a child received 300 days or more of prophylactic antibiotics increased with each outpatient visit, including well child visits and sickle cell disease–related visits (odds ratios 1.08 and 1.01, respectively).
A child in the third quartile of sickle cell disease–related outpatient visits (defined as 17 annual visits) was 15% more likely than was a child in the first quartile (defined as six annual visits) to receive at least 300 days of antibiotics.
The study findings were limited by several factors including potential overestimation of how many children received medication, the researchers said. However, the results suggest the need for practical and effective intervention that targets barriers to treatment adherence, they said.
“Provider-focused strategies to increase adherence could capitalize on the numerous annual outpatient encounters with the health care system that children with SCA are already experiencing,” they wrote.
The study was supported by a grant from the Agency for Healthcare Research and Quality and the Centers for Medicare and Medicaid Services. The researchers reported having no financial disclosures.
SOURCE: Reeves S et al. Pediatrics. 2018;141(3):e20172182. doi: 10.1542/peds.2017-2182.
FROM PEDIATRICS
Key clinical point:
Major finding: A total of 18% of children with sickle cell anemia in Florida, Illinois, Louisiana, Michigan, South Carolina, and Texas received 300 days or more of prophylactic antibiotics.
Study details: A review of 2,821 children aged 3 months to 5 years with sickle cell anemia.
Disclosures: The study was supported by a grant from the Agency for Healthcare Research and Quality and the Centers for Medicare and Medicaid Services. The researchers reported having no financial disclosures.
Source: Reeves S et al. Pediatrics. 2018;141(3):e20172182. doi: 10.1542/peds.2017-2182.
Hospitals filling as flu season worsens
Through the last full week of January, the cumulative “hospitalization rate is the highest we’ve seen,” acting Centers for Disease Control and Prevention director Anne Schuchat, MD, said. For the current season so far, the hospitalization rate stands at 51.4 per 100,000 population, putting it on pace to top the total of 710,000 flu-related admissions that occurred during the 2014-2015 season, she said in a weekly briefing Feb. 2.
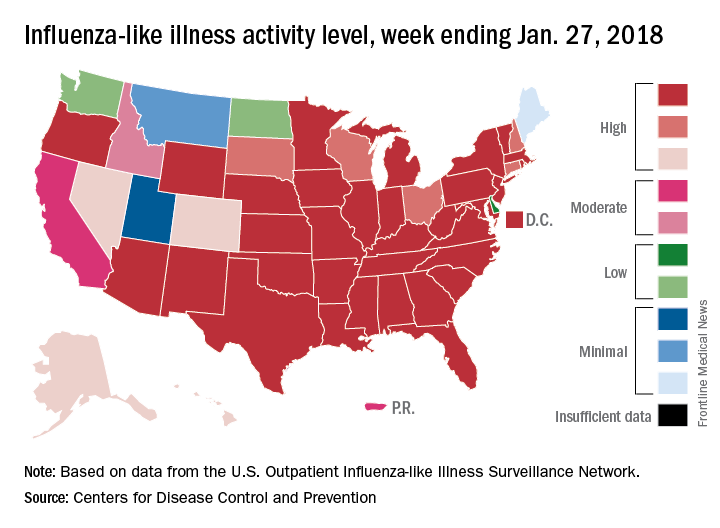
Flu-related pediatric deaths also took a big jump for the week as another 16 were reported, which brings the total for the season to 53. Of the children who have died so far, only 20% were vaccinated, said Dan Jernigan, MD, MPH, director of the influenza division at the CDC’s National Center for Immunization and Respiratory Diseases, Atlanta. He also noted that half of the children who have been hospitalized did not had an underlying condition.
The one bit of good news for the week was that activity in the West seems to be easing up, Dr. Schuchat said. The geographic spread of ILI was reported as widespread in 48 states, which is down from 49 the previous week because Oregon dropped off the list. To go along with that, the ILI activity level in California has dropped 2 weeks in a row and now stands at level 7, the CDC data show.
Through the last full week of January, the cumulative “hospitalization rate is the highest we’ve seen,” acting Centers for Disease Control and Prevention director Anne Schuchat, MD, said. For the current season so far, the hospitalization rate stands at 51.4 per 100,000 population, putting it on pace to top the total of 710,000 flu-related admissions that occurred during the 2014-2015 season, she said in a weekly briefing Feb. 2.
Flu-related pediatric deaths also took a big jump for the week as another 16 were reported, which brings the total for the season to 53. Of the children who have died so far, only 20% were vaccinated, said Dan Jernigan, MD, MPH, director of the influenza division at the CDC’s National Center for Immunization and Respiratory Diseases, Atlanta. He also noted that half of the children who have been hospitalized did not had an underlying condition.
The one bit of good news for the week was that activity in the West seems to be easing up, Dr. Schuchat said. The geographic spread of ILI was reported as widespread in 48 states, which is down from 49 the previous week because Oregon dropped off the list. To go along with that, the ILI activity level in California has dropped 2 weeks in a row and now stands at level 7, the CDC data show.
Closer to a Vaccine For a ‘Pandemic in Progress’?
A series of National Institute of Health (NIH) clinical trials are bringing Zika virus vaccines closer to the public.
According to preliminary findings from 3 phase 1 clinical trials, an investigational Zika purified inactivated virus (ZPIV) vaccine was well tolerated and induced an immune response. Scientists from Walter Reed Army Institute of Research are developing the vaccine and leading 1 of the trials.
Of 67 adult participants, 55 received the investigational vaccine; 12 received placebo. All participants received 2 intramuscular injections 4 weeks apart. The researchers detected antibodies in > 90% of those who received the vaccine, 4 weeks after the last dose.
In phase 2 clinical trials, 2 versions of an experimental gene-based Zika vaccine, developed by scientists at the National Institute of Allergy and Infectious Diseases, were both found to be safe and to induce an immune response. One candidate showed “the most promise,” paving the way for an international phase 2/2b safety and efficacy trial, which began in 2017 and will last for 2 years.
“This trial marks a significant milestone in our efforts to develop countermeasures for a pandemic in progress,” said Anthony Fauci, MD, NIAID director
Adacel Tdap effective throughout third trimester vaccination window
, according to a prospective cohort study published in Obstetrics and Gynecology.
Timing does make a difference with the other Tdap option in pregnancy, Boostrix; pertussis protection is stronger if women receive it early in the third trimester. The investigators wanted to see if that were true as well with Adacel.
They compared pertussis antibody concentrations in maternal venous serum and umbilical cord arterial serum at the time of delivery in 52 women vaccinated from 27 to 30 6/7 weeks of gestation, and compared the results with 36 women vaccinated from 31 to 35 6/7 weeks.
Pertussis antibody concentrations did not vary by gestational age. Maternal serum pertussis toxin IgG concentrations were the same in both groups (48.6 enzyme-linked immunoassay [ELISA] units/mL), and there were no statistically significant differences in cord serum pertussis toxin IgG concentrations (92.1 ELISA units/mL in the early group, compared with 90.7 in the later group; P = .95) or cord serum pertactin IgG concentrations (798 international units/mL in the early group, versus 730 in the later group; P = .73).
Overall, cord serum pertussis toxin IgG concentrations were approximately twice maternal serum pertussis toxin IgG concentrations (91.6 vs. 48.6 ELISA units/mL; P less than .01). Cord serum pertussis toxin IgG concentrations were in the protective range (greater than 10 ELISA units/mL) in 87% of the women vaccinated from 27 to 30 6/7 weeks, and in 97% vaccinated from 31 to 35 6/7 weeks (P = .13).
Maternal vaccination in the third trimester against pertussis “was associated with a high percentage of newborns with antibody concentrations conferring protection,” said investigators led by Cynthia Abraham, MD, an ob.gyn. at Mount Sinai Hospital, New York. “We found no significant difference across the period of 27-36 weeks of gestation with respect to immunogenicity with Adacel use.”
Maternal Tdap vaccination is done to protect infants in their first 2 months of life, before they start their DTaP series. The Centers for Disease Control and Prevention recommends vaccination between 27 and 36 weeks of gestation.
It’s unclear why it doesn’t matter when within that window women receive Adacel, but protection with Boostrix if Boostrix is administered early on in the trimester.
Boostrix differs from Adacel in antigen composition and in the method of pertussis toxin detoxification. Boostrix is detoxified with formaldehyde and glutaraldehyde. Adacel is detoxified only with formaldehyde.
“Double detoxification may cause differences in immunogenicity as antigenic epitopes are further modified, perhaps providing an explanation for the difference in results between the vaccines,” the investigators said.
Women in the early group received Adacel at a mean gestational age of 29.1 weeks, versus 32.9 weeks in the later group. The women were a mean age of about 29 years; 56% were Hispanic, 23% white, and the rest were about equally split between black and Asian women.
No funding source was reported. The authors did not have any conflicts of interest.
SOURCE: Abraham C et al. Obstet Gynecol. 2018 Feb;131(2):364-9.
FROM OBSTETRICS AND GYNECOLOGY
Key clinical point: Unlike Boostrix, pertussis protection is the same whether pregnant women receive Adacel Tdap vaccine early in the third trimester or in the middle.
Major finding: There were no statistically significant differences in cord serum pertussis toxin IgG concentrations (92.1 ELISA units/mL in the early group, versus 90.7 in the later group, P = .95).
Study details: A prospective cohort study involving 88 women.
Disclosures: No study sponsor was reported. The authors had no disclosures.
Source: Abraham C et al. Obstet Gynecol. 2018 Feb;131(2):364-9.
Birth cohort affected 2015-2016 flu vaccine effectiveness
The influenza vaccine introduced in 2009 showed reduced effectiveness during the 2015-2016 influenza season, but only in adults born between 1958 and 1979, according to an analysis published online in the Journal of Infectious Diseases.
Using the Influenza Vaccine Effectiveness Network, researchers analyzed data from 2,115 patients with medically attended acute respiratory illness who tested positive for A(H1N1)pdm09 influenza virus, and 14,696 patients who tested negative for the influenza virus, from 2010-2011 to 2015-2016 (excluding the 2014-2015 influenza season).
Overall, 48% of the influenza virus–negative patients and 28% of the virus-positive patients had received at least one dose of the seasonal inactivated influenza vaccine more than 2 weeks before they fell ill.
However, the vaccine, which was based on the A/California/07/2009 strain of the A(H1N1)pdm09 virus, was only 47% effective during the 2015-2016 season, compared with 61% effectiveness during the 2010-2011 season through to the 2013-2014 season.
When researchers looked at vaccine effectiveness by birth cohort, they found that one particular cohort – individuals born between 1958 and 1979 – showed a significantly reduced vaccine effectiveness (22%) during the 2015-2016 season. By comparison, vaccine effectiveness in this cohort was 61% during the 2010-2013 seasons, and 56% during the 2013-2014 season.
When this birth cohort was excluded from analysis of the 2015-2016 season, the overall vaccine effectiveness for that season was 61%.
While the vaccine was based on an early reference strain of A(H1N1)pdm09, the virus itself later acquired mutations in the hemagglutinin gene, leading to the emergence of new genetic clades, including 6B, which dominated in the 2013-2014 influenza season, and 6B.1, which dominated in 2015-2016.
“Limited serologic data suggest that some adults born during 1958-1979 (age range in 2015-2016, 36-57 years) have decreased antibody titers against A(H1N1)pdm09 group 6B and 6B.1 viruses,” wrote Brendan Flannery, PhD, from the Centers for Disease Control and Prevention, and his coauthors.
They suggested that individuals in this cohort may have been immunologically primed with A/USSR/90/1977-like viruses, which were the first group of A(H1N1) viruses that this cohort would have been exposed to. A(H1N1) strains didn’t circulate between 1958 and 1977. Vaccination with A(H1N1)pdm09 viruses may have induced antibodies against shared antigenic components found on early versions of A(H1N1)pdm09.
If these shared antigenic epitopes were then altered in the later 6B and 6B.1 viruses, that might account for decreased antibody titers in this age group.
“Replacement of the A/California/07/2009(H1N1)pdm09 vaccine reference strain with A/Michigan/45/2015 (group 6B.1) should lead to improved [vaccine effectiveness] against circulating A(H1N1)pdm09 viruses,” the investigators noted.
The study was supported by the Centers for Disease Control and Prevention, the National Institutes of Health, and the National Center for Advancing Translational Sciences. Eight authors declared funding, grants, and consultancies with the pharmaceutical industry, with five also declaring funding from the CDC.
SOURCE: Flannery B et al. J Infect Dis. 2018 Jan 18. doi: 10.1093/infdis/jix634.
This study proposes that influenza virus strains encountered early in life focus the immune response to later infection or vaccination on shared epitopes between the early and later strains. Supporting this hypothesis is evidence from other studies showing that 60% of the serological response to inactivated influenza vaccines is the result of boosting pre-existing antibodies, rather than the creation of new, vaccine-induced antibodies.
However there are also some flaws to this argument, and we should be careful to avoid confirmation bias. For example, the reduction in effectiveness of vaccines against A(H1N1) has been observed in North America, where this study is located, but to a lesser extent in studies conducted in other regions. Reductions in vaccine effectiveness have also been observed in other birth cohorts and during other influenza seasons.
That aside, accumulating evidence suggests that the vaccine strain be updated from A/California/7/2009 to A/Michigan/45/2015 (a clade 6B.1 strain) for the 2016-2017 influenza seasons.
Allen C. Cheng, PhD, is from the School of Public Health and Preventive Medicine at Monash University, Melbourne, and Kanta Subbarao, MBBS, is from the World Health Organization Collaborating Centre for Reference and Research on Influenza and the Peter Doherty Institute for Infection and Immunity, Australia. These comments are taken from an accompanying editorial (J Infect Dis. 2018, Jan 18. doi: 10.1093/infdis/jix635). The authors declared support from the Australian Department of Health and the Australian National Health and Medical Research Council. No conflicts of interest were declared.
The influenza vaccine introduced in 2009 showed reduced effectiveness during the 2015-2016 influenza season, but only in adults born between 1958 and 1979, according to an analysis published online in the Journal of Infectious Diseases.
Using the Influenza Vaccine Effectiveness Network, researchers analyzed data from 2,115 patients with medically attended acute respiratory illness who tested positive for A(H1N1)pdm09 influenza virus, and 14,696 patients who tested negative for the influenza virus, from 2010-2011 to 2015-2016 (excluding the 2014-2015 influenza season).
Overall, 48% of the influenza virus–negative patients and 28% of the virus-positive patients had received at least one dose of the seasonal inactivated influenza vaccine more than 2 weeks before they fell ill.
However, the vaccine, which was based on the A/California/07/2009 strain of the A(H1N1)pdm09 virus, was only 47% effective during the 2015-2016 season, compared with 61% effectiveness during the 2010-2011 season through to the 2013-2014 season.
When researchers looked at vaccine effectiveness by birth cohort, they found that one particular cohort – individuals born between 1958 and 1979 – showed a significantly reduced vaccine effectiveness (22%) during the 2015-2016 season. By comparison, vaccine effectiveness in this cohort was 61% during the 2010-2013 seasons, and 56% during the 2013-2014 season.
When this birth cohort was excluded from analysis of the 2015-2016 season, the overall vaccine effectiveness for that season was 61%.
While the vaccine was based on an early reference strain of A(H1N1)pdm09, the virus itself later acquired mutations in the hemagglutinin gene, leading to the emergence of new genetic clades, including 6B, which dominated in the 2013-2014 influenza season, and 6B.1, which dominated in 2015-2016.
“Limited serologic data suggest that some adults born during 1958-1979 (age range in 2015-2016, 36-57 years) have decreased antibody titers against A(H1N1)pdm09 group 6B and 6B.1 viruses,” wrote Brendan Flannery, PhD, from the Centers for Disease Control and Prevention, and his coauthors.
They suggested that individuals in this cohort may have been immunologically primed with A/USSR/90/1977-like viruses, which were the first group of A(H1N1) viruses that this cohort would have been exposed to. A(H1N1) strains didn’t circulate between 1958 and 1977. Vaccination with A(H1N1)pdm09 viruses may have induced antibodies against shared antigenic components found on early versions of A(H1N1)pdm09.
If these shared antigenic epitopes were then altered in the later 6B and 6B.1 viruses, that might account for decreased antibody titers in this age group.
“Replacement of the A/California/07/2009(H1N1)pdm09 vaccine reference strain with A/Michigan/45/2015 (group 6B.1) should lead to improved [vaccine effectiveness] against circulating A(H1N1)pdm09 viruses,” the investigators noted.
The study was supported by the Centers for Disease Control and Prevention, the National Institutes of Health, and the National Center for Advancing Translational Sciences. Eight authors declared funding, grants, and consultancies with the pharmaceutical industry, with five also declaring funding from the CDC.
SOURCE: Flannery B et al. J Infect Dis. 2018 Jan 18. doi: 10.1093/infdis/jix634.
FROM THE JOURNAL OF INFECTIOUS DISEASES
Key clinical point:
Major finding: The influenza vaccine effectiveness during the 2015-2016 season was just 22% in individuals born between 1958 and 1979.
Data source: A retrospective case-control study of 2,115 patients who tested positive for A(H1N1)pdm09 influenza virus, and 14,696 negative controls.
Disclosures: The study was supported by the Centers for Disease Control and Prevention, the National Institutes of Health, and the National Center for Advancing Translational Sciences. Eight authors declared funding, grants, and consultancies with the pharmaceutical industry, with five also declaring funding from the CDC.
Source: Flannery B et al. J Infect Dis. 2018 Jan 18. doi: 10.1093/infdis/jix634.