User login
New NAS report seeks to modernize STI paradigm
Approximately 68 million cases of sexually transmitted infections are reported in the United States each year, yet antiquated approaches to STI prevention, in addition to health care inequities and lack of funding, have substantially prevented providers and officials from curbing the spread. In response to rising case numbers, the National Academies of Sciences, Engineering, and Medicine released a report this week with recommendations to modernize the nation’s STI surveillance and monitoring systems, increase the capabilities of the STI workforce, and address structural barriers to STI prevention and access to care.
Given the rising rates of STIs and the urgent, unmet need for prevention and treatment, the Centers for Disease Control and Prevention’s National Association of County and City Health Officials commissioned the National Academies to develop actionable recommendations to control STIs. The new report marks a long road toward the public’s willingness to discuss STDs, or what a 1997 Institute of Medicine report described as a “hidden epidemic” that had been largely neglected in public discourse.
Jeffrey Crowley, MPH, committee member and an author of the new National Academies report, said in an interview that, despite the increased openness to discuss STIs in today’s society, STD rates since the late 1990s have gotten much worse. Lack of appropriate governmental funding for research and drug development, structural inequities, and persisting stigmatization are key drivers for rising rates, explained Mr. Crowley.
Addressing structural barriers to STI prevention
Playing a prominent role in the National Academies report are issues of structural and institutional barriers to STI prevention and care. In the report, the authors argued that a policy-based approach should seek to promote sexual health and eliminate structural racism and inequities to drive improvements in STI management.
“We think it’s these structural factors that are central to all the inequities that play out,” said Mr. Crowley, “and they either don’t get any attention or, if they do get attention, people don’t really speak concretely enough about how we address them.”
The concrete steps, as outlined in the report, begin with addressing factors that involve the health care industry at large. Automatic STI screening as part of routine visits, alerts in electronic health records that remind clinicians to screen patients, and reminders to test patients can be initial low-cost actions health care systems can take to improve STI testing, particularly in marginalized communities. Mr. Crowley noted that greater evidence is needed to support further steps to address structural factors that contribute to barriers in STI screening and treatment access.
Given the complexities inherent in structural barriers to STI care, the report calls on a whole-government response, in partnership with affected communities, to normalize discussions involving sexual well-being. “We have to ask ourselves how we can build healthier communities and how can we integrate sexual health into that dialogue in a way that improves our response to STI prevention and control,” Mr. Crowley explained.
Harnessing AI and dating apps
The report also addresses the power of artificial intelligence to predict STI rates and to discover trends in risk factors, both of which may improve STI surveillance and assist in the development of tailored interventions. The report calls for policy that will enable companies and the government to capitalize on AI to evaluate large collections of data in EHRs, insurance claims databases, social media, search engines, and even dating apps.
In particular, dating apps could be an avenue through which the public and private sectors could improve STI prevention, diagnosis, and treatment. “People want to focus on this idea of whether these apps increase transmission risk,” said Mr. Crowley. “But we would say that this is asking the wrong question, because these technologies are not going away.” He noted that private and public enterprises could work together to leverage these technologies to increase awareness of prevention and testing.
Unifying the STI/HIV and COVID-19 workforce
The report also recommends that the nation unify the STI/HIV workforce with the COVID-19 workforce. Given the high levels of expertise in these professional working groups, the report suggests unification could potentially address both the current crisis and possible future disease outbreaks. Combining COVID-19 response teams with underresourced STI/HIV programs may also improve the delivery of STI testing, considering that STI testing programs have had to compete for resources during the pandemic.
Addressing stigma
The National Academies report also addresses the ongoing issue of stigma, which results from “blaming” individuals and the choices they make so as to create shame, embarrassment, and discrimination. Because of stigma, sexually active people may be unwilling to seek recommended screening, which can lead to delays in diagnosis and treatment and can increase the risk for negative health outcomes.
“As a nation, we’ve almost focused too intently on individual-level factors in a way that’s driven stigma and really hasn’t been helpful for combating the problem,” said Mr. Crowley. He added that, instead of focusing solely on individual-level choices, the nation should instead work to reframe sexual health as a key aspect of overall physical, mental, and emotional well-being. Doing so could create more opportunities to address structural barriers to STI prevention and ensure that more prevention and screening services are available in stigma-free environments.
“I know what we’re recommending is ambitious, but it’s not too big to be achieved, and we’re not saying tomorrow we’re going to transform the world,” Mr. Crowley concluded. “It’s a puzzle with many pieces, but the long-term impact is really all of these pieces fitting together so that, over time, we can reduce the burden STIs have on the population.”
Implications for real-world change
H. Hunter Handsfield, MD, professor emeritus of medicine for the Center for AIDS and STD at the University of Washington, Seattle, said in an interview that this report essentially is a response to evolving societal changes, new and emerging means of social engagement, and increased focus on racial/ethnic disparities. “These features have all come to the forefront of health care and general policy discussions in recent years,” said Dr. Handsfield, who was not part of the committee that developed the NAS report.
Greater scrutiny on public health infrastructure and its relationship with health disparities in the United States makes the publication of these new recommendations especially appropriate during this era of enhanced focus on social justice. Although the report features the tone and quality needed to bolster bipartisan support, said Dr. Handsfield, it’s hard to predict whether such support will come to fruition in today’s political environment.
In terms of the effects the recommendations may have on STI rates, Dr. Handsfield noted that cherry-picking elements from the report to direct policy may result in its having only a trivial impact. “The report is really an appropriate and necessary response, and almost all the recommendations made can be helpful,” he said, “but for true effectiveness, all the elements need to be implemented to drive policy and funding.”
A version of this article first appeared on Medscape.com.
The significance of mismatch repair deficiency in endometrial cancer
Women with Lynch syndrome are known to carry an approximately 60% lifetime risk of endometrial cancer. These cancers result from inherited deleterious mutations in genes that code for mismatch repair proteins. However, mismatch repair deficiency (MMR-d) is not exclusively found in the tumors of patients with Lynch syndrome, and much is being learned about this group of endometrial cancers, their behavior, and their vulnerability to targeted therapies.

During the processes of DNA replication, recombination, or chemical and physical damage, mismatches in base pairs frequently occurs. Mismatch repair proteins function to identify and repair such errors, and the loss of their function causes the accumulation of the insertions or deletions of short, repetitive sequences of DNA. This phenomenon can be measured using polymerase chain reaction (PCR) screening of known microsatellites to look for the accumulation of errors, a phenotype which is called microsatellite instability (MSI). The accumulation of errors in DNA sequences is thought to lead to mutations in cancer-related genes.
The four predominant mismatch repair genes include MLH1, MSH2, MSH 6, and PMS2. These genes may possess loss of function through a germline/inherited mechanism, such as Lynch syndrome, or can be sporadically acquired. Approximately 20%-30% of endometrial cancers exhibit MMR-d with acquired, sporadic losses in function being the majority of cases and only approximately 10% a result of Lynch syndrome. Mutations in PMS2 are the dominant genotype of Lynch syndrome, whereas loss of function in MLH1 is most frequent aberration in sporadic cases of MMR-d endometrial cancer.1
Endometrial cancers can be tested for MMR-d by performing immunohistochemistry to look for loss of expression in the four most common MMR genes. If there is loss of expression of MLH1, additional triage testing can be performed to determine if this loss is caused by the epigenetic phenomenon of hypermethylation. When present, this excludes Lynch syndrome and suggests a sporadic form origin of the disease. If there is loss of expression of the MMR genes (including loss of MLH1 and subsequent negative testing for promotor methylation), the patient should receive genetic testing for the presence of a germline mutation indicating Lynch syndrome. As an adjunct or alternative to immunohistochemistry, PCR studies or next-generation sequencing can be used to measure the presence of microsatellite instability in a process that identifies the expansion or reduction in repetitive DNA sequences of the tumor, compared with normal tumor.2
It is of the highest importance to identify endometrial cancers caused by Lynch syndrome because this enables providers to offer cascade testing of relatives, and to intensify screening or preventative measures for the many other cancers (such as colon, upper gastrointestinal, breast, and urothelial) for which these patients are at risk. Therefore, routine screening for MMR-d tumors is recommended in all cases of endometrial cancer, not simply those of a young age at diagnosis or for whom a strong family history exists.3 Using family history factors, primary tumor site, and age as a trigger for screening for Lynch syndrome, such as the Bethesda Guidelines, is associated with a 82% sensitivity in identifying Lynch syndrome. In a meta-analysis including testing results from 1,159 women with endometrial cancer, 43% of patients who were diagnosed with Lynch syndrome via molecular analysis would have been missed by clinical screening using Bethesda Guidelines.2
Discovering cases of Lynch syndrome is not the only benefit of routine testing for MMR-d in endometrial cancers. There is also significant value in the characterization of sporadic mismatch repair–deficient tumors because this information provides prognostic information and guides therapy. Tumors with a microsatellite-high phenotype/MMR-d were identified as one of the four distinct molecular subgroups of endometrial cancer by the Cancer Genome Atlas.4 Patients with this molecular profile exhibited “intermediate” prognostic outcomes, performing better than the “serous-like” cancers with p53 mutations, yet worse than patients with a POLE ultramutated group who rarely experience recurrences or death, even in the setting of unfavorable histology.
Beyond prognostication, the molecular profile of endometrial cancers also influence their responsiveness to therapeutics, highlighting the importance of splitting, not lumping endometrial cancers into relevant molecular subgroups when designing research and practicing clinical medicine. The PORTEC-3 trial studied 410 women with high-risk endometrial cancer, and randomized participants to receive either adjuvant radiation alone, or radiation with chemotherapy.5 There were no differences in progression-free survival between the two therapeutic strategies when analyzed in aggregate. However, when analyzed by Cancer Genome Atlas molecular subgroup, it was noted that there was a clear benefit from chemotherapy for patients with p53 mutations. For patients with MMR-d tumors, no such benefit was observed. Patients assigned this molecular subgroup did no better with the addition of platinum and taxane chemotherapy over radiation alone. Unfortunately, for patients with MMR-d tumors, recurrence rates remained high, suggesting that we can and need to discover more effective therapies for these tumors than what is available with conventional radiation or platinum and taxane chemotherapy. Targeted therapy may be the solution to this problem. Through microsatellite instability, MMR-d tumors create somatic mutations which result in neoantigens, an immunogenic environment. This state up-regulates checkpoint inhibitor proteins, which serve as an actionable target for anti-PD-L1 antibodies, such as the drug pembrolizumab which has been shown to be highly active against MMR-d endometrial cancer. In the landmark, KEYNOTE-158 trial, patients with advanced, recurrent solid tumors that exhibited MMR-d were treated with pembrolizumab.6 This included 49 patients with endometrial cancer, among whom there was a 79% response rate. Subsequently, pembrolizumab was granted Food and Drug Administration approval for use in advanced, recurrent MMR-d/MSI-high endometrial cancer. Trials are currently enrolling patients to explore the utility of this drug in the up-front setting in both early- and late-stage disease with a hope that this targeted therapy can do what conventional cytotoxic chemotherapy has failed to do.
Therefore, given the clinical significance of mismatch repair deficiency, all patients with endometrial cancer should be investigated for loss of expression in these proteins, and if present, considered for the possibility of Lynch syndrome. While most will not have an inherited cause, this information regarding their tumor biology remains critically important in both prognostication and decision-making surrounding other therapies and their eligibility for promising clinical trials.
Dr. Rossi is assistant professor in the division of gynecologic oncology at the University of North Carolina at Chapel Hill. She has no conflicts of interest to declare. Email her at obnews@mdedge.com.
References
1. Simpkins SB et al. Hum. Mol. Genet. 1999;8:661-6.
2. Kahn R et al. Cancer. 2019 Sep 15;125(18):2172-3183.
3. SGO Clinical Practice Statement: Screening for Lynch Syndrome in Endometrial Cancer. https://www.sgo.org/clinical-practice/guidelines/screening-for-lynch-syndrome-in-endometrial-cancer/
4. Kandoth et al. Nature. 2013;497(7447):67-73.
5. Leon-Castillo A et al. J Clin Oncol. 2020 Oct 10;38(29):3388-97.
6. Marabelle A et al. J Clin Oncol. 2020 Jan 1;38(1):1-10.
Women with Lynch syndrome are known to carry an approximately 60% lifetime risk of endometrial cancer. These cancers result from inherited deleterious mutations in genes that code for mismatch repair proteins. However, mismatch repair deficiency (MMR-d) is not exclusively found in the tumors of patients with Lynch syndrome, and much is being learned about this group of endometrial cancers, their behavior, and their vulnerability to targeted therapies.
During the processes of DNA replication, recombination, or chemical and physical damage, mismatches in base pairs frequently occurs. Mismatch repair proteins function to identify and repair such errors, and the loss of their function causes the accumulation of the insertions or deletions of short, repetitive sequences of DNA. This phenomenon can be measured using polymerase chain reaction (PCR) screening of known microsatellites to look for the accumulation of errors, a phenotype which is called microsatellite instability (MSI). The accumulation of errors in DNA sequences is thought to lead to mutations in cancer-related genes.
The four predominant mismatch repair genes include MLH1, MSH2, MSH 6, and PMS2. These genes may possess loss of function through a germline/inherited mechanism, such as Lynch syndrome, or can be sporadically acquired. Approximately 20%-30% of endometrial cancers exhibit MMR-d with acquired, sporadic losses in function being the majority of cases and only approximately 10% a result of Lynch syndrome. Mutations in PMS2 are the dominant genotype of Lynch syndrome, whereas loss of function in MLH1 is most frequent aberration in sporadic cases of MMR-d endometrial cancer.1
Endometrial cancers can be tested for MMR-d by performing immunohistochemistry to look for loss of expression in the four most common MMR genes. If there is loss of expression of MLH1, additional triage testing can be performed to determine if this loss is caused by the epigenetic phenomenon of hypermethylation. When present, this excludes Lynch syndrome and suggests a sporadic form origin of the disease. If there is loss of expression of the MMR genes (including loss of MLH1 and subsequent negative testing for promotor methylation), the patient should receive genetic testing for the presence of a germline mutation indicating Lynch syndrome. As an adjunct or alternative to immunohistochemistry, PCR studies or next-generation sequencing can be used to measure the presence of microsatellite instability in a process that identifies the expansion or reduction in repetitive DNA sequences of the tumor, compared with normal tumor.2
It is of the highest importance to identify endometrial cancers caused by Lynch syndrome because this enables providers to offer cascade testing of relatives, and to intensify screening or preventative measures for the many other cancers (such as colon, upper gastrointestinal, breast, and urothelial) for which these patients are at risk. Therefore, routine screening for MMR-d tumors is recommended in all cases of endometrial cancer, not simply those of a young age at diagnosis or for whom a strong family history exists.3 Using family history factors, primary tumor site, and age as a trigger for screening for Lynch syndrome, such as the Bethesda Guidelines, is associated with a 82% sensitivity in identifying Lynch syndrome. In a meta-analysis including testing results from 1,159 women with endometrial cancer, 43% of patients who were diagnosed with Lynch syndrome via molecular analysis would have been missed by clinical screening using Bethesda Guidelines.2
Discovering cases of Lynch syndrome is not the only benefit of routine testing for MMR-d in endometrial cancers. There is also significant value in the characterization of sporadic mismatch repair–deficient tumors because this information provides prognostic information and guides therapy. Tumors with a microsatellite-high phenotype/MMR-d were identified as one of the four distinct molecular subgroups of endometrial cancer by the Cancer Genome Atlas.4 Patients with this molecular profile exhibited “intermediate” prognostic outcomes, performing better than the “serous-like” cancers with p53 mutations, yet worse than patients with a POLE ultramutated group who rarely experience recurrences or death, even in the setting of unfavorable histology.
Beyond prognostication, the molecular profile of endometrial cancers also influence their responsiveness to therapeutics, highlighting the importance of splitting, not lumping endometrial cancers into relevant molecular subgroups when designing research and practicing clinical medicine. The PORTEC-3 trial studied 410 women with high-risk endometrial cancer, and randomized participants to receive either adjuvant radiation alone, or radiation with chemotherapy.5 There were no differences in progression-free survival between the two therapeutic strategies when analyzed in aggregate. However, when analyzed by Cancer Genome Atlas molecular subgroup, it was noted that there was a clear benefit from chemotherapy for patients with p53 mutations. For patients with MMR-d tumors, no such benefit was observed. Patients assigned this molecular subgroup did no better with the addition of platinum and taxane chemotherapy over radiation alone. Unfortunately, for patients with MMR-d tumors, recurrence rates remained high, suggesting that we can and need to discover more effective therapies for these tumors than what is available with conventional radiation or platinum and taxane chemotherapy. Targeted therapy may be the solution to this problem. Through microsatellite instability, MMR-d tumors create somatic mutations which result in neoantigens, an immunogenic environment. This state up-regulates checkpoint inhibitor proteins, which serve as an actionable target for anti-PD-L1 antibodies, such as the drug pembrolizumab which has been shown to be highly active against MMR-d endometrial cancer. In the landmark, KEYNOTE-158 trial, patients with advanced, recurrent solid tumors that exhibited MMR-d were treated with pembrolizumab.6 This included 49 patients with endometrial cancer, among whom there was a 79% response rate. Subsequently, pembrolizumab was granted Food and Drug Administration approval for use in advanced, recurrent MMR-d/MSI-high endometrial cancer. Trials are currently enrolling patients to explore the utility of this drug in the up-front setting in both early- and late-stage disease with a hope that this targeted therapy can do what conventional cytotoxic chemotherapy has failed to do.
Therefore, given the clinical significance of mismatch repair deficiency, all patients with endometrial cancer should be investigated for loss of expression in these proteins, and if present, considered for the possibility of Lynch syndrome. While most will not have an inherited cause, this information regarding their tumor biology remains critically important in both prognostication and decision-making surrounding other therapies and their eligibility for promising clinical trials.
Dr. Rossi is assistant professor in the division of gynecologic oncology at the University of North Carolina at Chapel Hill. She has no conflicts of interest to declare. Email her at obnews@mdedge.com.
References
1. Simpkins SB et al. Hum. Mol. Genet. 1999;8:661-6.
2. Kahn R et al. Cancer. 2019 Sep 15;125(18):2172-3183.
3. SGO Clinical Practice Statement: Screening for Lynch Syndrome in Endometrial Cancer. https://www.sgo.org/clinical-practice/guidelines/screening-for-lynch-syndrome-in-endometrial-cancer/
4. Kandoth et al. Nature. 2013;497(7447):67-73.
5. Leon-Castillo A et al. J Clin Oncol. 2020 Oct 10;38(29):3388-97.
6. Marabelle A et al. J Clin Oncol. 2020 Jan 1;38(1):1-10.
Lenvatinib Plus Pembrolizumab Improves Outcomes in Previously Untreated Advanced Clear Cell Renal Cell Carcinoma
Study Overview
Objective. To evaluate the efficacy and safety of lenvatinib in combination with everolimus or pembrolizumab compared with sunitinib alone for the treatment of newly diagnosed advanced clear cell renal cell carcinoma (ccRCC).
Design. Global, multicenter, randomized, open-label, phase 3 trial.
Intervention. Patients were randomized in a 1:1:1 ratio to receive treatment with 1 of 3 regimens: lenvatinib 20 mg daily plus pembrolizumab 200 mg on day 1 of each 21-day cycle; lenvatinib 18 mg daily plus everolimus 5 mg once daily for each 21-day cycle; or sunitinib 50 mg daily for 4 weeks followed by 2 weeks off. Patients were stratified according to geographic region and Memorial Sloan Kettering Cancer Center (MSKCC) prognostic risk group.
Setting and participants. A total of 1417 patients were screened, and 1069 patients underwent randomization between October 2016 and July 2019: 355 patients were randomized to the lenvatinib plus pembrolizumab group, 357 were randomized to the lenvatinib plus everolimus group, and 357 were randomized to the sunitinib alone group. The patients must have had a diagnosis of previously untreated advanced renal cell carcinoma with a clear-cell component. All the patients need to have a Karnofsky performance status of at least 70, adequate renal function, and controlled blood pressure with or without antihypertensive medications.
Main outcome measures. The primary endpoint assessed the progression-free survival (PFS) as evaluated by independent review committee using RECIST, version 1.1. Imaging was performed at the time of screening and every 8 weeks thereafter. Secondary endpoints were safety, overall survival (OS), and objective response rate as well as investigator-assessed PFS. Also, they assessed the duration of response. During the treatment period, the safety and adverse events were assessed up to 30 days from the last dose of the trial drug.
Main results. The baseline characteristics were well balanced between the treatment groups. More than 70% of enrolled participants were male. Approximately 60% of participants were MSKCC intermediate risk, 27% were favorable risk, and 9% were poor risk. Patients with a PD-L1 combined positive score of 1% or more represented 30% of the population. The remainder had a PD-L1 combined positive score of <1% (30%) or such data were not available (38%). Liver metastases were present in 17% of patients at baseline in each group, and 70% of patients had a prior nephrectomy. The data cutoff occurred in August 2020 for PFS and the median follow-up for OS was 26.6 months. Around 40% of the participants in the lenvatinib plus pembrolizumab group, 18.8% in the sunitinib group, and 31% in the lenvatinib plus everolimus group were still receiving trial treatment at data cutoff. The leading cause for discontinuing therapy was disease progression. Approximately 50% of patients in the lenvatinib/everolimus group and sunitinib group received subsequent checkpoint inhibitor therapy after progression.
The median PFS in the lenvatinib plus pembrolizumab group was significantly longer than in the sunitinib group, 23.9 months vs 9.2 months (hazard ratio [HR], 0.39; 95% CI, 0.32-0.49; P < 0.001). The median PFS was also significantly longer in the lenvatinib plus everolimus group compared with sunitinib, 14.7 vs 9.2 months (HR 0.65; 95% CI 0.53-0.80; P < 0.001). The PFS benefit favored the lenvatinib combination groups over sunitinib in all subgroups, including the MSKCC prognostic risk groups. The median OS was not reached with any treatment, with 79% of patients in the lenvatinib plus pembrolizumab group, 66% of patients in the lenvatinib plus everolimus group, and 70% in the sunitinib group still alive at 24 months. Survival was significantly longer in the lenvatinib plus pembrolizumab group compared with sunitinib (HR, 0.66; 95% CI, 0.49-0.88; P = 0.005). The OS favored lenvatinib/pembrolizumab over sunitinib in the PD-L1 positive or negative groups. The median duration of response in the lenvatinib plus pembrolizumab group was 25.8 months compared to 16.6 months and 14.6 months in the lenvatinib plus everolimus and sunitinib groups, respectively. Complete response rates were higher in the lenvatinib plus pembrolizumab group (16%) compared with lenvatinib/everolimus (9.8%) or sunitinib (4.2%). The median time to response was around 1.9 months in all 3 groups.
The most frequent adverse events seen in all groups were diarrhea, hypertension, fatigue, and nausea. Hypothyroidism was seen more frequently in the lenvatinib plus pembrolizumab group (47%). Grade 3 adverse events were seen in approximately 80% of patients in all groups. The most common grade 3 or higher adverse event was hypertension in all 3 groups. The median time for discontinuing treatment due to side effects was 8.97 months in the lenvatinib plus pembrolizumab arm, 5.49 months in the lenvatinib plus everolimus group, and 4.57 months in the sunitinib group. In the lenvatinib plus pembrolizumab group, 15 patients had grade 5 adverse events; 11 participants had fatal events not related to disease progression. In the lenvatinib plus everolimus group, there were 22 patients with grade 5 events, with 10 fatal events not related to disease progression. In the sunitinib group, 11 patients had grade 5 events, and only 2 fatal events were not linked to disease progression.
Conclusion. The combination of lenvatinib plus pembrolizumab significantly prolongs PFS and OS compared with sunitinib in patients with previously untreated and advanced ccRCC. The median OS has not yet been reached.
Commentary
The results of the current phase 3 CLEAR trial highlight the efficacy and safety of lenvatinib plus pembrolizumab as a first-line treatment in advanced ccRCC. This trial adds to the rapidly growing body of literature supporting the notion that the combination of anti-PD-1 based therapy with either CTLA-4 antibodies or VEGF receptor tyrosine kinase inhibitors (TKI) improves outcomes in previously untreated patients with advanced ccRCC. Previously presented data from Keynote-426 (pembrolizumab plus axitinib), Checkmate-214 (nivolumab plus ipilimumab), and Javelin Renal 101 (Avelumab plus axitinib) have also shown improved outcomes with combination therapy in the frontline setting.1-4 While the landscape of therapeutic options in the frontline setting continues to grow, there remains lack of clarity as to how to tailor our therapeutic decisions for specific patient populations. The exception would be nivolumab and ipilimumab, which are currently indicated for IMDC intermediate- or poor-risk patients.
The combination of VEGFR TKI therapy and PD-1 antibodies provides rapid disease control, with a median time to response in the current study of 1.9 months, and, generally speaking, a low risk of progression in the first 6 months of therapy. While cross-trial comparisons are always problematic, the PFS reported in this study and others with VEGFR TKI and PD-1 antibody combinations is quite impressive and surpasses that noted in Checkmate 214.3 While the median OS survival has not yet been reached, the long duration of PFS and complete response rate of 16% in this study certainly make this an attractive frontline option for newly diagnosed patients with advanced ccRCC. Longer follow-up is needed to confirm the survival benefit noted.
Applications for Clinical Practice
The current data support the use VEGFR TKI and anti-PD1 therapy in the frontline setting. How to choose between such combination regimens or combination immunotherapy remains unclear, and further biomarker-based assessments are needed to help guide therapeutic decisions for our patients.
1. Motzer, R, Alekseev B, Rha SY, et al. Lenvatinib plus pembrolizumab or everolimus for advanced renal cell carcinoma [published online ahead of print, 2021 Feb 13]. N Engl J Med. 2021;10.1056/NEJMoa2035716. doi:10.1056/NEJMoa2035716
2. Rini, BI, Plimack ER, Stus V, et al. Pembrolizumab plus axitinib versus sunitinib for advanced renal-cell carcinoma. N Engl J Med. 2019;380(12):1116-1127.
3. Motzer, RJ, Tannir NM, McDermott DF, et al. Nivolumab plus ipilimumab versus sunitinib in advanced renal-cell carcinoma. N Engl J Med. 2018;378(14):1277-1290.
4. Motzer, RJ, Penkov K, Haanen J, et al. Avelumab plus axitinib versus sunitinib for advanced renal-cell carcinoma. N Engl J Med. 2019;380(12):1103-1115.
Study Overview
Objective. To evaluate the efficacy and safety of lenvatinib in combination with everolimus or pembrolizumab compared with sunitinib alone for the treatment of newly diagnosed advanced clear cell renal cell carcinoma (ccRCC).
Design. Global, multicenter, randomized, open-label, phase 3 trial.
Intervention. Patients were randomized in a 1:1:1 ratio to receive treatment with 1 of 3 regimens: lenvatinib 20 mg daily plus pembrolizumab 200 mg on day 1 of each 21-day cycle; lenvatinib 18 mg daily plus everolimus 5 mg once daily for each 21-day cycle; or sunitinib 50 mg daily for 4 weeks followed by 2 weeks off. Patients were stratified according to geographic region and Memorial Sloan Kettering Cancer Center (MSKCC) prognostic risk group.
Setting and participants. A total of 1417 patients were screened, and 1069 patients underwent randomization between October 2016 and July 2019: 355 patients were randomized to the lenvatinib plus pembrolizumab group, 357 were randomized to the lenvatinib plus everolimus group, and 357 were randomized to the sunitinib alone group. The patients must have had a diagnosis of previously untreated advanced renal cell carcinoma with a clear-cell component. All the patients need to have a Karnofsky performance status of at least 70, adequate renal function, and controlled blood pressure with or without antihypertensive medications.
Main outcome measures. The primary endpoint assessed the progression-free survival (PFS) as evaluated by independent review committee using RECIST, version 1.1. Imaging was performed at the time of screening and every 8 weeks thereafter. Secondary endpoints were safety, overall survival (OS), and objective response rate as well as investigator-assessed PFS. Also, they assessed the duration of response. During the treatment period, the safety and adverse events were assessed up to 30 days from the last dose of the trial drug.
Main results. The baseline characteristics were well balanced between the treatment groups. More than 70% of enrolled participants were male. Approximately 60% of participants were MSKCC intermediate risk, 27% were favorable risk, and 9% were poor risk. Patients with a PD-L1 combined positive score of 1% or more represented 30% of the population. The remainder had a PD-L1 combined positive score of <1% (30%) or such data were not available (38%). Liver metastases were present in 17% of patients at baseline in each group, and 70% of patients had a prior nephrectomy. The data cutoff occurred in August 2020 for PFS and the median follow-up for OS was 26.6 months. Around 40% of the participants in the lenvatinib plus pembrolizumab group, 18.8% in the sunitinib group, and 31% in the lenvatinib plus everolimus group were still receiving trial treatment at data cutoff. The leading cause for discontinuing therapy was disease progression. Approximately 50% of patients in the lenvatinib/everolimus group and sunitinib group received subsequent checkpoint inhibitor therapy after progression.
The median PFS in the lenvatinib plus pembrolizumab group was significantly longer than in the sunitinib group, 23.9 months vs 9.2 months (hazard ratio [HR], 0.39; 95% CI, 0.32-0.49; P < 0.001). The median PFS was also significantly longer in the lenvatinib plus everolimus group compared with sunitinib, 14.7 vs 9.2 months (HR 0.65; 95% CI 0.53-0.80; P < 0.001). The PFS benefit favored the lenvatinib combination groups over sunitinib in all subgroups, including the MSKCC prognostic risk groups. The median OS was not reached with any treatment, with 79% of patients in the lenvatinib plus pembrolizumab group, 66% of patients in the lenvatinib plus everolimus group, and 70% in the sunitinib group still alive at 24 months. Survival was significantly longer in the lenvatinib plus pembrolizumab group compared with sunitinib (HR, 0.66; 95% CI, 0.49-0.88; P = 0.005). The OS favored lenvatinib/pembrolizumab over sunitinib in the PD-L1 positive or negative groups. The median duration of response in the lenvatinib plus pembrolizumab group was 25.8 months compared to 16.6 months and 14.6 months in the lenvatinib plus everolimus and sunitinib groups, respectively. Complete response rates were higher in the lenvatinib plus pembrolizumab group (16%) compared with lenvatinib/everolimus (9.8%) or sunitinib (4.2%). The median time to response was around 1.9 months in all 3 groups.
The most frequent adverse events seen in all groups were diarrhea, hypertension, fatigue, and nausea. Hypothyroidism was seen more frequently in the lenvatinib plus pembrolizumab group (47%). Grade 3 adverse events were seen in approximately 80% of patients in all groups. The most common grade 3 or higher adverse event was hypertension in all 3 groups. The median time for discontinuing treatment due to side effects was 8.97 months in the lenvatinib plus pembrolizumab arm, 5.49 months in the lenvatinib plus everolimus group, and 4.57 months in the sunitinib group. In the lenvatinib plus pembrolizumab group, 15 patients had grade 5 adverse events; 11 participants had fatal events not related to disease progression. In the lenvatinib plus everolimus group, there were 22 patients with grade 5 events, with 10 fatal events not related to disease progression. In the sunitinib group, 11 patients had grade 5 events, and only 2 fatal events were not linked to disease progression.
Conclusion. The combination of lenvatinib plus pembrolizumab significantly prolongs PFS and OS compared with sunitinib in patients with previously untreated and advanced ccRCC. The median OS has not yet been reached.
Commentary
The results of the current phase 3 CLEAR trial highlight the efficacy and safety of lenvatinib plus pembrolizumab as a first-line treatment in advanced ccRCC. This trial adds to the rapidly growing body of literature supporting the notion that the combination of anti-PD-1 based therapy with either CTLA-4 antibodies or VEGF receptor tyrosine kinase inhibitors (TKI) improves outcomes in previously untreated patients with advanced ccRCC. Previously presented data from Keynote-426 (pembrolizumab plus axitinib), Checkmate-214 (nivolumab plus ipilimumab), and Javelin Renal 101 (Avelumab plus axitinib) have also shown improved outcomes with combination therapy in the frontline setting.1-4 While the landscape of therapeutic options in the frontline setting continues to grow, there remains lack of clarity as to how to tailor our therapeutic decisions for specific patient populations. The exception would be nivolumab and ipilimumab, which are currently indicated for IMDC intermediate- or poor-risk patients.
The combination of VEGFR TKI therapy and PD-1 antibodies provides rapid disease control, with a median time to response in the current study of 1.9 months, and, generally speaking, a low risk of progression in the first 6 months of therapy. While cross-trial comparisons are always problematic, the PFS reported in this study and others with VEGFR TKI and PD-1 antibody combinations is quite impressive and surpasses that noted in Checkmate 214.3 While the median OS survival has not yet been reached, the long duration of PFS and complete response rate of 16% in this study certainly make this an attractive frontline option for newly diagnosed patients with advanced ccRCC. Longer follow-up is needed to confirm the survival benefit noted.
Applications for Clinical Practice
The current data support the use VEGFR TKI and anti-PD1 therapy in the frontline setting. How to choose between such combination regimens or combination immunotherapy remains unclear, and further biomarker-based assessments are needed to help guide therapeutic decisions for our patients.
1. Motzer, R, Alekseev B, Rha SY, et al. Lenvatinib plus pembrolizumab or everolimus for advanced renal cell carcinoma [published online ahead of print, 2021 Feb 13]. N Engl J Med. 2021;10.1056/NEJMoa2035716. doi:10.1056/NEJMoa2035716
2. Rini, BI, Plimack ER, Stus V, et al. Pembrolizumab plus axitinib versus sunitinib for advanced renal-cell carcinoma. N Engl J Med. 2019;380(12):1116-1127.
3. Motzer, RJ, Tannir NM, McDermott DF, et al. Nivolumab plus ipilimumab versus sunitinib in advanced renal-cell carcinoma. N Engl J Med. 2018;378(14):1277-1290.
4. Motzer, RJ, Penkov K, Haanen J, et al. Avelumab plus axitinib versus sunitinib for advanced renal-cell carcinoma. N Engl J Med. 2019;380(12):1103-1115.
Use of Fecal Immunochemical Testing in Acute Patient Care in a Safety Net Hospital System
From Baylor College of Medicine, Houston, TX (Drs. Spezia-Lindner, Montealegre, Muldrew, and Suarez) and Harris Health System, Houston, TX (Shanna L. Harris, Maria Daheri, and Drs. Muldrew and Suarez).
Abstract
Objective: To characterize and analyze the prevalence, indications for, and outcomes of fecal immunochemical testing (FIT) in acute patient care within a safety net health care system’s emergency departments (EDs) and inpatient settings.
Design: Retrospective cohort study derived from administrative data.
Setting: A large, urban, safety net health care delivery system in Texas. The data gathered were from the health care system’s 2 primary hospitals and their associated EDs. This health care system utilizes FIT exclusively for fecal occult blood testing.
Participants: Adults ≥18 years who underwent FIT in the ED or inpatient setting between August 2016 and March 2017. Chart review abstractions were performed on a sample (n = 382) from the larger subset.
Measurements: Primary data points included total FITs performed in acute patient care during the study period, basic demographic data, FIT indications, FIT result, receipt of invasive diagnostic follow-up, and result of invasive diagnostic follow-up. Multivariable log-binomial regression was used to calculate risk ratios (RRs) to assess the association between FIT result and receipt of diagnostic follow-up. Chi-square analysis was used to compare the proportion of abnormal findings on diagnostic follow-up by FIT result.
Results: During the 8-month study period, 2718 FITs were performed in the ED and inpatient setting, comprising 5.7% of system-wide FITs. Of the 382 patients included in the chart review who underwent acute care FIT, a majority had their test performed in the ED (304, 79.6%), 133 of which were positive (34.8%). The most common indication for FIT was evidence of overt gastrointestinal (GI) bleed (207, 54.2%), followed by anemia (84, 22.0%). While a positive FIT result was significantly associated with obtaining a diagnostic exam in multivariate analysis (RR, 1.72; P < 0.001), having signs of overt GI bleeding was a stronger predictor of diagnostic follow-up (RR, 2.00; P = 0.003). Of patients who underwent FIT and received diagnostic follow-up (n = 110), 48.2% were FIT negative. These patients were just as likely to have an abnormal finding as FIT-positive patients (90.6% vs 91.2%; P = 0.86). Of the 382 patients in the study, 4 (1.0%) were subsequently diagnosed with colorectal cancer (CRC). Of those 4 patients, 1 (25%) was FIT positive.
Conclusion: FIT is being utilized in acute patient care outside of its established indication for CRC screening in asymptomatic, average-risk adults. Our study demonstrates that FIT is not useful in acute patient care.
Keywords: FOBT; FIT; fecal immunochemical testing; inpatient.
Colorectal cancer (CRC) is the second leading cause of cancer-related mortality in the United States. It is estimated that in 2020, 147,950 individuals will be diagnosed with invasive CRC and 53,200 will die from it.1 While the overall incidence has been declining for decades, it is rising in young adults.2–4 Screening using direct visualization procedures (colonoscopy and sigmoidoscopy) and stool-based tests has been demonstrated to improve detection of precancerous and early cancerous lesions, thereby reducing CRC mortality.5 However, screening rates in the United States are suboptimal, with only 68.8% of adults aged 50 to 75 years screened according to guidelines in 2018.6Stool-based testing is a well-established and validated screening measure for CRC in asymptomatic individuals at average risk. Its widespread use in this population has been shown to cost-effectively screen for CRC among adults 50 years of age and older.5,7 Presently, the 2 most commonly used stool-based assays in the US health care system are guaiac-based tests (guaiac fecal occult blood test [gFOBT], Hemoccult) and
Despite the exclusive validation of FOBTs for use in CRC screening, studies have demonstrated that they are commonly used for a multitude of additional indications in emergency department (ED) and inpatient settings, most aimed at detecting or confirming GI blood loss. This may lead to inappropriate patient management, including the receipt of unnecessary follow-up procedures, which can incur significant costs to the patient and the health system.13-19 These costs may be particularly burdensome in safety net health systems (ie, those that offer access to care regardless of the patient’s ability to pay), which serve a large proportion of socioeconomically disadvantaged individuals in the United States.20,21 To our knowledge, no published study to date has specifically investigated the role of FIT in acute patient management.
This study characterizes the use of FIT in acute patient care within a large, urban, safety net health care system. Through a retrospective review of administrative data and patient charts, we evaluated FIT use prevalence, indications, and patient outcomes in the ED and inpatient settings.
Methods
Setting
This study was conducted in a large, urban, county-based integrated delivery system in Houston, Texas, that provides health care services to one of the largest uninsured and underinsured populations in the country.22 The health system includes 2 main hospitals and more than 20 ambulatory care clinics. Within its ambulatory care clinics, the health system implements a population-based screening strategy using stool-based testing. All adults aged 50 years or older who are due for FIT are identified through the health-maintenance module of the electronic medical record (EMR) and offered a take-home FIT. The health system utilizes FIT exclusively (OC-Light S FIT, Polymedco, Cortlandt Manor, NY); no guaiac-based assays are available.
Design and Data Collection
We began by using administrative records to determine the proportion of FITs conducted health system-wide that were ordered and completed in the acute care setting over the study period (August 2016-March 2017). Specifically, we used aggregate quality metric reports, which quantify the number of FITs conducted at each health system clinic and hospital each month, to calculate the proportion of FITs done in the ED and inpatient hospital setting.
We then conducted a retrospective cohort study of 382 adult patients who received FIT in the EDs and inpatient wards in both of the health system’s hospitals over the study period. All data were collected by retrospective chart review in Epic (Madison, WI) EMRs. Sampling was performed by selecting the medical record numbers corresponding to the first 50 completed FITs chronologically each month over the 8-month period, with a total of 400 charts reviewed.
Data collected included basic patient demographics, location of FIT ordering (ED vs inpatient), primary service ordering FIT, FIT indication, FIT result, and receipt and results of invasive diagnostic follow-up. Demographics collected included age, biological sex, race (self-selected), and insurance coverage.
FIT indication was determined based on resident or attending physician notes. The history of present illness, physical exam, and assessment and plan section of notes were reviewed by the lead author for a specific statement of indication for FIT or for evidence of clinical presentation for which FIT could reasonably be ordered. Indications were iteratively reviewed and collapsed into 6 different categories: anemia, iron deficiency with or without anemia, overt GIB, suspected GIB/miscellaneous, non-bloody diarrhea, and no indication identified. Overt GIB was defined as reported or witnessed hematemesis, coffee-ground emesis, hematochezia, bright red blood per rectum, or melena irrespective of time frame (current or remote) or chronicity (acute, subacute, or chronic). In cases where signs of overt bleed were not witnessed by medical professionals, determination of conditions such as melena or coffee-ground emesis were made based on health care providers’ assessment of patient history as documented in his or her notes. Suspected GIB/miscellaneous was defined with the following parameters: any new drop in hemoglobin, abdominal pain, anorectal pain, non-bloody vomiting, hemoptysis, isolated rising blood urea nitrogen, or patient noticing blood on self, clothing, or in the commode without an identified source. Patients who were anemic and found to have iron deficiency on recent lab studies (within 6 months) were reflexively categorized into iron deficiency with or without anemia as opposed to the “anemia” category, which was comprised of any anemia without recent iron studies or non-iron deficient anemia. FIT result was determined by test result entry in Epic, with results either reading positive or negative.
Diagnostic follow-up, for our purposes, was defined as receipt of an invasive procedure or surgery, including esophagogastroduodenoscopy (EGD), colonoscopy, flexible sigmoidoscopy, diagnostic and/or therapeutic abdominal surgical intervention, or any combination of these. Results of diagnostic follow-up were coded as normal or abnormal. A normal result was determined if all procedures performed were listed as normal or as “no pathological findings” on the operative or endoscopic report. Any reported pathologic findings on the operative/endoscopic report were coded as abnormal.
Statistical Analysis
Proportions were used to describe demographic characteristics of patients who received a FIT in acute hospital settings. Bivariable tables and Chi-square tests were used to compare indications and outcomes for FIT-positive and FIT-negative patients. The association between receipt of an invasive diagnostic follow-up (outcome) and the results of an inpatient FIT (predictor) was assessed using multivariable log-binomial regression to calculate risk ratios (RRs) and corresponding 95% confidence intervals. Log-binomial regression was used over logistic regression given that adjusted odds ratios generated by logistic regression often overestimate the association between the risk factor and the outcome when the outcome is common,23 as in the case of diagnostic follow-up. The model was adjusted for variables selected a priori, specifically, age, gender, and FIT indication. Chi-square analysis was used to compare the proportion of abnormal findings on diagnostic follow-up by FIT result (negative vs positive).
Results
During the 8-month study period, there were 2718 FITs ordered and completed in the acute care setting, compared to 44,662 FITs ordered and completed in the outpatient setting (5.7% performed during acute care).
Among the 400 charts reviewed, 7 were excluded from the analysis because they were duplicates from the same patient, and 11 were excluded due to insufficient information in the patient’s medical record, resulting in 382 patients included in the analysis. Patient demographic characteristics are described in Table 1. Patients were predominantly Hispanic/Latino or Black/African American (51.0% and 32.5%, respectively), a majority had insurance through the county health system (50.5%), and most were male (58.1%). The average age of those receiving FIT was 52 years (standard deviation, 14.8 years), with 40.8% being under the age of 50. For a majority of patients, FIT was ordered in the ED by emergency medicine providers (79.8%). The remaining FITs were ordered by providers in 12 different inpatient departments. Of the FITs ordered, 35.1% were positive.

Indications for ordering FIT are listed in Table 2. The largest proportion of FITs were ordered for overt signs of GIB (54.2%), followed by anemia (22.0%), suspected GIB/miscellaneous reasons (12.3%), iron deficiency with or without anemia (7.6%), and non-bloody diarrhea (2.1%). In 1.8% of cases, no indication for FIT was found in the EMR. No FITs were ordered for the indication of CRC detection. Of these indication categories, overt GIB yielded the highest percentage of FIT positive results (44.0%), and non-bloody diarrhea yielded the lowest (0%).

A total of 110 patients (28.7%) underwent FIT and received invasive diagnostic follow-up. Of these 110 patients, 57 (51.8%) underwent EGD (2 of whom had further surgical intervention), 21 (19.1%) underwent colonoscopy (1 of whom had further surgical intervention), 25 (22.7%) underwent dual EGD and colonoscopy, 1 (0.9%) underwent flexible sigmoidoscopy, and 6 (5.5%) directly underwent abdominal surgical intervention. There was a significantly higher rate of diagnostic follow-up for FIT-positive vs FIT-negative patients (42.9% vs 21.3%; P < 0.001). However, of the 110 patients who underwent subsequent diagnostic follow-up, 48.2% were FIT negative. FIT-negative patients who received diagnostic follow-up were just as likely to have an abnormal finding as FIT-positive patients (90.6% vs 91.2%; P = 0.86).
Of the 382 patients in the study, 4 were diagnosed with CRC through diagnostic follow-up (1.0%). Of those 4 patients, 1 was FIT positive.
The results of the multivariable analyses to evaluate predictors of diagnostic colonoscopy are described in Table 3. Variables in the final model were FITresult, age, and FIT indication. After adjusting for other variables in the model, receipt of diagnostic follow-up was significantly associated with having a positive FIT (adjusted RR, 1.72; P < 0.001) and an overt GIB as an indication (adjusted RR, 2.00; P < 0.01).

Discussion
During the time frame of our study, 5.7% of all FITs ordered within our health system were ordered in the acute patient care setting at our hospitals. The most common indication was overt GIB, which was the indication for 54.2% of patients. Of note, none of the FITs ordered in the acute patient care setting were ordered for CRC screening. These findings support the evidence in the literature that stool-based screening tests, including FIT, are commonly used in US health care systems for diagnostic purposes and risk stratification in acute patient care to detect GIBs.13-18
Our data suggest that FIT was not a clinically useful test in determining a patient’s need for diagnostic follow-up. While having a positive FIT was significantly associated with obtaining a diagnostic exam in multivariate analysis (RR, 1.72), having signs of overt GI bleeding was a stronger predictor of diagnostic follow-up (RR, 2.00). This salient finding is evidence that a thorough clinical history and physical exam may more strongly predict whether a patient will undergo endoscopy or other follow-up than a FIT result. These findings support other studies in the literature that have called into question the utility of FOBTs in these acute settings.13-19 Under such circumstances, FOBTs have been shown to rarely influence patient management and thus represent an unnecessary expense.13–17 Additionally, in some cases, FOBT use in these settings may negatively affect patient outcomes. Such adverse effects include delaying treatment until results are returned or obfuscating indicated management with the results (eg, a patient with indications for colonoscopy not being referred due to a negative FOBT).13,14,17
We found that, for patients who subsequently went on to have diagnostic follow-up (most commonly endoscopy), there was no difference in the likelihood of FIT-positive and FIT-negative patients to have an abnormality discovered (91.2% vs 90.6%; P = 0.86). This analysis demonstrates no post-hoc support for FIT positivity as a predictor of presence of pathology in patients who were discriminately selected for diagnostic follow-up on clinical grounds by gastroenterologists and surgeons. It does, however, further support that clinical judgment about the need for diagnostic follow-up—irrespective of FIT result—has a very high yield for discovery of pathology in the acute setting.
There are multiple reasons why FOBTs, and specifically FIT, contribute little in management decisions for patients with suspected GI blood loss. Use of FIT raises concern for both false-negatives and false-positives when used outside of its indication. Regarding false- negatives, FIT is an unreliable test for detection of blood loss from the upper GI tract. As FITs utilize antibodies to detect the presence of globin, a byproduct of red blood cell breakdown, it is expected that FIT would fail to detect many cases of upper GI bleeding, as globin is broken down in the upper GI tract.24 This fact is part of what has made FIT a more effective CRC screening test than its guaiac-based counterparts—it has greater specificity for lower GI tract blood loss compared to tests relying on detection of heme.8 While guaiac-based assays like Hemoccult have also been shown to be poor tests in acute patient care, they may more frequently, though still unreliably, detect blood of upper GI origin. We believe that part of the ongoing use of FIT in patients with a suspected upper GIB may be from lack of understanding among providers on the mechanistic difference between gFOBTs and FITs, even though gFOBTs also yield highly unreliable results.
FIT does not have the same risk of false-positive results that guaiac-based tests have, which can yield positive results with extra-intestinal blood ingestion, aspirin, or alcohol use; insignificant GI bleeding; and consumption of peroxidase-containing foods.13,17,25 However, from a clinical standpoint, there are several scenarios of insignificant bleeding that would yield a positive FIT result, such as hemorrhoids, which are common in the US population.26,27 Additionally, in the ED, where most FITs were performed in our study, it is possible that samples for FITs are being obtained via digital rectal exam (DRE) given patients’ acuity of medical conditions and time constraints. However, FIT has been validated when using a formed stool sample. Obtaining FIT via DRE may lead to microtrauma to the rectum, which could hypothetically yield a positive FIT.
Strengths of this study include its use of in-depth chart data on a large number of FIT-positive patients, which allowed us to discern indications, outcomes, and other clinical data that may have influenced clinical decision-making. Additionally, whereas other studies that address FOBT use in acute patient care have focused on guaiac-based assays, our findings regarding the lack of utility of FIT are novel and have particular relevance as FITs continue to grow in popularity. Nonetheless, there are certain limitations future research should seek to address. In this study, the diagnostic follow-up result was coded by presence or absence of pathologic findings but did not qualify findings by severity or attempt to determine whether the pathology noted on diagnostic follow-up was the definitive source of the suspected GI bleed. These variables could help determine whether there was a difference in severity of bleeding between FIT-positive and FIT-negative patients and could potentially be studied with a prospective research design. Our own study was not designed to address the question of whether FIT result informs patient management decisions. To answer this directly, interviews would have to be conducted with those making the follow-up decision (ie, endoscopists and surgeons). Additionally, this study was not adequately powered to make determinations on the efficacy of FIT in the acute care setting for detection of CRC. As mentioned, only 1 of the 4 patients (25%) who went on to be diagnosed with CRC on follow-up was initially FIT-positive. This would require further investigation.
Conclusion
FIT is being utilized for diagnostic purposes in the acute care of symptomatic patients, which is a misuse of an established screening test for CRC. While our study was not designed to answer whether and how often a FIT result informs subsequent patient management, our results indicate that FIT is an ineffective diagnostic and risk-stratification tool when used in the acute care setting. Our findings add to existing evidence that indicates FOBTs should not be used in acute patient care.
Taken as a whole, the results of our study add to a growing body of evidence demonstrating no role for FOBTs, and specifically FIT, in acute patient care. In light of this evidence, some health care systems have already demonstrated success with system-wide disinvestment from the test in acute patient care settings, with one group publishing about their disinvestment process.28 After completion of our study, our preliminary data were presented to leadership from the internal medicine, emergency medicine, and laboratory divisions within our health care delivery system to galvanize complete disinvestment of FIT from acute care at our hospitals, a policy that was put into effect in July 2019.
Corresponding author: Nathaniel J. Spezia-Lindner, MD, Baylor College of Medicine, 7200 Cambridge St, BCM 903, Ste A10.197, Houston, TX 77030; speziali@bcm.edu.
Financial disclosures: None.
Funding: Cancer Prevention and Research Institute of Texas, CPRIT (PP170094, PDs: ML Jibaja-Weiss and JR Montealegre).
1. Siegel RL, Miller KD, Jemal A. Cancer statistics, 2020. 10.1CA Cancer 10.1J Clin. 2020;70(1):7-30.
2. Howlader NN, Noone AM, Krapcho M, et al. SEER cancer statistics review, 1975-2014. National Cancer Institute; 2017:1-2.
3. Siegel RL, Fedewa SA, Anderson WF, et al. Colorectal cancer incidence patterns in the United States, 1974–2013. 10.1J Natl Cancer Inst. 2017;109(8):djw322.
4. Bailey CE, Hu CY, You YN, et al. Increasing disparities in the age-related incidences of colon and rectal cancers in the United States, 1975-2010. 10.25JAMA Surg. 2015;150(1):17-22.
5. Lin JS, Piper MA, Perdue LA, et al. Screening for colorectal cancer: updated evidence report and systematic review for the US Preventive Services Task Force. 10.25JAMA. 2016;315(23):2576-2594.
6. Centers for Disease Control and Prevention (CDC). Use of colorectal cancer screening tests. Behavioral Risk Factor Surveillance System. October 22, 2019. Accessed February 10, 2021. https://www.cdc.gov/cancer/colorectal/statistics/use-screening-tests-BRFSS.htm
7. Hewitson P, Glasziou PP, Irwig L, et al. Screening for colorectal cancer using the fecal occult blood test, Hemoccult. 10.25Cochrane Database Syst Rev. 2007;2007(1):CD001216.
8. Bujanda L, Lanas Á, Quintero E, et al. Effect of aspirin and antiplatelet drugs on the outcome of the fecal immunochemical test. 10.25Mayo Clin Proc. 2013;88(7):683-689.
9. Allison JE, Sakoda LC, Levin TR, et al. Screening for colorectal neoplasms with new fecal occult blood tests: update on performance characteristics. 10.25J Natl Cancer Inst. 2007;99(19):1462-1470.
10. Dancourt V, Lejeune C, Lepage C, et al. Immunochemical faecal occult blood tests are superior to guaiac-based tests for the detection of colorectal neoplasms. 10.25Eur J Cancer. 2008;44(15):2254-2258.
11. Hol L, Wilschut JA, van Ballegooijen M, et al. Screening for colorectal cancer: random comparison of guaiac and immunochemical faecal occult blood testing at different cut-off levels. 10.25Br J Cancer. 2009;100(7):1103-1110.
12. Levi Z, Birkenfeld S, Vilkin A, et al. A higher detection rate for colorectal cancer and advanced adenomatous polyp for screening with immunochemical fecal occult blood test than guaiac fecal occult blood test, despite lower compliance rate. A prospective, controlled, feasibility study. Int J Cancer. 2011;128(10):2415-2424.
13. Friedman A, Chan A, Chin LC, et al. Use and abuse of faecal occult blood tests in an acute hospital inpatient setting. Intern Med J. 2010;40(2):107-111.
14. Narula N, Ulic D, Al-Dabbagh R, et al. Fecal occult blood testing as a diagnostic test in symptomatic patients is not useful: a retrospective chart review. Can J Gastroenterol Hepatol. 2014;28(8):421-426.
15. Ip S, Sokoro AA, Kaita L, et al. Use of fecal occult blood testing in hospitalized patients: results of an audit. Can J Gastroenterol Hepatol. 2014;28(9):489-494.
16. Mosadeghi S, Ren H, Catungal J, et al. Utilization of fecal occult blood test in the acute hospital setting and its impact on clinical management and outcomes. J Postgrad Med. 2016;62(2):91-95.
17. van Rijn AF, Stroobants AK, Deutekom M, et al. Inappropriate use of the faecal occult blood test in a university hospital in the Netherlands. Eur J Gastroenterol Hepatol. 2012;24(11):1266-1269.
18. Sharma VK, Komanduri S, Nayyar S, et al. An audit of the utility of in-patient fecal occult blood testing. Am J Gastroenterol. 2001;96(4):1256-1260.
19. Chiang TH, Lee YC, Tu CH, et al. Performance of the immunochemical fecal occult blood test in predicting lesions in the lower gastrointestinal tract. CMAJ. 2011;183(13):1474-1481.
20. Chokshi DA, Chang JE, Wilson RM. Health reform and the changing safety net in the United States. N Engl J Med. 2016;375(18):1790-1796.
21. Nguyen OK, Makam AN, Halm EA. National use of safety net clinics for primary care among adults with non-Medicaid insurance in the United States. PLoS One. 2016;11(3):e0151610.
22. United States Census Bureau. American Community Survey. Selected Economic Characteristics. 2019. Accessed February 20, 2021. https://data.census.gov/cedsci/table?q=ACSDP1Y2019.DP03%20Texas&g=0400000US48&tid=ACSDP1Y2019.DP03&hidePreview=true
23. McNutt LA, Wu C, Xue X, et al. Estimating the relative risk in cohort studies and clinical trials of common outcomes. Am J Epidemiol. 2003;157(10):940-943.
24. Rockey DC. Occult gastrointestinal bleeding. Gastroenterol Clin North Am. 2005;34(4):699-718.
25. Macrae FA, St John DJ. Relationship between patterns of bleeding and Hemoccult sensitivity in patients with colorectal cancers or adenomas. Gastroenterology. 1982;82(5 pt 1):891-898.
26. Johanson JF, Sonnenberg A. The prevalence of hemorrhoids and chronic constipation: an epidemiologic study. Gastroenterology. 1990;98(2):380-386.
27. Fleming JL, Ahlquist DA, McGill DB, et al. Influence of aspirin and ethanol on fecal blood levels as determined by using the HemoQuant assay. Mayo Clin Proc. 1987;62(3):159-163.
28. Gupta A, Tang Z, Agrawal D. Eliminating in-hospital fecal occult blood testing: our experience with disinvestment. Am J Med. 2018;131(7):760-763.
From Baylor College of Medicine, Houston, TX (Drs. Spezia-Lindner, Montealegre, Muldrew, and Suarez) and Harris Health System, Houston, TX (Shanna L. Harris, Maria Daheri, and Drs. Muldrew and Suarez).
Abstract
Objective: To characterize and analyze the prevalence, indications for, and outcomes of fecal immunochemical testing (FIT) in acute patient care within a safety net health care system’s emergency departments (EDs) and inpatient settings.
Design: Retrospective cohort study derived from administrative data.
Setting: A large, urban, safety net health care delivery system in Texas. The data gathered were from the health care system’s 2 primary hospitals and their associated EDs. This health care system utilizes FIT exclusively for fecal occult blood testing.
Participants: Adults ≥18 years who underwent FIT in the ED or inpatient setting between August 2016 and March 2017. Chart review abstractions were performed on a sample (n = 382) from the larger subset.
Measurements: Primary data points included total FITs performed in acute patient care during the study period, basic demographic data, FIT indications, FIT result, receipt of invasive diagnostic follow-up, and result of invasive diagnostic follow-up. Multivariable log-binomial regression was used to calculate risk ratios (RRs) to assess the association between FIT result and receipt of diagnostic follow-up. Chi-square analysis was used to compare the proportion of abnormal findings on diagnostic follow-up by FIT result.
Results: During the 8-month study period, 2718 FITs were performed in the ED and inpatient setting, comprising 5.7% of system-wide FITs. Of the 382 patients included in the chart review who underwent acute care FIT, a majority had their test performed in the ED (304, 79.6%), 133 of which were positive (34.8%). The most common indication for FIT was evidence of overt gastrointestinal (GI) bleed (207, 54.2%), followed by anemia (84, 22.0%). While a positive FIT result was significantly associated with obtaining a diagnostic exam in multivariate analysis (RR, 1.72; P < 0.001), having signs of overt GI bleeding was a stronger predictor of diagnostic follow-up (RR, 2.00; P = 0.003). Of patients who underwent FIT and received diagnostic follow-up (n = 110), 48.2% were FIT negative. These patients were just as likely to have an abnormal finding as FIT-positive patients (90.6% vs 91.2%; P = 0.86). Of the 382 patients in the study, 4 (1.0%) were subsequently diagnosed with colorectal cancer (CRC). Of those 4 patients, 1 (25%) was FIT positive.
Conclusion: FIT is being utilized in acute patient care outside of its established indication for CRC screening in asymptomatic, average-risk adults. Our study demonstrates that FIT is not useful in acute patient care.
Keywords: FOBT; FIT; fecal immunochemical testing; inpatient.
Colorectal cancer (CRC) is the second leading cause of cancer-related mortality in the United States. It is estimated that in 2020, 147,950 individuals will be diagnosed with invasive CRC and 53,200 will die from it.1 While the overall incidence has been declining for decades, it is rising in young adults.2–4 Screening using direct visualization procedures (colonoscopy and sigmoidoscopy) and stool-based tests has been demonstrated to improve detection of precancerous and early cancerous lesions, thereby reducing CRC mortality.5 However, screening rates in the United States are suboptimal, with only 68.8% of adults aged 50 to 75 years screened according to guidelines in 2018.6Stool-based testing is a well-established and validated screening measure for CRC in asymptomatic individuals at average risk. Its widespread use in this population has been shown to cost-effectively screen for CRC among adults 50 years of age and older.5,7 Presently, the 2 most commonly used stool-based assays in the US health care system are guaiac-based tests (guaiac fecal occult blood test [gFOBT], Hemoccult) and
Despite the exclusive validation of FOBTs for use in CRC screening, studies have demonstrated that they are commonly used for a multitude of additional indications in emergency department (ED) and inpatient settings, most aimed at detecting or confirming GI blood loss. This may lead to inappropriate patient management, including the receipt of unnecessary follow-up procedures, which can incur significant costs to the patient and the health system.13-19 These costs may be particularly burdensome in safety net health systems (ie, those that offer access to care regardless of the patient’s ability to pay), which serve a large proportion of socioeconomically disadvantaged individuals in the United States.20,21 To our knowledge, no published study to date has specifically investigated the role of FIT in acute patient management.
This study characterizes the use of FIT in acute patient care within a large, urban, safety net health care system. Through a retrospective review of administrative data and patient charts, we evaluated FIT use prevalence, indications, and patient outcomes in the ED and inpatient settings.
Methods
Setting
This study was conducted in a large, urban, county-based integrated delivery system in Houston, Texas, that provides health care services to one of the largest uninsured and underinsured populations in the country.22 The health system includes 2 main hospitals and more than 20 ambulatory care clinics. Within its ambulatory care clinics, the health system implements a population-based screening strategy using stool-based testing. All adults aged 50 years or older who are due for FIT are identified through the health-maintenance module of the electronic medical record (EMR) and offered a take-home FIT. The health system utilizes FIT exclusively (OC-Light S FIT, Polymedco, Cortlandt Manor, NY); no guaiac-based assays are available.
Design and Data Collection
We began by using administrative records to determine the proportion of FITs conducted health system-wide that were ordered and completed in the acute care setting over the study period (August 2016-March 2017). Specifically, we used aggregate quality metric reports, which quantify the number of FITs conducted at each health system clinic and hospital each month, to calculate the proportion of FITs done in the ED and inpatient hospital setting.
We then conducted a retrospective cohort study of 382 adult patients who received FIT in the EDs and inpatient wards in both of the health system’s hospitals over the study period. All data were collected by retrospective chart review in Epic (Madison, WI) EMRs. Sampling was performed by selecting the medical record numbers corresponding to the first 50 completed FITs chronologically each month over the 8-month period, with a total of 400 charts reviewed.
Data collected included basic patient demographics, location of FIT ordering (ED vs inpatient), primary service ordering FIT, FIT indication, FIT result, and receipt and results of invasive diagnostic follow-up. Demographics collected included age, biological sex, race (self-selected), and insurance coverage.
FIT indication was determined based on resident or attending physician notes. The history of present illness, physical exam, and assessment and plan section of notes were reviewed by the lead author for a specific statement of indication for FIT or for evidence of clinical presentation for which FIT could reasonably be ordered. Indications were iteratively reviewed and collapsed into 6 different categories: anemia, iron deficiency with or without anemia, overt GIB, suspected GIB/miscellaneous, non-bloody diarrhea, and no indication identified. Overt GIB was defined as reported or witnessed hematemesis, coffee-ground emesis, hematochezia, bright red blood per rectum, or melena irrespective of time frame (current or remote) or chronicity (acute, subacute, or chronic). In cases where signs of overt bleed were not witnessed by medical professionals, determination of conditions such as melena or coffee-ground emesis were made based on health care providers’ assessment of patient history as documented in his or her notes. Suspected GIB/miscellaneous was defined with the following parameters: any new drop in hemoglobin, abdominal pain, anorectal pain, non-bloody vomiting, hemoptysis, isolated rising blood urea nitrogen, or patient noticing blood on self, clothing, or in the commode without an identified source. Patients who were anemic and found to have iron deficiency on recent lab studies (within 6 months) were reflexively categorized into iron deficiency with or without anemia as opposed to the “anemia” category, which was comprised of any anemia without recent iron studies or non-iron deficient anemia. FIT result was determined by test result entry in Epic, with results either reading positive or negative.
Diagnostic follow-up, for our purposes, was defined as receipt of an invasive procedure or surgery, including esophagogastroduodenoscopy (EGD), colonoscopy, flexible sigmoidoscopy, diagnostic and/or therapeutic abdominal surgical intervention, or any combination of these. Results of diagnostic follow-up were coded as normal or abnormal. A normal result was determined if all procedures performed were listed as normal or as “no pathological findings” on the operative or endoscopic report. Any reported pathologic findings on the operative/endoscopic report were coded as abnormal.
Statistical Analysis
Proportions were used to describe demographic characteristics of patients who received a FIT in acute hospital settings. Bivariable tables and Chi-square tests were used to compare indications and outcomes for FIT-positive and FIT-negative patients. The association between receipt of an invasive diagnostic follow-up (outcome) and the results of an inpatient FIT (predictor) was assessed using multivariable log-binomial regression to calculate risk ratios (RRs) and corresponding 95% confidence intervals. Log-binomial regression was used over logistic regression given that adjusted odds ratios generated by logistic regression often overestimate the association between the risk factor and the outcome when the outcome is common,23 as in the case of diagnostic follow-up. The model was adjusted for variables selected a priori, specifically, age, gender, and FIT indication. Chi-square analysis was used to compare the proportion of abnormal findings on diagnostic follow-up by FIT result (negative vs positive).
Results
During the 8-month study period, there were 2718 FITs ordered and completed in the acute care setting, compared to 44,662 FITs ordered and completed in the outpatient setting (5.7% performed during acute care).
Among the 400 charts reviewed, 7 were excluded from the analysis because they were duplicates from the same patient, and 11 were excluded due to insufficient information in the patient’s medical record, resulting in 382 patients included in the analysis. Patient demographic characteristics are described in Table 1. Patients were predominantly Hispanic/Latino or Black/African American (51.0% and 32.5%, respectively), a majority had insurance through the county health system (50.5%), and most were male (58.1%). The average age of those receiving FIT was 52 years (standard deviation, 14.8 years), with 40.8% being under the age of 50. For a majority of patients, FIT was ordered in the ED by emergency medicine providers (79.8%). The remaining FITs were ordered by providers in 12 different inpatient departments. Of the FITs ordered, 35.1% were positive.
Indications for ordering FIT are listed in Table 2. The largest proportion of FITs were ordered for overt signs of GIB (54.2%), followed by anemia (22.0%), suspected GIB/miscellaneous reasons (12.3%), iron deficiency with or without anemia (7.6%), and non-bloody diarrhea (2.1%). In 1.8% of cases, no indication for FIT was found in the EMR. No FITs were ordered for the indication of CRC detection. Of these indication categories, overt GIB yielded the highest percentage of FIT positive results (44.0%), and non-bloody diarrhea yielded the lowest (0%).
A total of 110 patients (28.7%) underwent FIT and received invasive diagnostic follow-up. Of these 110 patients, 57 (51.8%) underwent EGD (2 of whom had further surgical intervention), 21 (19.1%) underwent colonoscopy (1 of whom had further surgical intervention), 25 (22.7%) underwent dual EGD and colonoscopy, 1 (0.9%) underwent flexible sigmoidoscopy, and 6 (5.5%) directly underwent abdominal surgical intervention. There was a significantly higher rate of diagnostic follow-up for FIT-positive vs FIT-negative patients (42.9% vs 21.3%; P < 0.001). However, of the 110 patients who underwent subsequent diagnostic follow-up, 48.2% were FIT negative. FIT-negative patients who received diagnostic follow-up were just as likely to have an abnormal finding as FIT-positive patients (90.6% vs 91.2%; P = 0.86).
Of the 382 patients in the study, 4 were diagnosed with CRC through diagnostic follow-up (1.0%). Of those 4 patients, 1 was FIT positive.
The results of the multivariable analyses to evaluate predictors of diagnostic colonoscopy are described in Table 3. Variables in the final model were FITresult, age, and FIT indication. After adjusting for other variables in the model, receipt of diagnostic follow-up was significantly associated with having a positive FIT (adjusted RR, 1.72; P < 0.001) and an overt GIB as an indication (adjusted RR, 2.00; P < 0.01).
Discussion
During the time frame of our study, 5.7% of all FITs ordered within our health system were ordered in the acute patient care setting at our hospitals. The most common indication was overt GIB, which was the indication for 54.2% of patients. Of note, none of the FITs ordered in the acute patient care setting were ordered for CRC screening. These findings support the evidence in the literature that stool-based screening tests, including FIT, are commonly used in US health care systems for diagnostic purposes and risk stratification in acute patient care to detect GIBs.13-18
Our data suggest that FIT was not a clinically useful test in determining a patient’s need for diagnostic follow-up. While having a positive FIT was significantly associated with obtaining a diagnostic exam in multivariate analysis (RR, 1.72), having signs of overt GI bleeding was a stronger predictor of diagnostic follow-up (RR, 2.00). This salient finding is evidence that a thorough clinical history and physical exam may more strongly predict whether a patient will undergo endoscopy or other follow-up than a FIT result. These findings support other studies in the literature that have called into question the utility of FOBTs in these acute settings.13-19 Under such circumstances, FOBTs have been shown to rarely influence patient management and thus represent an unnecessary expense.13–17 Additionally, in some cases, FOBT use in these settings may negatively affect patient outcomes. Such adverse effects include delaying treatment until results are returned or obfuscating indicated management with the results (eg, a patient with indications for colonoscopy not being referred due to a negative FOBT).13,14,17
We found that, for patients who subsequently went on to have diagnostic follow-up (most commonly endoscopy), there was no difference in the likelihood of FIT-positive and FIT-negative patients to have an abnormality discovered (91.2% vs 90.6%; P = 0.86). This analysis demonstrates no post-hoc support for FIT positivity as a predictor of presence of pathology in patients who were discriminately selected for diagnostic follow-up on clinical grounds by gastroenterologists and surgeons. It does, however, further support that clinical judgment about the need for diagnostic follow-up—irrespective of FIT result—has a very high yield for discovery of pathology in the acute setting.
There are multiple reasons why FOBTs, and specifically FIT, contribute little in management decisions for patients with suspected GI blood loss. Use of FIT raises concern for both false-negatives and false-positives when used outside of its indication. Regarding false- negatives, FIT is an unreliable test for detection of blood loss from the upper GI tract. As FITs utilize antibodies to detect the presence of globin, a byproduct of red blood cell breakdown, it is expected that FIT would fail to detect many cases of upper GI bleeding, as globin is broken down in the upper GI tract.24 This fact is part of what has made FIT a more effective CRC screening test than its guaiac-based counterparts—it has greater specificity for lower GI tract blood loss compared to tests relying on detection of heme.8 While guaiac-based assays like Hemoccult have also been shown to be poor tests in acute patient care, they may more frequently, though still unreliably, detect blood of upper GI origin. We believe that part of the ongoing use of FIT in patients with a suspected upper GIB may be from lack of understanding among providers on the mechanistic difference between gFOBTs and FITs, even though gFOBTs also yield highly unreliable results.
FIT does not have the same risk of false-positive results that guaiac-based tests have, which can yield positive results with extra-intestinal blood ingestion, aspirin, or alcohol use; insignificant GI bleeding; and consumption of peroxidase-containing foods.13,17,25 However, from a clinical standpoint, there are several scenarios of insignificant bleeding that would yield a positive FIT result, such as hemorrhoids, which are common in the US population.26,27 Additionally, in the ED, where most FITs were performed in our study, it is possible that samples for FITs are being obtained via digital rectal exam (DRE) given patients’ acuity of medical conditions and time constraints. However, FIT has been validated when using a formed stool sample. Obtaining FIT via DRE may lead to microtrauma to the rectum, which could hypothetically yield a positive FIT.
Strengths of this study include its use of in-depth chart data on a large number of FIT-positive patients, which allowed us to discern indications, outcomes, and other clinical data that may have influenced clinical decision-making. Additionally, whereas other studies that address FOBT use in acute patient care have focused on guaiac-based assays, our findings regarding the lack of utility of FIT are novel and have particular relevance as FITs continue to grow in popularity. Nonetheless, there are certain limitations future research should seek to address. In this study, the diagnostic follow-up result was coded by presence or absence of pathologic findings but did not qualify findings by severity or attempt to determine whether the pathology noted on diagnostic follow-up was the definitive source of the suspected GI bleed. These variables could help determine whether there was a difference in severity of bleeding between FIT-positive and FIT-negative patients and could potentially be studied with a prospective research design. Our own study was not designed to address the question of whether FIT result informs patient management decisions. To answer this directly, interviews would have to be conducted with those making the follow-up decision (ie, endoscopists and surgeons). Additionally, this study was not adequately powered to make determinations on the efficacy of FIT in the acute care setting for detection of CRC. As mentioned, only 1 of the 4 patients (25%) who went on to be diagnosed with CRC on follow-up was initially FIT-positive. This would require further investigation.
Conclusion
FIT is being utilized for diagnostic purposes in the acute care of symptomatic patients, which is a misuse of an established screening test for CRC. While our study was not designed to answer whether and how often a FIT result informs subsequent patient management, our results indicate that FIT is an ineffective diagnostic and risk-stratification tool when used in the acute care setting. Our findings add to existing evidence that indicates FOBTs should not be used in acute patient care.
Taken as a whole, the results of our study add to a growing body of evidence demonstrating no role for FOBTs, and specifically FIT, in acute patient care. In light of this evidence, some health care systems have already demonstrated success with system-wide disinvestment from the test in acute patient care settings, with one group publishing about their disinvestment process.28 After completion of our study, our preliminary data were presented to leadership from the internal medicine, emergency medicine, and laboratory divisions within our health care delivery system to galvanize complete disinvestment of FIT from acute care at our hospitals, a policy that was put into effect in July 2019.
Corresponding author: Nathaniel J. Spezia-Lindner, MD, Baylor College of Medicine, 7200 Cambridge St, BCM 903, Ste A10.197, Houston, TX 77030; speziali@bcm.edu.
Financial disclosures: None.
Funding: Cancer Prevention and Research Institute of Texas, CPRIT (PP170094, PDs: ML Jibaja-Weiss and JR Montealegre).
1. Siegel RL, Miller KD, Jemal A. Cancer statistics, 2020. 10.1CA Cancer 10.1J Clin. 2020;70(1):7-30.
2. Howlader NN, Noone AM, Krapcho M, et al. SEER cancer statistics review, 1975-2014. National Cancer Institute; 2017:1-2.
3. Siegel RL, Fedewa SA, Anderson WF, et al. Colorectal cancer incidence patterns in the United States, 1974–2013. 10.1J Natl Cancer Inst. 2017;109(8):djw322.
4. Bailey CE, Hu CY, You YN, et al. Increasing disparities in the age-related incidences of colon and rectal cancers in the United States, 1975-2010. 10.25JAMA Surg. 2015;150(1):17-22.
5. Lin JS, Piper MA, Perdue LA, et al. Screening for colorectal cancer: updated evidence report and systematic review for the US Preventive Services Task Force. 10.25JAMA. 2016;315(23):2576-2594.
6. Centers for Disease Control and Prevention (CDC). Use of colorectal cancer screening tests. Behavioral Risk Factor Surveillance System. October 22, 2019. Accessed February 10, 2021. https://www.cdc.gov/cancer/colorectal/statistics/use-screening-tests-BRFSS.htm
7. Hewitson P, Glasziou PP, Irwig L, et al. Screening for colorectal cancer using the fecal occult blood test, Hemoccult. 10.25Cochrane Database Syst Rev. 2007;2007(1):CD001216.
8. Bujanda L, Lanas Á, Quintero E, et al. Effect of aspirin and antiplatelet drugs on the outcome of the fecal immunochemical test. 10.25Mayo Clin Proc. 2013;88(7):683-689.
9. Allison JE, Sakoda LC, Levin TR, et al. Screening for colorectal neoplasms with new fecal occult blood tests: update on performance characteristics. 10.25J Natl Cancer Inst. 2007;99(19):1462-1470.
10. Dancourt V, Lejeune C, Lepage C, et al. Immunochemical faecal occult blood tests are superior to guaiac-based tests for the detection of colorectal neoplasms. 10.25Eur J Cancer. 2008;44(15):2254-2258.
11. Hol L, Wilschut JA, van Ballegooijen M, et al. Screening for colorectal cancer: random comparison of guaiac and immunochemical faecal occult blood testing at different cut-off levels. 10.25Br J Cancer. 2009;100(7):1103-1110.
12. Levi Z, Birkenfeld S, Vilkin A, et al. A higher detection rate for colorectal cancer and advanced adenomatous polyp for screening with immunochemical fecal occult blood test than guaiac fecal occult blood test, despite lower compliance rate. A prospective, controlled, feasibility study. Int J Cancer. 2011;128(10):2415-2424.
13. Friedman A, Chan A, Chin LC, et al. Use and abuse of faecal occult blood tests in an acute hospital inpatient setting. Intern Med J. 2010;40(2):107-111.
14. Narula N, Ulic D, Al-Dabbagh R, et al. Fecal occult blood testing as a diagnostic test in symptomatic patients is not useful: a retrospective chart review. Can J Gastroenterol Hepatol. 2014;28(8):421-426.
15. Ip S, Sokoro AA, Kaita L, et al. Use of fecal occult blood testing in hospitalized patients: results of an audit. Can J Gastroenterol Hepatol. 2014;28(9):489-494.
16. Mosadeghi S, Ren H, Catungal J, et al. Utilization of fecal occult blood test in the acute hospital setting and its impact on clinical management and outcomes. J Postgrad Med. 2016;62(2):91-95.
17. van Rijn AF, Stroobants AK, Deutekom M, et al. Inappropriate use of the faecal occult blood test in a university hospital in the Netherlands. Eur J Gastroenterol Hepatol. 2012;24(11):1266-1269.
18. Sharma VK, Komanduri S, Nayyar S, et al. An audit of the utility of in-patient fecal occult blood testing. Am J Gastroenterol. 2001;96(4):1256-1260.
19. Chiang TH, Lee YC, Tu CH, et al. Performance of the immunochemical fecal occult blood test in predicting lesions in the lower gastrointestinal tract. CMAJ. 2011;183(13):1474-1481.
20. Chokshi DA, Chang JE, Wilson RM. Health reform and the changing safety net in the United States. N Engl J Med. 2016;375(18):1790-1796.
21. Nguyen OK, Makam AN, Halm EA. National use of safety net clinics for primary care among adults with non-Medicaid insurance in the United States. PLoS One. 2016;11(3):e0151610.
22. United States Census Bureau. American Community Survey. Selected Economic Characteristics. 2019. Accessed February 20, 2021. https://data.census.gov/cedsci/table?q=ACSDP1Y2019.DP03%20Texas&g=0400000US48&tid=ACSDP1Y2019.DP03&hidePreview=true
23. McNutt LA, Wu C, Xue X, et al. Estimating the relative risk in cohort studies and clinical trials of common outcomes. Am J Epidemiol. 2003;157(10):940-943.
24. Rockey DC. Occult gastrointestinal bleeding. Gastroenterol Clin North Am. 2005;34(4):699-718.
25. Macrae FA, St John DJ. Relationship between patterns of bleeding and Hemoccult sensitivity in patients with colorectal cancers or adenomas. Gastroenterology. 1982;82(5 pt 1):891-898.
26. Johanson JF, Sonnenberg A. The prevalence of hemorrhoids and chronic constipation: an epidemiologic study. Gastroenterology. 1990;98(2):380-386.
27. Fleming JL, Ahlquist DA, McGill DB, et al. Influence of aspirin and ethanol on fecal blood levels as determined by using the HemoQuant assay. Mayo Clin Proc. 1987;62(3):159-163.
28. Gupta A, Tang Z, Agrawal D. Eliminating in-hospital fecal occult blood testing: our experience with disinvestment. Am J Med. 2018;131(7):760-763.
Implementing the AMI READMITS Risk Assessment Score to Increase Referrals Among Patients With Type I Myocardial Infarction
From The Johns Hopkins Hospital, Baltimore, MD (Dr. Muganlinskaya and Dr. Skojec, retired); The George Washington University, Washington, DC (Dr. Posey); and Johns Hopkins University, Baltimore, MD (Dr. Resar).
Abstract
Objective: Assessing the risk characteristics of patients with acute myocardial infarction (MI) can help providers make appropriate referral decisions. This quality improvement project sought to improve timely, appropriate referrals among patients with type I MI by adding a risk assessment, the AMI READMITS score, to the existing referral protocol.
Methods: Patients’ chart data were analyzed to assess changes in referrals and timely follow-up appointments from pre-intervention to intervention. A survey assessed providers’ satisfaction with the new referral protocol.
Results: Among 57 patients (n = 29 preintervention; n = 28 intervention), documented referrals increased significantly from 66% to 89% (χ2 = 4.571, df = 1, P = 0.033); and timely appointments increased by 10%, which was not significant (χ2 = 3.550, df = 2, P = 0.169). Most providers agreed that the new protocol was easy to use, useful in making referral decisions, and improved the referral process. All agreed the risk score should be incorporated into electronic clinical notes. Provider opinions related to implementing the risk score in clinical practice were mixed. Qualitative feedback suggests this was due to limited validation of the AMI READMITS score in reducing readmissions.
Conclusions: Our risk-based referral protocol helped to increase appropriate referrals among patients with type I MI. Provider adoption may be enhanced by incorporating the protocol into electronic clinical notes. Research to further validate the accuracy of the AMI READMITS score in predicting readmissions may support adoption of the protocol in clinical practice.
Keywords: quality improvement; type I myocardial infarction; referral process; readmission risk; risk assessment; chart review.
Early follow-up after discharge is an important strategy to reduce the risk of unplanned hospital readmissions among patients with various conditions.1-3 While patient confounding factors, such as chronic health problems, environment, socioeconomic status, and literacy, make it difficult to avoid all unplanned readmissions, early follow-up may help providers identify and appropriately manage some health-related issues, and as such is a pivotal element of a readmission prevention strategy.4 There is evidence that patients with non-ST elevation myocardial infarction (NSTEMI) who have an outpatient appointment with a physician within 7 days after discharge have a lower risk of 30-day readmission.5
Our hospital’s postmyocardial infarction clinic was created to prevent unplanned readmissions within 30 days after discharge among patients with type I myocardial infarction (MI). Since inception, the number of referrals has been much lower than expected. In 2018, the total number of patients discharged from the hospital with type I MI and any troponin I level above 0.40 ng/mL was 313. Most of these patients were discharged from the hospital’s cardiac units; however, only 91 referrals were made. To increase referrals, the cardiology nurse practitioners (NPs) developed a post-MI referral protocol (Figure 1). However, this protocol was not consistently used and referrals to the clinic remained low.

Evidence-based risk assessment tools have the potential to increase effective patient management. For example, cardiology providers at the hospital utilize various scores, such as CHA2DS2-VASc6 and the Society of Thoracic Surgery risk score,7 to plan patient management. Among the scores used to predict unplanned readmissions for MI patients, the most promising is the AMI READMITS score.8 Unlike other nonspecific prediction models, the AMI READMITS score was developed based on variables extracted from the electronic health records (EHRs) of patients who were hospitalized for MI and readmitted within 30 days after discharge. Recognizing the potential to increase referrals by integrating an MI-specific risk assessment, this quality improvement study modified the existing referral protocol to include the patients’ AMI READMITS score and recommendations for follow-up.
Currently, there are no clear recommendations on how soon after discharge patients with MI should undergo follow-up. As research data vary, we selected 7 days follow-up for patients from high risk groups based on the “See you in 7” initiative for patients with heart failure (HF) and MI,9,10 as well as evidence that patients with NSTEMI have a lower risk of 30-day readmission if they have follow-up within 7 days after discharge5; and we selected 14 days follow-up for patients from low-risk groups based on evidence that postdischarge follow-up within 14 days reduces risk of 30-day readmission in patients with acute myocardial infarction (AMI) and/or acutely decompensated HF.11
Methods
This project was designed to answer the following question: For adult patients with type I MI, does implementation of a readmission risk assessment referral protocol increase the percentage of referrals and appointments scheduled within a recommended time? Anticipated outcomes included: (1) increased referrals to a cardiologist or the post-MI clinic; (2) increased scheduled follow-up appointments within 7 to 14 days; (3) provider satisfaction with the usability and usefulness of the new protocol; and (4) consistent provider adoption of the new risk assessment referral protocol.
To evaluate the degree to which these outcomes were achieved, we reviewed patient charts for 2 months prior and 2 months during implementation of the new referral protocol. As shown in Figure 2, the new protocol added the following process steps to the existing protocol: calculation of the AMI READMITS score, recommendations for follow-up based on patients’ risk score, and guidance to refer patients to the post-MI clinic if patients did not have an appointment with a cardiologist within 7 to 14 days after discharge. Patients’ risk assessment scores were obtained from forms completed by clinicians during the intervention. Clinician’s perceptions related to the usability and usefulness of the new protocol and feedback related to its long-term adoption were assessed using a descriptive survey.

The institutional review board classified this project as a quality improvement project. To avoid potential loss of patient privacy, no identifiable data were collected, a unique identifier unrelated to patients’ records was generated for each patient, and data were saved on a password-protected cardiology office computer.
Population
The project population included all adult patients (≥ 18 years old) with type I MI who were admitted or transferred to the hospital, had a percutaneous coronary intervention (PCI), or were managed without PCI and discharged from the hospital’s cardiac care unit (CCU) and progressive cardiac care unit (PCCU). The criteria for type I MI included the “detection of a rise and/or fall of cardiac troponin with at least 1 value above the 99th percentile and with at least 1 of the following: symptoms of acute myocardial ischemia; new ischemic electrocardiographic (ECG) changes; development of new pathological Q waves; imaging evidence of new loss of viable myocardium or new regional wall motion abnormality in a pattern consistent with an ischemic etiology; identification of a coronary thrombus by angiography including intracoronary imaging or by autopsy.”12 The study excluded patients with type I MI who were referred for coronary bypass surgery.
Intervention
The revised risk assessment protocol was implemented within the CCU and PCCU. The lead investigator met with each provider to discuss the role of the post-MI clinic, current referral rates, the purpose of the project, and the new referral process to be completed during the project for each patient discharged with type I MI. Cardiology NPs, fellows, and residents were asked to use the risk-assessment form to calculate patients’ risk for readmission, and refer patients to the post-MI clinic if an appointment with a cardiologist was not available within 7 to 14 days after discharge. Every week during the intervention phase, the investigator sent reminder emails to ensure form completion. Providers were asked to calculate and write the score, the discharge and referral dates, where referrals were made (a cardiologist or the post-MI clinic), date of appointment, and reason for not scheduling an appointment or not referring on the risk assessment form, and to drop the completed forms in specific labeled boxes located at the CCU and PCCU work stations. The investigator collected the completed forms weekly. When the number of discharged patients did not match the number of completed forms, the investigator followed up with discharging providers to understand why.
Data and Data Collection
Data to determine whether the use of the new protocol increased discharge referrals among patients with type I MI within the recommended timeframes were collected by electronic chart review. Data included discharging unit, patients’ age, gender, admission and discharge date, diagnosis, referral to a cardiologist and the post-MI clinic, and appointment date. Clinical data needed to calculate the AMI READMITS score was also collected: PCI within 24 hours, serum creatinine, systolic blood pressure (SBP), brain natriuretic peptide (BNP), and diabetes status.
Data to assess provider satisfaction with the usability and usefulness of the new protocol were gathered through an online survey. The survey included 1 question related to the providers’ role, 1 question asking whether they used the risk assessment for each patient, and 5 Likert-items assessing the ease of usage. An additional open-ended question asked providers to share feedback related to integrating the AMI READMITS risk assessment score to the post-MI referral protocol long term.
To evaluate how consistently providers utilized the new referral protocol when discharging patients with type I MI, the number of completed forms was compared with the number of those patients who were discharged.
Statistical Analysis
Descriptive statistics were used to summarize patient demographics and to calculate the frequency of referrals before and during the intervention. Chi-square statistics were calculated to determine whether the change in percentage of referrals and timely referrals was significant. Descriptive statistics were used to determine the level of provider satisfaction related to each survey item. A content analysis method was used to synthesize themes from the open-ended question asking clinicians to share their feedback related to the new protocol.
Results
Fifty-seven patients met the study inclusion criteria: 29 patients during the preintervention phase and 28 patients during the intervention phase. There were 35 male (61.4%) and 22 female (38.6%) patients. Twenty-five patients (43.9%) were from age groups 41 through 60 years and 61 through 80 years, respectively, representing the majority of included patients. Seven patients (12.3%) were from the 81 years and older age group. There were no patients in the age group 18 through 40 years. Based on the AMI READMITS score calculation, 57.9% (n = 33) patients were from a low-risk group (includes extremely low and low risk for readmission) and 42.1% (n = 24) were from a high-risk group (includes moderate, high, and extremely high risk for readmission).
Provider adoption of the new protocol during the intervention was high. Referral forms were completed for 82% (n = 23) of the 28 patients during the intervention. Analysis findings showed a statistically significant increase in documented referrals after implementing the new referral protocol. During the preintervention phase, 66% (n = 19) of patients with type I MI were referred to see a cardiologist or an NP at a post-MI clinic and there was no documented referral for 34% (n = 10) of patients. During the intervention phase, 89% (n = 25) of patients were referred and there was no documented referral for 11% (n = 3) of patients. Chi-square results indicated that the increase in referrals was significant (χ2 = 4.571, df = 1, P = 0.033).
Data analysis examined whether patient referrals fell within the recommended timeframe of 7 days for the high-risk group (included moderate-to-extremely high risk) and 14 days for the low-risk group (included low-to-extremely low risk). During the preintervention phase, 31% (n = 9) of patient referrals were scheduled as recommended; 28% (n = 8) of patient referrals were scheduled but delayed; and there was no referral date documented for 41% (n = 12) of patients. During the intervention phase, referrals scheduled as recommended increased to 53% (n = 15); 25% (n = 7) of referrals were scheduled but delayed; and there was no referral date documented for 21.4% (n = 6) of patients. The change in appointments scheduled as recommended was not significant (χ2 = 3.550, df = 2, P = 0.169).
Surveys were emailed to 25 cardiology fellows and 3 cardiology NPs who participated in this study. Eighteen of the 28 clinicians (15 cardiology fellows and 3 cardiology NPs) responded for a response rate of 64%. One of several residents who rotated through the CCU and PCCU during the intervention also completed the survey, for a total of 19 participants. When asked if the protocol was easy to use, 79% agreed or strongly agreed. Eighteen of the 19 participants (95%) agreed or strongly agreed that the protocol was useful in making referral decisions. Sixty-eight percent agreed or strongly agreed that the AMI READMITS risk assessment score improves referral process. All participants agreed or strongly agreed that there should be an option to incorporate the AMI READMITS risk assessment score into electronic clinical notes. When asked whether the AMI READMITS risk score should be implemented in clinical practice, responses were mixed (Figure 3). A common theme among the 4 participants who responded with comments was the need for additional data to validate the usefulness of the AMI READMITS to reduce readmissions. In addition, 1 participant commented that “manual calculation [of the risk score] is not ideal.”

Discussion
This project demonstrated that implementing an evidence-based referral protocol integrating the AMI-READMITS score can increase timely postdischarge referrals among patients with type I MI. The percentage of appropriately scheduled appointments increased during the intervention phase; however, a relatively high number of appointments were scheduled outside of the recommended timeframe, similar to preintervention. Thus, while the new protocol increased referrals and provider documentation of these referrals, it appears that challenges in scheduling timely referral appointments remained. This project did not examine the reasons for delayed appointments.
The survey findings indicated that providers were generally satisfied with the usability and usefulness of the new risk assessment protocol. A large majority agreed or strongly agreed that it was easy to use and useful in making referral decisions, and most agreed or strongly agreed that it improves the referral process. Mixed opinions regarding implementing the AMI READMITS score in clinical practice, combined with qualitative findings, suggest that a lack of external validation of the AMI READMITS presents a barrier to its long-term adoption. All providers who participated in the survey agreed or strongly agreed that the risk assessment should be incorporated into electronic clinical notes. We have begun the process of working with the EHR vendor to automate the AMI risk-assessment within the referral work-flow, which will provide an opportunity for a follow-up quality improvement study.
This quality improvement project has several limitations. First, it implemented a small change in 2 inpatient units at 1 hospital using a simple pre- posttest design. Therefore, the findings are not generalizable to other settings. Prior to the intervention, some referrals may have been made without documentation. While the authors were able to trace undocumented referrals for patients who were referred to the post-MI clinic or to a cardiologist affiliated with the hospital, some patients may have been referred to cardiologists who were not affiliated with the hospital. Another limitation was that the self-created provider survey used was not tested in other clinical settings; thus, it cannot be determined whether the sensitivity and specificity of the survey questions are high. In addition, the clinical providers who participated in the study knew the study team, which may have influenced their behavior during the study period. Furthermore, the identified improvement in clinicians’ referral practices may not be sustainable due to the complexity and effort required to manually calculate the risk score. This limitation could be eliminated by integrating the risk score calculation into the EHR.
Conclusion
Early follow-up after discharge plays an important role in supporting patients’ self-management of some risk factors (ie, diet, weight, and smoking) and identifying gaps in postdischarge care which may lead to readmission. This project provides evidence that integrating the AMI READMITS risk assessment score into the referral process can help to guide discharge decision-making and increase timely, appropriate referrals for patients with MI. Integration of a specific risk assessment, such as the AMI READMITS, within the post-MI referral protocol may help clinicians make more efficient, educated referral decisions. Future studies should explore more specifically how and why the new protocol impacts clinicians’ decision-making and behavior related to post-MI referrals. In addition, future studies should investigate challenges associated with scheduling postdischarge appointments. It will be important to investigate how integration of the new protocol within the EHR may increase efficiency, consistency, and provider satisfaction with the new referral process. Additional research investigating the effects of the AMI READMITS score on readmissions reduction will be important to promote long-term adoption of the improved referral protocol in clinical practice.
Acknowledgments: The authors thank Shelly Conaway, ANP-BC, MSN, Angela Street, ANP-BC, MSN, Andrew Geis, ACNP-BC, MSN, Richard P. Jones II, MD, Eunice Young, MD, Joy Rothwell, MSN, RN-BC, Allison Olazo, MBA, MSN, RN-BC, Elizabeth Heck, RN-BC, and Matthew Trojanowski, MHA, MS, RRT, CSSBB for their support of this study.
Corresponding author: Nailya Muganlinskaya, DNP, MPH, ACNP-BC, MSN, The Johns Hopkins Hospital, 1800 Orleans St, Baltimore, MD 21287; nmuganl1@jhmi.edu.
Financial disclosures: None.
1. Why it is important to improve care transitions? Society of Hospital Medicine. Accessed June 15, 2020. https://www.hospitalmedicine.org/clinical-topics/care-transitions/
2. Tong L, Arnold T, Yang J, et al. The association between outpatient follow-up visits and all-cause non-elective 30-day readmissions: a retrospective observational cohort study. PloS One. 2018;13(7):e0200691.
3. Jackson C, Shahsahebi M, Wedlake T, DuBard CA. Timeliness of outpatient follow-up: an evidence-based approach for planning after hospital discharge. Ann Fam Med. 2015;13(2):115-22.
4. Health Research & Educational Trust. Preventable Readmissions Change Package. American Hospital Association. Updated December 2015. Accessed June 10, 2020. https://www.aha.org/sites/default/files/hiin/HRETHEN_ChangePackage_Readmissions.pd
5. Tung Y-C, Chang G-M, Chang H-Y, Yu T-H. Relationship between early physician follow-up and 30-day readmission after acute myocardial infarction and heart failure. Plos One. 2017;12(1):e0170061.
6. Kaplan RM, Koehler J, Zieger PD, et al. Stroke risk as a function of atrial fibrillation duration and CHA2DS2-VASc score. Circulation. 2019;140(20):1639-46.
7. Balan P, Zhao Y, Johnson S, et al. The Society of Thoracic Surgery Risk Score as a predictor of 30-day mortality in transcatheter vs surgical aortic valve replacement: a single-center experience and its implications for the development of a TAVR risk-prediction model. J Invasive Cardiol. 2017;29(3):109-14.
8. Smith LN, Makam AN, Darden D, et al. Acute myocardial infarction readmission risk prediction models: A systematic review of model performance. Circ Cardiovasc Qual Outcomes9.9. 2018;11(1):e003885.
9. Baker H, Oliver-McNeil S, Deng L, Hummel SL. See you in 7: regional hospital collaboration and outcomes in Medicare heart failure patients. JACC Heart Fail. 2015;3(10):765-73.
10. Batten A, Jaeger C, Griffen D, et al. See you in 7: improving acute myocardial infarction follow-up care. BMJ Open Qual. 2018;7(2):e000296.
11. Lee DW, Armistead L, Coleman H, et al. Abstract 15387: Post-discharge follow-up within 14 days reduces 30-day hospital readmission rates in patients with acute myocardial infarction and/or acutely decompensated heart failure. Circulation. 2018;134 (1):A 15387.
12. Thygesen K, Alpert JS, Jaffe AS, et al. Fourth universal definition of myocardial infarction. Circulation. 2018;138 (20):e:618-51.
From The Johns Hopkins Hospital, Baltimore, MD (Dr. Muganlinskaya and Dr. Skojec, retired); The George Washington University, Washington, DC (Dr. Posey); and Johns Hopkins University, Baltimore, MD (Dr. Resar).
Abstract
Objective: Assessing the risk characteristics of patients with acute myocardial infarction (MI) can help providers make appropriate referral decisions. This quality improvement project sought to improve timely, appropriate referrals among patients with type I MI by adding a risk assessment, the AMI READMITS score, to the existing referral protocol.
Methods: Patients’ chart data were analyzed to assess changes in referrals and timely follow-up appointments from pre-intervention to intervention. A survey assessed providers’ satisfaction with the new referral protocol.
Results: Among 57 patients (n = 29 preintervention; n = 28 intervention), documented referrals increased significantly from 66% to 89% (χ2 = 4.571, df = 1, P = 0.033); and timely appointments increased by 10%, which was not significant (χ2 = 3.550, df = 2, P = 0.169). Most providers agreed that the new protocol was easy to use, useful in making referral decisions, and improved the referral process. All agreed the risk score should be incorporated into electronic clinical notes. Provider opinions related to implementing the risk score in clinical practice were mixed. Qualitative feedback suggests this was due to limited validation of the AMI READMITS score in reducing readmissions.
Conclusions: Our risk-based referral protocol helped to increase appropriate referrals among patients with type I MI. Provider adoption may be enhanced by incorporating the protocol into electronic clinical notes. Research to further validate the accuracy of the AMI READMITS score in predicting readmissions may support adoption of the protocol in clinical practice.
Keywords: quality improvement; type I myocardial infarction; referral process; readmission risk; risk assessment; chart review.
Early follow-up after discharge is an important strategy to reduce the risk of unplanned hospital readmissions among patients with various conditions.1-3 While patient confounding factors, such as chronic health problems, environment, socioeconomic status, and literacy, make it difficult to avoid all unplanned readmissions, early follow-up may help providers identify and appropriately manage some health-related issues, and as such is a pivotal element of a readmission prevention strategy.4 There is evidence that patients with non-ST elevation myocardial infarction (NSTEMI) who have an outpatient appointment with a physician within 7 days after discharge have a lower risk of 30-day readmission.5
Our hospital’s postmyocardial infarction clinic was created to prevent unplanned readmissions within 30 days after discharge among patients with type I myocardial infarction (MI). Since inception, the number of referrals has been much lower than expected. In 2018, the total number of patients discharged from the hospital with type I MI and any troponin I level above 0.40 ng/mL was 313. Most of these patients were discharged from the hospital’s cardiac units; however, only 91 referrals were made. To increase referrals, the cardiology nurse practitioners (NPs) developed a post-MI referral protocol (Figure 1). However, this protocol was not consistently used and referrals to the clinic remained low.
Evidence-based risk assessment tools have the potential to increase effective patient management. For example, cardiology providers at the hospital utilize various scores, such as CHA2DS2-VASc6 and the Society of Thoracic Surgery risk score,7 to plan patient management. Among the scores used to predict unplanned readmissions for MI patients, the most promising is the AMI READMITS score.8 Unlike other nonspecific prediction models, the AMI READMITS score was developed based on variables extracted from the electronic health records (EHRs) of patients who were hospitalized for MI and readmitted within 30 days after discharge. Recognizing the potential to increase referrals by integrating an MI-specific risk assessment, this quality improvement study modified the existing referral protocol to include the patients’ AMI READMITS score and recommendations for follow-up.
Currently, there are no clear recommendations on how soon after discharge patients with MI should undergo follow-up. As research data vary, we selected 7 days follow-up for patients from high risk groups based on the “See you in 7” initiative for patients with heart failure (HF) and MI,9,10 as well as evidence that patients with NSTEMI have a lower risk of 30-day readmission if they have follow-up within 7 days after discharge5; and we selected 14 days follow-up for patients from low-risk groups based on evidence that postdischarge follow-up within 14 days reduces risk of 30-day readmission in patients with acute myocardial infarction (AMI) and/or acutely decompensated HF.11
Methods
This project was designed to answer the following question: For adult patients with type I MI, does implementation of a readmission risk assessment referral protocol increase the percentage of referrals and appointments scheduled within a recommended time? Anticipated outcomes included: (1) increased referrals to a cardiologist or the post-MI clinic; (2) increased scheduled follow-up appointments within 7 to 14 days; (3) provider satisfaction with the usability and usefulness of the new protocol; and (4) consistent provider adoption of the new risk assessment referral protocol.
To evaluate the degree to which these outcomes were achieved, we reviewed patient charts for 2 months prior and 2 months during implementation of the new referral protocol. As shown in Figure 2, the new protocol added the following process steps to the existing protocol: calculation of the AMI READMITS score, recommendations for follow-up based on patients’ risk score, and guidance to refer patients to the post-MI clinic if patients did not have an appointment with a cardiologist within 7 to 14 days after discharge. Patients’ risk assessment scores were obtained from forms completed by clinicians during the intervention. Clinician’s perceptions related to the usability and usefulness of the new protocol and feedback related to its long-term adoption were assessed using a descriptive survey.
The institutional review board classified this project as a quality improvement project. To avoid potential loss of patient privacy, no identifiable data were collected, a unique identifier unrelated to patients’ records was generated for each patient, and data were saved on a password-protected cardiology office computer.
Population
The project population included all adult patients (≥ 18 years old) with type I MI who were admitted or transferred to the hospital, had a percutaneous coronary intervention (PCI), or were managed without PCI and discharged from the hospital’s cardiac care unit (CCU) and progressive cardiac care unit (PCCU). The criteria for type I MI included the “detection of a rise and/or fall of cardiac troponin with at least 1 value above the 99th percentile and with at least 1 of the following: symptoms of acute myocardial ischemia; new ischemic electrocardiographic (ECG) changes; development of new pathological Q waves; imaging evidence of new loss of viable myocardium or new regional wall motion abnormality in a pattern consistent with an ischemic etiology; identification of a coronary thrombus by angiography including intracoronary imaging or by autopsy.”12 The study excluded patients with type I MI who were referred for coronary bypass surgery.
Intervention
The revised risk assessment protocol was implemented within the CCU and PCCU. The lead investigator met with each provider to discuss the role of the post-MI clinic, current referral rates, the purpose of the project, and the new referral process to be completed during the project for each patient discharged with type I MI. Cardiology NPs, fellows, and residents were asked to use the risk-assessment form to calculate patients’ risk for readmission, and refer patients to the post-MI clinic if an appointment with a cardiologist was not available within 7 to 14 days after discharge. Every week during the intervention phase, the investigator sent reminder emails to ensure form completion. Providers were asked to calculate and write the score, the discharge and referral dates, where referrals were made (a cardiologist or the post-MI clinic), date of appointment, and reason for not scheduling an appointment or not referring on the risk assessment form, and to drop the completed forms in specific labeled boxes located at the CCU and PCCU work stations. The investigator collected the completed forms weekly. When the number of discharged patients did not match the number of completed forms, the investigator followed up with discharging providers to understand why.
Data and Data Collection
Data to determine whether the use of the new protocol increased discharge referrals among patients with type I MI within the recommended timeframes were collected by electronic chart review. Data included discharging unit, patients’ age, gender, admission and discharge date, diagnosis, referral to a cardiologist and the post-MI clinic, and appointment date. Clinical data needed to calculate the AMI READMITS score was also collected: PCI within 24 hours, serum creatinine, systolic blood pressure (SBP), brain natriuretic peptide (BNP), and diabetes status.
Data to assess provider satisfaction with the usability and usefulness of the new protocol were gathered through an online survey. The survey included 1 question related to the providers’ role, 1 question asking whether they used the risk assessment for each patient, and 5 Likert-items assessing the ease of usage. An additional open-ended question asked providers to share feedback related to integrating the AMI READMITS risk assessment score to the post-MI referral protocol long term.
To evaluate how consistently providers utilized the new referral protocol when discharging patients with type I MI, the number of completed forms was compared with the number of those patients who were discharged.
Statistical Analysis
Descriptive statistics were used to summarize patient demographics and to calculate the frequency of referrals before and during the intervention. Chi-square statistics were calculated to determine whether the change in percentage of referrals and timely referrals was significant. Descriptive statistics were used to determine the level of provider satisfaction related to each survey item. A content analysis method was used to synthesize themes from the open-ended question asking clinicians to share their feedback related to the new protocol.
Results
Fifty-seven patients met the study inclusion criteria: 29 patients during the preintervention phase and 28 patients during the intervention phase. There were 35 male (61.4%) and 22 female (38.6%) patients. Twenty-five patients (43.9%) were from age groups 41 through 60 years and 61 through 80 years, respectively, representing the majority of included patients. Seven patients (12.3%) were from the 81 years and older age group. There were no patients in the age group 18 through 40 years. Based on the AMI READMITS score calculation, 57.9% (n = 33) patients were from a low-risk group (includes extremely low and low risk for readmission) and 42.1% (n = 24) were from a high-risk group (includes moderate, high, and extremely high risk for readmission).
Provider adoption of the new protocol during the intervention was high. Referral forms were completed for 82% (n = 23) of the 28 patients during the intervention. Analysis findings showed a statistically significant increase in documented referrals after implementing the new referral protocol. During the preintervention phase, 66% (n = 19) of patients with type I MI were referred to see a cardiologist or an NP at a post-MI clinic and there was no documented referral for 34% (n = 10) of patients. During the intervention phase, 89% (n = 25) of patients were referred and there was no documented referral for 11% (n = 3) of patients. Chi-square results indicated that the increase in referrals was significant (χ2 = 4.571, df = 1, P = 0.033).
Data analysis examined whether patient referrals fell within the recommended timeframe of 7 days for the high-risk group (included moderate-to-extremely high risk) and 14 days for the low-risk group (included low-to-extremely low risk). During the preintervention phase, 31% (n = 9) of patient referrals were scheduled as recommended; 28% (n = 8) of patient referrals were scheduled but delayed; and there was no referral date documented for 41% (n = 12) of patients. During the intervention phase, referrals scheduled as recommended increased to 53% (n = 15); 25% (n = 7) of referrals were scheduled but delayed; and there was no referral date documented for 21.4% (n = 6) of patients. The change in appointments scheduled as recommended was not significant (χ2 = 3.550, df = 2, P = 0.169).
Surveys were emailed to 25 cardiology fellows and 3 cardiology NPs who participated in this study. Eighteen of the 28 clinicians (15 cardiology fellows and 3 cardiology NPs) responded for a response rate of 64%. One of several residents who rotated through the CCU and PCCU during the intervention also completed the survey, for a total of 19 participants. When asked if the protocol was easy to use, 79% agreed or strongly agreed. Eighteen of the 19 participants (95%) agreed or strongly agreed that the protocol was useful in making referral decisions. Sixty-eight percent agreed or strongly agreed that the AMI READMITS risk assessment score improves referral process. All participants agreed or strongly agreed that there should be an option to incorporate the AMI READMITS risk assessment score into electronic clinical notes. When asked whether the AMI READMITS risk score should be implemented in clinical practice, responses were mixed (Figure 3). A common theme among the 4 participants who responded with comments was the need for additional data to validate the usefulness of the AMI READMITS to reduce readmissions. In addition, 1 participant commented that “manual calculation [of the risk score] is not ideal.”
Discussion
This project demonstrated that implementing an evidence-based referral protocol integrating the AMI-READMITS score can increase timely postdischarge referrals among patients with type I MI. The percentage of appropriately scheduled appointments increased during the intervention phase; however, a relatively high number of appointments were scheduled outside of the recommended timeframe, similar to preintervention. Thus, while the new protocol increased referrals and provider documentation of these referrals, it appears that challenges in scheduling timely referral appointments remained. This project did not examine the reasons for delayed appointments.
The survey findings indicated that providers were generally satisfied with the usability and usefulness of the new risk assessment protocol. A large majority agreed or strongly agreed that it was easy to use and useful in making referral decisions, and most agreed or strongly agreed that it improves the referral process. Mixed opinions regarding implementing the AMI READMITS score in clinical practice, combined with qualitative findings, suggest that a lack of external validation of the AMI READMITS presents a barrier to its long-term adoption. All providers who participated in the survey agreed or strongly agreed that the risk assessment should be incorporated into electronic clinical notes. We have begun the process of working with the EHR vendor to automate the AMI risk-assessment within the referral work-flow, which will provide an opportunity for a follow-up quality improvement study.
This quality improvement project has several limitations. First, it implemented a small change in 2 inpatient units at 1 hospital using a simple pre- posttest design. Therefore, the findings are not generalizable to other settings. Prior to the intervention, some referrals may have been made without documentation. While the authors were able to trace undocumented referrals for patients who were referred to the post-MI clinic or to a cardiologist affiliated with the hospital, some patients may have been referred to cardiologists who were not affiliated with the hospital. Another limitation was that the self-created provider survey used was not tested in other clinical settings; thus, it cannot be determined whether the sensitivity and specificity of the survey questions are high. In addition, the clinical providers who participated in the study knew the study team, which may have influenced their behavior during the study period. Furthermore, the identified improvement in clinicians’ referral practices may not be sustainable due to the complexity and effort required to manually calculate the risk score. This limitation could be eliminated by integrating the risk score calculation into the EHR.
Conclusion
Early follow-up after discharge plays an important role in supporting patients’ self-management of some risk factors (ie, diet, weight, and smoking) and identifying gaps in postdischarge care which may lead to readmission. This project provides evidence that integrating the AMI READMITS risk assessment score into the referral process can help to guide discharge decision-making and increase timely, appropriate referrals for patients with MI. Integration of a specific risk assessment, such as the AMI READMITS, within the post-MI referral protocol may help clinicians make more efficient, educated referral decisions. Future studies should explore more specifically how and why the new protocol impacts clinicians’ decision-making and behavior related to post-MI referrals. In addition, future studies should investigate challenges associated with scheduling postdischarge appointments. It will be important to investigate how integration of the new protocol within the EHR may increase efficiency, consistency, and provider satisfaction with the new referral process. Additional research investigating the effects of the AMI READMITS score on readmissions reduction will be important to promote long-term adoption of the improved referral protocol in clinical practice.
Acknowledgments: The authors thank Shelly Conaway, ANP-BC, MSN, Angela Street, ANP-BC, MSN, Andrew Geis, ACNP-BC, MSN, Richard P. Jones II, MD, Eunice Young, MD, Joy Rothwell, MSN, RN-BC, Allison Olazo, MBA, MSN, RN-BC, Elizabeth Heck, RN-BC, and Matthew Trojanowski, MHA, MS, RRT, CSSBB for their support of this study.
Corresponding author: Nailya Muganlinskaya, DNP, MPH, ACNP-BC, MSN, The Johns Hopkins Hospital, 1800 Orleans St, Baltimore, MD 21287; nmuganl1@jhmi.edu.
Financial disclosures: None.
1. Why it is important to improve care transitions? Society of Hospital Medicine. Accessed June 15, 2020. https://www.hospitalmedicine.org/clinical-topics/care-transitions/
2. Tong L, Arnold T, Yang J, et al. The association between outpatient follow-up visits and all-cause non-elective 30-day readmissions: a retrospective observational cohort study. PloS One. 2018;13(7):e0200691.
3. Jackson C, Shahsahebi M, Wedlake T, DuBard CA. Timeliness of outpatient follow-up: an evidence-based approach for planning after hospital discharge. Ann Fam Med. 2015;13(2):115-22.
4. Health Research & Educational Trust. Preventable Readmissions Change Package. American Hospital Association. Updated December 2015. Accessed June 10, 2020. https://www.aha.org/sites/default/files/hiin/HRETHEN_ChangePackage_Readmissions.pd
5. Tung Y-C, Chang G-M, Chang H-Y, Yu T-H. Relationship between early physician follow-up and 30-day readmission after acute myocardial infarction and heart failure. Plos One. 2017;12(1):e0170061.
6. Kaplan RM, Koehler J, Zieger PD, et al. Stroke risk as a function of atrial fibrillation duration and CHA2DS2-VASc score. Circulation. 2019;140(20):1639-46.
7. Balan P, Zhao Y, Johnson S, et al. The Society of Thoracic Surgery Risk Score as a predictor of 30-day mortality in transcatheter vs surgical aortic valve replacement: a single-center experience and its implications for the development of a TAVR risk-prediction model. J Invasive Cardiol. 2017;29(3):109-14.
8. Smith LN, Makam AN, Darden D, et al. Acute myocardial infarction readmission risk prediction models: A systematic review of model performance. Circ Cardiovasc Qual Outcomes9.9. 2018;11(1):e003885.
9. Baker H, Oliver-McNeil S, Deng L, Hummel SL. See you in 7: regional hospital collaboration and outcomes in Medicare heart failure patients. JACC Heart Fail. 2015;3(10):765-73.
10. Batten A, Jaeger C, Griffen D, et al. See you in 7: improving acute myocardial infarction follow-up care. BMJ Open Qual. 2018;7(2):e000296.
11. Lee DW, Armistead L, Coleman H, et al. Abstract 15387: Post-discharge follow-up within 14 days reduces 30-day hospital readmission rates in patients with acute myocardial infarction and/or acutely decompensated heart failure. Circulation. 2018;134 (1):A 15387.
12. Thygesen K, Alpert JS, Jaffe AS, et al. Fourth universal definition of myocardial infarction. Circulation. 2018;138 (20):e:618-51.
Could tamoxifen dose be slashed down to 2.5 mg?
Tamoxifen has long been used in breast cancer, both in the adjuvant and preventive setting, but uptake and adherence are notoriously low, mainly because of adverse events.
Using a much lower dose to reduce the incidence of side effects would be a “way forward,” reasoned Swedish researchers. They report that a substantially lower dose of tamoxifen (2.5 mg) may be as effective as the standard dose (20 mg), but reduced by half the incidence of severe vasomotor symptoms, including hot flashes, cold sweats, and night sweats.
The research was published online March 18 in the Journal of Clinical Oncology.
The study involved 1,439 women (aged 40-74 years) who were participating in the Swedish mammography screening program and tested tamoxifen at various doses.
“We performed a dose determination study that we hope will initiate follow-up studies that in turn will influence both adjuvant treatment and prevention of breast cancer,” said lead author Per Hall, MD, PhD, head of the department of medical epidemiology and biostatistics at Karolinska Institutet in Stockholm.
The study measured the effects of the different doses (1, 2.5, 5, 10, and 20 mg) on mammographic breast density.
Dr. Hall emphasized that breast density was used as a proxy for therapy response. “We do not know how that translates to actual clinical effect,” he said in an interview. “This is step one.”
Previous studies have also used breast density changes as a proxy endpoint for tamoxifen therapy response, in both prophylactic and adjuvant settings, the authors note. There is some data to suggest that this does translate to a clinical effect. A recent study showed that tamoxifen at 5 mg/day taken for 3 years reduced the recurrence of breast intraepithelial neoplasia by 50% and contralateral breast cancer by 75%, with a symptom profile similar to placebo (J Clin Oncol. 2019;37:1629-1637).
Lower density, fewer symptoms
In the current study, Dr. Hall and colleagues found that the mammographic breast density (mean overall area) was decreased by 9.6% in the 20 mg tamoxifen group, and similar decreases were seen in the 2.5 and 10 mg dose groups, but not in the placebo and 1 mg dose groups.
These changes were driven primarily by changes observed among premenopausal women where the 20 mg mean decrease was 18.5% (P < .001 for interaction with menopausal status) with decreases of 13.4% in the 2.5 mg group, 19.6% in the 5 mg group, and 17% in the 10 mg group.
The results were quite different in postmenopausal participants, where those who received the 20 mg dose had a density mean decrease of 4%, which was not substantially different to the placebo, 1 mg, 2.5 mg, and 10 mg treatment arms.
The authors point out that the difference in density decrease between premenopausal and postmenopausal women was not dependent on differences in baseline density.
When reviewing adverse events with the various doses, the team found a large decrease in severe vasomotor symptoms with the lower doses of tamoxifen. These adverse events were reported by 34% of women taking 20 mg, 24.4% on 5 mg, 20.5% on 2.5 mg, 18.5% on 1 mg, and 13.7% of women taking placebo. There were no similar trends seen for gynecologic, sexual, or musculoskeletal symptoms.
Future studies should test whether 2.5 mg of tamoxifen reduces the risk of primary breast cancer, Dr. Hall commented.
“We are planning a trial now where women are offered risk assessment when attending mammography screening,” Dr. Hall said. “For those at very high risk, low-dose tamoxifen will be offered.”
The study received support from the Kamprad Foundation, Swedish Research Council, Marit and Hans Rausing’s Initiative Against Breast Cancer, Swedish Cancer Society, and Stockholm County Council.
Dr. Hall reports several relationships with industry, had a pending patent on compositions and methods for prevention of breast cancer with an option to license to Atossa Therapeutics, and has licensed an algorithm for risk prediction based on analyses of mammographic features to iCAD Travel. Several co-authors have also declared relationships with industry.
A version of this article first appeared on Medscape.com.
Recurrent miscarriage: What’s the evidence-based evaluation and management?
A pregnancy loss at any gestational age is devastating. Women and/or couples may, unfairly, self-blame as they desperately seek substantive answers. Their support systems, including health care providers, offer some, albeit fleeting, comfort. Conception is merely the start of an emotionally arduous first trimester that often results in a learned helplessness. This month, we focus on the comprehensive evaluation and the medical evidence–based approach to recurrent pregnancy loss (RPL).

RPL is defined by the American Society for Reproductive Medicine as two or more clinical pregnancy losses of less than 20 weeks’ gestation with a prevalence of approximately 5%. Embryo aneuploidy is the most common reason for a spontaneous miscarriage, occurring in 50%-70% of losses. The risk of spontaneous miscarriage during the reproductive years follows a J-shaped pattern. The lowest percentage is in women aged 25-29 years (9.8%), with a nadir at age 27 (9.5%), then an increasingly steep rise after age 35 to a peak at age 45 and over (53.6%). The loss rate is closer to 50% of all fertilizations since many spontaneous miscarriages occur at 2-4 weeks, before a pregnancy can be clinically diagnosed. The frequency of embryo aneuploidy significantly decreases and embryo euploidy increases with successive numbers of spontaneous miscarriages.
After three or more spontaneous miscarriages, nulliparous women appear to have a higher rate of subsequent pregnancy loss, compared with parous women (BMJ. 2000;320:1708). We recommend an evaluation following two losses given the lack of evidence for a difference in diagnostic yield following two versus three miscarriages and particularly because of the emotional effects of impact of RPL.
RPL causes, percentages of contribution, and evaluation
1. Genetic (2%-5%). Because of the risk of an embryo with an unbalanced chromosomal rearrangement inherited from a translocation present in either of the couple, a blood karyotype of the couple is essential despite a history of one or more successful live births. While in vitro fertilization (IVF) with preimplantation genetic testing for structural rearrangements (PGT-SR) can successfully diagnose affected embryos to avoid their intrauterine transfer, overall live birth rates are similar when comparing natural conception attempts with PGT-SR, although the latter may reduce miscarriages.
2. Anatomic (10%-15%). Hysteroscopy, hysterosalpingogram, or saline ultrasound can be used to image the uterine cavity to evaluate for polyps, fibroids, scarring, or a congenital septum – all of which can be surgically corrected. Chronic endometritis has been found in 27% of patients with recurrent miscarriage (and in 14% with recurrent implantation failure), therefore testing by biopsy is reasonable. An elevated level of homocysteine has been reported to impair DNA methylation and gene expression, causing defective chorionic villous vascularization in spontaneous miscarriage tissues. We recommend folic acid supplementation and the avoidance of testing for MTHFR (methylenetetrahydrofolate reductase). Of note, the recent TRUST study showed no significant benefit from metroplasty in comparison with expectant management in 12 months of observation resulting in a live birth rate of 31% versus 35%, respectively.
3. Acquired thrombophilias (20%). Medical evidence supports testing for the antiphospholipid antibody syndrome (APS), i.e., RPL with either the presence of lupus anticoagulant (LAC), anticardiolipin antibodies, or anti-beta2 glycoprotein for IgG and IgM. Persistent LAC or elevations of antibodies greater than 40 GPL or greater than the 99th percentile for more than 12 weeks justifies the use of low-molecular-weight heparin (LMWH). APS has been shown to cause RPL, thrombosis, and/or autoimmune thrombocytopenia. There is no definitive evidence to support testing for MTHFR or any other thrombophilias for first trimester RPL. APS has up to a 90% fetal loss rate without therapeutic intervention. Treatment includes low-dose aspirin (81 mg daily) and LMWH. These medications are thought to help prevent thrombosis in the placenta, helping to maintain pregnancies.
4. Hormonal (17%-20%). The most common hormonal disorders increasing the risk for miscarriage is thyroid dysfunction (both hyper- and hypothyroid), prolactin elevations, and lack of glucose control. While the concern for a luteal phase (LPD) prevails, there is no accepted definition or treatment. There is recent evidence that antibodies to thyroid peroxidase may increase miscarriage and that low-dose thyroid replacement may reduce this risk. One other important area is the polycystic ovarian syndrome (PCOS). This hormonal abnormality affects 6%-20% of all reproductive aged women and may increase miscarriage.
5. Unexplained (40%-50%). The most frustrating but most common reason for RPL. Nevertheless, close monitoring and supportive care throughout the first trimester has been demonstrated in medical studies to improve outcome.
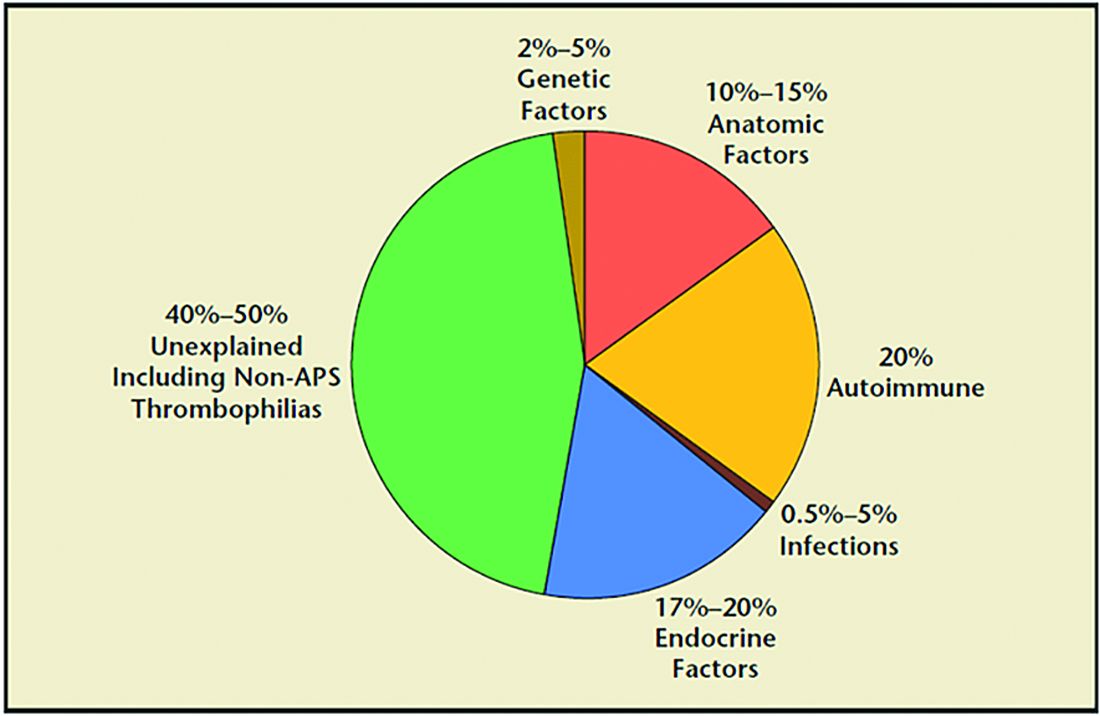
Seven surprising facts about recurrent miscarriage
1. Folic acid 4 mg daily may decrease embryo chromosomal abnormalities and miscarriage.
Folic acid in doses of at least 0.4 mg daily have long been advocated to reduce spina bifida and neural tube defects. It is optimal to begin folic acid for several months prior to conception attempts. There is evidence it may help treat RPL by reducing the chance for chromosomal errors.
2. A randomized trial did not demonstrate an improved live birth rate using progesterone in the first trimester. However, women enrolled may not have begun progesterone until 6 weeks of pregnancy, begging the question if earlier progesterone would have demonstrated improvement.
Dydrogesterone, a progestogen that is highly selective for the progesterone receptor, lacks estrogenic, androgenic, anabolic, and corticoid properties. Although not available in the United States, dydrogesterone appears to reduce the rate of idiopathic recurrent miscarriage (two or more losses). Also, progesterone support has been shown to reduce loss in threatened miscarriage – 17 OHPC 500 mg IM weekly in the first trimester.
3. No benefit of aspirin and/or heparin to treat unexplained RM.
The use of aspirin and/or heparin-like medication has convincingly been shown to not improve live birth rates in RPL.
4. Inherited thrombophilias are NOT associated with RM and should not be tested.
Screening for factor V (Leiden mutation), factor II (Prothrombin G20210A), and MTHFR have not been shown to cause RM and no treatment, such as aspirin and/or heparin-like medications, improves the live birth rate.
5. Close monitoring and empathetic care improves outcomes.
For unknown reasons, clinics providing close monitoring, emotional support, and education to patients with unexplained RM report higher live birth rates, compared with patients not receiving this level of care.
6. Behavior changes reduce miscarriage.
Elevations in body mass index (BMI) and cigarette smoking both increase the risk of miscarriage. As a result, a healthy BMI and eliminating tobacco use reduce the risk of pregnancy loss. Excessive caffeine use (more than two equivalent cups of caffeine in coffee per day) also may increase spontaneous miscarriage.
7. Fertility medications, intrauterine insemination, in vitro fertilization, or preimplantation genetic testing for aneuploidy (PGT-A) do not improve outcomes.
While patients and, often, health care providers, feel compelled to proceed with fertility treatment, ovulation induction medications, intrauterine insemination, in vitro fertilization, or PGT-A have not been shown to improve the chance for a live birth. PGT-A did not reduce the risk of miscarriage in women with recurrent pregnancy loss.
In summary, following two or more pregnancy losses, I recommend obtaining chromosomal testing of the couple, viewing the uterine cavity, blood testing for thyroid, prolactin, and glucose control, and acquired thrombophilias (as above). Fortunately, when the cause is unexplained, the woman has a 70%-80% chance of a spontaneous live birth over the next 10 years from diagnosis. By further understanding, knowing how to diagnose, and, finally, treating the cause of RPL we can hopefully prevent the heartbreak women and couples endure.
Dr. Trolice is director of Fertility CARE – The IVF Center in Winter Park, Fla., and professor of obstetrics and gynecology at the University of Central Florida, Orlando.
A pregnancy loss at any gestational age is devastating. Women and/or couples may, unfairly, self-blame as they desperately seek substantive answers. Their support systems, including health care providers, offer some, albeit fleeting, comfort. Conception is merely the start of an emotionally arduous first trimester that often results in a learned helplessness. This month, we focus on the comprehensive evaluation and the medical evidence–based approach to recurrent pregnancy loss (RPL).
RPL is defined by the American Society for Reproductive Medicine as two or more clinical pregnancy losses of less than 20 weeks’ gestation with a prevalence of approximately 5%. Embryo aneuploidy is the most common reason for a spontaneous miscarriage, occurring in 50%-70% of losses. The risk of spontaneous miscarriage during the reproductive years follows a J-shaped pattern. The lowest percentage is in women aged 25-29 years (9.8%), with a nadir at age 27 (9.5%), then an increasingly steep rise after age 35 to a peak at age 45 and over (53.6%). The loss rate is closer to 50% of all fertilizations since many spontaneous miscarriages occur at 2-4 weeks, before a pregnancy can be clinically diagnosed. The frequency of embryo aneuploidy significantly decreases and embryo euploidy increases with successive numbers of spontaneous miscarriages.
After three or more spontaneous miscarriages, nulliparous women appear to have a higher rate of subsequent pregnancy loss, compared with parous women (BMJ. 2000;320:1708). We recommend an evaluation following two losses given the lack of evidence for a difference in diagnostic yield following two versus three miscarriages and particularly because of the emotional effects of impact of RPL.
RPL causes, percentages of contribution, and evaluation
1. Genetic (2%-5%). Because of the risk of an embryo with an unbalanced chromosomal rearrangement inherited from a translocation present in either of the couple, a blood karyotype of the couple is essential despite a history of one or more successful live births. While in vitro fertilization (IVF) with preimplantation genetic testing for structural rearrangements (PGT-SR) can successfully diagnose affected embryos to avoid their intrauterine transfer, overall live birth rates are similar when comparing natural conception attempts with PGT-SR, although the latter may reduce miscarriages.
2. Anatomic (10%-15%). Hysteroscopy, hysterosalpingogram, or saline ultrasound can be used to image the uterine cavity to evaluate for polyps, fibroids, scarring, or a congenital septum – all of which can be surgically corrected. Chronic endometritis has been found in 27% of patients with recurrent miscarriage (and in 14% with recurrent implantation failure), therefore testing by biopsy is reasonable. An elevated level of homocysteine has been reported to impair DNA methylation and gene expression, causing defective chorionic villous vascularization in spontaneous miscarriage tissues. We recommend folic acid supplementation and the avoidance of testing for MTHFR (methylenetetrahydrofolate reductase). Of note, the recent TRUST study showed no significant benefit from metroplasty in comparison with expectant management in 12 months of observation resulting in a live birth rate of 31% versus 35%, respectively.
3. Acquired thrombophilias (20%). Medical evidence supports testing for the antiphospholipid antibody syndrome (APS), i.e., RPL with either the presence of lupus anticoagulant (LAC), anticardiolipin antibodies, or anti-beta2 glycoprotein for IgG and IgM. Persistent LAC or elevations of antibodies greater than 40 GPL or greater than the 99th percentile for more than 12 weeks justifies the use of low-molecular-weight heparin (LMWH). APS has been shown to cause RPL, thrombosis, and/or autoimmune thrombocytopenia. There is no definitive evidence to support testing for MTHFR or any other thrombophilias for first trimester RPL. APS has up to a 90% fetal loss rate without therapeutic intervention. Treatment includes low-dose aspirin (81 mg daily) and LMWH. These medications are thought to help prevent thrombosis in the placenta, helping to maintain pregnancies.
4. Hormonal (17%-20%). The most common hormonal disorders increasing the risk for miscarriage is thyroid dysfunction (both hyper- and hypothyroid), prolactin elevations, and lack of glucose control. While the concern for a luteal phase (LPD) prevails, there is no accepted definition or treatment. There is recent evidence that antibodies to thyroid peroxidase may increase miscarriage and that low-dose thyroid replacement may reduce this risk. One other important area is the polycystic ovarian syndrome (PCOS). This hormonal abnormality affects 6%-20% of all reproductive aged women and may increase miscarriage.
5. Unexplained (40%-50%). The most frustrating but most common reason for RPL. Nevertheless, close monitoring and supportive care throughout the first trimester has been demonstrated in medical studies to improve outcome.
Seven surprising facts about recurrent miscarriage
1. Folic acid 4 mg daily may decrease embryo chromosomal abnormalities and miscarriage.
Folic acid in doses of at least 0.4 mg daily have long been advocated to reduce spina bifida and neural tube defects. It is optimal to begin folic acid for several months prior to conception attempts. There is evidence it may help treat RPL by reducing the chance for chromosomal errors.
2. A randomized trial did not demonstrate an improved live birth rate using progesterone in the first trimester. However, women enrolled may not have begun progesterone until 6 weeks of pregnancy, begging the question if earlier progesterone would have demonstrated improvement.
Dydrogesterone, a progestogen that is highly selective for the progesterone receptor, lacks estrogenic, androgenic, anabolic, and corticoid properties. Although not available in the United States, dydrogesterone appears to reduce the rate of idiopathic recurrent miscarriage (two or more losses). Also, progesterone support has been shown to reduce loss in threatened miscarriage – 17 OHPC 500 mg IM weekly in the first trimester.
3. No benefit of aspirin and/or heparin to treat unexplained RM.
The use of aspirin and/or heparin-like medication has convincingly been shown to not improve live birth rates in RPL.
4. Inherited thrombophilias are NOT associated with RM and should not be tested.
Screening for factor V (Leiden mutation), factor II (Prothrombin G20210A), and MTHFR have not been shown to cause RM and no treatment, such as aspirin and/or heparin-like medications, improves the live birth rate.
5. Close monitoring and empathetic care improves outcomes.
For unknown reasons, clinics providing close monitoring, emotional support, and education to patients with unexplained RM report higher live birth rates, compared with patients not receiving this level of care.
6. Behavior changes reduce miscarriage.
Elevations in body mass index (BMI) and cigarette smoking both increase the risk of miscarriage. As a result, a healthy BMI and eliminating tobacco use reduce the risk of pregnancy loss. Excessive caffeine use (more than two equivalent cups of caffeine in coffee per day) also may increase spontaneous miscarriage.
7. Fertility medications, intrauterine insemination, in vitro fertilization, or preimplantation genetic testing for aneuploidy (PGT-A) do not improve outcomes.
While patients and, often, health care providers, feel compelled to proceed with fertility treatment, ovulation induction medications, intrauterine insemination, in vitro fertilization, or PGT-A have not been shown to improve the chance for a live birth. PGT-A did not reduce the risk of miscarriage in women with recurrent pregnancy loss.
In summary, following two or more pregnancy losses, I recommend obtaining chromosomal testing of the couple, viewing the uterine cavity, blood testing for thyroid, prolactin, and glucose control, and acquired thrombophilias (as above). Fortunately, when the cause is unexplained, the woman has a 70%-80% chance of a spontaneous live birth over the next 10 years from diagnosis. By further understanding, knowing how to diagnose, and, finally, treating the cause of RPL we can hopefully prevent the heartbreak women and couples endure.
Dr. Trolice is director of Fertility CARE – The IVF Center in Winter Park, Fla., and professor of obstetrics and gynecology at the University of Central Florida, Orlando.
Reproductive safety of treatments for women with bipolar disorder
Since March 2020, my colleagues and I have conducted Virtual Rounds at the Center for Women’s Mental Health at Massachusetts General Hospital. It has been an opportunity to review the basic tenets of care for reproductive age women before, during, and after pregnancy, and also to learn of extraordinary cases being managed both in the outpatient setting and in the context of the COVID-19 pandemic.

As I’ve noted in previous columns, we have seen a heightening of symptoms of anxiety and insomnia during the pandemic in women who visit our center, and at the centers of the more than 100 clinicians who join Virtual Rounds each week. These colleagues represent people in rural areas, urban environments, and underserved communities across America that have been severely affected by the pandemic. It is clear that the stress of the pandemic is undeniable for patients both with and without psychiatric or mental health issues. We have also seen clinical roughening in women who have been well for a long period of time. In particular, we have noticed that postpartum women are struggling with the stressors of the postpartum period, such as figuring out the logistics of support with respect to childcare, managing maternity leave, and adapting to shifting of anticipated support systems.
Hundreds of women with bipolar disorder come to see us each year about the reproductive safety of the medicines on which they are maintained. Those patients are typically well, and we collaborate with them and their doctors about the safest treatment recommendations. With that said, women with bipolar disorder are at particular risk for postpartum worsening of their mood. The management of their medications during pregnancy requires extremely careful attention because relapse of psychiatric disorder during pregnancy is the strongest predictor of postpartum worsening of underlying psychiatric illness.
This is an opportunity to briefly review the reproductive safety of treatments for these women. We know through initiatives such as the Massachusetts General Hospital National Pregnancy Registry for Psychiatric Medications that the most widely used medicines for bipolar women during pregnancy include lamotrigine, atypical antipsychotics, and lithium carbonate.
Lamotrigine
The last 15 years have generated the most consistent data on the reproductive safety of lamotrigine. One of the issues, however, with respect to lamotrigine is that its use requires very careful and slow titration and it is also more effective in patients who are well and in the maintenance phase of the illness versus those who are more acutely manic or who are suffering from frank bipolar depression.
Critically, the literature does not support the use of lamotrigine for patients with bipolar I or with more manic symptoms. That being said, it remains a mainstay of treatment for many patients with bipolar disorder, is easy to use across pregnancy, and has an attractive side-effect profile and a very strong reproductive safety profile, suggesting the absence of an increased risk for major malformations.
Atypical antipsychotics
We have less information but have a growing body of evidence about atypical antipsychotics. Both data from administrative databases as well a growing literature from pregnancy registries, such as the National Pregnancy Registry for Atypical Antipsychotics, fail to show a signal for teratogenicity with respect to use of the medicines as a class, and also with specific reference to some of the most widely used atypical antipsychotics, particularly quetiapine and aripiprazole. Our comfort level, compared with a decade ago, with using the second-generation antipsychotics is much greater. That’s a good thing considering the extent to which patients presenting on a combination of, for example, lamotrigine and atypical antipsychotics.
Lithium carbonate
Another mainstay of treatment for women with bipolar I disorder and prominent symptoms of mania is lithium carbonate. The data for efficacy of lithium carbonate used both acutely and for maintenance treatment of bipolar disorder has been unequivocal. Concerns about the teratogenicity of lithium go back to the 1970s and indicate a small increased absolute and relative risk for cardiovascular malformations. More recently, a meta-analysis of lithium exposure during pregnancy and the postpartum period supports this older data, which suggests this increased risk, and examines other outcomes concerning to women with bipolar disorder who use lithium, such as preterm labor, low birth weight, miscarriage, and other adverse neonatal outcomes.
In 2021, with the backdrop of the pandemic, what we actually see is that, for our pregnant and postpartum patients with bipolar disorder, the imperative to keep them well, keep them out of the hospital, and keep them safe has often required careful coadministration of drugs like lamotrigine, lithium, and atypical antipsychotics (and even benzodiazepines). Keeping this population well during the perinatal period is so critical. We were all trained to use the least number of medications when possible across psychiatric illnesses. But the years, data, and clinical experience have shown that polypharmacy may be required to sustain euthymia in many patients with bipolar disorder. The reflex historically has been to stop medications during pregnancy. We take pause, particularly during the pandemic, before reverting back to the practice of 25 years ago of abruptly stopping medicines such as lithium or atypical antipsychotics in patients with bipolar disorder because we know that the risk for relapse is very high following a shift from the regimen that got the patient well.
The COVID-19 pandemic in many respects has highlighted a need to clinically thread the needle with respect to developing a regimen that minimizes risk of reproductive safety concerns but maximizes the likelihood that we can sustain the emotional well-being of these women across pregnancy and into the postpartum period.
Dr. Cohen is the director of the Ammon-Pinizzotto Center for Women’s Mental Health at Massachusetts General Hospital, which provides information resources and conducts clinical care and research in reproductive mental health. He has been a consultant to manufacturers of psychiatric medications. Email Dr. Cohen at obnews@mdedge.com.
Since March 2020, my colleagues and I have conducted Virtual Rounds at the Center for Women’s Mental Health at Massachusetts General Hospital. It has been an opportunity to review the basic tenets of care for reproductive age women before, during, and after pregnancy, and also to learn of extraordinary cases being managed both in the outpatient setting and in the context of the COVID-19 pandemic.
As I’ve noted in previous columns, we have seen a heightening of symptoms of anxiety and insomnia during the pandemic in women who visit our center, and at the centers of the more than 100 clinicians who join Virtual Rounds each week. These colleagues represent people in rural areas, urban environments, and underserved communities across America that have been severely affected by the pandemic. It is clear that the stress of the pandemic is undeniable for patients both with and without psychiatric or mental health issues. We have also seen clinical roughening in women who have been well for a long period of time. In particular, we have noticed that postpartum women are struggling with the stressors of the postpartum period, such as figuring out the logistics of support with respect to childcare, managing maternity leave, and adapting to shifting of anticipated support systems.
Hundreds of women with bipolar disorder come to see us each year about the reproductive safety of the medicines on which they are maintained. Those patients are typically well, and we collaborate with them and their doctors about the safest treatment recommendations. With that said, women with bipolar disorder are at particular risk for postpartum worsening of their mood. The management of their medications during pregnancy requires extremely careful attention because relapse of psychiatric disorder during pregnancy is the strongest predictor of postpartum worsening of underlying psychiatric illness.
This is an opportunity to briefly review the reproductive safety of treatments for these women. We know through initiatives such as the Massachusetts General Hospital National Pregnancy Registry for Psychiatric Medications that the most widely used medicines for bipolar women during pregnancy include lamotrigine, atypical antipsychotics, and lithium carbonate.
Lamotrigine
The last 15 years have generated the most consistent data on the reproductive safety of lamotrigine. One of the issues, however, with respect to lamotrigine is that its use requires very careful and slow titration and it is also more effective in patients who are well and in the maintenance phase of the illness versus those who are more acutely manic or who are suffering from frank bipolar depression.
Critically, the literature does not support the use of lamotrigine for patients with bipolar I or with more manic symptoms. That being said, it remains a mainstay of treatment for many patients with bipolar disorder, is easy to use across pregnancy, and has an attractive side-effect profile and a very strong reproductive safety profile, suggesting the absence of an increased risk for major malformations.
Atypical antipsychotics
We have less information but have a growing body of evidence about atypical antipsychotics. Both data from administrative databases as well a growing literature from pregnancy registries, such as the National Pregnancy Registry for Atypical Antipsychotics, fail to show a signal for teratogenicity with respect to use of the medicines as a class, and also with specific reference to some of the most widely used atypical antipsychotics, particularly quetiapine and aripiprazole. Our comfort level, compared with a decade ago, with using the second-generation antipsychotics is much greater. That’s a good thing considering the extent to which patients presenting on a combination of, for example, lamotrigine and atypical antipsychotics.
Lithium carbonate
Another mainstay of treatment for women with bipolar I disorder and prominent symptoms of mania is lithium carbonate. The data for efficacy of lithium carbonate used both acutely and for maintenance treatment of bipolar disorder has been unequivocal. Concerns about the teratogenicity of lithium go back to the 1970s and indicate a small increased absolute and relative risk for cardiovascular malformations. More recently, a meta-analysis of lithium exposure during pregnancy and the postpartum period supports this older data, which suggests this increased risk, and examines other outcomes concerning to women with bipolar disorder who use lithium, such as preterm labor, low birth weight, miscarriage, and other adverse neonatal outcomes.
In 2021, with the backdrop of the pandemic, what we actually see is that, for our pregnant and postpartum patients with bipolar disorder, the imperative to keep them well, keep them out of the hospital, and keep them safe has often required careful coadministration of drugs like lamotrigine, lithium, and atypical antipsychotics (and even benzodiazepines). Keeping this population well during the perinatal period is so critical. We were all trained to use the least number of medications when possible across psychiatric illnesses. But the years, data, and clinical experience have shown that polypharmacy may be required to sustain euthymia in many patients with bipolar disorder. The reflex historically has been to stop medications during pregnancy. We take pause, particularly during the pandemic, before reverting back to the practice of 25 years ago of abruptly stopping medicines such as lithium or atypical antipsychotics in patients with bipolar disorder because we know that the risk for relapse is very high following a shift from the regimen that got the patient well.
The COVID-19 pandemic in many respects has highlighted a need to clinically thread the needle with respect to developing a regimen that minimizes risk of reproductive safety concerns but maximizes the likelihood that we can sustain the emotional well-being of these women across pregnancy and into the postpartum period.
Dr. Cohen is the director of the Ammon-Pinizzotto Center for Women’s Mental Health at Massachusetts General Hospital, which provides information resources and conducts clinical care and research in reproductive mental health. He has been a consultant to manufacturers of psychiatric medications. Email Dr. Cohen at obnews@mdedge.com.
Obesity pegged as source of marked increased risk of diabetes in PCOS
The increased risk of type 2 diabetes in women with polycystic ovary syndrome is well established, but a new analysis has shown that obesity is the major mediator and a target for preventing or reversing this comorbidity.
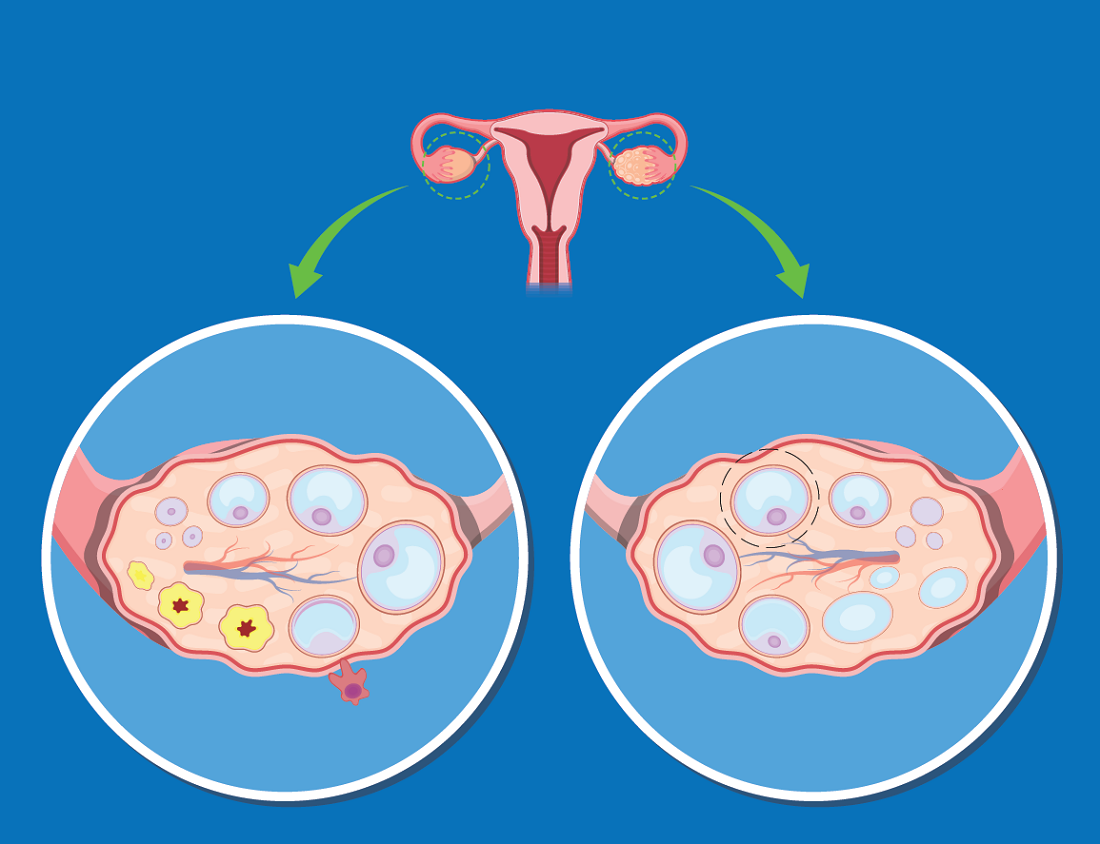
“Most women with PCOS are obese, complicating the effort to understand whether high rates of diabetes in this population are due to PCOS or excess weight, but our study now suggest that obesity isa targetable risk factor,” reported Panagiotis Anagnostis, MD, PhD, a reproductive endocrinologist at the Medical School of Aristotle University, Thessaloniki, Greece.
Obesity is also a known risk factor for type 2 diabetes (T2D), but there is reason to suspect that PCOS, which is associated with abnormal carbohydrate metabolism, has a direct impact on the risk of developing T2D, according to Dr. Anagnostis. It is also reasonable to expect “a synergistic deleterious effect” from PCOS and obesity on adverse changes in glucose metabolism that lead to T2D.
Even though rates of obesity among women with PCOS reach 80% in some studies, Dr. Anagnostis attempted to disentangle the relationship between obesity, PCOS, and risk of T2D using a large set of data drawn from a comprehensive search of published studies.
After screening with predefined criteria, 12 studies provided data on 224,284 women, of whom 45,361 had PCOS and 5,717 had T2D. Not least of the criteria for inclusion in this analysis, all studies stratified women as obese, defined as a body mass index (BMI) greater than 30 kg/m2, or nonobese, he reported at the annual meeting of the Endocrine Society.
Diabetes risk tripled in PCOS
When compared without regard to BMI, the relative risk of having T2D among those with PCOS relative to those without this condition was more than three times greater (RR 3.13; P < .001). When women with PCOS were stratified for BMI, obesity was associated with a more than fourfold increased risk relative to controls without PCOS (RR, 4.06; P < .001).
In women who were nonobese, the risk of T2D was numerically higher for those with PCOS than those without (RR, 2.68), but it was only a trend with a large confidence interval (95% confidence interval, 0.97-7.49).
Among women with PCOS, those who were obese also had a more than fourfold and highly significant increased risk of T2D relative to those who were not obese (RR, 4.20; P < .001).
The message from these data is that obesity is a major and potentially modifiable risk factor for diabetes in women with PCOS, according to Dr. Anagnostis.
He said these data provide the basis for recommending weight loss specifically for managing this common PCOS comorbidity.
Almost the same relative risk of diabetes was derived from an analysis of a women’s health database published 2 years ago in Diabetes Care. In that study with 1,916 person-years of follow-up, the hazard ratio for T2D was also more than three times greater (HR, 3.23; P < .001) for those with PCOS relative to those without the syndrome.
However, normal BMI did not eliminate risk of developing diabetes in this study. Rather, the relative risk of T2D in women with PCOS was higher in those of normal weight, compared with those who were obese (HR, 4.68 vs. 2.36; P < .005). The investigators recommend screening all women with PCOS at least every 3 years with more frequent screening in those with risk factors.
PCOS complexity challenges simple conclusions
The complexity of disturbed metabolic pathways in patients with PCOS and obesity might explain some of the difficulty in unraveling the relationship between these two disease states and diabetes risk. In one recent review, it was suggested that obesity and PCOS share interrelated adverse effects on glucose metabolism. As a result, these associations are “more complex than a simple cause-and-effect process.” the authors of that article concluded.
Furthermore, in their examination of metabolic pathways, genetic susceptibility, and behavioral factors that might link PCOS, weight gain, and T2D, the authors did not ignore the psychological impact of PCOS in causing obesity and, as a byproduct, diabetes. These psychological factors might be relevant to treatment.
For example, depression and stress “might hamper ongoing attempts at lifestyle change and therefore effective weight loss” in at least some women, they cautioned.
However, in encouraging weight loss in overweight women with PCOS, the debate about cause of T2D might be moot in practical terms, according to Michael Dansinger, MD, founding director of the diabetes reversal program at Tufts Medical Center, Boston.
“Reducing excess body fat reduces the risk of type 2 diabetes,” Dr. Dansinger said in an interview. “Since women with obesity and PCOS are clearly at risk for future type 2 diabetes, that’s another reason to lose excess body fat through healthy eating and exercise.”
Dr. Anagnostis and Dr. Dansinger reported no relevant conflicts of interest.
The increased risk of type 2 diabetes in women with polycystic ovary syndrome is well established, but a new analysis has shown that obesity is the major mediator and a target for preventing or reversing this comorbidity.
“Most women with PCOS are obese, complicating the effort to understand whether high rates of diabetes in this population are due to PCOS or excess weight, but our study now suggest that obesity isa targetable risk factor,” reported Panagiotis Anagnostis, MD, PhD, a reproductive endocrinologist at the Medical School of Aristotle University, Thessaloniki, Greece.
Obesity is also a known risk factor for type 2 diabetes (T2D), but there is reason to suspect that PCOS, which is associated with abnormal carbohydrate metabolism, has a direct impact on the risk of developing T2D, according to Dr. Anagnostis. It is also reasonable to expect “a synergistic deleterious effect” from PCOS and obesity on adverse changes in glucose metabolism that lead to T2D.
Even though rates of obesity among women with PCOS reach 80% in some studies, Dr. Anagnostis attempted to disentangle the relationship between obesity, PCOS, and risk of T2D using a large set of data drawn from a comprehensive search of published studies.
After screening with predefined criteria, 12 studies provided data on 224,284 women, of whom 45,361 had PCOS and 5,717 had T2D. Not least of the criteria for inclusion in this analysis, all studies stratified women as obese, defined as a body mass index (BMI) greater than 30 kg/m2, or nonobese, he reported at the annual meeting of the Endocrine Society.
Diabetes risk tripled in PCOS
When compared without regard to BMI, the relative risk of having T2D among those with PCOS relative to those without this condition was more than three times greater (RR 3.13; P < .001). When women with PCOS were stratified for BMI, obesity was associated with a more than fourfold increased risk relative to controls without PCOS (RR, 4.06; P < .001).
In women who were nonobese, the risk of T2D was numerically higher for those with PCOS than those without (RR, 2.68), but it was only a trend with a large confidence interval (95% confidence interval, 0.97-7.49).
Among women with PCOS, those who were obese also had a more than fourfold and highly significant increased risk of T2D relative to those who were not obese (RR, 4.20; P < .001).
The message from these data is that obesity is a major and potentially modifiable risk factor for diabetes in women with PCOS, according to Dr. Anagnostis.
He said these data provide the basis for recommending weight loss specifically for managing this common PCOS comorbidity.
Almost the same relative risk of diabetes was derived from an analysis of a women’s health database published 2 years ago in Diabetes Care. In that study with 1,916 person-years of follow-up, the hazard ratio for T2D was also more than three times greater (HR, 3.23; P < .001) for those with PCOS relative to those without the syndrome.
However, normal BMI did not eliminate risk of developing diabetes in this study. Rather, the relative risk of T2D in women with PCOS was higher in those of normal weight, compared with those who were obese (HR, 4.68 vs. 2.36; P < .005). The investigators recommend screening all women with PCOS at least every 3 years with more frequent screening in those with risk factors.
PCOS complexity challenges simple conclusions
The complexity of disturbed metabolic pathways in patients with PCOS and obesity might explain some of the difficulty in unraveling the relationship between these two disease states and diabetes risk. In one recent review, it was suggested that obesity and PCOS share interrelated adverse effects on glucose metabolism. As a result, these associations are “more complex than a simple cause-and-effect process.” the authors of that article concluded.
Furthermore, in their examination of metabolic pathways, genetic susceptibility, and behavioral factors that might link PCOS, weight gain, and T2D, the authors did not ignore the psychological impact of PCOS in causing obesity and, as a byproduct, diabetes. These psychological factors might be relevant to treatment.
For example, depression and stress “might hamper ongoing attempts at lifestyle change and therefore effective weight loss” in at least some women, they cautioned.
However, in encouraging weight loss in overweight women with PCOS, the debate about cause of T2D might be moot in practical terms, according to Michael Dansinger, MD, founding director of the diabetes reversal program at Tufts Medical Center, Boston.
“Reducing excess body fat reduces the risk of type 2 diabetes,” Dr. Dansinger said in an interview. “Since women with obesity and PCOS are clearly at risk for future type 2 diabetes, that’s another reason to lose excess body fat through healthy eating and exercise.”
Dr. Anagnostis and Dr. Dansinger reported no relevant conflicts of interest.
FROM ENDO 2021
How long is the second stage of labor in women delivering twins?
, researchers say.

Although the analysis found statistically significant differences in second-stage labor lengths for twin and singleton deliveries, “ultimately I think the value in this is seeing that it is not much different,” said Nathan Fox, MD, a maternal-fetal medicine specialist who has studied twin pregnancies and delivery of twins.
Knowledge gap
While most twin births occur by cesarean delivery, vaginal delivery is a preferred method for diamniotic twins with the first twin in vertex presentation, wrote study author Gabriel Levin, MD, and colleagues. Prior studies, however, have not clearly established the duration of the second stage of labor in twin deliveries – that is, the time from 10-cm dilation until delivery of the first twin, they said.
Knowing “the parameters of the normal second stage of labor” for twin deliveries may help guide clinical practice and possibly avoid unnecessary operative deliveries, the researchers wrote.
To establish normal ranges for the second stage of labor in twin deliveries, Dr. Levin, of the department of obstetrics and gynecology at Hadassah-Hebrew University Medical Center, Jerusalem, and coauthors conducted a retrospective cohort study. They analyzed data from three large academic hospitals in Israel between 2011 and June 2020 and assessed the length of the second stage of labor by obstetric history and clinical characteristics.
The researchers included data from women who delivered the first of diamniotic twins spontaneously or delivered a singleton spontaneously. The researchers excluded twin pregnancies with fetal demise of one or both twins, structural anomaly or chromosomal abnormality, monochorionic complications, and first twin in a nonvertex presentation. They did not consider the delivery mode of the second twin.
The study included 2,009 twin deliveries and 135,217 singleton deliveries. Of the women with twin deliveries, 32.6% were nulliparous (that is, no previous vaginal deliveries), 61.5% were parous (one to four previous vaginal deliveries, and no cesarean deliveries), and 5.9% were grand multiparous (at least five previous deliveries).
Of the women with singleton deliveries, 29% were nulliparous.
For nulliparous women delivering twins, the median length of the second stage was 1 hour 27 minutes (interquartile range, 40-147 minutes), and the 95th percentile was 3 hours 51 minutes.
For parous women delivering twins, the median length of the second stage was 18 minutes (interquartile range, 8-36 minutes), and the 95th percentile was 1 hour 56 minutes.
For grand multiparous women, the median length of the second stage was 10 minutes.
In a multivariable analysis, epidural anesthesia and induction of labor were independently associated with increased length of the second stage of labor.
Second-stage labor longer than the 95th percentile based on parity and epidural status was associated with approximately twice the risk of admission to the neonatal intensive care unit (35.4% vs. 16.4%) and need for phototherapy, the researchers reported.
Compared with singleton deliveries, the second stage was longer in twin deliveries. Among nulliparous patients, the median length of the second stage of labor was 1 hour 18 minutes for singleton deliveries, versus 1 hour 30 minutes for twin deliveries. Among parous patients, the median length of the second stage was 19 minutes for twin deliveries, compared with 10 minutes for singleton deliveries.
The study was conducted in Israel, which may limit its generalizability, the authors noted. In addition, the researchers lacked data about maternal morbidity and had limited data about neonatal morbidity. “The exact time that the woman became 10-cm dilated cannot be known, a problem inherent to all such studies,” and cases where doctors artificially ended labor with operative delivery were not included, the researchers added. “More research is needed to determine at what point, if any, intervention is warranted to shorten the second stage in patients delivering twins,” Dr. Levin and colleagues wrote.
Providing a framework
“We always get more concerned if the labor process is happening in a way that is unusual,” and this study provides data that can provide a framework for that thought process, said Dr. Fox, who was not involved in the study.
The results demonstrate that the second stage of labor for twin deliveries may take a long time and “that is not necessarily a bad thing,” said Dr. Fox, clinical professor of obstetrics and gynecology and maternal and fetal medicine at the Icahn School of Medicine at Mount Sinai in New York.
For women having their first child, the second stage of labor tends to take much longer than it does for women who have had children. “That is well known for singletons, and everyone assumes it is the same for twins,” but this study quantifies the durations for twins, he said. “That is valuable, and it is also helpful for women to know what to expect.”
A study coauthor disclosed financial ties to PregnanTech and Anthem AI, and money paid to their institution from New Sight. Dr. Fox works at Maternal Fetal Medicine Associates and Carnegie Imaging for Women in New York and is the creator and host of the Healthful Woman Podcast. He had no relevant financial disclosures.
, researchers say.
Although the analysis found statistically significant differences in second-stage labor lengths for twin and singleton deliveries, “ultimately I think the value in this is seeing that it is not much different,” said Nathan Fox, MD, a maternal-fetal medicine specialist who has studied twin pregnancies and delivery of twins.
Knowledge gap
While most twin births occur by cesarean delivery, vaginal delivery is a preferred method for diamniotic twins with the first twin in vertex presentation, wrote study author Gabriel Levin, MD, and colleagues. Prior studies, however, have not clearly established the duration of the second stage of labor in twin deliveries – that is, the time from 10-cm dilation until delivery of the first twin, they said.
Knowing “the parameters of the normal second stage of labor” for twin deliveries may help guide clinical practice and possibly avoid unnecessary operative deliveries, the researchers wrote.
To establish normal ranges for the second stage of labor in twin deliveries, Dr. Levin, of the department of obstetrics and gynecology at Hadassah-Hebrew University Medical Center, Jerusalem, and coauthors conducted a retrospective cohort study. They analyzed data from three large academic hospitals in Israel between 2011 and June 2020 and assessed the length of the second stage of labor by obstetric history and clinical characteristics.
The researchers included data from women who delivered the first of diamniotic twins spontaneously or delivered a singleton spontaneously. The researchers excluded twin pregnancies with fetal demise of one or both twins, structural anomaly or chromosomal abnormality, monochorionic complications, and first twin in a nonvertex presentation. They did not consider the delivery mode of the second twin.
The study included 2,009 twin deliveries and 135,217 singleton deliveries. Of the women with twin deliveries, 32.6% were nulliparous (that is, no previous vaginal deliveries), 61.5% were parous (one to four previous vaginal deliveries, and no cesarean deliveries), and 5.9% were grand multiparous (at least five previous deliveries).
Of the women with singleton deliveries, 29% were nulliparous.
For nulliparous women delivering twins, the median length of the second stage was 1 hour 27 minutes (interquartile range, 40-147 minutes), and the 95th percentile was 3 hours 51 minutes.
For parous women delivering twins, the median length of the second stage was 18 minutes (interquartile range, 8-36 minutes), and the 95th percentile was 1 hour 56 minutes.
For grand multiparous women, the median length of the second stage was 10 minutes.
In a multivariable analysis, epidural anesthesia and induction of labor were independently associated with increased length of the second stage of labor.
Second-stage labor longer than the 95th percentile based on parity and epidural status was associated with approximately twice the risk of admission to the neonatal intensive care unit (35.4% vs. 16.4%) and need for phototherapy, the researchers reported.
Compared with singleton deliveries, the second stage was longer in twin deliveries. Among nulliparous patients, the median length of the second stage of labor was 1 hour 18 minutes for singleton deliveries, versus 1 hour 30 minutes for twin deliveries. Among parous patients, the median length of the second stage was 19 minutes for twin deliveries, compared with 10 minutes for singleton deliveries.
The study was conducted in Israel, which may limit its generalizability, the authors noted. In addition, the researchers lacked data about maternal morbidity and had limited data about neonatal morbidity. “The exact time that the woman became 10-cm dilated cannot be known, a problem inherent to all such studies,” and cases where doctors artificially ended labor with operative delivery were not included, the researchers added. “More research is needed to determine at what point, if any, intervention is warranted to shorten the second stage in patients delivering twins,” Dr. Levin and colleagues wrote.
Providing a framework
“We always get more concerned if the labor process is happening in a way that is unusual,” and this study provides data that can provide a framework for that thought process, said Dr. Fox, who was not involved in the study.
The results demonstrate that the second stage of labor for twin deliveries may take a long time and “that is not necessarily a bad thing,” said Dr. Fox, clinical professor of obstetrics and gynecology and maternal and fetal medicine at the Icahn School of Medicine at Mount Sinai in New York.
For women having their first child, the second stage of labor tends to take much longer than it does for women who have had children. “That is well known for singletons, and everyone assumes it is the same for twins,” but this study quantifies the durations for twins, he said. “That is valuable, and it is also helpful for women to know what to expect.”
A study coauthor disclosed financial ties to PregnanTech and Anthem AI, and money paid to their institution from New Sight. Dr. Fox works at Maternal Fetal Medicine Associates and Carnegie Imaging for Women in New York and is the creator and host of the Healthful Woman Podcast. He had no relevant financial disclosures.
FROM OBSTETRICS AND GYNECOLOGY