User login
Early, subtle, cardiac changes tied to midlife cognitive decline
new research suggests.
Cardiovascular disease risk factors such as high blood pressure, high cholesterol, and diabetes have been associated with an increased risk for cognitive impairment, but much less is known about heart structure and function and the risks for cognition.
“We showed for the first time that, even before the occurrence of cardiovascular disease, people with abnormalities in cardiac structure and function as early as in young adulthood have lower midlife cognition,” investigators Laure Rouch, PharmD, PhD, and Kristine Yaffe, MD, both with the department of psychiatry, University of California, San Francisco, said in a joint email.
“This study reminds us that heart health is key to brain health and that the overlap and interplay between the two is not limited to patients with end-stage heart disease,” Dr. Rouch and Dr. Yaffe said.
The findings were published online Jan. 26, 2022, in Neurology.
Heart/brain connection
The analysis included 2,653 participants in the Coronary Artery Risk Development in Young Adults (CARDIA) study.
Echocardiograms were obtained at year 5, 25, and 30 study visits – at mean ages of 30, 50, and 55 years, respectively. At year 30, participants underwent a standard battery of tests measuring global cognition, processing speed, executive function, delayed verbal memory, and verbal fluency.
Over 25 years, there was an average increase in left ventricular mass of 0.27 g/m2 per year – from a mean of 80.5 g/m2 in year 5 to 86.0 g/m2 in year 30.
Left atrial volume increased by an average of 0.42 mL/m2 per year, from 16 mL/m2 in year 5 to 26 mL/m2 in year 30.
Left ventricular ejection fraction (LVEF) decreased by 0.11% per year, from 63.3% in year 5 to 59.7% in year 30.
After adjustment for demographics and education, an increase in left ventricular mass of at least 1 standard deviation over 25 years was associated with lower cognition on most tests (P ≤ .02).
An increase in left atrial volume over the study period was associated with lower global cognition (P = .04), whereas a decrease in LVEF was not associated with cognition. Further adjustment for cardiovascular risk factors yielded similar results.
“A more effective collaboration is needed between cardiologists and neurologists to promote healthy brain aging,” Dr. Rouch and Dr. Yaffe said.
“Echocardiography is a widely available, relatively inexpensive, and noninvasive imaging method that could be integrated into a risk assessment for cognitive impairment,” they added.
Looking ahead, the investigators noted there is a need for further research to determine whether interventions to improve cardiac structure and diastolic function could also benefit brain health.
They should also investigate the role of arterial stiffness and cerebral small vessel disease in the relationship between cardiac structure, function, and cognition, the researchers added.
First structural biomarker
Commenting on the study, Shaheen E. Lakhan, MD, PhD, a neurologist in Newton, Mass., said the study is important because, “thus far, the connections have really been physiological parameters,” such as blood pressure and cognitive health.
“This is really strong evidence of a structural cardiac biomarker that can be measured before and independent of changes in physiology or diseased state,” said Dr. Lakhan, who was not involved with the research.
As more and more interventions are being introduced for addressing disorders of cognition, “this potential structural finding may serve as a solid biomarker to determine” what lifestyle or drug therapy should be taken, he added.
Also weighing in on the findings, Pierre Fayad, MD, professor in the department of neurological sciences and director of the Nebraska Stroke Center, University of Nebraska Medical Center, Omaha, said CARDIA is “an important study” providing “precious data.”
The reported changes in cardiac structure and function “precede the clinical symptomatology, as the follow-up stops before they enter into later adulthood, where the risk of clinical events dramatically rises. Meaning these patients still have not had stroke, congestive heart failure, heart attack or dementia, but some of them could be on that trajectory later in their life,” Dr. Fayad told this news organization.
Documenting such changes over time is “valuable to give an insight into what leads us to such progression,” he noted.
How reliably predictive the findings are for eventual clinical cognitive impairment “will need to be confirmed and verified” in future studies, he added.
“If verified, it could be helpful to provide interventions to those with the left atrial volume enlargement marker and see their effectiveness at preventing eventual clinical cognitive impairment,” said Dr. Fayad.
The CARDIA study is supported by the National Heart, Lung, and Blood Institute in collaboration with the University of Alabama at Birmingham, Northwestern University, the University of Minnesota, and the Kaiser Foundation Research Institute. Rouch, Lakhan, and Dr. Fayad have disclosed no relevant financial relationships.
A version of this article first appeared on Medscape.com.
FROM NEUROLOGY
Immunocompromised patients should receive fourth COVID shot: CDC
The Centers for Disease Control and Prevention contacted pharmacies on Jan. 26 to reinforce the message that people with moderate to severe immune suppression should receive a fourth COVID-19 vaccine, according to Kaiser Health News.
The conference call came a day after the news outlet reported that immunocompromised people were being turned away by pharmacies. White House officials also emphasized on Jan. 26 that immunocompromised people should receive an additional shot.
During the call, the CDC “reiterated the recommendations, running through case examples,” Mitchel Rothholz, RPh, MBA, chief of governance and state affiliates for the American Pharmacists Association, told KHN.
While on the call, Mr. Rothholz asked for a “prepared document” with the CDC’s recommendations “so we can clearly and consistently communicate the message.” The CDC officials on the call said they would create a document but “don’t know how long that will take,” Mr. Rothholz told KHN.
The CDC recommends an additional shot -– or a fourth shot – for those who have weak immune systems, which makes them more at risk for severe COVID-19 and death. About 7 million American adults are considered immunocompromised, KHN reported, which includes people who have certain medical conditions that impair their immune response or who take immune-suppressing drugs because of organ transplants, cancer, or autoimmune diseases.
The CDC first recommended fourth shots for immunocompromised people in October. This month, the CDC shortened the time for booster shots from 6 months to 5 months, and some immunocompromised people who are due for another shot have begun to seek them. The agency has been educating pharmacists and other health providers since then, a CDC spokesperson told KHN.
While patients don’t need to provide proof that they are immunocompromised, according to the CDC, some have been turned away, KHN reported.
To improve communication with the public, large pharmacies could issue news releases and update their websites “explicitly stating that they are offering fourth doses” to immunocompromised people, Ameet Kini, MD, a professor of pathology and laboratory medicine at Loyola University Medical Center in Chicago, told KHN.
Pharmacies should also update their patient portals and provide “clear guidance for their pharmacists,” he said.
A version of this article first appeared on WebMD.com.
Hong Kong, U.S., Israeli data illuminate COVID vaccine myocarditis
Why some COVID-19 vaccines seem occasionally to cause a distinctive form of myocarditis, and why adolescent boys and young men appear most vulnerable, remain a mystery. But the entity’s prevalence, nuances of presentation, and likely clinical course have come into sharper view after recent additions to the literature.
Two new publications all but confirm that the rare cases of myocarditis closely following vaccination against SARS-CoV-2, primarily with one of the mRNA-based vaccines from Pfizer-BioNTech and Moderna, is a clinically different creature from myocarditis physicians were likely to see before the pandemic.
A third report unveils rates of hospitalization for myocarditis linked to Pfizer-BioNTech vaccination in the 12- to 15-year age group, based on active surveillance across Israel. Of note, the rates were lower than corresponding numbers among the country’s 16- to 19-year-olds published in late 2021 by the same authors.
No link with CoronaVac
A case-control study covering almost the entire population of Hong Kong from February to August 2021 confirms a slight but significant excess risk for myocarditis and, to a lesser degree, pericarditis, after injections of the Pfizer-BioNTech vaccine. As consistently reported from other studies, the risks were highest in adolescent and young adult males and after a second dose.
The study estimated an overall carditis incidence of 5.7 cases per million doses of Pfizer-BioNTech, for a risk 3.5 times that in the unvaccinated Hong Kong population. Carditis rates after a first dose were about 2.5 per million and 10 per million after a second dose.
Hong Kong launched its public SARS-CoV-2 immunization program in late February 2021 with the Chinese-made CoronaVac (Sinovac) inactivated-virus vaccine, and introduced the mRNA-based alternative several weeks later. By August 2021, the vaccines had reached about 3.3 million people in the region – 49% of the Hong Kong population at least 12 years of age.
In a novel finding, there were no excesses in carditis cases after CoronaVac vaccination. The difference between vaccines likely isn’t caused by chance, because three-fourths of the carditis-associated Pfizer-BioNTech injections arose within a week, whereas “71% of cases following the use of CoronaVac occurred more than 30 days after vaccination,” senior author Ian Chi Kei Wong, PhD, University of Hong Kong, said in an interview.
“This onset distribution for cases having received CoronaVac demonstrates that it is highly unlikely the carditis cases are related to the vaccine,” he said. And that “plausibly implies a specific underlying mechanism between vaccination and carditis that may only be applicable to mRNA vaccines.”
That inference is in line with case reports and other research, including large population-based studies from Israel and Denmark, although a recent study from the United Kingdom hinted at a potential excess myocarditis risk associated with the adenovirus-based AstraZeneca-Oxford vaccine.
The Hong Kong study identified 160 patients age 12 or older with a first diagnosis of carditis during February to August 2021, in electronic health records covering nearly the entire region.
“We used laboratory test results of troponin levels to further eliminate unlikely cases of carditis,” Dr. Wong said. The health records were linked to a “population-based vaccination record” maintained by the government’s department of health.
About 10 control patients from among all hospitalized patients without carditis were matched by age, sex, and admission date to each of the 160 carditis cases. About 83% of cases and 92% of the controls were unvaccinated.
Among those who received the Pfizer-BioNTech vaccine, representing 12.5% of cases and 4.2% of controls, the estimated carditis incidence was 0.57 per 100,000 doses. For those who received CoronaVac, representing 4.4% of cases and 3.9% of controls, it was 0.31 per 100,000 doses.
In adjusted analysis, the odds ratios for carditis among Pfizer-BioNTech vaccine recipients, compared with unvaccinated controls, were 3.57 (95% confidence interval, 1.93-6.60) overall, 4.68 (95% CI, 2.25-9.71) for males, 2.22 (95% CI, 0.57-8.69) for females, 2.41 (95% CI, 1.18-4.90) for ages 18 and older, and 13.8 (95% CI, 2.86-110.4) for ages 12-17
Myocarditis accounted for most of the excess cases, with an overall OR of 9.29 (95% CI, 3.94-21.9). The OR reached only 1.06 (95% CI, 0.35-3.22) for pericarditis alone.
The case-control study is noteworthy for its design, which contrasts with the many recent case series and passive or active surveillance studies, and even the more robust population-based studies of vaccine-related myocarditis, observed Dongngan Truong, MD, University of Utah and Primary Children’s Hospital, both in Salt Lake City, who wasn’t part of the study.
Among its strengths, she said in an interview, are its linkage of comprehensive hospital and vaccination data sets for two different vaccines; and that it corroborates other research suggesting there is “something in particular about mRNA vaccination that seems to be associated with the development of myocarditis.”
Active surveillance in Israel
In an October 2021 report based on an Israeli Ministry of Health database covering up to May 2021, rates of myocarditis arising within 21 days of a second Pfizer-BioNTech dose in 16- to 19-year-olds reached about 1 per 6,637 males and 1 per 99,853 females. Those numbers compared with 1 per 26,000 males and 1 per 218,000 females across all age groups.
Now authors led by Dror Mevorach, MD, Hadassah Medical Center, Jerusalem, have published corresponding numbers from the same data base for myocarditis associated with the same vaccine in males and females aged 12-15.
Their research covers 404,407 people in that age group who received a first dose of the mRNA-based vaccine and 326,463 who received the second dose from June to October, 2021. Only 18 cases of myocarditis were observed within 21 days of either dose.
The estimated rates for males were 0.56 cases per 100,000 after a first dose and 8.09 cases per 100,000 after a second dose.
For females, the estimates were 0 cases per 100,000 after a first dose and 0.69 cases per 100,000 after a second dose.
“The pattern observed, mainly following the second vaccination in males, suggests causality,” the group wrote.
Leveraging passive surveillance reports
Another new report adds a twist to updated numbers from the U.S. Vaccine Adverse Event Reporting System (VAERS).
Prevalences derived from the passive-surveillance data base, known for including case records of inconsistent quality or completeness, are considered especially prone to reporting bias, the authors acknowledged.
The current analysis, however, plunges deep into VAERS-reported cases of presumed SARS-CoV-2 vaccine-associated myocarditis to help clarify “more of the characteristics of the patients and some of the treatments and short-term outcomes,” Matthew E. Oster, MD, MPH, said in an interview.
Dr. Oster, from the Centers for Disease Control and Prevention and Emory University, Atlanta, is lead author on the study’s Jan. 25, 2022, publication in JAMA.
The group reviewed charts and interviewed involved clinicians to adjudicate and document presentations, therapies, and the clinical course of cases reported as SARS-CoV-2 vaccine–associated myocarditis from December 2020 to August 2021. Out of the nearly 2000 reports, which were limited to patients younger than 30, the group identified 1,626 likely cases of such myocarditis arising within 7 days of a second mRNA vaccine dose.
The confirmed cases consistently represented higher prevalences than expected compared with prepandemic myocarditis claims data for both sexes and across age groups spanning 12-29 years.
For example, rates were highest for adolescent males – about 106 and 71 cases per million second doses of the Pfizer-BioNTech vaccine in those aged 16-17 and 12-16, respectively, for example. They were lowest for women aged 25-29, at 2.23 cases per million second Pfizer-BioNTech doses; the highest rate among females was about 11 per million for the 16-17 age group.
The observed rates, Dr. Oster said, represent an update to VAERS numbers published June 2021 in Morbidity and Mortality Weekly Report covering cases through June 2021.
“Overall, the general risk of having myocarditis from the vaccines is still extremely low. Even in the highest risk groups, it is still extremely low, and still lower than the risk of having cardiac complications from COVID,” he noted.
How do patients fare clinically?
From their chart reviews and interviews with case clinicians, Dr. Oster said, “we started to learn quickly that this is really a different type of myocarditis.”
For example, its onset, typically within a few days of the potential immunologic cause, was more rapid than in viral myocarditis, and its symptoms resolved faster, the report notes. Clinical presentations tended to be less severe, treatments not as intensive, and outcomes not as serious, compared with “the kind of typical viral myocarditis that most of the providers were used to taking care of in the past,” he said. “The pattern for these cases was very consistent.”
The study covered VAERS reports of suspected myocarditis arising within a week of first dose of a mRNA-based vaccine from the United States launch of public vaccination in December 2020 to August 2021, the CDC-based group reported. By then, more than 192 million people in the country had received either the Pfizer-BioNTech (age 12 or older) or Moderna (age 18 or older) vaccines.
Of the 1,991 reports of myocarditis, including 391 also involving pericarditis, 1,626 met the study’s definition for myocarditis on adjudication; about 82% of the latter cases were in males.
Based on the investigators’ review of charts and clinician interviews connected with 826 cases that met their definition of myocarditis in patients younger than 30, 89% reported “chest pain, pressure, or discomfort” and 30% reported dyspnea or shortness of breath. Troponin levels were elevated in 98%, 72% of patients who underwent electrocardiography showed abnormalities, and 12% of those with echocardiography had left ventricular ejection fractions less than 50%.
About 96% were hospitalized, and presenting symptoms resolved by discharge in 87% of those with available data, the group noted. Among patients with data on in-hospital therapy, they wrote, NSAIDs were the most common therapy, in 87%.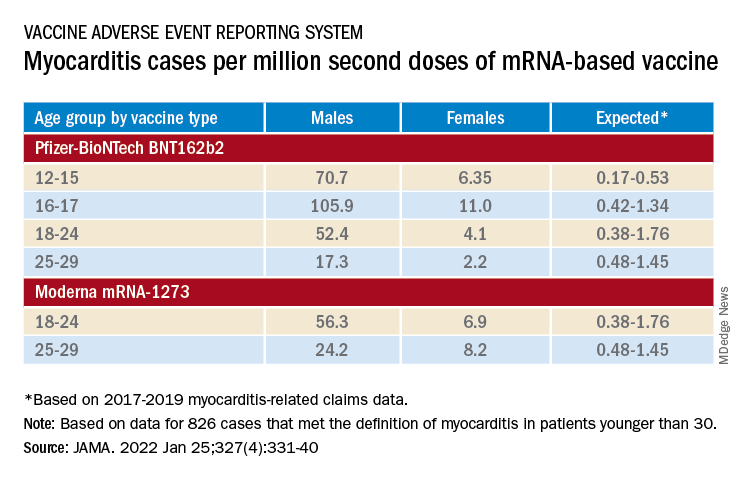
‘Mild and self-limiting’
The case-control study from Hong Kong didn’t specifically examine patients’ treatment and clinical course, but it does portray their vaccine-associated myocarditis as contrasting with more familiar viral myocarditis.
Patients with “typical” myocarditis tend to be “overall much sicker than what we’re seeing with myocarditis following vaccination,” Dr. Truong agreed. None of the 20 patients with myocarditis after Pfizer-BioNTech vaccination in Hong Kong were admitted to the intensive care unit. That, she added, suggests none required extracorporeal membrane oxygenation or vasoactive support, often necessary in viral myocarditis. “And they had shorter hospital stays.”
In contrast, Dr. Wong noted, 14 of the study’s unvaccinated patients required ICU admission; 12 of them died during the follow-up period. None with vaccine-related carditis died during the study’s follow-up. “We also showed that cases following [Pfizer-BioNTech] vaccination were all mild and self-limiting.”
Dr. Truong largely agreed that SARS-CoV-2 vaccine myocarditis and most myocarditis seen before the pandemic can be viewed as distinct clinical entities, “at least in the short term. I think we do need to follow these patients to look at more long-term outcomes, because at this point I don’t think we know the long-term implications. But at least in the short term, it seems like these patients are different, are much less sick, and recover pretty quickly overall.”
Dr. Oster emphasized that the many and varied acute and long-term hazards from contracting COVID-19 far outweigh any risk for myocarditis from vaccination. But for individuals who were hit with myocarditis soon after their first mRNA vaccine dose, who have already established their susceptibility, he and his colleagues would recommend that they “consider alternatives and not get the vaccine again.”
Dr. Oster reported no relevant financial relationships. Dr. Wong and colleagues did not report any relevant disclosures. Dr. Truong has previously disclosed serving as a consultant to Pfizer.
A version of this article first appeared on Medscape.com.
Doc accused of killing 14 patients in the ICU: Upcoming trial notes patient safety lapses
On Dec. 5, 2017, Danny Mollette, age 74, was brought to the emergency department of Mount Carmel West Medical Center in Columbus, Ohio, in critical condition. Staff inserted a breathing tube and sent him to the intensive care unit.
Mr. Mollette, who had diabetes, previously had been hospitalized for treatment of a gangrenous foot. When he arrived in the ICU, he was suffering from acute renal failure and low blood pressure, and had had two heart stoppages, according to a 2020 Ohio Board of Pharmacy report. He was placed under the care of William Husel, DO, the sole physician on duty in the ICU during the overnight shift.
Around 9:00 p.m., Dr. Husel discussed Mr. Mollette’s “grim prognosis” with family members at the patient’s bedside. He advised them that Mr. Mollette had “minutes to live” and asked, “How would you want him to take his last breath: on the ventilator or without these machines?”
In less than an hour, Mr. Mollette was dead. Some said that what happened in his case was similar to what happened with 34 other ICU patients at Mount Carmel West and Mount Carmel St. Ann’s in Westerville, Ohio, from 2014 through 2018 – all under Dr. Husel’s care.
Like Mr. Mollette, most of these gravely ill patients died minutes after receiving a single, unusually large intravenous dose of the powerful opioid fentanyl – often combined with a dose of one or more other painkillers or sedatives like hydromorphone – and being withdrawn from the ventilator. These deaths all occurred following a procedure called palliative extubation, the removal of the endotracheal tube in patients who are expected to die.
Mount Carmel fired Dr. Husel in December 2018 following an investigation that concluded that the opioid dosages he used were “significantly excessive and potentially fatal,” and “went beyond providing comfort.” His Ohio medical license was suspended. In February 2022, he is scheduled to go on trial in Columbus on 14 counts of murder.*
Hanging over the murder case against Dr. Husel is the question of how Mount Carmel, a 136-year-old Catholic hospital owned by the giant Trinity Health system, allowed this pattern of care to continue for so many patients over 4 years, and why numerous registered nurses and hospital pharmacists went along with Dr. Husel’s actions. Nearly two dozen RNs and two pharmacists involved in these cases have faced disciplinary action, mostly license suspension.
“The first time a patient died on a very high dose, someone should have flagged this,” said Lewis Nelson, MD, chair of emergency medicine at Rutgers New Jersey Medical School, Newark. “As soon as I see it the second time or 27th time, it doesn’t seem okay. There was a breakdown in oversight to allow this to continue. The hospital didn’t have guardrails in place.”
The Franklin County (Ohio) Prosecuting Attorney’s Office faces two big challenges in trying Dr. Husel for murder. The prosecutors must prove that the drugs Dr. Husel ordered are what directly caused these critically ill patients to die, and that he intended to kill them.
Federal and state agencies have cited the hospital system for faults in its patient safety systems and culture that were exposed by the Husel cases. An outside medical expert, Robert Powers, MD, a professor of emergency medicine at the University of Virginia, Charlottesville, testified in one of the dozens of wrongful death lawsuits against Mount Carmel and Dr. Husel that there was no record of anyone supervising Dr. Husel or monitoring his care.
There also are questions about why Mount Carmel administrators and physician leaders did not find out about Dr. Husel’s criminal record as a young man before hiring and credentialing him, even though the Ohio Medical Board had obtained that record. As a college freshman in West Virginia in 1994, Dr. Husel and a friend allegedly stole car stereos, and after a classmate reported their behavior, they built a pipe bomb they planned to plant under the classmate’s car, according to court records.
Dr. Husel pleaded guilty in 1996 to a federal misdemeanor for improperly storing explosive materials, and he received a 6-month sentence followed by supervision. He did not disclose that criminal conviction on his application for medical liability insurance as part of his Mount Carmel employment application, attorneys representing the families of his deceased patients say.
A Mount Carmel spokeswoman said the hospital only checks a physician applicant’s background record for the previous 10 years.
“I think [the credentialing process] should have been more careful and more comprehensive than it was,” Robert Powers testified in a September 2020 deposition. “This guy was a bomber and a thief. You don’t hire bombers and thieves to take care of patients.”
Mount Carmel and Trinity leaders say they knew nothing about Dr. Husel’s palliative extubation practices until a staffer reported Dr. Husel’s high-dose fentanyl orders in October 2018. However, three more Husel patients died under similar circumstances before he was removed from patient care in November 2018.
Mount Carmel and Trinity already have settled a number of wrongful death lawsuits filed by the families of Dr. Husel’s patients for nearly $20 million, with many more suits pending. The Mount Carmel CEO, the chief clinical officer, other physician, nursing, and pharmacy leaders, as well as dozens of nurses and pharmacists have been terminated or entered into retirement.
“What happened is tragic and unacceptable,” the Mount Carmel spokeswoman said in a written statement. “We have made a number of changes designed to prevent this from ever happening again. … Our new hospital leadership team is committed to patient safety and will take immediate action whenever patient safety is at issue.”
In January 2019, Mount Carmel’s then-CEO Ed Lamb acknowledged that “processes in place were not sufficient to prevent these actions from happening.” Mr. Lamb later said Mount Carmel was investigating whether five of the ICU patients who died under Dr. Husel’s care could have been treated and survived. Mr. Lamb stepped down in June 2019.
Before performing a palliative extubation, physicians commonly administer opioids and/or sedatives to ease pain and discomfort, and spare family members from witnessing their loved one gasping for breath. But most medical experts say the fentanyl doses Dr. Husel ordered – 500-2,000 mcg – were five to 20 times larger than doses normally used in palliative extubation. Such doses, they say, would quickly kill most patients – except those with high opioid tolerance – by stopping their breathing.
Physicians say they typically give much smaller doses of fentanyl or morphine, then administer more as needed if they observe the patient experiencing pain or distress. Mount Carmel’s 2016 guidelines for IV administration of fentanyl specified a dosage range of 50-100 mcg for relieving pain, and its 2018 guidelines reduced that to 25-50 mcg.
“If I perform a painful procedure, I might give 100 or 150 micrograms of fentanyl, or 500 or 600 for open heart surgery,” said Dr. Nelson of Rutgers, who also practices medical toxicology and addiction medicine. “But you’ll be intubated and monitored carefully. Without having a tube in your airway to help you breathe, those doses will kill you.”**
Mount Carmel West hired Dr. Husel in 2013 to work the late-night shift in its ICU. It was his first job as a full-fledged physician, after completing a residency and fellowship in critical care medicine at Cleveland Clinic. A good-looking and charismatic former high school basketball star, he was a hard worker and was popular with the ICU nurses and staff, who looked to him as a teacher and mentor, according to depositions of nurses and Ohio Board of Nursing reports.
In 2014, Dr. Husel was chosen by his hospital colleagues as physician of the year. He was again nominated in 2018. Before October 2018, there were no complaints about his care, according to the deposition of Larry Swanner, MD, Mount Carmel’s former vice president of medical affairs, who was fired in 2019.
“Dr. Husel is so knowledgeable that we would try to soak up as much knowledge as we could,” said Jason Schulze, RN, in a July 2020 deposition. Mr. Schulze’s license was suspended, however, that suspension was stayed for a minimum period of two years. This was in connection with his care of one of Dr. Husel’s ICU patients, 44-year-old Troy Allison, who died 3 minutes after Mr. Schulze administered a 1,000-microgram dose of fentanyl ordered by Dr. Husel in July 2018.
Dr. Husel’s winning personality and seeming expertise in the use of pain drugs, combined with his training at the prestigious Cleveland Clinic, may have lulled other hospital staff into going along with his decisions.
“They’re thinking, the guy’s likable and he must know what he’s doing,” said Michael Cohen, RPh, founder and president emeritus of the Institute for Safe Medication Practices. “But you can’t get fooled by that. You need a policy in place for what to do if pharmacists or nurses disagree with an order, and you need to have practice simulations so people know how to handle these situations.”
Dr. Husel’s criminal defense attorney, Jose Baez, said Dr. Husel’s treatment of all these palliative extubation patients, including his prescribed dosages of fentanyl and other drugs, was completely appropriate. “Dr. Husel practiced medicine with compassion, and never wanted to see any of his patients suffer, nor their family,” Mr. Baez said.
Most medical and pharmacy experts sharply disagree. “I’m a pharmacist, and I’ve never seen anything like those kinds of doses,” Mr. Cohen said. “Something strange was going on there.”
Complicating these issues, eight nurses and a pharmacist have sued Mount Carmel and Trinity for wrongful termination and defamation in connection with the Husel allegations. They strongly defend Dr. Husel’s and their care as compassionate and appropriate. Beyond that, they argue that the changes Mount Carmel and Trinity made to ICU procedures to prevent such situations from happening again are potentially harmful to patient care.
“None of the nurses ever thought that Dr. Husel did anything to harm his patients or do anything other than provide comfort care during a very difficult time,” said Robert Landy, a New York attorney who’s representing the plaintiffs in the federal wrongful termination suit. “The real harm came in January 2019, when there were substantial policy changes that were detrimental to patient care and safety.”
Many of these patient deaths occurred during a period when the Mount Carmel system and Trinity were in the process of closing the old Mount Carmel West hospital, located in the low-income, inner-city neighborhood of Columbus, and opening a new hospital in the affluent suburb of Grove City, Ohio.
“They were done with this old, worn-out, inner-city hospital and its patient base and wanted a brand-new sparkling object in the suburbs,” said Gerry Leeseberg, a Columbus attorney who is representing 17 families of patients who died under Dr. Husel’s care. “They may have directed less energy, attention, and resources to the inner-city hospital.”
The case of Danny Mollette illustrates the multiple issues with Mount Carmel’s patient safety system.
First, there was no evidence in the record that Mr. Mollette was in pain or lacked the ability to breathe on his own prior to Dr. Husel’s palliative extubation. He had received no pain medications in the hospital that day, according to the report of an Ohio Board of Nursing examiner in a licensure discipline action brought against nurse Jacob Deemer for his care of Mr. Mollette and two other ICU patients who died. Mr. Deemer said Dr. Husel told him that the patient had to be in pain given his condition.
After consulting with Mr. Mollette’s family at the bedside, Dr. Husel ordered Mr. Deemer to administer 1,000 mcg of fentanyl, followed by 2 mg of hydromorphone, and 4 mg of midzolam, a sedative. Mr. Deemer withdrew the drugs from the Pyxis dispensing cabinet, overriding the pharmacist preapproval system. He said Dr. Husel told him the pharmacist had said, “It is okay.”
Actually, according to the pharmacy board report, the pharmacist, Gregory White, wrote in the medical record system that he did not agree to the fentanyl order. But his dissent came as the drugs were being administered, the breathing tube was being removed, and the patient was about to die. Mr. White was later disciplined by the Ohio Board of Pharmacy for failing to inform his supervisors about the incident and preventing the use of those high drug dosages in the cases of Mr. Mollette and two subsequent Husel patients.
Then there are questions about whether the families of Mr. Mollette and other Husel patients were fully and accurately informed about their loved ones’ conditions before agreeing to the palliative extubation. Mr. Mollette’s son, Brian, told reporters in July 2019 that Dr. Husel “said my father’s organs were shutting down and he was brain damaged. In hindsight, we felt kind of rushed to make that decision.”
Plaintiff attorneys bringing civil wrongful death cases against Mount Carmel and Dr. Husel must overcome hurdles similar to those faced by prosecutors in the murder case against Dr. Husel. Even if the patients were likely to die from their underlying conditions, did the drugs hasten their deaths, and by how much? In the civil cases, there’s the additional question of how much a few more hours or days or weeks of life are worth in terms of monetary damages.
Another challenge in bringing both the criminal and civil cases is that physicians and other medical providers have certain legal protections for administering drugs to patients for the purpose of relieving pain and suffering, even if the drugs hasten the patients’ deaths – as long the intent was not to cause death and the drugs were properly used. This is known as the double-effect principle. In contrast, intentional killing to relieve pain and suffering is called euthanasia, and that’s illegal in the United States.
“There is no evidence that medication played any part in the death of any of these patients,” said Mr. Landy, who’s representing the nurses and pharmacists in the wrongful termination suit. “The only evidence we have is that higher dosages of opioids following extubation extend life, not shorten it.”
Dr. Husel, as well as the nurses and pharmacists who have faced licensure actions, claim their actions were legally shielded by the double-effect principle. But the Centers for Medicare & Medicaid Services, the Ohio Board of Nursing, and Ohio Board of Pharmacy haven’t accepted that defense. Instead, they have cited Mount Carmel, Dr. Husel, and the nurses and pharmacists for numerous patient safety violations, including administering excessive dosages of fentanyl and other drugs.
Among those violations is that many of Dr. Husel’s drug orders were given verbally instead of through the standard process of entering the orders into the electronic health record. He and the nurses on duty skipped the standard nonemergency process of getting preapproval from the pharmacist on duty. Instead, they used the override function on Mount Carmel’s automated Pyxis system to withdraw the drugs from the cabinet and avoid pharmacist review. In many cases, there was no retrospective review of the appropriateness of the orders by a pharmacist after the drugs were administered, which is required.
After threatening to cut off Medicare and Medicaid payments to Mount Carmel, CMS in June 2019 accepted the hospital’s correction plan, which restricted use of verbal drug orders and prohibited Pyxis system overrides for opioids except in life-threatening emergencies. The Ohio Board of Pharmacy hit Mount Carmel with $477,000 in fines and costs for pharmacy rules violations.
Under the agreement with CMS, Mount Carmel physicians must receive permission from a physician executive to order painkilling drugs that exceed hospital-set dosage parameters for palliative ventilator withdrawal. In addition, pharmacists must immediately report concerns about drug-prescribing safety up the hospital pharmacy chain of command.
“We have trained staff to ensure they feel empowered to speak up when appropriate,” the Mount Carmel spokeswoman said. “Staff members have multiple avenues for elevating a complaint or concern.”
Dr. Husel’s high dosages of fentanyl and other painkillers were well-known among the ICU nurses and pharmacists, who rarely – if ever – questioned those dosages, and went along with his standard use of verbal orders and overrides of the Pyxis system, according to depositions of nurses and pharmacists in the wrongful death lawsuits.
But the Mount Carmel nurses and pharmacists had a professional responsibility to question such dosages and demand evidence from the medical literature to support their use, according to hearing examiners at the nursing and pharmacy boards, who meted out licensure actions to providers working with Dr. Husel.
Nursing board hearing examiner Jack Decker emphasized those responsibilities in his November 30, 2020, report on nurse Deemer’s actions regarding three patients who died under Dr. Husel’s care in 2017 and 2018. Mr. Deemer’s license was suspended, however, that suspension was stayed for a minimum period of three years. Mr. Decker wrote that the ICU nurses had a professional responsibility to question Dr. Husel and, if necessary, refuse to carry out the doctor’s order and report their concerns to managers.
“Challenging a physician’s order is a difficult step even under ideal circumstances,” wrote Mr. Decker, who called Mount Carmel West’s ICU a “dysfunctional” environment. “But,” he noted, “when Mr. Deemer signed on to become a nurse, he enlisted to use his own critical thinking skills to serve as a patient protector and advocate. … Clearly, Mr. Deemer trusted Dr. Husel. But Dr. Husel was not to be trusted.”
While patient safety experts say these cases reveal that Mount Carmel had a flawed system and culture that did not train and empower staff to report safety concerns up the chain of command, they acknowledged that this could have happened at many U.S. hospitals.
“Sadly, I’m not sure it’s all that uncommon,” said Dr. Nelson of Rutgers. “Nurses and pharmacists have historically been afraid to raise concerns about physicians. We’ve been trying to break down barriers, but it’s a natural human instinct to play your role in the hierarchy.”
A version of this article first appeared on Medscape.com.
Corrections 2/1/22: An earlier version of this article misstated (*) the number of murder counts and (**) Dr. Nelson's area of practice.
This article was updated 2/2/22 to reflect the fact that the license suspensions of Mr. Deemer and Mr. Schulze were stayed.
Get free masks at grocery stores and pharmacies starting Jan. 28
The first batches are expected to arrive in some stores on Jan. 27, and many locations will begin offering them to customers on Jan. 28, according to NPR.
Meijer, which operates more than 250 groceries and pharmacies throughout the Midwest, has received about 3 million masks. Customers can pick up masks from the greeter stand at the store entrance.
More than 2,200 Kroger stores with pharmacies will give out free masks, with the first shipment expected to arrive on Jan. 27, a spokeswoman told NPR.
Walgreens will likely begin offering masks in some stores on Jan. 28, which will continue “on a rolling basis in the days and weeks following,” a spokesman told NPR.
Masks should arrive by Jan. 28 at Southeastern Grocers locations with in-store pharmacies, including Fresco y Mas, Harveys, and Winn-Dixie, according to CNN.
Hy-Vee received and began giving out masks on Jan. 21, and most stores with pharmacies were giving them out Jan. 26, according to Today.
CVS Pharmacy locations will offer free masks as early as Jan. 27, a spokesman told Today. That will include CVS Pharmacy locations inside Target and Schnucks.
Albertsons is “currently working to finalize details regarding inventory and distribution,” the chain told Today.
Rite Aid will have free masks in some stores at the end of the week, with all stores receiving them by early February, Today reported.
Walmart and Sam’s Club will offer free masks late next week at the earliest, according to NBC Chicago.
The Biden administration is sending out 400 million N95 masks from the Strategic National Stockpile. Each person can take up to three free masks, if they’re available, the Department of Health and Human Services has said.
The distribution of masks is meant to align with the CDC’s latest recommendation to wear an N95 or KN95 mask to prevent the spread of the highly transmissible Omicron variant. When worn correctly over the mouth and nose, the high-filtration masks are made to filter out 95% or more of airborne particles.
The Biden administration is also sending masks to community health centers and COVID-19 test kits directly to Americans. The programs are ramping up now and should be fully running by early February, NPR reported.
A version of this article first appeared on WebMD.com.
Jeopardy! champion’s parents sue doctors, hospital when patient dies after colectomy
Mr. Smith, who suffered from ulcerative colitis, underwent a colectomy on Jan. 15, 2021, at St. Rose Dominican Hospital–San Martin Campus in Las Vegas. At the time, the 24-year-old man was malnourished, extremely weak, and was having more than 10 bloody bowel movements a day, according to a Jan. 11, 2022, lawsuit filed by Smith’s parents.
The allegations state that, after the procedure, hospital staff did not provide Mr. Smith with anticoagulants and did not administer or suggest that Mr. Smith take anticoagulants upon his discharge on Jan. 19. On Jan. 29, 2021, Mr. Smith collapsed at home and his family called an ambulance. He was taken back to St. Rose where he died from bilateral pulmonary emboli.
Mr. Smith’s legal complaint claims that treatment by Smith’s surgeon, hospitalist, and nursing staff fell below the standard of care because they failed to administer anticoagulants following the surgery. After the surgery, Mr. Smith’s surgeon referenced “DVT/VTE prophylaxis/anticoagulation” in the record and another note read “already ordered,” according to Keith Beiermeister, MD, a colon and rectal surgeon retained by the Smiths’ attorney, Robert E. Murdock. However, the order section of the notes included no specific order for heparin or Lovenox (enoxaparin). A hospitalist who cared for Mr. Smith after the surgery also mentioned “DVT prophylaxis” in the progress notes, but the hospitalist did not order it nor ensure that anticoagulants were given, the lawsuit claims.
“In a surgery such as this, the standard of care requires both mechanical and chemical anticoagulation,” Dr. Beiermeister wrote in the complaint. “This is especially true after colectomy and with Brayden’s history. Anticoagulants and mechanical anticoagulation are needed to prevent emboli. The medical literature is clear that patients undergoing colorectal surgery as compared to general surgery have a significant increase in the risk of emboli. This is especially true with preexisting inflammation as is present in inflammatory bowel disease.”
A spokesman for St. Rose said the hospital does not comment on pending litigation.
Mr. Smith was a five-time Jeopardy! winner and gained national fame during his championship run. In a statement, Jeopardy! officials said the Jeopardy! family was “heartbroken by the tragic loss of Brayden Smith” and that he “will be missed.”
Surgeon must face second trial in stroke suit
A cardiovascular surgeon must face a second trial over claims that he performed an unnecessary surgery that caused a patient’s stroke, the Iowa Supreme Court has ruled.
William McGrew visited a Waterloo, Iowa, cardiovascular surgeon in 2014 after experiencing transient foggy vision in one eye. An ophthalmologist initially diagnosed Mr. McGrew with cataract, but he was referred to the surgeon to rule out other possibilities.
Because of Mr. McGrew’s age (69) and history of hypertension, the cardiovascular surgeon suspected carotid disease and recommended a CT angiogram to further investigate, according to a summary in the Iowa Supreme Court’s opinion.
The CT angiogram was performed at a local imaging center and read by a radiologist who interpreted it as showing 65% stenosis, or narrowing, of the right carotid artery. The surgeon did his own review and interpreted the results as showing 70% stenosis, according to court documents. The surgeon believed that McGrew was at significant risk for stroke and he recommended surgery, specifically a right carotid endarterectomy to remove the plaque from the right carotid artery. He advised McGrew of the surgery’s possible risks, the most common being a stroke.
The endarterectomy initially appeared successful, but the next morning, Mr. McGrew experienced facial droop and weakness on his left side. An MRI and CT scan showed that Mr. McGrew experienced a stroke on the right side of his brain. A CT angiogram showed that his right carotid artery was blocked. The surgeon performed another surgery to remove the carotid artery blockage, but the second surgery did not alleviate Mr. McGrew’s symptoms, according to court documents. Mr. McGrew remains wheelchair-bound, unable to move his left side, and requires nursing home care.
Mr. McGrew and his family later went to a neurologist who analyzed Mr. McGrew’s prior CT angiogram. He interpreted the angiogram as showing only 40% stenosis. The neurologist also asked a neuroradiologist to analyze the CT angiogram, and he assessed the stenosis at 32%. In his opinion, 40% stenosis was not significant to justify an endarterectomy, the neurologist told Mr. McGrew.
Mr. McGrew sued the surgeon and the radiologist in 2016, and later settled with the radiologist. The McGrews claimed that the surgeon negligently misinterpreted the CT angiogram and performed an ill-advised surgery that resulted in a stroke. The McGrews sought damages for pain and suffering, permanent loss of function, loss of income, past and future medical expenses, and loss of consortium.
At trial, attorneys for the surgeon asked the court to limit his and the radiologist’s testimonies, arguing that their opinions were not properly disclosed in expert reports. The trial court granted the motion, and jurors heard only a limited version of the testimony. In addition, some medical records were redacted. A jury found in the surgeon’s favor, deeming him not negligent.
The McGrews appealed. In a Jan. 21, 2022, opinion, the Iowa Supreme Court ruled that the trial court abused its discretion by not allowing the earlier testimonies. Justices said both the neurologist and the neuroradiologist should have been allowed to testify on the applicable standard of care. The district court also abused its discretion in preventing Mr. McGrew from introducing complete versions of the contemporaneous medical records, the court ruled.
Justices reversed the district court’s decision and remanded the case for a new trial.
Court: Patient must pay doc’s legal expenses
A patient must pay a physician about $20,000 in legal expenses after the patient’s malpractice suit was thrown out, an Arizona appeals court has ruled.
Scottsdale plastic surgeon Corwin Martin, MD, performed dental implant surgery on Penny Preszler in February 2012. Following the surgery, Ms. Preszler claimed numbness in her face and mouth, according to the appellate decision. She sued Dr. Martin and his practice for malpractice in 2015.
As the case continued, Ms. Preszler withdrew her first expert and disclosed a new expert. When Ms. Preszler’s second standard of care expert withdrew, she was given 30 days to disclose a new expert. When she failed to do so, Dr. Martin asked the court to dismiss the suit based on Ms. Preszler’s failure to disclose a proper standard of care expert.
She eventually presented a third expert, but Martin’s attorneys argued that the doctor was not a qualified expert under state law because he was board certified in periodontia, while Dr. Martin is board certified in oral and maxillofacial surgery. By this time, the case had gone on for 4 years.
When Ms. Preszler couldn’t come up with a fourth expert who was qualified, the court dismissed the case. The judge also awarded Dr. Martin $19,279.05 for expenses incurred in discovery related to Ms. Preszler’s first expert, attorneys’ fees, and expenses.
Ms. Preszler appealed, arguing that the periodontist was qualified to testify against Martin because he performed dental implant surgeries in the past without the board certification Dr. Martin obtained. In its Jan. 20, 2022, decision, a panel of the Arizona Court of Appeals upheld the decision, ruling that the expert was not qualified to opine. The patient must also pay the physician’s legal expenses as ordered by the lower court.
“[Ms.] Preszler has not shown the superior court abused its discretion in the award issued,” appellate judges wrote. “Three years after [Ms.] Preszler disclosed her first expert witness, that expert withdrew. [Dr.] Martin claimed substantial expenses relating to discovery addressing [Ms.] Preszler’s first expert, which were no longer beneficial given his withdrawal. ... [Ms.] Preszler has not shown that the expenses awarded to [Dr.] Martin were unreasonable or disproportionate to the time and costs expended regarding the withdrawn expert.”
A version of this article first appeared on Medscape.com.
Kids’ mask use linked with fewer childcare closings
Mask-wearing in childcare programs is linked with fewer COVID-19–related program closures, new data released suggest.
Researchers included 6,654 childcare professionals in a prospective, 1-year, longitudinal electronic survey study of home- and center-based childcare programs in all 50 states.
Findings by Thomas S. Murray, MD, PhD, with the department of pediatrics, Yale University, New Haven, Conn., and coauthors, were published in JAMA Network Open on Jan. 28, 2022.
They found that mask-wearing from the May 22, 2020, baseline to June 8, 2020, was associated with a 13% reduction in program closures within the following year (adjusted relative risk, 0.87; 95% confidence interval, 0.77-0.99). Continued mask-wearing throughout the 1-year follow-up was associated with a 14% reduction in program closures (aRR, 0.86; 95% CI, 0.74-1.00).
The authors said the evidence supports current masking recommendation in younger children provided by the Centers for Disease Control and Prevention.
They wrote: “This finding has important public health policy implications for families that rely on childcare to sustain employment.”
The benefits of masking in preventing COVID-19 transmission within kindergarten through 12th-grade classes are well documented. Masks are particularly important in areas where vaccinations are not widespread.
Masks can be worn safely by young children without harming respiratory function, studies have shown.
William Schaffner, MD, an infectious disease expert at Vanderbilt University, Nashville, Tenn., pointed out that the American Academy of Pediatrics has said there are no noteworthy effects on breathing function for most children.
“There’s been so much discussion about the contribution of masks to reducing the risk of COVID that it’s nice to have the data,” he said, adding that this is a relationship that has been difficult to study, but this analysis was able to make the connection with hard numbers.
“It’s an important outcome,” he said in an interview.
The authors pointed out there is evidence that school-age children can identify most emotions in masked faces.
They added that “2-year-old children recognize spoken words better through an opaque mask, compared with a clear face shield, suggesting verbal communication to infants is not harmed by face masks.”
Studies have shown that childhood infection with other respiratory viruses also decreased and asthma symptoms were not reported when preschool children wore masks and used other preventative steps.
The authors wrote that a potential reason for that may be that those who wear masks have less face touching, known to increase the spread of COVID-19.
Paloma Beamer, PhD, an engineer and exposure scientist at University of Arizona, Tucson, who also has a 3-year-old son who wears masks at his daycare center, said in an interview that she works closely with his school on training kids how to wear their masks because getting young children to keep them on and finding ones that fit is challenging.
“We need layered controls and protections in place at schools as much as possible,” she said, adding that the authors didn’t mention ventilation, but that’s another important component as well.
“We’re fortunate in Arizona that we are in an old school and the windows are open as much as possible,” she said.
She said this study shows that “masks are a great form of additional control.” Her son is on his third quarantine this month after three kids tested positive, she added.
She said: “I think these newer variants perhaps make the findings of this study more compelling and it will be interesting to see if the researchers do a follow-up study.”
Strengths of the study include that it utilized prospective data from a large national cohort of childcare professionals. Additionally, the retention rate was high at 1 year. And the self-reported information likely gives better information than looking at policies that may or may not be well followed.
Limitations include potential reporting bias because the self-reports were not independently confirmed. Also, family behavior outside childcare, such as social gatherings where masking is not enforced, also influence COVID-19 cases when children gather and may affect the numbers of closures.
Having the option of childcare centers benefits kids with in-person early education and social interactions with staff, the authors noted. The centers also help parents return to work without interruptions at home.
“Our findings support current national recommendations endorsed by many local and state governments for masking children 2 years and older in childcare programs when community COVID-19 transmission levels are elevated,” the authors wrote.
Dr. Schaffner said the results have implications outside of childcare centers and should be included in discussions of masking in schools and in the general public.
All phases of this study were supported by and coauthors report grants from the Andrew & Julie Klingenstein Family Fund, Esther A. & Joseph Klingenstein Fund, Heising-Simons Foundation, W.K. Kellogg Foundation, Foundation for Child Development, Early Educator Investment Collaborative, and Scholastic. The study was partially funded by the Yale Institute for Global Health. Dr. Schaffner and Dr. Beamer reported no relevant financial relationships.
FROM JAMA NETWORK OPEN
Infectious disease pop quiz: Clinical challenge #12 for the ObGyn
What are the best office-based tests for the diagnosis of bacterial vaginosis?
Continue to the answer...
In patients with bacterial vaginosis, the vaginal pH typically is elevated in the range of 4.5. When a drop of potassium hydroxide solution is added to the vaginal secretions, a characteristic fishlike (amine) odor is liberated (positive “whiff test”). With saline microscopy, the key findings are a relative absence of lactobacilli in the background, an abundance of small cocci and bacilli, and the presence of clue cells, which are epithelial cells studded with bacteria along their outer margin.
- Duff P. Maternal and perinatal infections: bacterial. In: Landon MB, Galan HL, Jauniaux ERM, et al. Gabbe’s Obstetrics: Normal and Problem Pregnancies. 8th ed. Elsevier; 2021:1124-1146.
- Duff P. Maternal and fetal infections. In: Resnik R, Lockwood CJ, Moore TJ, et al. Creasy & Resnik’s Maternal-Fetal Medicine: Principles and Practice. 8th ed. Elsevier; 2019:862-919.

Dr. Edwards is a Resident in the Department of Medicine, University of Florida College of Medicine, Gainesville.

Dr. Duff is Professor of Maternal-Fetal Medicine, Department of Obstetrics and Gynecology, University of Florida College of Medicine, Gainesville.
The authors report no financial relationships relevant to this article.
Dr. Edwards is a Resident in the Department of Medicine, University of Florida College of Medicine, Gainesville.
Dr. Duff is Professor of Maternal-Fetal Medicine, Department of Obstetrics and Gynecology, University of Florida College of Medicine, Gainesville.
The authors report no financial relationships relevant to this article.
What are the best office-based tests for the diagnosis of bacterial vaginosis?
Continue to the answer...
In patients with bacterial vaginosis, the vaginal pH typically is elevated in the range of 4.5. When a drop of potassium hydroxide solution is added to the vaginal secretions, a characteristic fishlike (amine) odor is liberated (positive “whiff test”). With saline microscopy, the key findings are a relative absence of lactobacilli in the background, an abundance of small cocci and bacilli, and the presence of clue cells, which are epithelial cells studded with bacteria along their outer margin.
- Duff P. Maternal and perinatal infections: bacterial. In: Landon MB, Galan HL, Jauniaux ERM, et al. Gabbe’s Obstetrics: Normal and Problem Pregnancies. 8th ed. Elsevier; 2021:1124-1146.
- Duff P. Maternal and fetal infections. In: Resnik R, Lockwood CJ, Moore TJ, et al. Creasy & Resnik’s Maternal-Fetal Medicine: Principles and Practice. 8th ed. Elsevier; 2019:862-919.
Another winter for our discontent
Here we are. Again. It’s cold and it’s gray. The sun rises late and sets early, so that it feels like midnight by 8 p.m. Indoor venues are risky with the highly contagious Omicron variant, and I feel like we are all pushing the replay button on 2021’s miserable winter.
In some ways, it’s worse: In 2021 we had the hope that vaccines would pull us out of the pandemic and we had guidance on all that we should not be doing. In January, we were gaming the various Internet sites to get a coveted vaccine for ourselves or our family and friends, then lining up to get jabbed. We did not yet know that it wouldn’t be enough – that we’d need boosters, that Delta and Omicron would defy the vaccines. Yes, the vaccines work miracles to prevent severe disease and death, but the worry of passing the virus to someone who is vulnerable or unvaccinated(!), or both, remains – and now we can wonder how we’ll ever get out of this mess with hopeful talk of an endemic, while we wait on the next variant. I like certainty, and this pandemic is one big screaming reminder that certainty about anything is just a pleasant notion, death and taxes excluded, of course.
Kris Lukish, vice president of human resources at Johns Hopkins Hospital in Baltimore, started an update to the hospital employees with: “As we begin 2022, it feels like we are experiencing dejà vu, or ‘Groundhog Day,’ or ‘50 First Dates.’ In ‘50 First Dates,’ Drew Barrymore wakes up each day reliving one specific day. It never changes. I realize our world may seem a little like that right now. We thought we’d turned a corner with COVID, and instead we saw a rapid rise in cases and hospitalizations due to the Omicron variant, higher than in previous surges.”
In 2021, many of us skipped holiday travel and ate outdoors. My morning coffee group moved to Zoom and it wasn’t until late spring, when community rates of COVID nose-dived, that I began seeing patients in my office for the first time in over a year. Since many of my patients are over 60, I tested myself with a home antigen test before going into the office. I changed my schedule so sessions began on the half-hour to be sure the suite’s waiting room would be empty, and I purchased an air purifier, cracked the window open, and figured everyone was as safe as we could reasonably be.
By the first Monday in January 2022, the positivity rate in Maryland was just shy of 30%. Twitter circulated anecdotes about false negatives with the home antigen test kits, and I decided it was safest to return to all-virtual appointments.
Mona Masood, DO, is cofounder of the Physician Support Line, a call-in service for doctors that started in March 2020. She has noted a change in the problems physicians face.
“We’re seeing a lot of empathy fatigue,” Dr. Masood said. “It’s not unexpected with a prolonged situation like this – the trauma has doctors in survival mode and they need to be present for themselves, their families, and their patients. People are emotionally drained, and we’re stretching them to the limit. Now at the front lines, doctors are getting a lot of backlash. There are the conspiracy theories, and people who challenge their knowledge and training and it leads them to ask if they should be doing this work. and these are large decisions that are being made in a specific context.
“The other thing we’re hearing is from trainees – residents and fellows – who are expected to carry a lot of work on the COVID units. Some are being told that they can’t graduate because they haven’t finished their other training requirements. This type of systemic issue produces moral injury.”

Dr. Masood talked about what running the support line has been like for her. “I know people want to give more in a catastrophe, and I was realistic that the enthusiasm might die off. I would go as long as psychiatrists volunteer, and the most incredible thing is that it hasn’t stopped. Some of the original people are no longer with us, but others have come aboard, and it’s been incredible to be a part of this.”
In her Jan. 26, 2022, newsletter, epidemiologist Katelyn Jetelina, PhD, MPH, tried to be reassuring about the future. “In order to know how this will end, we need to look at how other pandemics ended,” Dr. Jetelina wrote. “First, recognize the last part of that sentence ... pandemics end. Every epi curve comes down. This pandemic will end, too. Hold that fact close to you.”
She wrote about the three ways that pandemics end. The SARS pandemic of 2002 lasted 1.5 years as public health measures were effective, in large part because the disease was spread only by symptomatic patients. Vaccines offer a second way to end pandemics, as they have for polio and smallpox. “If the globe works together, we could possibly eradicate SARS-CoV-2 with vaccines. [Now that we have numerous animal reservoirs, though, this is close to impossible.]”
Finally, Dr. Jetelina noted that the 1918 flu changed from a pandemic situation to being endemic. “Over time, the virus attenuated, it became less severe.” Society acclimates to a virus with a low mortality rate. “The vast majority of scientists think an endemic state is the future of SARS-CoV-2. I agree.” And she goes on to define endemic as a steady state, but not the absence of suffering. She likens it to malaria and tuberculosis, illnesses with high global mortality.
“An endemic will come without an announcement or headlines, we won’t know we’re there until well after we’ve arrived.” She wrote of the uncertainty that faces us moving forward: We don’t know how much, or how long, immunity from Omicron infections will last, or if future variants will cause more or less severe disease. She casted her vote for global vaccinations, boosters, masks, better ventilation, communication, empathy, and tolerance to end the pandemic.
In Maryland, hospitalizations and positivity are starting to decline from the postholiday surge. I have figured out that I am not good at predicting what will happen next, and the experts don’t seem to be much better. I’d like a headline ending, the kind we looked to be heading toward last June.
I’ve told my patients who want to come in person that I will reassess in March. We have written our own rules, and mine are somewhere in the middle – I don’t go to public indoor spaces unmasked, but I do see vaccinated family and friends in our homes without masks. I don’t want to be responsible for transmitting a potentially fatal illness to a vulnerable patient. Honestly, this makes no sense, but since there is a video option, I feel I should not risk passing a potentially lethal virus to my patients. I just hope I’m not writing this same article again in January 2023.
Dr. Miller is a coauthor of “Committed: The Battle Over Involuntary Psychiatric Care” (Baltimore: Johns Hopkins University Press, 2016). She has a private practice and is assistant professor of psychiatry and behavioral sciences at Johns Hopkins. Dr. Miller has no conflicts of interest.
Here we are. Again. It’s cold and it’s gray. The sun rises late and sets early, so that it feels like midnight by 8 p.m. Indoor venues are risky with the highly contagious Omicron variant, and I feel like we are all pushing the replay button on 2021’s miserable winter.
In some ways, it’s worse: In 2021 we had the hope that vaccines would pull us out of the pandemic and we had guidance on all that we should not be doing. In January, we were gaming the various Internet sites to get a coveted vaccine for ourselves or our family and friends, then lining up to get jabbed. We did not yet know that it wouldn’t be enough – that we’d need boosters, that Delta and Omicron would defy the vaccines. Yes, the vaccines work miracles to prevent severe disease and death, but the worry of passing the virus to someone who is vulnerable or unvaccinated(!), or both, remains – and now we can wonder how we’ll ever get out of this mess with hopeful talk of an endemic, while we wait on the next variant. I like certainty, and this pandemic is one big screaming reminder that certainty about anything is just a pleasant notion, death and taxes excluded, of course.
Kris Lukish, vice president of human resources at Johns Hopkins Hospital in Baltimore, started an update to the hospital employees with: “As we begin 2022, it feels like we are experiencing dejà vu, or ‘Groundhog Day,’ or ‘50 First Dates.’ In ‘50 First Dates,’ Drew Barrymore wakes up each day reliving one specific day. It never changes. I realize our world may seem a little like that right now. We thought we’d turned a corner with COVID, and instead we saw a rapid rise in cases and hospitalizations due to the Omicron variant, higher than in previous surges.”
In 2021, many of us skipped holiday travel and ate outdoors. My morning coffee group moved to Zoom and it wasn’t until late spring, when community rates of COVID nose-dived, that I began seeing patients in my office for the first time in over a year. Since many of my patients are over 60, I tested myself with a home antigen test before going into the office. I changed my schedule so sessions began on the half-hour to be sure the suite’s waiting room would be empty, and I purchased an air purifier, cracked the window open, and figured everyone was as safe as we could reasonably be.
By the first Monday in January 2022, the positivity rate in Maryland was just shy of 30%. Twitter circulated anecdotes about false negatives with the home antigen test kits, and I decided it was safest to return to all-virtual appointments.
Mona Masood, DO, is cofounder of the Physician Support Line, a call-in service for doctors that started in March 2020. She has noted a change in the problems physicians face.
“We’re seeing a lot of empathy fatigue,” Dr. Masood said. “It’s not unexpected with a prolonged situation like this – the trauma has doctors in survival mode and they need to be present for themselves, their families, and their patients. People are emotionally drained, and we’re stretching them to the limit. Now at the front lines, doctors are getting a lot of backlash. There are the conspiracy theories, and people who challenge their knowledge and training and it leads them to ask if they should be doing this work. and these are large decisions that are being made in a specific context.
“The other thing we’re hearing is from trainees – residents and fellows – who are expected to carry a lot of work on the COVID units. Some are being told that they can’t graduate because they haven’t finished their other training requirements. This type of systemic issue produces moral injury.”
Dr. Masood talked about what running the support line has been like for her. “I know people want to give more in a catastrophe, and I was realistic that the enthusiasm might die off. I would go as long as psychiatrists volunteer, and the most incredible thing is that it hasn’t stopped. Some of the original people are no longer with us, but others have come aboard, and it’s been incredible to be a part of this.”
In her Jan. 26, 2022, newsletter, epidemiologist Katelyn Jetelina, PhD, MPH, tried to be reassuring about the future. “In order to know how this will end, we need to look at how other pandemics ended,” Dr. Jetelina wrote. “First, recognize the last part of that sentence ... pandemics end. Every epi curve comes down. This pandemic will end, too. Hold that fact close to you.”
She wrote about the three ways that pandemics end. The SARS pandemic of 2002 lasted 1.5 years as public health measures were effective, in large part because the disease was spread only by symptomatic patients. Vaccines offer a second way to end pandemics, as they have for polio and smallpox. “If the globe works together, we could possibly eradicate SARS-CoV-2 with vaccines. [Now that we have numerous animal reservoirs, though, this is close to impossible.]”
Finally, Dr. Jetelina noted that the 1918 flu changed from a pandemic situation to being endemic. “Over time, the virus attenuated, it became less severe.” Society acclimates to a virus with a low mortality rate. “The vast majority of scientists think an endemic state is the future of SARS-CoV-2. I agree.” And she goes on to define endemic as a steady state, but not the absence of suffering. She likens it to malaria and tuberculosis, illnesses with high global mortality.
“An endemic will come without an announcement or headlines, we won’t know we’re there until well after we’ve arrived.” She wrote of the uncertainty that faces us moving forward: We don’t know how much, or how long, immunity from Omicron infections will last, or if future variants will cause more or less severe disease. She casted her vote for global vaccinations, boosters, masks, better ventilation, communication, empathy, and tolerance to end the pandemic.
In Maryland, hospitalizations and positivity are starting to decline from the postholiday surge. I have figured out that I am not good at predicting what will happen next, and the experts don’t seem to be much better. I’d like a headline ending, the kind we looked to be heading toward last June.
I’ve told my patients who want to come in person that I will reassess in March. We have written our own rules, and mine are somewhere in the middle – I don’t go to public indoor spaces unmasked, but I do see vaccinated family and friends in our homes without masks. I don’t want to be responsible for transmitting a potentially fatal illness to a vulnerable patient. Honestly, this makes no sense, but since there is a video option, I feel I should not risk passing a potentially lethal virus to my patients. I just hope I’m not writing this same article again in January 2023.
Dr. Miller is a coauthor of “Committed: The Battle Over Involuntary Psychiatric Care” (Baltimore: Johns Hopkins University Press, 2016). She has a private practice and is assistant professor of psychiatry and behavioral sciences at Johns Hopkins. Dr. Miller has no conflicts of interest.
Marijuana use during pregnancy raised risk of adverse neonatal outcomes
Women who used marijuana during pregnancy were at increased risk for adverse neonatal outcomes, based on data from a meta-analysis of nearly 60,000 individuals.
Marijuana misuse remains a top substance use disorder and studies of prenatal use show a prevalence as high as 22% worldwide, wrote Greg J. Marchand, MD, of the Marchand Institute for Minimally Invasive Surgery, Mesa, Ariz., and colleagues.
“The prevalence of marijuana use during pregnancy may continue to increase, given that there is a suggested association between legalized recreational marijuana and increased use in prenatal and postpartum periods,” they wrote. “Remarkably, 34%-60% of individuals who use marijuana keep using it during pregnancy,” and many women cite a belief that marijuana is safe to use while pregnant, they noted.
Cannabinoid receptors are present in the developing fetus by the start of the second trimester, and exposure to exogenous cannabinoids may be associated with changes in the prefrontal cortex, including development and function, the researchers said. However, previous studies of an association between maternal marijuana use and poor neonatal outcomes have been inconsistent, they added.
In a study published in JAMA Network Open, the researchers identified 16 interventional and observational studies including 59,138 patients; each study included pregnant women who were exposed to marijuana, compared with those not exposed to marijuana, along with neonatal outcomes. The data selection included studies published until Aug. 16, 2021, and 10 studies were published in 2015 or later.
Overall, the risk for seven adverse neonatal outcomes was significantly increased among women who were exposed to marijuana during pregnancy, compared with those not exposed. The researchers identified increased risk for birth weight less than 2,500 g (relative risk, 2.06; P = .005), small for gestational age (RR, 1.61; P < .001), preterm delivery (RR, 1.28; P < .001), and NICU admission (RR, 1.38; P < .001). In addition, they found significant differences in mean birth weight (mean difference, −112.30 g; P < .001), Apgar score at 1 minute (mean difference, −0.26; P = .002), and infant head circumference (mean difference, −0.34cm; P = .02) between women who used marijuana during pregnancy and those who did not.
The study findings were limited by several factors, including the assessment of only cohort studies, which might suffer from bias given their retrospective designs, the researchers noted. Other limitations included the reliance on self-reports, the inability to adjust for tobacco/marijuana coexposure, and the lack of differentiation between levels of use and between different types of marijuana ingestion, they added.
However, the results support an association between marijuana use and adverse neonatal outcomes, and the researchers recommended additional studies of both maternal and neonatal outcomes associated with marijuana exposure. “Given increasing marijuana legalization and use worldwide, raising awareness and educating patients about these adverse outcomes may help to improve neonatal health,” they concluded.
New research prompted new review
The motivation to conduct this analysis at this time was prompted by the publication of several new, high-quality studies on the use of marijuana in pregnancy, according to Dr. Marchand. “It’s been a few years since a full analysis of all of the available data had been done, so we decided it was time to see if the old conclusions still held,” he said in an interview.
Dr. Marchand said he was surprised to see such a clear connection to preterm deliveries and lower birth weights. “When we perform a meta-analysis, we use all of the available data, and some important studies performed as recently as the past few years provided the depth of evidence behind these connections,” he said. “We didn’t have that level of evidence the last time this topic was studied only a few years ago,” he added.
The study is the largest meta-analysis on this topic to date, so the message to clinicians is highly significant, Dr. Marchand said. That message is “that we now have a very high level of evidence to say that smoking marijuana during pregnancy is harmful, and we (physicians especially) can no longer state that we just don’t know,” he said. “This is going to mean that deciding to smoke marijuana during your pregnancy is also deciding to do something that can harm your baby,” he emphasized. “This paper also will force some difficult decisions for mothers who use marijuana to treat medical problems, and there may not be good substitute treatments for some of these conditions, especially chronic pain and anxiety,” Dr. Marchand noted. “This will set up a difficult risk-versus-benefits situation, where these mothers, ideally with the help of their physicians, will have to decide if the risks of stopping marijuana outweigh the possible harm to the unborn baby,” he said.
As for additional research, long-term studies to assess behavioral changes as exposed children grow up would be beneficial, Dr. Marchand said. Such studies “could really help us balance the risk of marijuana exposure in pregnancy, especially if it is being used to treat serious medical conditions,” he noted.
Findings are a call to action
The view among many women that prenatal cannabis use is safe and without consequence “is a false narrative perpetuated by a combination of outdated evidence and recent changes to state-level cannabis policies,” wrote Kara R. Skelton, PhD, of Towson (Md.) University, and Sara E. Benjamin-Neelon, PhD, of Johns Hopkins University, Baltimore, in an accompanying editorial.
The findings from the current study add to the growing evidence that prenatal cannabis use is associated with adverse birth outcomes, they wrote. “Clinician-directed communication about cannabis has been criticized by pregnant women, with recent findings supporting a need for increased cannabis communication by clinicians,” and not only clinicians, but all health professionals who encounter women who are pregnant or attempting pregnancy should not miss the opportunity to communicate the risks of prenatal cannabis use, they emphasized.
The authors highlighted some of the current study’s limitations, including the inability to determine a dose-response association, the reliance on self-reports, and the lack of adjustment for tobacco/marijuana coexposure. However, they noted that the inclusion of recent studies (10 published in 2015 or later) strengthens the results because of the significant increase in the potency of Δ-9-tetrahydrocannabinol (THC), the main psychoactive ingredient in cannabis, in recent decades.
“We urge clinicians, public health professionals, and policy makers to carefully consider the consequences of in utero cannabis exposure identified by Marchand et al. and partner to ensure prioritization of infant and child health during this time of precipitous cannabis legalization and commercialization,” the authors emphasized. “Without necessary safeguards to protect neonatal health, prenatal cannabis use poses a substantial threat to current and future generations of children,” they wrote.
The study received no outside funding. The researchers had no financial conflicts to disclose. The editorialists had no financial conflicts to disclose.
FROM JAMA NETWORK OPEN