User login
Things We Do for No Reason™: Routinely Prescribing Transfusion Premedication To Prevent Acute Transfusion Reactions

Inspired by the ABIM Foundation’s Choosing Wisely® campaign, the “Things We Do for No Reason™” series reviews practices which have become common parts of hospital care but which may provide little value to our patients. Practices reviewed in the TWDFNR series do not represent clear-cut conclusions or clinical practice standards, but are meant as a starting place for research and active discussions among hospitalists and patients. We invite you to be part of that discussion.
CLINICAL SCENARIO
A 68-year-old woman with a known history of myelodysplastic syndrome is admitted for fatigue and shortness of breath on exertion. Her hemoglobin concentration decreased from 9.1 g/dL to 6.5 g/dL. Her physical examination is unremarkable except for mild tachycardia with a heart rate of 105. She is scheduled to receive her first red blood cell (RBC) transfusion. The hospitalist orders premedication with acetaminophen and/or diphenhydramine to prevent an acute transfusion reaction.
BACKGROUND
The most frequent complications of blood transfusion are allergic transfusion reactions (ATRs) and febrile nonhemolytic transfusion reactions (FNHTRs), with a combined incidence of approximately 1%-4% per transfusion.1 ATRs may range in severity from mild urticaria to life-threatening anaphylaxis. FNHTRs manifest as a fever (oral temperature greater than or equal to 38°C/100.4°F and an increase of at least 1°C/1.8°F from pretransfusion values) or chills/rigors. With approximately 17 million blood transfusions, including RBCs, plasma, platelet, and cryoprecipitate components, administered annually in the United States, often to those with severe illnesses, ATRs and FNHTRs confer a substantial public health burden. Currently, the prevalence of premedication to prevent acute transfusion reactions in the United States and Canada is variable, ranging from 1.6% in one Canadian institution to as high as 80% in one large US hospital.2,3
WHY YOU MIGHT THINK PREMEDICATION IS HELPFUL TO PREVENT TRANSFUSION REACTIONS
FNHTRs are thought to be caused by cytokines elaborated by donor leukocytes that remain in blood products and/or by recipient antibodies reacting with donor leukocytes.1 While the clinical course is self-limited, these reactions can cause patients significant distress. The rationale behind acetaminophen premedication is to blunt the febrile response.
ATRs are usually mild, but anaphylaxis (which may include respiratory compromise, hypotension, and even death) can occur. They are caused by recipient histamine release in response to exposure to donor plasma proteins.1 This provides the theoretical rationale for antihistamine (eg, diphenhydramine) premedication as a prevention strategy.
Data on pretransfusion medication originate from the mid-20th century. In 1952, Ferris et al. published results showing a significant decrease in both febrile and ATRs when blood bottles were injected with an antihistamine.4 This was followed, in 1956, by Winter and Taplin’s further demonstration that both febrile and allergic reactions were significantly reduced when patients received units of blood injected with both oral acetylsalicylic acid and an antihistamine (chlorprophenpyridamine).5 These trials notably lacked appropriate controls and blinding, and numerous transfusion practice changes have taken place during the subsequent decades.
WHY PREMEDICATION TO PREVENT TRANSFUSION REACTION IS NOT HELPFUL
In the past 20 years, three double-blind randomized controlled trials published show that premedication with a combination of acetaminophen and an antihistamine (either diphenhydramine or chlorpheniramine) does not reduce the risk of ATR and FNHTR. The first study, published in 2002, randomized 51 patients with hematological malignancies receiving prestorage-irradiated, leukocyte-reduced, single-donor apheresis platelets to premedication with either acetaminophen and diphenhydramine or placebo.6 Patients with a history of either ATR or FNHTR were included, but patients with a history of hemolytic transfusion reaction were excluded.6 The study found that premedication did not significantly lower the incidence of these transfusion reactions (15.4%) as compared with placebo (15.2%; P = .94).6
In a larger study published in 2008, Kennedy et al. randomized 315 patients with hematological malignancies receiving RBC or platelet transfusion to either pretransfusion acetaminophen and diphenhydramine or placebo.7 Patients with a documented history of an ATR or FNHTR were excluded, which may have contributed to the lower incidence compared with the aforementioned earlier clinical trial. There was no significant difference in the overall rate of transfusion reactions between the two groups (1.44 per 100 transfusions vs 1.51 per 100 transfusions, P = .433). When the rates of ATRs and FNHTRs were analyzed separately, there was no significant difference between the treatment and control groups for either reaction type (P = .899 and P = .084, respectively). There was a trend toward a reduction in FNHTRs, but the authors calculated that we would need to premedicate approximately 344 transfusions to prevent one febrile reaction.7
A more recent study published in 2018 evaluated 147 Thai children and adolescents with thalassemia receiving leukoreduced blood products.8 Researchers randomized them to either premedication with acetaminophen and chlorpheniramine or placebo.8 The incidences of FNHTR were not statistically significantly different: 6.9% in the intervention group, compared with 9.5% in the placebo group (P = .565).8 These three studies constitute the best currently available evidence and suggest that pretransfusion antihistamines and/or antipyretics are not effective.
Beyond a lack of proven benefit, the use of premedication is not without risk. Diphenhydramine, the most commonly used antihistamine for premedication, can cause cognitive impairment, sedation, and delirium.9 Such adverse effects are potentially heightened in the elderly and seriously ill populations where transfusion commonly occurs. Acetaminophen, although generally safe, can result in hepatotoxicity in patients who are fasting, regularly consume alcohol, or have underlying liver disease. Since there is both a lack of clinical benefit and potential for harm, avoid premedication.
WHAT YOU SHOULD DO INSTEAD
Rather than pretreating the patient, consider modifying the blood product selected for transfusion. Administering platelet and/or RBC components with certain modifications (a product-centered approach) is effective at reducing mild transfusion reactions.10 A well-known product-centered modification method includes prestorage leukoreduction of RBC and platelet components to remove donor leukocytes to a level <5 × 10⁶ per unit. This intervention reduces the incidence of FNHTRs by approximately 50%.11 A recent large, national survey demonstrated 90% of institutions (2,712/3,032) use universal leukoreduction.12 This widely employed and effective prevention strategy has likely helped reduce FNHTRs nationwide, so there are now fewer to prevent.12
Irradiation is another common modification of blood components used to prevent transfusion-associated graft-vs-host-disease (TA-GVHD) for recipients with significantly compromised cellular immunity. TA-GVHD is a rare but nearly universally fatal delayed complication of transfusion. Note that irradiation does not prevent FNHTRs or ATRs.
Under the premise that platelet-related allergic reactions are the result of recipient reaction to donor plasma proteins, reducing the plasma volume administered should decrease the coadministration of allergy-inducing plasma proteins.1 Reducing plasma volume can be achieved by two means: using a platelet additive solution that replaces two-thirds of the plasma content in a platelet unit or plasma removal by centrifugation. These two strategies decrease the plasma volume from 300 mL to ~100 mL per unit transfused, which effectively reduces the incidence of platelet-associated ATRs by 50%.10 For patients with recurrent severe ATRs, blood banks can wash RBC and platelet components, virtually removing all plasma proteins from the units.13 Epinephrine should be available at the bedside for patients with a history of severe ATRs.
Volume reduction and washing do negatively affect the quality of the unit: Platelets activate during the process, and transfusions result in a 20%-30% reduction in posttransfusion platelet counts.14 In addition, product manipulation takes significant blood bank processing time and results in an open system with greater risk of bacterial contamination, leading to a significantly shortened product expiration (24 hours for washed RBCs and 4 hours for washed or volume-reduced platelets).1 Reserve volume reduction and washing for patients with a history of multiple recurrent or severe ATRs, respectively. Platelet additive solution results in a reduction in posttransfusion count but does not require additional manipulation. Platelet additive solution products may not be available at many centers but could be used selectively (similar to volume reduction) depending on availability and cost.
Avoiding unnecessary transfusions is an essential strategy to prevent ATRs and FNHTRs. Evidence-based patient blood management (PBM), now considered the standard of care, is defined as optimizing anemia and hemostasis in patients with the goal of restricting blood transfusions. Evidence supporting restrictive transfusion strategies continues to accumulate, and numerous hospital systems have implemented PBM programs resulting in a significant nationwide reduction in transfusions since 2008. An effective PBM program reduces unnecessary transfusions and subsequent transfusion reactions.
Finally, appropriate close monitoring of patients undergoing blood transfusion and after completion of a transfusion is highly important. Paying close attention to signs and symptoms can alert the transfusing team to a developing adverse reaction and should prompt immediate cessation of an ongoing transfusion, the critical first step when a transfusion reaction is suspected. Hospitalists may need to take additional actions to treat the patient (eg, antihistamines after an ATR manifests or a diuretic in the setting of transfusion-associated circulatory overload). Report suspected transfusion reactions to the transfusion service. Failing to report a suspected transfusion reaction can lead to catastrophic consequences that can even be fatal.15
RECOMMENDATIONS
- Do not prescribe an antihistamine or acetaminophen prior to transfusion.
- Reduce the risk of FNHTRs in all transfusion recipients with universal prestorage leukoreduction.
- For individuals with multiple recurrent ATRs to platelets, employ platelet additive solution or platelet volume reduction.
- Reserve washing RBC and platelet components for patients with a history of severe ATRs. Make sure epinephrine is at the patient’s bedside.
- Curb unnecessary blood transfusions to reduce avoidable transfusion reactions.
- Monitor patients undergoing transfusion closely.
CONCLUSION
In our clinical scenario, there is no indication for premedication with acetaminophen and/or an antihistamine. Routine premedication is a low-value practice. Our RBC and platelet components are leukoreduced to prevent FNHTRs (and lower the risk of human leukocyte antigen alloimmunization and cytomegalovirus transmission). For individuals with multiple recurrent ATRs to platelets, we recommend platelet additive solution–stored or volume-reduced platelet components to lower the risk of future reactions. For patients with a history of severe ATRs, some blood banks may be able to provide washed components. Make sure epinephrine is at the patient’s bedside. Avoiding unnecessary transfusion is also essential to prevent adverse events related to blood transfusion—if a transfusion does not occur, then neither will a transfusion reaction. Finally, monitor patients undergoing transfusion closely.
Do you think this is a low-value practice? Is this truly a “Thing We Do for No Reason?” Share what you do in your practice and join in the conversation online by retweeting it on Twitter (#TWDFNR) and liking it on Facebook. We invite you to propose ideas for other “Things We Do for No Reason” topics by emailing TWDFNR@hospitalmedicine.org.
Disclosures
The authors have nothing to disclose.
1. Fung MK, Eder A, Spitalnik SL, Westhoff CM. American Association of Blood Banks Technical Manual. 19th Ed: Bethesda, Md: AABB; 2017.
2. Ezidiegwu CN, Lauenstein KJ, Rosales LG, Kelly KC, Henry JB. Febrile nonhemolytic transfusion reactions: management by premedication and cost implications in adult patients. Arch Pathol Lab Med. 2004;128(9):991-995. doi: 10.1043/1543-2165(2004)128<991:FNTR>2.0.CO;2.
3. Fry JL, Arnold DM, Clase CM, et al. Transfusion premedication to prevent acute transfusion reactions: a retrospective observational study to assess current practices. Transfusion. 2010;50(8):1722-1730. doi: 10.1111/j.1537-2995.2010.02636.x.
4. Ferris HE, Alpert S, Coakley CS. Prevention of allergic transfusion reactions; the prophylactic use of antihistamine in blood to prevent allergic transfusion reactions. Am Pract Dig Treat. 1952;3(3):177-183.
5. Winter CC, Taplin GV. Prevention of acute allergic and febrile reactions to blood transfusions by prophylactic use of an antihistamine plus an antipyretic. Ann Allergy. 1956;14(1):76-81.
6. Wang SE, Lara PN, Jr., Lee-Ow A, et al. Acetaminophen and diphenhydramine as premedication for platelet transfusions: a prospective randomized double-blind placebo-controlled trial. Am J Hematol. 2002;70(3):191-194. doi: 10.1002/ajh.10119.
7. Kennedy LD, Case LD, Hurd DD, Cruz JM, Pomper GJ. A prospective, randomized, double-blind controlled trial of acetaminophen and diphenhydramine pretransfusion medication versus placebo for the prevention of transfusion reactions. Transfusion. 2008;48(11):2285-2291. doi: 10.1111/j.1537-2995.2008.01858.x.
8. Rujkijyanont P, Monsereenusorn C, Manoonphol P, Traivaree C. Efficacy of oral acetaminophen and intravenous chlorpheniramine maleate versus placebo to prevent red cell transfusion reactions in children and adolescent with thalassemia: a prospective, randomized, double-blind controlled trial. Anemia. 2018;2018:9492303. doi: 10.1155/2018/9492303.
9. By the American Geriatrics Society Beers Criteria Update Expert Panel. American Geriatrics Society 2015 Updated Beers Criteria for potentially inappropriate medication use in older adults. J Am Geriatr Soc. 2015;63(11):2227-2246. doi: 10.1111/jgs.13702.
10. Pagano MB, Katchatag BL, Khoobyari S, et al. Evaluating safety and cost-effectiveness of platelets stored in additive solution (PAS-F) as a hemolysis risk mitigation strategy. Transfusion. 2019;59(4):1246-1251. doi: 10.1111/trf.15138.
11. King KE, Shirey RS, Thoman SK, Bensen-Kennedy D, Tanz WS, Ness PM. Universal leukoreduction decreases the incidence of febrile nonhemolytic transfusion reactions to RBCs. Transfusion. 2004;44(1):25-29. doi: 10.1046/j.0041-1132.2004.00609.x.
12. Weisberg SP, Staley EM, Williams LA 3rd, et al. Survey on transfusion-transmitted cytomegalovirus and cytomegalovirus disease mitigation. Arch Pathol Lab Med. 2017;141(12):1705-1711. doi: 10.5858/arpa.2016-0461-OA.
13. Tobian AA, Savage WJ, Tisch DJ, Thoman S, King KE, Ness PM. Prevention of allergic transfusion reactions to platelets and red blood cells through plasma reduction. Transfusion. 2011;51(8):1676-1683. doi: 10.1111/j.1537-2995.2010.03008.x.
14. Veeraputhiran M, Ware J, Dent J, et al. A comparison of washed and volume-reduced platelets with respect to platelet activation, aggregation, and plasma protein removal. Transfusion. 2011;51(5):1030-1036. doi: 10.1111/j.1537-2995.2010.02897.x.
15. Corean J, Al-Tigar R, Pysher T, Blaylock R, Metcalf RA. Quality improvement after multiple fatal transfusion-transmitted bacterial infections. Am J Clin Pathol. 2018;149(4):293-299. doi: 10.1111/j.1537-2995.2010.02897.x.
Inspired by the ABIM Foundation’s Choosing Wisely® campaign, the “Things We Do for No Reason™” series reviews practices which have become common parts of hospital care but which may provide little value to our patients. Practices reviewed in the TWDFNR series do not represent clear-cut conclusions or clinical practice standards, but are meant as a starting place for research and active discussions among hospitalists and patients. We invite you to be part of that discussion.
CLINICAL SCENARIO
A 68-year-old woman with a known history of myelodysplastic syndrome is admitted for fatigue and shortness of breath on exertion. Her hemoglobin concentration decreased from 9.1 g/dL to 6.5 g/dL. Her physical examination is unremarkable except for mild tachycardia with a heart rate of 105. She is scheduled to receive her first red blood cell (RBC) transfusion. The hospitalist orders premedication with acetaminophen and/or diphenhydramine to prevent an acute transfusion reaction.
BACKGROUND
The most frequent complications of blood transfusion are allergic transfusion reactions (ATRs) and febrile nonhemolytic transfusion reactions (FNHTRs), with a combined incidence of approximately 1%-4% per transfusion.1 ATRs may range in severity from mild urticaria to life-threatening anaphylaxis. FNHTRs manifest as a fever (oral temperature greater than or equal to 38°C/100.4°F and an increase of at least 1°C/1.8°F from pretransfusion values) or chills/rigors. With approximately 17 million blood transfusions, including RBCs, plasma, platelet, and cryoprecipitate components, administered annually in the United States, often to those with severe illnesses, ATRs and FNHTRs confer a substantial public health burden. Currently, the prevalence of premedication to prevent acute transfusion reactions in the United States and Canada is variable, ranging from 1.6% in one Canadian institution to as high as 80% in one large US hospital.2,3
WHY YOU MIGHT THINK PREMEDICATION IS HELPFUL TO PREVENT TRANSFUSION REACTIONS
FNHTRs are thought to be caused by cytokines elaborated by donor leukocytes that remain in blood products and/or by recipient antibodies reacting with donor leukocytes.1 While the clinical course is self-limited, these reactions can cause patients significant distress. The rationale behind acetaminophen premedication is to blunt the febrile response.
ATRs are usually mild, but anaphylaxis (which may include respiratory compromise, hypotension, and even death) can occur. They are caused by recipient histamine release in response to exposure to donor plasma proteins.1 This provides the theoretical rationale for antihistamine (eg, diphenhydramine) premedication as a prevention strategy.
Data on pretransfusion medication originate from the mid-20th century. In 1952, Ferris et al. published results showing a significant decrease in both febrile and ATRs when blood bottles were injected with an antihistamine.4 This was followed, in 1956, by Winter and Taplin’s further demonstration that both febrile and allergic reactions were significantly reduced when patients received units of blood injected with both oral acetylsalicylic acid and an antihistamine (chlorprophenpyridamine).5 These trials notably lacked appropriate controls and blinding, and numerous transfusion practice changes have taken place during the subsequent decades.
WHY PREMEDICATION TO PREVENT TRANSFUSION REACTION IS NOT HELPFUL
In the past 20 years, three double-blind randomized controlled trials published show that premedication with a combination of acetaminophen and an antihistamine (either diphenhydramine or chlorpheniramine) does not reduce the risk of ATR and FNHTR. The first study, published in 2002, randomized 51 patients with hematological malignancies receiving prestorage-irradiated, leukocyte-reduced, single-donor apheresis platelets to premedication with either acetaminophen and diphenhydramine or placebo.6 Patients with a history of either ATR or FNHTR were included, but patients with a history of hemolytic transfusion reaction were excluded.6 The study found that premedication did not significantly lower the incidence of these transfusion reactions (15.4%) as compared with placebo (15.2%; P = .94).6
In a larger study published in 2008, Kennedy et al. randomized 315 patients with hematological malignancies receiving RBC or platelet transfusion to either pretransfusion acetaminophen and diphenhydramine or placebo.7 Patients with a documented history of an ATR or FNHTR were excluded, which may have contributed to the lower incidence compared with the aforementioned earlier clinical trial. There was no significant difference in the overall rate of transfusion reactions between the two groups (1.44 per 100 transfusions vs 1.51 per 100 transfusions, P = .433). When the rates of ATRs and FNHTRs were analyzed separately, there was no significant difference between the treatment and control groups for either reaction type (P = .899 and P = .084, respectively). There was a trend toward a reduction in FNHTRs, but the authors calculated that we would need to premedicate approximately 344 transfusions to prevent one febrile reaction.7
A more recent study published in 2018 evaluated 147 Thai children and adolescents with thalassemia receiving leukoreduced blood products.8 Researchers randomized them to either premedication with acetaminophen and chlorpheniramine or placebo.8 The incidences of FNHTR were not statistically significantly different: 6.9% in the intervention group, compared with 9.5% in the placebo group (P = .565).8 These three studies constitute the best currently available evidence and suggest that pretransfusion antihistamines and/or antipyretics are not effective.
Beyond a lack of proven benefit, the use of premedication is not without risk. Diphenhydramine, the most commonly used antihistamine for premedication, can cause cognitive impairment, sedation, and delirium.9 Such adverse effects are potentially heightened in the elderly and seriously ill populations where transfusion commonly occurs. Acetaminophen, although generally safe, can result in hepatotoxicity in patients who are fasting, regularly consume alcohol, or have underlying liver disease. Since there is both a lack of clinical benefit and potential for harm, avoid premedication.
WHAT YOU SHOULD DO INSTEAD
Rather than pretreating the patient, consider modifying the blood product selected for transfusion. Administering platelet and/or RBC components with certain modifications (a product-centered approach) is effective at reducing mild transfusion reactions.10 A well-known product-centered modification method includes prestorage leukoreduction of RBC and platelet components to remove donor leukocytes to a level <5 × 10⁶ per unit. This intervention reduces the incidence of FNHTRs by approximately 50%.11 A recent large, national survey demonstrated 90% of institutions (2,712/3,032) use universal leukoreduction.12 This widely employed and effective prevention strategy has likely helped reduce FNHTRs nationwide, so there are now fewer to prevent.12
Irradiation is another common modification of blood components used to prevent transfusion-associated graft-vs-host-disease (TA-GVHD) for recipients with significantly compromised cellular immunity. TA-GVHD is a rare but nearly universally fatal delayed complication of transfusion. Note that irradiation does not prevent FNHTRs or ATRs.
Under the premise that platelet-related allergic reactions are the result of recipient reaction to donor plasma proteins, reducing the plasma volume administered should decrease the coadministration of allergy-inducing plasma proteins.1 Reducing plasma volume can be achieved by two means: using a platelet additive solution that replaces two-thirds of the plasma content in a platelet unit or plasma removal by centrifugation. These two strategies decrease the plasma volume from 300 mL to ~100 mL per unit transfused, which effectively reduces the incidence of platelet-associated ATRs by 50%.10 For patients with recurrent severe ATRs, blood banks can wash RBC and platelet components, virtually removing all plasma proteins from the units.13 Epinephrine should be available at the bedside for patients with a history of severe ATRs.
Volume reduction and washing do negatively affect the quality of the unit: Platelets activate during the process, and transfusions result in a 20%-30% reduction in posttransfusion platelet counts.14 In addition, product manipulation takes significant blood bank processing time and results in an open system with greater risk of bacterial contamination, leading to a significantly shortened product expiration (24 hours for washed RBCs and 4 hours for washed or volume-reduced platelets).1 Reserve volume reduction and washing for patients with a history of multiple recurrent or severe ATRs, respectively. Platelet additive solution results in a reduction in posttransfusion count but does not require additional manipulation. Platelet additive solution products may not be available at many centers but could be used selectively (similar to volume reduction) depending on availability and cost.
Avoiding unnecessary transfusions is an essential strategy to prevent ATRs and FNHTRs. Evidence-based patient blood management (PBM), now considered the standard of care, is defined as optimizing anemia and hemostasis in patients with the goal of restricting blood transfusions. Evidence supporting restrictive transfusion strategies continues to accumulate, and numerous hospital systems have implemented PBM programs resulting in a significant nationwide reduction in transfusions since 2008. An effective PBM program reduces unnecessary transfusions and subsequent transfusion reactions.
Finally, appropriate close monitoring of patients undergoing blood transfusion and after completion of a transfusion is highly important. Paying close attention to signs and symptoms can alert the transfusing team to a developing adverse reaction and should prompt immediate cessation of an ongoing transfusion, the critical first step when a transfusion reaction is suspected. Hospitalists may need to take additional actions to treat the patient (eg, antihistamines after an ATR manifests or a diuretic in the setting of transfusion-associated circulatory overload). Report suspected transfusion reactions to the transfusion service. Failing to report a suspected transfusion reaction can lead to catastrophic consequences that can even be fatal.15
RECOMMENDATIONS
- Do not prescribe an antihistamine or acetaminophen prior to transfusion.
- Reduce the risk of FNHTRs in all transfusion recipients with universal prestorage leukoreduction.
- For individuals with multiple recurrent ATRs to platelets, employ platelet additive solution or platelet volume reduction.
- Reserve washing RBC and platelet components for patients with a history of severe ATRs. Make sure epinephrine is at the patient’s bedside.
- Curb unnecessary blood transfusions to reduce avoidable transfusion reactions.
- Monitor patients undergoing transfusion closely.
CONCLUSION
In our clinical scenario, there is no indication for premedication with acetaminophen and/or an antihistamine. Routine premedication is a low-value practice. Our RBC and platelet components are leukoreduced to prevent FNHTRs (and lower the risk of human leukocyte antigen alloimmunization and cytomegalovirus transmission). For individuals with multiple recurrent ATRs to platelets, we recommend platelet additive solution–stored or volume-reduced platelet components to lower the risk of future reactions. For patients with a history of severe ATRs, some blood banks may be able to provide washed components. Make sure epinephrine is at the patient’s bedside. Avoiding unnecessary transfusion is also essential to prevent adverse events related to blood transfusion—if a transfusion does not occur, then neither will a transfusion reaction. Finally, monitor patients undergoing transfusion closely.
Do you think this is a low-value practice? Is this truly a “Thing We Do for No Reason?” Share what you do in your practice and join in the conversation online by retweeting it on Twitter (#TWDFNR) and liking it on Facebook. We invite you to propose ideas for other “Things We Do for No Reason” topics by emailing TWDFNR@hospitalmedicine.org.
Disclosures
The authors have nothing to disclose.
Inspired by the ABIM Foundation’s Choosing Wisely® campaign, the “Things We Do for No Reason™” series reviews practices which have become common parts of hospital care but which may provide little value to our patients. Practices reviewed in the TWDFNR series do not represent clear-cut conclusions or clinical practice standards, but are meant as a starting place for research and active discussions among hospitalists and patients. We invite you to be part of that discussion.
CLINICAL SCENARIO
A 68-year-old woman with a known history of myelodysplastic syndrome is admitted for fatigue and shortness of breath on exertion. Her hemoglobin concentration decreased from 9.1 g/dL to 6.5 g/dL. Her physical examination is unremarkable except for mild tachycardia with a heart rate of 105. She is scheduled to receive her first red blood cell (RBC) transfusion. The hospitalist orders premedication with acetaminophen and/or diphenhydramine to prevent an acute transfusion reaction.
BACKGROUND
The most frequent complications of blood transfusion are allergic transfusion reactions (ATRs) and febrile nonhemolytic transfusion reactions (FNHTRs), with a combined incidence of approximately 1%-4% per transfusion.1 ATRs may range in severity from mild urticaria to life-threatening anaphylaxis. FNHTRs manifest as a fever (oral temperature greater than or equal to 38°C/100.4°F and an increase of at least 1°C/1.8°F from pretransfusion values) or chills/rigors. With approximately 17 million blood transfusions, including RBCs, plasma, platelet, and cryoprecipitate components, administered annually in the United States, often to those with severe illnesses, ATRs and FNHTRs confer a substantial public health burden. Currently, the prevalence of premedication to prevent acute transfusion reactions in the United States and Canada is variable, ranging from 1.6% in one Canadian institution to as high as 80% in one large US hospital.2,3
WHY YOU MIGHT THINK PREMEDICATION IS HELPFUL TO PREVENT TRANSFUSION REACTIONS
FNHTRs are thought to be caused by cytokines elaborated by donor leukocytes that remain in blood products and/or by recipient antibodies reacting with donor leukocytes.1 While the clinical course is self-limited, these reactions can cause patients significant distress. The rationale behind acetaminophen premedication is to blunt the febrile response.
ATRs are usually mild, but anaphylaxis (which may include respiratory compromise, hypotension, and even death) can occur. They are caused by recipient histamine release in response to exposure to donor plasma proteins.1 This provides the theoretical rationale for antihistamine (eg, diphenhydramine) premedication as a prevention strategy.
Data on pretransfusion medication originate from the mid-20th century. In 1952, Ferris et al. published results showing a significant decrease in both febrile and ATRs when blood bottles were injected with an antihistamine.4 This was followed, in 1956, by Winter and Taplin’s further demonstration that both febrile and allergic reactions were significantly reduced when patients received units of blood injected with both oral acetylsalicylic acid and an antihistamine (chlorprophenpyridamine).5 These trials notably lacked appropriate controls and blinding, and numerous transfusion practice changes have taken place during the subsequent decades.
WHY PREMEDICATION TO PREVENT TRANSFUSION REACTION IS NOT HELPFUL
In the past 20 years, three double-blind randomized controlled trials published show that premedication with a combination of acetaminophen and an antihistamine (either diphenhydramine or chlorpheniramine) does not reduce the risk of ATR and FNHTR. The first study, published in 2002, randomized 51 patients with hematological malignancies receiving prestorage-irradiated, leukocyte-reduced, single-donor apheresis platelets to premedication with either acetaminophen and diphenhydramine or placebo.6 Patients with a history of either ATR or FNHTR were included, but patients with a history of hemolytic transfusion reaction were excluded.6 The study found that premedication did not significantly lower the incidence of these transfusion reactions (15.4%) as compared with placebo (15.2%; P = .94).6
In a larger study published in 2008, Kennedy et al. randomized 315 patients with hematological malignancies receiving RBC or platelet transfusion to either pretransfusion acetaminophen and diphenhydramine or placebo.7 Patients with a documented history of an ATR or FNHTR were excluded, which may have contributed to the lower incidence compared with the aforementioned earlier clinical trial. There was no significant difference in the overall rate of transfusion reactions between the two groups (1.44 per 100 transfusions vs 1.51 per 100 transfusions, P = .433). When the rates of ATRs and FNHTRs were analyzed separately, there was no significant difference between the treatment and control groups for either reaction type (P = .899 and P = .084, respectively). There was a trend toward a reduction in FNHTRs, but the authors calculated that we would need to premedicate approximately 344 transfusions to prevent one febrile reaction.7
A more recent study published in 2018 evaluated 147 Thai children and adolescents with thalassemia receiving leukoreduced blood products.8 Researchers randomized them to either premedication with acetaminophen and chlorpheniramine or placebo.8 The incidences of FNHTR were not statistically significantly different: 6.9% in the intervention group, compared with 9.5% in the placebo group (P = .565).8 These three studies constitute the best currently available evidence and suggest that pretransfusion antihistamines and/or antipyretics are not effective.
Beyond a lack of proven benefit, the use of premedication is not without risk. Diphenhydramine, the most commonly used antihistamine for premedication, can cause cognitive impairment, sedation, and delirium.9 Such adverse effects are potentially heightened in the elderly and seriously ill populations where transfusion commonly occurs. Acetaminophen, although generally safe, can result in hepatotoxicity in patients who are fasting, regularly consume alcohol, or have underlying liver disease. Since there is both a lack of clinical benefit and potential for harm, avoid premedication.
WHAT YOU SHOULD DO INSTEAD
Rather than pretreating the patient, consider modifying the blood product selected for transfusion. Administering platelet and/or RBC components with certain modifications (a product-centered approach) is effective at reducing mild transfusion reactions.10 A well-known product-centered modification method includes prestorage leukoreduction of RBC and platelet components to remove donor leukocytes to a level <5 × 10⁶ per unit. This intervention reduces the incidence of FNHTRs by approximately 50%.11 A recent large, national survey demonstrated 90% of institutions (2,712/3,032) use universal leukoreduction.12 This widely employed and effective prevention strategy has likely helped reduce FNHTRs nationwide, so there are now fewer to prevent.12
Irradiation is another common modification of blood components used to prevent transfusion-associated graft-vs-host-disease (TA-GVHD) for recipients with significantly compromised cellular immunity. TA-GVHD is a rare but nearly universally fatal delayed complication of transfusion. Note that irradiation does not prevent FNHTRs or ATRs.
Under the premise that platelet-related allergic reactions are the result of recipient reaction to donor plasma proteins, reducing the plasma volume administered should decrease the coadministration of allergy-inducing plasma proteins.1 Reducing plasma volume can be achieved by two means: using a platelet additive solution that replaces two-thirds of the plasma content in a platelet unit or plasma removal by centrifugation. These two strategies decrease the plasma volume from 300 mL to ~100 mL per unit transfused, which effectively reduces the incidence of platelet-associated ATRs by 50%.10 For patients with recurrent severe ATRs, blood banks can wash RBC and platelet components, virtually removing all plasma proteins from the units.13 Epinephrine should be available at the bedside for patients with a history of severe ATRs.
Volume reduction and washing do negatively affect the quality of the unit: Platelets activate during the process, and transfusions result in a 20%-30% reduction in posttransfusion platelet counts.14 In addition, product manipulation takes significant blood bank processing time and results in an open system with greater risk of bacterial contamination, leading to a significantly shortened product expiration (24 hours for washed RBCs and 4 hours for washed or volume-reduced platelets).1 Reserve volume reduction and washing for patients with a history of multiple recurrent or severe ATRs, respectively. Platelet additive solution results in a reduction in posttransfusion count but does not require additional manipulation. Platelet additive solution products may not be available at many centers but could be used selectively (similar to volume reduction) depending on availability and cost.
Avoiding unnecessary transfusions is an essential strategy to prevent ATRs and FNHTRs. Evidence-based patient blood management (PBM), now considered the standard of care, is defined as optimizing anemia and hemostasis in patients with the goal of restricting blood transfusions. Evidence supporting restrictive transfusion strategies continues to accumulate, and numerous hospital systems have implemented PBM programs resulting in a significant nationwide reduction in transfusions since 2008. An effective PBM program reduces unnecessary transfusions and subsequent transfusion reactions.
Finally, appropriate close monitoring of patients undergoing blood transfusion and after completion of a transfusion is highly important. Paying close attention to signs and symptoms can alert the transfusing team to a developing adverse reaction and should prompt immediate cessation of an ongoing transfusion, the critical first step when a transfusion reaction is suspected. Hospitalists may need to take additional actions to treat the patient (eg, antihistamines after an ATR manifests or a diuretic in the setting of transfusion-associated circulatory overload). Report suspected transfusion reactions to the transfusion service. Failing to report a suspected transfusion reaction can lead to catastrophic consequences that can even be fatal.15
RECOMMENDATIONS
- Do not prescribe an antihistamine or acetaminophen prior to transfusion.
- Reduce the risk of FNHTRs in all transfusion recipients with universal prestorage leukoreduction.
- For individuals with multiple recurrent ATRs to platelets, employ platelet additive solution or platelet volume reduction.
- Reserve washing RBC and platelet components for patients with a history of severe ATRs. Make sure epinephrine is at the patient’s bedside.
- Curb unnecessary blood transfusions to reduce avoidable transfusion reactions.
- Monitor patients undergoing transfusion closely.
CONCLUSION
In our clinical scenario, there is no indication for premedication with acetaminophen and/or an antihistamine. Routine premedication is a low-value practice. Our RBC and platelet components are leukoreduced to prevent FNHTRs (and lower the risk of human leukocyte antigen alloimmunization and cytomegalovirus transmission). For individuals with multiple recurrent ATRs to platelets, we recommend platelet additive solution–stored or volume-reduced platelet components to lower the risk of future reactions. For patients with a history of severe ATRs, some blood banks may be able to provide washed components. Make sure epinephrine is at the patient’s bedside. Avoiding unnecessary transfusion is also essential to prevent adverse events related to blood transfusion—if a transfusion does not occur, then neither will a transfusion reaction. Finally, monitor patients undergoing transfusion closely.
Do you think this is a low-value practice? Is this truly a “Thing We Do for No Reason?” Share what you do in your practice and join in the conversation online by retweeting it on Twitter (#TWDFNR) and liking it on Facebook. We invite you to propose ideas for other “Things We Do for No Reason” topics by emailing TWDFNR@hospitalmedicine.org.
Disclosures
The authors have nothing to disclose.
1. Fung MK, Eder A, Spitalnik SL, Westhoff CM. American Association of Blood Banks Technical Manual. 19th Ed: Bethesda, Md: AABB; 2017.
2. Ezidiegwu CN, Lauenstein KJ, Rosales LG, Kelly KC, Henry JB. Febrile nonhemolytic transfusion reactions: management by premedication and cost implications in adult patients. Arch Pathol Lab Med. 2004;128(9):991-995. doi: 10.1043/1543-2165(2004)128<991:FNTR>2.0.CO;2.
3. Fry JL, Arnold DM, Clase CM, et al. Transfusion premedication to prevent acute transfusion reactions: a retrospective observational study to assess current practices. Transfusion. 2010;50(8):1722-1730. doi: 10.1111/j.1537-2995.2010.02636.x.
4. Ferris HE, Alpert S, Coakley CS. Prevention of allergic transfusion reactions; the prophylactic use of antihistamine in blood to prevent allergic transfusion reactions. Am Pract Dig Treat. 1952;3(3):177-183.
5. Winter CC, Taplin GV. Prevention of acute allergic and febrile reactions to blood transfusions by prophylactic use of an antihistamine plus an antipyretic. Ann Allergy. 1956;14(1):76-81.
6. Wang SE, Lara PN, Jr., Lee-Ow A, et al. Acetaminophen and diphenhydramine as premedication for platelet transfusions: a prospective randomized double-blind placebo-controlled trial. Am J Hematol. 2002;70(3):191-194. doi: 10.1002/ajh.10119.
7. Kennedy LD, Case LD, Hurd DD, Cruz JM, Pomper GJ. A prospective, randomized, double-blind controlled trial of acetaminophen and diphenhydramine pretransfusion medication versus placebo for the prevention of transfusion reactions. Transfusion. 2008;48(11):2285-2291. doi: 10.1111/j.1537-2995.2008.01858.x.
8. Rujkijyanont P, Monsereenusorn C, Manoonphol P, Traivaree C. Efficacy of oral acetaminophen and intravenous chlorpheniramine maleate versus placebo to prevent red cell transfusion reactions in children and adolescent with thalassemia: a prospective, randomized, double-blind controlled trial. Anemia. 2018;2018:9492303. doi: 10.1155/2018/9492303.
9. By the American Geriatrics Society Beers Criteria Update Expert Panel. American Geriatrics Society 2015 Updated Beers Criteria for potentially inappropriate medication use in older adults. J Am Geriatr Soc. 2015;63(11):2227-2246. doi: 10.1111/jgs.13702.
10. Pagano MB, Katchatag BL, Khoobyari S, et al. Evaluating safety and cost-effectiveness of platelets stored in additive solution (PAS-F) as a hemolysis risk mitigation strategy. Transfusion. 2019;59(4):1246-1251. doi: 10.1111/trf.15138.
11. King KE, Shirey RS, Thoman SK, Bensen-Kennedy D, Tanz WS, Ness PM. Universal leukoreduction decreases the incidence of febrile nonhemolytic transfusion reactions to RBCs. Transfusion. 2004;44(1):25-29. doi: 10.1046/j.0041-1132.2004.00609.x.
12. Weisberg SP, Staley EM, Williams LA 3rd, et al. Survey on transfusion-transmitted cytomegalovirus and cytomegalovirus disease mitigation. Arch Pathol Lab Med. 2017;141(12):1705-1711. doi: 10.5858/arpa.2016-0461-OA.
13. Tobian AA, Savage WJ, Tisch DJ, Thoman S, King KE, Ness PM. Prevention of allergic transfusion reactions to platelets and red blood cells through plasma reduction. Transfusion. 2011;51(8):1676-1683. doi: 10.1111/j.1537-2995.2010.03008.x.
14. Veeraputhiran M, Ware J, Dent J, et al. A comparison of washed and volume-reduced platelets with respect to platelet activation, aggregation, and plasma protein removal. Transfusion. 2011;51(5):1030-1036. doi: 10.1111/j.1537-2995.2010.02897.x.
15. Corean J, Al-Tigar R, Pysher T, Blaylock R, Metcalf RA. Quality improvement after multiple fatal transfusion-transmitted bacterial infections. Am J Clin Pathol. 2018;149(4):293-299. doi: 10.1111/j.1537-2995.2010.02897.x.
1. Fung MK, Eder A, Spitalnik SL, Westhoff CM. American Association of Blood Banks Technical Manual. 19th Ed: Bethesda, Md: AABB; 2017.
2. Ezidiegwu CN, Lauenstein KJ, Rosales LG, Kelly KC, Henry JB. Febrile nonhemolytic transfusion reactions: management by premedication and cost implications in adult patients. Arch Pathol Lab Med. 2004;128(9):991-995. doi: 10.1043/1543-2165(2004)128<991:FNTR>2.0.CO;2.
3. Fry JL, Arnold DM, Clase CM, et al. Transfusion premedication to prevent acute transfusion reactions: a retrospective observational study to assess current practices. Transfusion. 2010;50(8):1722-1730. doi: 10.1111/j.1537-2995.2010.02636.x.
4. Ferris HE, Alpert S, Coakley CS. Prevention of allergic transfusion reactions; the prophylactic use of antihistamine in blood to prevent allergic transfusion reactions. Am Pract Dig Treat. 1952;3(3):177-183.
5. Winter CC, Taplin GV. Prevention of acute allergic and febrile reactions to blood transfusions by prophylactic use of an antihistamine plus an antipyretic. Ann Allergy. 1956;14(1):76-81.
6. Wang SE, Lara PN, Jr., Lee-Ow A, et al. Acetaminophen and diphenhydramine as premedication for platelet transfusions: a prospective randomized double-blind placebo-controlled trial. Am J Hematol. 2002;70(3):191-194. doi: 10.1002/ajh.10119.
7. Kennedy LD, Case LD, Hurd DD, Cruz JM, Pomper GJ. A prospective, randomized, double-blind controlled trial of acetaminophen and diphenhydramine pretransfusion medication versus placebo for the prevention of transfusion reactions. Transfusion. 2008;48(11):2285-2291. doi: 10.1111/j.1537-2995.2008.01858.x.
8. Rujkijyanont P, Monsereenusorn C, Manoonphol P, Traivaree C. Efficacy of oral acetaminophen and intravenous chlorpheniramine maleate versus placebo to prevent red cell transfusion reactions in children and adolescent with thalassemia: a prospective, randomized, double-blind controlled trial. Anemia. 2018;2018:9492303. doi: 10.1155/2018/9492303.
9. By the American Geriatrics Society Beers Criteria Update Expert Panel. American Geriatrics Society 2015 Updated Beers Criteria for potentially inappropriate medication use in older adults. J Am Geriatr Soc. 2015;63(11):2227-2246. doi: 10.1111/jgs.13702.
10. Pagano MB, Katchatag BL, Khoobyari S, et al. Evaluating safety and cost-effectiveness of platelets stored in additive solution (PAS-F) as a hemolysis risk mitigation strategy. Transfusion. 2019;59(4):1246-1251. doi: 10.1111/trf.15138.
11. King KE, Shirey RS, Thoman SK, Bensen-Kennedy D, Tanz WS, Ness PM. Universal leukoreduction decreases the incidence of febrile nonhemolytic transfusion reactions to RBCs. Transfusion. 2004;44(1):25-29. doi: 10.1046/j.0041-1132.2004.00609.x.
12. Weisberg SP, Staley EM, Williams LA 3rd, et al. Survey on transfusion-transmitted cytomegalovirus and cytomegalovirus disease mitigation. Arch Pathol Lab Med. 2017;141(12):1705-1711. doi: 10.5858/arpa.2016-0461-OA.
13. Tobian AA, Savage WJ, Tisch DJ, Thoman S, King KE, Ness PM. Prevention of allergic transfusion reactions to platelets and red blood cells through plasma reduction. Transfusion. 2011;51(8):1676-1683. doi: 10.1111/j.1537-2995.2010.03008.x.
14. Veeraputhiran M, Ware J, Dent J, et al. A comparison of washed and volume-reduced platelets with respect to platelet activation, aggregation, and plasma protein removal. Transfusion. 2011;51(5):1030-1036. doi: 10.1111/j.1537-2995.2010.02897.x.
15. Corean J, Al-Tigar R, Pysher T, Blaylock R, Metcalf RA. Quality improvement after multiple fatal transfusion-transmitted bacterial infections. Am J Clin Pathol. 2018;149(4):293-299. doi: 10.1111/j.1537-2995.2010.02897.x.
© 2020 Society of Hospital Medicine
Things We Do for No Reason™: Routine Thyroid-Stimulating Hormone Testing in the Hospital
Inspired by the ABIM Foundation’s Choosing Wisely® campaign, the “Things We Do for No Reason™” (TWDFNR) series reviews practices that have become common parts of hospital care but may provide little value to our patients. Practices reviewed in the TWDFNR series do not represent clear-cut conclusions or clinical practice standards but are meant as a starting place for research and active discussions among hospitalists and patients. We invite you to be part of that discussion.
CLINICAL SCENARIO
A 62-year-old woman with chronic obstructive pulmonary disease (COPD) presents to the emergency department with shortness of breath, wheezing, and altered mental status (AMS). She is diagnosed with an acute COPD exacerbation with hypercarbic respiratory failure and is treated with nebulized albuterol/ipratropium and intravenous methylprednisolone. The hospitalist orders basic admission laboratory tests, including a thyroid-stimulating hormone (TSH) test for completeness, although she suspects that the patient’s AMS is secondary to hypercapnia. Upon review, the TSH level is low (0.12 mIU/L). A free T4 (FT4) level is ordered and returns mildly low (0.6 ng/dL). Somewhat puzzled, the hospitalist wonders if the patient might have central hypothyroidism and if further testing is needed.
BACKGROUND
Thyroid disease has a prevalence in adults of 4.6% and 1.3% for hypo- and hyperthyroidism, respectively.1 Severe manifestations of thyroid disease are rare, with an annual incidence of 0.2 per 100,0002 for thyroid storm and 1.08 per 1,000,0003 for myxedema coma in adults. Although most thyroid disease is mild and managed in the outpatient setting, inpatient thyroid testing is common, with evidence suggesting that 21%-100% of internal medicine admissions receive thyroid testing.4-7
WHY YOU MIGHT THINK ORDERING TSH ROUTINELY IS HELPFUL
Despite the rarity of severe thyroid disease, symptomatic hypo- or hyperthyroidism is often included in the differential diagnosis for a multitude of presenting problems to the hospital. Providers may view TSH as a simple means to rule out thyroid illness and narrow the diagnostic differential, particularly given the speed and availability of testing. In addition, cultural norms may encourage the routine assessment of thyroid function as a part of a thorough inpatient evaluation, even when alternative diagnoses could explain the patient’s symptoms.8 In many hospitals, TSH is included in emergency department laboratory panels and hospital admission order sets (sometimes as a preselected default), which can significantly influence prescriber ordering.4,6,7,9
Hardwick et al. conducted structured interviews with primary care providers to explore the factors contributing to high thyroid testing variability. Among the potential contributing factors identified were fear of a missed diagnosis, as well as the complexity and poor integration of electronic health records, which makes repeat testing easier than requesting outside records.10 Most importantly, providers may assume that all abnormal results indicate clinically relevant thyroid dysfunction despite differences between TSH test characteristics in inpatient vs outpatient settings.11
WHY ORDERING TSH ROUTINELY IS NOT HELPFUL AND IS UNNECCESSARY
The most important confounder of thyroid function testing in the hospital is nonthyroidal illness syndrome (NTIS), also known as sick euthyroid syndrome. Although the prevalence of unrecognized thyroid disease in hospitalized patients is 1%-2.5%,11 NTIS is observed in up to 62% of hospitalized patients and not exclusively in critically ill patients as previously thought.8 Risk factors include infection, stroke, myocardial infarction, kidney or liver injury, burns, malnutrition, malignancy, and recent surgery, as well as multiple medications.12 Contributing factors may include the effect of cytokines on thyroid-releasing hormone and TSH secretion, decreased deiodinase activity, and changes in thyroid hormone receptor activity.8 No one pattern of thyroid function testing is pathognomonic of NTIS.8,12
The high prevalence of NTIS reduces the specificity of TSH testing in hospitalized patients. In this population, Attia et al. determined that mild abnormalities (TSH 0.1-0.6 mIU/L or 6.7-20 mIU/L) have a positive likelihood ratio (LR+) of true thyroid disease of 0.0 and 0.74, respectively, counterintuitively reducing rather than increasing the posttest probability of thyroid disease. Although TSH levels <0.01 and >20 mIU/L carry a higher LR+ (7.7 and 11.1, respectively), the vast majority of abnormal TSH results in the hospital are mild, self-resolving, and do not change clinical management.5,11,13 Adlan et al. reported that only 1.2% of tested patients have very abnormal TSH results (4/751 with TSH <0.01 and 5/751 with TSH >10 mIU/L).5
Spencer et al. measured TSH and other thyroid function tests in 1,580 adult patients admitted to a large county hospital in the United States, without regard to symptoms or prior diagnosis of thyroid disease. They found that 519/1,580 (33%) had TSH values outside the laboratory reference range. Of the 1,580 patients, 329 were randomly selected for further analysis, and 29/329 (8.8%) were found to have true thyroid disease. The vast majority of these patients (22/29, 75.8%) had TSH levels <0.1 mIU/L or >20 mIU/L. Importantly, the authors did not indicate how many of the 29 patients had known preexisiting thyroid disease or clinical symptoms.13
Similarly, an Israeli study examined the utility of routine TSH testing upon admission to an internal medicine service. More than 1 in 10 patients had abnormal TSH results (11.8%, 232/1,966). After chart review, the majority of the abnormal results (52.2%, 121/232) were felt to be secondary to NTIS. Subclinical thyrotoxicosis and subclinical hypothyroidism were noted in a further 20.7% (48/232) and 18.5% (43/232) of the patients, respectively. Overall, in only nine patients (0.5%, 9/1,966) did TSH testing lead to a change in clinical management. In all these cases, patients were either already on a medication known to affect thyroid function (eg, levothyroxine, amiodarone) or the pretest probability of thyroid-related illness was elevated because of clinical presentation.4
Several institutions have implemented quality improvement (QI) initiatives to reduce inappropriate thyroid function testing without apparent compromise to clinical care.14 Although none included balancing measures within their QI design, the implementation of simple appropriateness guidelines, for example, has been shown to reduce the frequency of TSH ordering by as much as 50%, which suggests significant overtesting.5,15,16 Similarly, in a clustered randomized control trial, Thomas et al. demonstrated a significant reduction (odds ratio [OR] 0.82) in outpatient TSH ordering after the addition of a simple educational message to the order.17
HARMS ASSOCIATED WITH ROUTINE TSH TESTING
NTIS may cause TSH, T4, and even FT4 to increase or decrease, even in discordant patterns, such as in the case above. This makes interpretation difficult for the hospitalist, who may wonder
WHEN TO CONSIDER TSH TESTING
Given the limitations of TSH testing in hospitalized patients due to NTIS, the AACE/ATA recommend TSH measurement in hospitalized patients only in cases of high clinical suspicion for thyroid dysfunction (Grade A, Best Level Evidence 2).19 The specificity of TSH testing in the hospital setting is too low to justify screening for mild or subclinical disease.8 Instead, directed thyroid function testing should be performed for hospitalized patients with sufficient signs and symptoms to raise the pretest probability of a clinically relevant result (Table). According to Attia et al., the total number of signs and symptoms (rather than one particular sign or symptom) may be the most reliable indicator. In two outpatient studies (no inpatient data available), the presence of one to two signs or symptoms of thyroid disease yielded an LR+ of 0.11-0.2, three to four signs or symptoms yielded an LR+ of 0.74-1.14, and five or more signs or symptoms yielded an LR+ of 6.75-18.6.11 For example, if a general medical patient (prevalence of undiagnosed hypothyroidism estimated to be 0.6%) has constipation and fatigue (LR+ 0.2), then the pretest probability would be approximately 0.1%. If the TSH level results between 6.7 and 20 mIU/L (LR+ 0.74), the posttest probability of thyroid disease would remain only 0.1%. Alternatively, a general medical patient with five symptoms consistent with hypothyroidism (LR+ 18.6) would have a pretest probability of 10%. If the TSH level results >20 mIU/L (LR+ 11.1), then the posttest probability of hypothyroidism would be 55%.11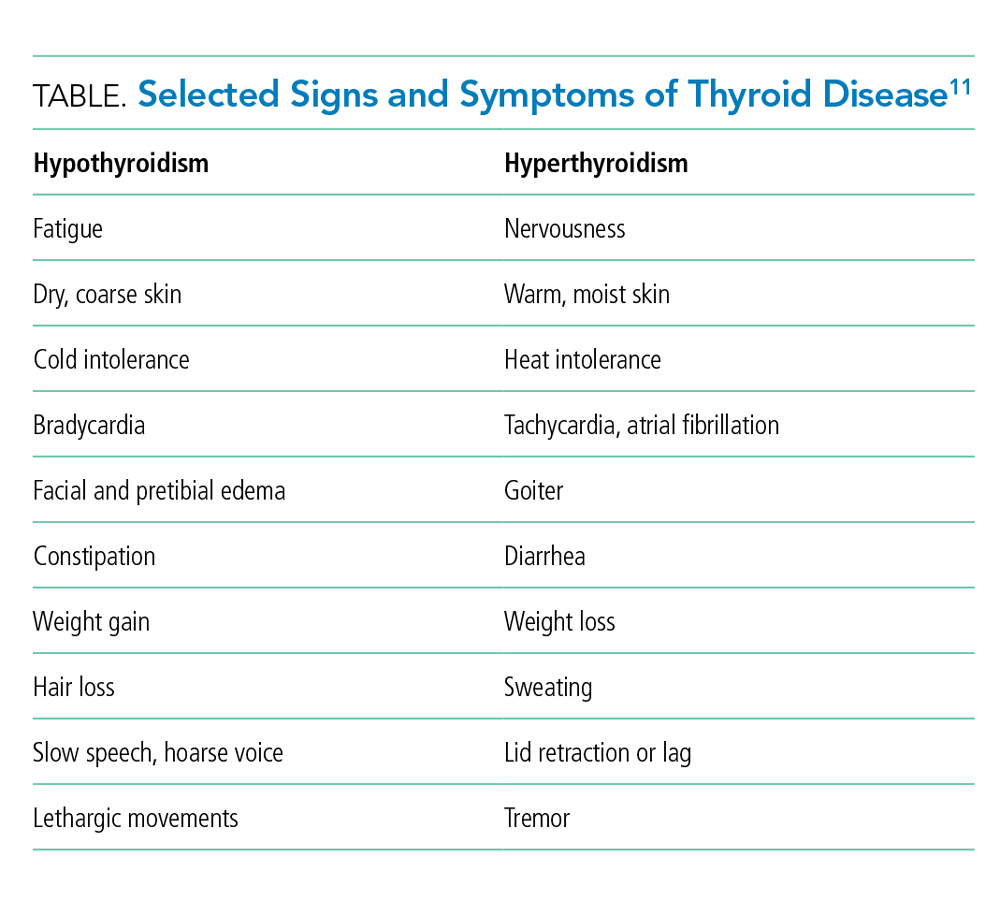
For patients on stable doses of thyroid hormone replacement, although it may seem logical to check a TSH level upon admission to the hospital, guidelines recommend monitoring levels routinely in the outpatient setting, at most once every 12 months. More frequent monitoring should be undertaken only if clinical symptoms suggest that a dose change may be needed,19 and routine hospital testing should be avoided because of the potential for misleading results.
However, in some specific clinical scenarios, it may be reasonable to test for thyroid disease. Guidelines suggest TSH testing in the evaluation of certain conditions such as atrial fibrillation20 and syndrome of inappropriate antidiuretic hormone (SIADH).21 In addition, in the evaluation of unexplained sinus tachycardia, it is reasonable to test for hyperthyroidism after more common causes (pain, anxiety, infection, anemia, drug ingestion, and beta-blocker withdrawal) have been excluded.22 In the evaluation of delirium, TSH may be an appropriate “second tier” test after more likely contributors have been excluded.23
RECOMMENDATIONS
- Do not routinely order TSH on admission given the low pretest probability of clinically significant thyroid disease.
- Do not routinely check TSH for inpatients on stable outpatient doses of thyroid hormone replacement.
- Reserve TSH testing for clinical scenarios in which there is either a high pretest probability of thyroid disease (five or more symptoms) or for the evaluation of specific clinical syndromes for which thyroid dysfunction is a known reversible contributor (such as atrial fibrillation, SIADH, unexplained sinus tachycardia, and delirium).
- Do not attempt to diagnose subclinical thyroid disease in the hospital.
- If NTIS is suspected, avoid further testing in the hospital. Repeating TFTs as an outpatient may be appropriate after resolution of the acute illness.
CONCLUSION
Routine TSH testing in hospitalized patients is unhelpful and often yields confusing results because of the low prevalence of unrecognized thyroid disease, the high prevalence of NTIS, and the resulting difficulty with interpretation of results. Mild TSH abnormalities in hospitalized patients do not predict clinically significant thyroid disease.4,11 The patient in the previously described clinical scenario has NTIS caused by acute on chronic illness and the effect of glucocorticoids. As the hospitalist suspected, the patient’s AMS was caused by hypercapnia. Reserving TSH testing for patients with clinical signs and symptoms of thyroid disease or for those with specific conditions has the potential to save healthcare dollars, prevent harm to patients associated with overtesting or overtreatment, and decrease time spent interpreting abnormal results of unclear significance.
Do you think this is a low-value practice? Is this truly a “Thing We Do for No Reason™?” Share what you do in your practice and join in the conversation online by retweeting it on Twitter (#TWDFNR) and liking it on Facebook. We invite you to propose ideas for other “Things We Do for No Reason™” topics by emailing TWDFNR@hospitalmedicine.org.
1. Hollowell J, Staehling N, Flanders W, et al. Serum TSH, T4, and thyroid antibodies in the United States population (1988 to 1994): National Health and Nutrition Examination Survey (NHANES III). J Clin Endocrinol Metab. 2002;87(2):489-499. https://doi.org/10.1210/jcem.87.2.8182.
2. Akamizu T, Satoh T, Isozaki O, et al. Diagnostic criteria, clinical features, and incidence of thyroid storm based on nationwide surveys. Thyroid. 2012;22(7):661-679. https://doi.org/10.1089/thy.2011.0334.
3. Ono Y, Ono S, Yasunaga H, Matsui H, Fushimi K, Tanaka Y. Clinical characteristics and outcomes of myxedema coma: Analysis of a national inpatient database in Japan. J Epidemiol. 2017;27(3):117-122. https://doi.org/10.1016/j.je.2016.04.002.
4. Bashkin A, Yaakobi E, Nodelman M, Ronen O. Is routine measurement of TSH in hospitalized patients necessary? Endocr Connect. 2018;7(4):567-572. https://doi.org/10.1530/EC-18-0004.
5. Adlan M, Neel V, Lakra S, Bondugulapati LN, Premawardhana LD. Targeted thyroid testing in acute illness: Achieving success through audit. J Endocrinol Invest. 2011;34(8):e210-e213. https://doi.org/10.3275/7480.
6. Roti E, Gardini E, Magotti M, et al. Are thyroid function tests too frequently and inappropriately requested?. J Endocrinol Invest. 1999;22(3):184-190. https://doi.org/10.1007/bf03343539.
7. Dalal S, Bhesania S, Silber S, Mehta P. Use of electronic clinical decision support and hard stops to decrease unnecessary thyroid function testing. BMJ Qual Improv Rep. 2017;6(1):u223041.w8346. https://doi.org/10.1136/bmjquality.u223041.w8346.
8. Premawardhana L. Thyroid testing in acutely ill patients may be an expensive distraction. Biochem Med (Zagreb). 2017;27(300):300-307. https://doi.org/10.11613/bm.2017.033.
9. Halpern SD, Ubel PA, Asch DA. Harnessing the power of default options to improve health care. N Engl J Med. 2007;357(13):1340-1344. https://doi.org/10.1056/nejmsb071595.
10. Hardwick R, Heaton, J, Vaidya B, et al. Exploring reasons for variation in ordering thyroid function tests in primary care: A qualitative study. Qual Prim Care. 2014;22(6):256-261.
11. Attia J, Margetts P, Guyatt G. Diagnosis of thyroid disease in hospitalized patients: a systematic review. Arch Intern Med. 1999;159(7):658-665. https://doi.org/10.1001/archinte.159.7.658.
12. Koulouri O, Moran C, Halsall D, Chatterjee K, Gurnell M. Pitfalls in the measurement and interpretation of thyroid function tests. Best Pract Res Clin Endocrinol Metab. 2013;27(6):745-762. https://doi.org/10.1016/j.beem.2013.10.003.
13. Spencer C, Elgen A, Shen D, et al. Specificity of sensitive assays of thyrotropin (TSH) used to screen for thyroid disease in hospitalized patients. Clin Chem. 1987;33(8):1391-1396.
14. Zhelev Z, Abbott R, Rogers M, et al. Effectiveness of interventions to reduce ordering of thyroid function tests: a systematic review. BMJ Open. 2016;6:e010065. https://doi.org/10.1136/bmjopen-2015-010065.
15. Daucort V, Saillour-Glenisson F, Michel P, Jutand MA, Abouelfath A. A multicenter cluster randomized controlled trial of strategies to improve thyroid function testing. Med Care. 2003;41(3):432-441. https://doi.org/10.1097/01.mlr.0000053216.33277.a4.
16. Toubert M, Chavret S, Cassinat B, Schlageter MH, Beressi JP, Rain JD. From guidelines to hospital practice: reducing inappropriate ordering of thyroid hormone and antibody tests. Eur J Endocrinol. 2000:605-610. https://doi.org/10.1530/eje.0.1420605.
17. Thomas RE, Croal BL, Ramsay C, Eccles M, Grimshaw J. Effect of enhanced feedback and brief educational reminder messages on laboratory test requesting in primary care: A cluster randomised trial. Lancet. 2006;367(9527):1990-1996. https://doi.org/10.1016/s0140-6736(06)68888-0.
18. Taylor P, Iqbal A, Minassian C, et al. Falling threshold for treatment of borderline elevated thyrotropin levels—balancing benefits and risks. JAMA Intern Med. 2014;174(1):32. https://doi.org/10.1001/jamainternmed.2013.11312.
19. Garber JR, Cobin RH, Gharib H, et al. Clinical practice guidelines for hypothyroidism in adults: Cosponsored by the American association of clinical endocrinologists and the American thyroid association. Thyroid. 2012;22(12):1200-1235. https://doi.org/ 10.1089/thy.2012.0205.
20. January CT, Wann LS, Alpert JS, et al. 2014 AHA/ACC/HRS guideline for the management of patients with atrial fibrillation: A report of the American College of Cardiology/American Heart Association Task Force on Practice Guidelines and the Heart Rhythm Society. J Am Coll Cardiol. 2014;64(21):e1-e76. https://doi.org/10.1016/j.jacc.2014.03.022.
21. Verbalis J, Goldsmith S, Greenberg A, et al. Diagnosis, evaluation, and treatment of hyponatremia: Expert panel recommendations. Am J Med. 2013;126(10):S1-S42. https://doi.org/10.1016/j.amjmed.2013.07.006.
22. Olshansky B, Sullivan R. Inappropriate sinus tachycardia. J Am Coll Cardiol. 2013;61(8):793-801. https://doi.org/10.1016/j.jacc.2012.07.074.
23. Josephson SA, Miller BL. Confusion and delirium. In: Jameson J, Fauci AS, Kasper DL, Hauser SL, Longo DL, Loscalzo J, eds. Harrison’s Principles of Internal Medicine, 20e. New York, NY: McGraw-Hill; http://accessmedicine.mhmedical.com/content.aspx?bookid=2129§ionid=192011608. Accessed January 29, 2019.
Inspired by the ABIM Foundation’s Choosing Wisely® campaign, the “Things We Do for No Reason™” (TWDFNR) series reviews practices that have become common parts of hospital care but may provide little value to our patients. Practices reviewed in the TWDFNR series do not represent clear-cut conclusions or clinical practice standards but are meant as a starting place for research and active discussions among hospitalists and patients. We invite you to be part of that discussion.
CLINICAL SCENARIO
A 62-year-old woman with chronic obstructive pulmonary disease (COPD) presents to the emergency department with shortness of breath, wheezing, and altered mental status (AMS). She is diagnosed with an acute COPD exacerbation with hypercarbic respiratory failure and is treated with nebulized albuterol/ipratropium and intravenous methylprednisolone. The hospitalist orders basic admission laboratory tests, including a thyroid-stimulating hormone (TSH) test for completeness, although she suspects that the patient’s AMS is secondary to hypercapnia. Upon review, the TSH level is low (0.12 mIU/L). A free T4 (FT4) level is ordered and returns mildly low (0.6 ng/dL). Somewhat puzzled, the hospitalist wonders if the patient might have central hypothyroidism and if further testing is needed.
BACKGROUND
Thyroid disease has a prevalence in adults of 4.6% and 1.3% for hypo- and hyperthyroidism, respectively.1 Severe manifestations of thyroid disease are rare, with an annual incidence of 0.2 per 100,0002 for thyroid storm and 1.08 per 1,000,0003 for myxedema coma in adults. Although most thyroid disease is mild and managed in the outpatient setting, inpatient thyroid testing is common, with evidence suggesting that 21%-100% of internal medicine admissions receive thyroid testing.4-7
WHY YOU MIGHT THINK ORDERING TSH ROUTINELY IS HELPFUL
Despite the rarity of severe thyroid disease, symptomatic hypo- or hyperthyroidism is often included in the differential diagnosis for a multitude of presenting problems to the hospital. Providers may view TSH as a simple means to rule out thyroid illness and narrow the diagnostic differential, particularly given the speed and availability of testing. In addition, cultural norms may encourage the routine assessment of thyroid function as a part of a thorough inpatient evaluation, even when alternative diagnoses could explain the patient’s symptoms.8 In many hospitals, TSH is included in emergency department laboratory panels and hospital admission order sets (sometimes as a preselected default), which can significantly influence prescriber ordering.4,6,7,9
Hardwick et al. conducted structured interviews with primary care providers to explore the factors contributing to high thyroid testing variability. Among the potential contributing factors identified were fear of a missed diagnosis, as well as the complexity and poor integration of electronic health records, which makes repeat testing easier than requesting outside records.10 Most importantly, providers may assume that all abnormal results indicate clinically relevant thyroid dysfunction despite differences between TSH test characteristics in inpatient vs outpatient settings.11
WHY ORDERING TSH ROUTINELY IS NOT HELPFUL AND IS UNNECCESSARY
The most important confounder of thyroid function testing in the hospital is nonthyroidal illness syndrome (NTIS), also known as sick euthyroid syndrome. Although the prevalence of unrecognized thyroid disease in hospitalized patients is 1%-2.5%,11 NTIS is observed in up to 62% of hospitalized patients and not exclusively in critically ill patients as previously thought.8 Risk factors include infection, stroke, myocardial infarction, kidney or liver injury, burns, malnutrition, malignancy, and recent surgery, as well as multiple medications.12 Contributing factors may include the effect of cytokines on thyroid-releasing hormone and TSH secretion, decreased deiodinase activity, and changes in thyroid hormone receptor activity.8 No one pattern of thyroid function testing is pathognomonic of NTIS.8,12
The high prevalence of NTIS reduces the specificity of TSH testing in hospitalized patients. In this population, Attia et al. determined that mild abnormalities (TSH 0.1-0.6 mIU/L or 6.7-20 mIU/L) have a positive likelihood ratio (LR+) of true thyroid disease of 0.0 and 0.74, respectively, counterintuitively reducing rather than increasing the posttest probability of thyroid disease. Although TSH levels <0.01 and >20 mIU/L carry a higher LR+ (7.7 and 11.1, respectively), the vast majority of abnormal TSH results in the hospital are mild, self-resolving, and do not change clinical management.5,11,13 Adlan et al. reported that only 1.2% of tested patients have very abnormal TSH results (4/751 with TSH <0.01 and 5/751 with TSH >10 mIU/L).5
Spencer et al. measured TSH and other thyroid function tests in 1,580 adult patients admitted to a large county hospital in the United States, without regard to symptoms or prior diagnosis of thyroid disease. They found that 519/1,580 (33%) had TSH values outside the laboratory reference range. Of the 1,580 patients, 329 were randomly selected for further analysis, and 29/329 (8.8%) were found to have true thyroid disease. The vast majority of these patients (22/29, 75.8%) had TSH levels <0.1 mIU/L or >20 mIU/L. Importantly, the authors did not indicate how many of the 29 patients had known preexisiting thyroid disease or clinical symptoms.13
Similarly, an Israeli study examined the utility of routine TSH testing upon admission to an internal medicine service. More than 1 in 10 patients had abnormal TSH results (11.8%, 232/1,966). After chart review, the majority of the abnormal results (52.2%, 121/232) were felt to be secondary to NTIS. Subclinical thyrotoxicosis and subclinical hypothyroidism were noted in a further 20.7% (48/232) and 18.5% (43/232) of the patients, respectively. Overall, in only nine patients (0.5%, 9/1,966) did TSH testing lead to a change in clinical management. In all these cases, patients were either already on a medication known to affect thyroid function (eg, levothyroxine, amiodarone) or the pretest probability of thyroid-related illness was elevated because of clinical presentation.4
Several institutions have implemented quality improvement (QI) initiatives to reduce inappropriate thyroid function testing without apparent compromise to clinical care.14 Although none included balancing measures within their QI design, the implementation of simple appropriateness guidelines, for example, has been shown to reduce the frequency of TSH ordering by as much as 50%, which suggests significant overtesting.5,15,16 Similarly, in a clustered randomized control trial, Thomas et al. demonstrated a significant reduction (odds ratio [OR] 0.82) in outpatient TSH ordering after the addition of a simple educational message to the order.17
HARMS ASSOCIATED WITH ROUTINE TSH TESTING
NTIS may cause TSH, T4, and even FT4 to increase or decrease, even in discordant patterns, such as in the case above. This makes interpretation difficult for the hospitalist, who may wonder
WHEN TO CONSIDER TSH TESTING
Given the limitations of TSH testing in hospitalized patients due to NTIS, the AACE/ATA recommend TSH measurement in hospitalized patients only in cases of high clinical suspicion for thyroid dysfunction (Grade A, Best Level Evidence 2).19 The specificity of TSH testing in the hospital setting is too low to justify screening for mild or subclinical disease.8 Instead, directed thyroid function testing should be performed for hospitalized patients with sufficient signs and symptoms to raise the pretest probability of a clinically relevant result (Table). According to Attia et al., the total number of signs and symptoms (rather than one particular sign or symptom) may be the most reliable indicator. In two outpatient studies (no inpatient data available), the presence of one to two signs or symptoms of thyroid disease yielded an LR+ of 0.11-0.2, three to four signs or symptoms yielded an LR+ of 0.74-1.14, and five or more signs or symptoms yielded an LR+ of 6.75-18.6.11 For example, if a general medical patient (prevalence of undiagnosed hypothyroidism estimated to be 0.6%) has constipation and fatigue (LR+ 0.2), then the pretest probability would be approximately 0.1%. If the TSH level results between 6.7 and 20 mIU/L (LR+ 0.74), the posttest probability of thyroid disease would remain only 0.1%. Alternatively, a general medical patient with five symptoms consistent with hypothyroidism (LR+ 18.6) would have a pretest probability of 10%. If the TSH level results >20 mIU/L (LR+ 11.1), then the posttest probability of hypothyroidism would be 55%.11
For patients on stable doses of thyroid hormone replacement, although it may seem logical to check a TSH level upon admission to the hospital, guidelines recommend monitoring levels routinely in the outpatient setting, at most once every 12 months. More frequent monitoring should be undertaken only if clinical symptoms suggest that a dose change may be needed,19 and routine hospital testing should be avoided because of the potential for misleading results.
However, in some specific clinical scenarios, it may be reasonable to test for thyroid disease. Guidelines suggest TSH testing in the evaluation of certain conditions such as atrial fibrillation20 and syndrome of inappropriate antidiuretic hormone (SIADH).21 In addition, in the evaluation of unexplained sinus tachycardia, it is reasonable to test for hyperthyroidism after more common causes (pain, anxiety, infection, anemia, drug ingestion, and beta-blocker withdrawal) have been excluded.22 In the evaluation of delirium, TSH may be an appropriate “second tier” test after more likely contributors have been excluded.23
RECOMMENDATIONS
- Do not routinely order TSH on admission given the low pretest probability of clinically significant thyroid disease.
- Do not routinely check TSH for inpatients on stable outpatient doses of thyroid hormone replacement.
- Reserve TSH testing for clinical scenarios in which there is either a high pretest probability of thyroid disease (five or more symptoms) or for the evaluation of specific clinical syndromes for which thyroid dysfunction is a known reversible contributor (such as atrial fibrillation, SIADH, unexplained sinus tachycardia, and delirium).
- Do not attempt to diagnose subclinical thyroid disease in the hospital.
- If NTIS is suspected, avoid further testing in the hospital. Repeating TFTs as an outpatient may be appropriate after resolution of the acute illness.
CONCLUSION
Routine TSH testing in hospitalized patients is unhelpful and often yields confusing results because of the low prevalence of unrecognized thyroid disease, the high prevalence of NTIS, and the resulting difficulty with interpretation of results. Mild TSH abnormalities in hospitalized patients do not predict clinically significant thyroid disease.4,11 The patient in the previously described clinical scenario has NTIS caused by acute on chronic illness and the effect of glucocorticoids. As the hospitalist suspected, the patient’s AMS was caused by hypercapnia. Reserving TSH testing for patients with clinical signs and symptoms of thyroid disease or for those with specific conditions has the potential to save healthcare dollars, prevent harm to patients associated with overtesting or overtreatment, and decrease time spent interpreting abnormal results of unclear significance.
Do you think this is a low-value practice? Is this truly a “Thing We Do for No Reason™?” Share what you do in your practice and join in the conversation online by retweeting it on Twitter (#TWDFNR) and liking it on Facebook. We invite you to propose ideas for other “Things We Do for No Reason™” topics by emailing TWDFNR@hospitalmedicine.org.
Inspired by the ABIM Foundation’s Choosing Wisely® campaign, the “Things We Do for No Reason™” (TWDFNR) series reviews practices that have become common parts of hospital care but may provide little value to our patients. Practices reviewed in the TWDFNR series do not represent clear-cut conclusions or clinical practice standards but are meant as a starting place for research and active discussions among hospitalists and patients. We invite you to be part of that discussion.
CLINICAL SCENARIO
A 62-year-old woman with chronic obstructive pulmonary disease (COPD) presents to the emergency department with shortness of breath, wheezing, and altered mental status (AMS). She is diagnosed with an acute COPD exacerbation with hypercarbic respiratory failure and is treated with nebulized albuterol/ipratropium and intravenous methylprednisolone. The hospitalist orders basic admission laboratory tests, including a thyroid-stimulating hormone (TSH) test for completeness, although she suspects that the patient’s AMS is secondary to hypercapnia. Upon review, the TSH level is low (0.12 mIU/L). A free T4 (FT4) level is ordered and returns mildly low (0.6 ng/dL). Somewhat puzzled, the hospitalist wonders if the patient might have central hypothyroidism and if further testing is needed.
BACKGROUND
Thyroid disease has a prevalence in adults of 4.6% and 1.3% for hypo- and hyperthyroidism, respectively.1 Severe manifestations of thyroid disease are rare, with an annual incidence of 0.2 per 100,0002 for thyroid storm and 1.08 per 1,000,0003 for myxedema coma in adults. Although most thyroid disease is mild and managed in the outpatient setting, inpatient thyroid testing is common, with evidence suggesting that 21%-100% of internal medicine admissions receive thyroid testing.4-7
WHY YOU MIGHT THINK ORDERING TSH ROUTINELY IS HELPFUL
Despite the rarity of severe thyroid disease, symptomatic hypo- or hyperthyroidism is often included in the differential diagnosis for a multitude of presenting problems to the hospital. Providers may view TSH as a simple means to rule out thyroid illness and narrow the diagnostic differential, particularly given the speed and availability of testing. In addition, cultural norms may encourage the routine assessment of thyroid function as a part of a thorough inpatient evaluation, even when alternative diagnoses could explain the patient’s symptoms.8 In many hospitals, TSH is included in emergency department laboratory panels and hospital admission order sets (sometimes as a preselected default), which can significantly influence prescriber ordering.4,6,7,9
Hardwick et al. conducted structured interviews with primary care providers to explore the factors contributing to high thyroid testing variability. Among the potential contributing factors identified were fear of a missed diagnosis, as well as the complexity and poor integration of electronic health records, which makes repeat testing easier than requesting outside records.10 Most importantly, providers may assume that all abnormal results indicate clinically relevant thyroid dysfunction despite differences between TSH test characteristics in inpatient vs outpatient settings.11
WHY ORDERING TSH ROUTINELY IS NOT HELPFUL AND IS UNNECCESSARY
The most important confounder of thyroid function testing in the hospital is nonthyroidal illness syndrome (NTIS), also known as sick euthyroid syndrome. Although the prevalence of unrecognized thyroid disease in hospitalized patients is 1%-2.5%,11 NTIS is observed in up to 62% of hospitalized patients and not exclusively in critically ill patients as previously thought.8 Risk factors include infection, stroke, myocardial infarction, kidney or liver injury, burns, malnutrition, malignancy, and recent surgery, as well as multiple medications.12 Contributing factors may include the effect of cytokines on thyroid-releasing hormone and TSH secretion, decreased deiodinase activity, and changes in thyroid hormone receptor activity.8 No one pattern of thyroid function testing is pathognomonic of NTIS.8,12
The high prevalence of NTIS reduces the specificity of TSH testing in hospitalized patients. In this population, Attia et al. determined that mild abnormalities (TSH 0.1-0.6 mIU/L or 6.7-20 mIU/L) have a positive likelihood ratio (LR+) of true thyroid disease of 0.0 and 0.74, respectively, counterintuitively reducing rather than increasing the posttest probability of thyroid disease. Although TSH levels <0.01 and >20 mIU/L carry a higher LR+ (7.7 and 11.1, respectively), the vast majority of abnormal TSH results in the hospital are mild, self-resolving, and do not change clinical management.5,11,13 Adlan et al. reported that only 1.2% of tested patients have very abnormal TSH results (4/751 with TSH <0.01 and 5/751 with TSH >10 mIU/L).5
Spencer et al. measured TSH and other thyroid function tests in 1,580 adult patients admitted to a large county hospital in the United States, without regard to symptoms or prior diagnosis of thyroid disease. They found that 519/1,580 (33%) had TSH values outside the laboratory reference range. Of the 1,580 patients, 329 were randomly selected for further analysis, and 29/329 (8.8%) were found to have true thyroid disease. The vast majority of these patients (22/29, 75.8%) had TSH levels <0.1 mIU/L or >20 mIU/L. Importantly, the authors did not indicate how many of the 29 patients had known preexisiting thyroid disease or clinical symptoms.13
Similarly, an Israeli study examined the utility of routine TSH testing upon admission to an internal medicine service. More than 1 in 10 patients had abnormal TSH results (11.8%, 232/1,966). After chart review, the majority of the abnormal results (52.2%, 121/232) were felt to be secondary to NTIS. Subclinical thyrotoxicosis and subclinical hypothyroidism were noted in a further 20.7% (48/232) and 18.5% (43/232) of the patients, respectively. Overall, in only nine patients (0.5%, 9/1,966) did TSH testing lead to a change in clinical management. In all these cases, patients were either already on a medication known to affect thyroid function (eg, levothyroxine, amiodarone) or the pretest probability of thyroid-related illness was elevated because of clinical presentation.4
Several institutions have implemented quality improvement (QI) initiatives to reduce inappropriate thyroid function testing without apparent compromise to clinical care.14 Although none included balancing measures within their QI design, the implementation of simple appropriateness guidelines, for example, has been shown to reduce the frequency of TSH ordering by as much as 50%, which suggests significant overtesting.5,15,16 Similarly, in a clustered randomized control trial, Thomas et al. demonstrated a significant reduction (odds ratio [OR] 0.82) in outpatient TSH ordering after the addition of a simple educational message to the order.17
HARMS ASSOCIATED WITH ROUTINE TSH TESTING
NTIS may cause TSH, T4, and even FT4 to increase or decrease, even in discordant patterns, such as in the case above. This makes interpretation difficult for the hospitalist, who may wonder
WHEN TO CONSIDER TSH TESTING
Given the limitations of TSH testing in hospitalized patients due to NTIS, the AACE/ATA recommend TSH measurement in hospitalized patients only in cases of high clinical suspicion for thyroid dysfunction (Grade A, Best Level Evidence 2).19 The specificity of TSH testing in the hospital setting is too low to justify screening for mild or subclinical disease.8 Instead, directed thyroid function testing should be performed for hospitalized patients with sufficient signs and symptoms to raise the pretest probability of a clinically relevant result (Table). According to Attia et al., the total number of signs and symptoms (rather than one particular sign or symptom) may be the most reliable indicator. In two outpatient studies (no inpatient data available), the presence of one to two signs or symptoms of thyroid disease yielded an LR+ of 0.11-0.2, three to four signs or symptoms yielded an LR+ of 0.74-1.14, and five or more signs or symptoms yielded an LR+ of 6.75-18.6.11 For example, if a general medical patient (prevalence of undiagnosed hypothyroidism estimated to be 0.6%) has constipation and fatigue (LR+ 0.2), then the pretest probability would be approximately 0.1%. If the TSH level results between 6.7 and 20 mIU/L (LR+ 0.74), the posttest probability of thyroid disease would remain only 0.1%. Alternatively, a general medical patient with five symptoms consistent with hypothyroidism (LR+ 18.6) would have a pretest probability of 10%. If the TSH level results >20 mIU/L (LR+ 11.1), then the posttest probability of hypothyroidism would be 55%.11
For patients on stable doses of thyroid hormone replacement, although it may seem logical to check a TSH level upon admission to the hospital, guidelines recommend monitoring levels routinely in the outpatient setting, at most once every 12 months. More frequent monitoring should be undertaken only if clinical symptoms suggest that a dose change may be needed,19 and routine hospital testing should be avoided because of the potential for misleading results.
However, in some specific clinical scenarios, it may be reasonable to test for thyroid disease. Guidelines suggest TSH testing in the evaluation of certain conditions such as atrial fibrillation20 and syndrome of inappropriate antidiuretic hormone (SIADH).21 In addition, in the evaluation of unexplained sinus tachycardia, it is reasonable to test for hyperthyroidism after more common causes (pain, anxiety, infection, anemia, drug ingestion, and beta-blocker withdrawal) have been excluded.22 In the evaluation of delirium, TSH may be an appropriate “second tier” test after more likely contributors have been excluded.23
RECOMMENDATIONS
- Do not routinely order TSH on admission given the low pretest probability of clinically significant thyroid disease.
- Do not routinely check TSH for inpatients on stable outpatient doses of thyroid hormone replacement.
- Reserve TSH testing for clinical scenarios in which there is either a high pretest probability of thyroid disease (five or more symptoms) or for the evaluation of specific clinical syndromes for which thyroid dysfunction is a known reversible contributor (such as atrial fibrillation, SIADH, unexplained sinus tachycardia, and delirium).
- Do not attempt to diagnose subclinical thyroid disease in the hospital.
- If NTIS is suspected, avoid further testing in the hospital. Repeating TFTs as an outpatient may be appropriate after resolution of the acute illness.
CONCLUSION
Routine TSH testing in hospitalized patients is unhelpful and often yields confusing results because of the low prevalence of unrecognized thyroid disease, the high prevalence of NTIS, and the resulting difficulty with interpretation of results. Mild TSH abnormalities in hospitalized patients do not predict clinically significant thyroid disease.4,11 The patient in the previously described clinical scenario has NTIS caused by acute on chronic illness and the effect of glucocorticoids. As the hospitalist suspected, the patient’s AMS was caused by hypercapnia. Reserving TSH testing for patients with clinical signs and symptoms of thyroid disease or for those with specific conditions has the potential to save healthcare dollars, prevent harm to patients associated with overtesting or overtreatment, and decrease time spent interpreting abnormal results of unclear significance.
Do you think this is a low-value practice? Is this truly a “Thing We Do for No Reason™?” Share what you do in your practice and join in the conversation online by retweeting it on Twitter (#TWDFNR) and liking it on Facebook. We invite you to propose ideas for other “Things We Do for No Reason™” topics by emailing TWDFNR@hospitalmedicine.org.
1. Hollowell J, Staehling N, Flanders W, et al. Serum TSH, T4, and thyroid antibodies in the United States population (1988 to 1994): National Health and Nutrition Examination Survey (NHANES III). J Clin Endocrinol Metab. 2002;87(2):489-499. https://doi.org/10.1210/jcem.87.2.8182.
2. Akamizu T, Satoh T, Isozaki O, et al. Diagnostic criteria, clinical features, and incidence of thyroid storm based on nationwide surveys. Thyroid. 2012;22(7):661-679. https://doi.org/10.1089/thy.2011.0334.
3. Ono Y, Ono S, Yasunaga H, Matsui H, Fushimi K, Tanaka Y. Clinical characteristics and outcomes of myxedema coma: Analysis of a national inpatient database in Japan. J Epidemiol. 2017;27(3):117-122. https://doi.org/10.1016/j.je.2016.04.002.
4. Bashkin A, Yaakobi E, Nodelman M, Ronen O. Is routine measurement of TSH in hospitalized patients necessary? Endocr Connect. 2018;7(4):567-572. https://doi.org/10.1530/EC-18-0004.
5. Adlan M, Neel V, Lakra S, Bondugulapati LN, Premawardhana LD. Targeted thyroid testing in acute illness: Achieving success through audit. J Endocrinol Invest. 2011;34(8):e210-e213. https://doi.org/10.3275/7480.
6. Roti E, Gardini E, Magotti M, et al. Are thyroid function tests too frequently and inappropriately requested?. J Endocrinol Invest. 1999;22(3):184-190. https://doi.org/10.1007/bf03343539.
7. Dalal S, Bhesania S, Silber S, Mehta P. Use of electronic clinical decision support and hard stops to decrease unnecessary thyroid function testing. BMJ Qual Improv Rep. 2017;6(1):u223041.w8346. https://doi.org/10.1136/bmjquality.u223041.w8346.
8. Premawardhana L. Thyroid testing in acutely ill patients may be an expensive distraction. Biochem Med (Zagreb). 2017;27(300):300-307. https://doi.org/10.11613/bm.2017.033.
9. Halpern SD, Ubel PA, Asch DA. Harnessing the power of default options to improve health care. N Engl J Med. 2007;357(13):1340-1344. https://doi.org/10.1056/nejmsb071595.
10. Hardwick R, Heaton, J, Vaidya B, et al. Exploring reasons for variation in ordering thyroid function tests in primary care: A qualitative study. Qual Prim Care. 2014;22(6):256-261.
11. Attia J, Margetts P, Guyatt G. Diagnosis of thyroid disease in hospitalized patients: a systematic review. Arch Intern Med. 1999;159(7):658-665. https://doi.org/10.1001/archinte.159.7.658.
12. Koulouri O, Moran C, Halsall D, Chatterjee K, Gurnell M. Pitfalls in the measurement and interpretation of thyroid function tests. Best Pract Res Clin Endocrinol Metab. 2013;27(6):745-762. https://doi.org/10.1016/j.beem.2013.10.003.
13. Spencer C, Elgen A, Shen D, et al. Specificity of sensitive assays of thyrotropin (TSH) used to screen for thyroid disease in hospitalized patients. Clin Chem. 1987;33(8):1391-1396.
14. Zhelev Z, Abbott R, Rogers M, et al. Effectiveness of interventions to reduce ordering of thyroid function tests: a systematic review. BMJ Open. 2016;6:e010065. https://doi.org/10.1136/bmjopen-2015-010065.
15. Daucort V, Saillour-Glenisson F, Michel P, Jutand MA, Abouelfath A. A multicenter cluster randomized controlled trial of strategies to improve thyroid function testing. Med Care. 2003;41(3):432-441. https://doi.org/10.1097/01.mlr.0000053216.33277.a4.
16. Toubert M, Chavret S, Cassinat B, Schlageter MH, Beressi JP, Rain JD. From guidelines to hospital practice: reducing inappropriate ordering of thyroid hormone and antibody tests. Eur J Endocrinol. 2000:605-610. https://doi.org/10.1530/eje.0.1420605.
17. Thomas RE, Croal BL, Ramsay C, Eccles M, Grimshaw J. Effect of enhanced feedback and brief educational reminder messages on laboratory test requesting in primary care: A cluster randomised trial. Lancet. 2006;367(9527):1990-1996. https://doi.org/10.1016/s0140-6736(06)68888-0.
18. Taylor P, Iqbal A, Minassian C, et al. Falling threshold for treatment of borderline elevated thyrotropin levels—balancing benefits and risks. JAMA Intern Med. 2014;174(1):32. https://doi.org/10.1001/jamainternmed.2013.11312.
19. Garber JR, Cobin RH, Gharib H, et al. Clinical practice guidelines for hypothyroidism in adults: Cosponsored by the American association of clinical endocrinologists and the American thyroid association. Thyroid. 2012;22(12):1200-1235. https://doi.org/ 10.1089/thy.2012.0205.
20. January CT, Wann LS, Alpert JS, et al. 2014 AHA/ACC/HRS guideline for the management of patients with atrial fibrillation: A report of the American College of Cardiology/American Heart Association Task Force on Practice Guidelines and the Heart Rhythm Society. J Am Coll Cardiol. 2014;64(21):e1-e76. https://doi.org/10.1016/j.jacc.2014.03.022.
21. Verbalis J, Goldsmith S, Greenberg A, et al. Diagnosis, evaluation, and treatment of hyponatremia: Expert panel recommendations. Am J Med. 2013;126(10):S1-S42. https://doi.org/10.1016/j.amjmed.2013.07.006.
22. Olshansky B, Sullivan R. Inappropriate sinus tachycardia. J Am Coll Cardiol. 2013;61(8):793-801. https://doi.org/10.1016/j.jacc.2012.07.074.
23. Josephson SA, Miller BL. Confusion and delirium. In: Jameson J, Fauci AS, Kasper DL, Hauser SL, Longo DL, Loscalzo J, eds. Harrison’s Principles of Internal Medicine, 20e. New York, NY: McGraw-Hill; http://accessmedicine.mhmedical.com/content.aspx?bookid=2129§ionid=192011608. Accessed January 29, 2019.
1. Hollowell J, Staehling N, Flanders W, et al. Serum TSH, T4, and thyroid antibodies in the United States population (1988 to 1994): National Health and Nutrition Examination Survey (NHANES III). J Clin Endocrinol Metab. 2002;87(2):489-499. https://doi.org/10.1210/jcem.87.2.8182.
2. Akamizu T, Satoh T, Isozaki O, et al. Diagnostic criteria, clinical features, and incidence of thyroid storm based on nationwide surveys. Thyroid. 2012;22(7):661-679. https://doi.org/10.1089/thy.2011.0334.
3. Ono Y, Ono S, Yasunaga H, Matsui H, Fushimi K, Tanaka Y. Clinical characteristics and outcomes of myxedema coma: Analysis of a national inpatient database in Japan. J Epidemiol. 2017;27(3):117-122. https://doi.org/10.1016/j.je.2016.04.002.
4. Bashkin A, Yaakobi E, Nodelman M, Ronen O. Is routine measurement of TSH in hospitalized patients necessary? Endocr Connect. 2018;7(4):567-572. https://doi.org/10.1530/EC-18-0004.
5. Adlan M, Neel V, Lakra S, Bondugulapati LN, Premawardhana LD. Targeted thyroid testing in acute illness: Achieving success through audit. J Endocrinol Invest. 2011;34(8):e210-e213. https://doi.org/10.3275/7480.
6. Roti E, Gardini E, Magotti M, et al. Are thyroid function tests too frequently and inappropriately requested?. J Endocrinol Invest. 1999;22(3):184-190. https://doi.org/10.1007/bf03343539.
7. Dalal S, Bhesania S, Silber S, Mehta P. Use of electronic clinical decision support and hard stops to decrease unnecessary thyroid function testing. BMJ Qual Improv Rep. 2017;6(1):u223041.w8346. https://doi.org/10.1136/bmjquality.u223041.w8346.
8. Premawardhana L. Thyroid testing in acutely ill patients may be an expensive distraction. Biochem Med (Zagreb). 2017;27(300):300-307. https://doi.org/10.11613/bm.2017.033.
9. Halpern SD, Ubel PA, Asch DA. Harnessing the power of default options to improve health care. N Engl J Med. 2007;357(13):1340-1344. https://doi.org/10.1056/nejmsb071595.
10. Hardwick R, Heaton, J, Vaidya B, et al. Exploring reasons for variation in ordering thyroid function tests in primary care: A qualitative study. Qual Prim Care. 2014;22(6):256-261.
11. Attia J, Margetts P, Guyatt G. Diagnosis of thyroid disease in hospitalized patients: a systematic review. Arch Intern Med. 1999;159(7):658-665. https://doi.org/10.1001/archinte.159.7.658.
12. Koulouri O, Moran C, Halsall D, Chatterjee K, Gurnell M. Pitfalls in the measurement and interpretation of thyroid function tests. Best Pract Res Clin Endocrinol Metab. 2013;27(6):745-762. https://doi.org/10.1016/j.beem.2013.10.003.
13. Spencer C, Elgen A, Shen D, et al. Specificity of sensitive assays of thyrotropin (TSH) used to screen for thyroid disease in hospitalized patients. Clin Chem. 1987;33(8):1391-1396.
14. Zhelev Z, Abbott R, Rogers M, et al. Effectiveness of interventions to reduce ordering of thyroid function tests: a systematic review. BMJ Open. 2016;6:e010065. https://doi.org/10.1136/bmjopen-2015-010065.
15. Daucort V, Saillour-Glenisson F, Michel P, Jutand MA, Abouelfath A. A multicenter cluster randomized controlled trial of strategies to improve thyroid function testing. Med Care. 2003;41(3):432-441. https://doi.org/10.1097/01.mlr.0000053216.33277.a4.
16. Toubert M, Chavret S, Cassinat B, Schlageter MH, Beressi JP, Rain JD. From guidelines to hospital practice: reducing inappropriate ordering of thyroid hormone and antibody tests. Eur J Endocrinol. 2000:605-610. https://doi.org/10.1530/eje.0.1420605.
17. Thomas RE, Croal BL, Ramsay C, Eccles M, Grimshaw J. Effect of enhanced feedback and brief educational reminder messages on laboratory test requesting in primary care: A cluster randomised trial. Lancet. 2006;367(9527):1990-1996. https://doi.org/10.1016/s0140-6736(06)68888-0.
18. Taylor P, Iqbal A, Minassian C, et al. Falling threshold for treatment of borderline elevated thyrotropin levels—balancing benefits and risks. JAMA Intern Med. 2014;174(1):32. https://doi.org/10.1001/jamainternmed.2013.11312.
19. Garber JR, Cobin RH, Gharib H, et al. Clinical practice guidelines for hypothyroidism in adults: Cosponsored by the American association of clinical endocrinologists and the American thyroid association. Thyroid. 2012;22(12):1200-1235. https://doi.org/ 10.1089/thy.2012.0205.
20. January CT, Wann LS, Alpert JS, et al. 2014 AHA/ACC/HRS guideline for the management of patients with atrial fibrillation: A report of the American College of Cardiology/American Heart Association Task Force on Practice Guidelines and the Heart Rhythm Society. J Am Coll Cardiol. 2014;64(21):e1-e76. https://doi.org/10.1016/j.jacc.2014.03.022.
21. Verbalis J, Goldsmith S, Greenberg A, et al. Diagnosis, evaluation, and treatment of hyponatremia: Expert panel recommendations. Am J Med. 2013;126(10):S1-S42. https://doi.org/10.1016/j.amjmed.2013.07.006.
22. Olshansky B, Sullivan R. Inappropriate sinus tachycardia. J Am Coll Cardiol. 2013;61(8):793-801. https://doi.org/10.1016/j.jacc.2012.07.074.
23. Josephson SA, Miller BL. Confusion and delirium. In: Jameson J, Fauci AS, Kasper DL, Hauser SL, Longo DL, Loscalzo J, eds. Harrison’s Principles of Internal Medicine, 20e. New York, NY: McGraw-Hill; http://accessmedicine.mhmedical.com/content.aspx?bookid=2129§ionid=192011608. Accessed January 29, 2019.
© 2020 Society of Hospital Medicine
Hindsight Is 20/20
A 38-year-old woman presented to her primary care clinic with 3 weeks of progressive numbness and tingling sensation, which began in both hands and then progressed to involv
As with all neurological complaints, localization of the process will often inform a more specific differential diagnosis. If both sensory and motor findings are present, both central and peripheral nerve processes deserve consideration. The onset of paresthesia in the hands, rapid progression to the trunk, and unilateral leg weakness would be inconsistent with a length-dependent peripheral neuropathy. The distribution of complaints and the sacral sparing suggests a myelopathic process involving the cervical region rather than a cauda equina or conus lesions. In an otherwise healthy person of this age and gender, an inflammatory demyelinating disease affecting the cord including multiple sclerosis (MS) would be a strong consideration, although metabolic, vascular, infectious, compressive, or neoplastic disease of the spinal cord could also present with similar subacute onset and pattern of deficits.
Her medical history included morbid obesity, dry eyes, depression, iron deficiency anemia requiring recurrent intravenous replenishment, and abnormal uterine bleeding. Her surgical history included gastric band placement 7 years earlier with removal 5 years later due to persistent gastroesophageal reflux disease, dysphagia, nausea, and vomiting. The gastric band removal was complicated by chronic abdominal pain. Her medications consisted of duloxetine, intermittent iron infusions, artificial tears, loratadine, and pregabalin. She was sexually active with her husband. She consumed alcohol occasionally but did not smoke tobacco or use illicit drugs.
On exam, her temperature was 36.6°C (97.8°F), blood pressure 132/84 mm Hg, and heart rate 85 beats per minute. Body mass index was 39.5 kg/m2. The cardiac, pulmonary, and skin examinations were normal. The abdomen was soft with diffuse tenderness to palpation without rebound or guarding. Examination of cranial nerves 2-12 was normal. Cognition, strength, proprioception, deep tendon reflexes, and light touch were all normal. Her gait was normal, and the Romberg test was negative.
The normal neurologic exam is reassuring but imperfectly sensitive and does not eliminate the possibility of underlying neuropathology. Bariatric surgery may result in an array of nutritional deficiencies such as vitamin E, B12, and copper, which can cause myelopathy and/or neuropathy. However, these abnormalities occur less frequently with gastric banding procedures. If her dry eyes are part of the sicca syndrome, an underlying autoimmune diathesis may be present. Her unexplained chronic abdominal pain prompts considering nonmenstrual causes of iron deficiency anemia, such as celiac disease. Bariatric surgery may contribute to iron deficiency through impaired iron absorption. Her stable weight and lack of diarrhea argue against Crohn’s or celiac disease. Iron deficiency predisposes individuals to pica, most commonly described with ice chip ingestion. If lead pica had occurred, abdominal and neurological symptoms could result. Nevertheless, the abdominal pain is nonspecific, and its occurrence after gastric band removal makes its link to her neurologic syndrome unclear. An initial evaluation would include basic metabolic panel, complete blood count with differential, erythrocyte sedimentation rate, C-reactive protein (CRP), thyroid-stimulating hormone, vitamin B12, and copper levels.
A basic metabolic panel was normal. The white cell count was 5,710 per cubic millimeter, hemoglobin level 12.2 g per deciliter, mean corpuscular volume 85.2 fl, and platelet count 279,000 per cubic millimeter. The serum ferritin level was 18 ng per milliliter (normal range, 13-150), iron 28 µg per deciliter (normal range, 50-170), total iron-binding capacity 364 µg per deciliter (normal range, 250-450), and iron saturation 8% (normal range, 20-55). The vitamin B12 level was 621 pg per milliliter (normal range, 232-1,245) and thyroid-stimulating hormone level 1.87 units per milliliter (normal range, 0.50-4.50). Electrolyte and aminotransferase levels were within normal limits. CRP was 1.0 mg per deciliter (normal range, <0.5) and erythrocyte sedimentation rate 33 millimeters per hour (normal range, 4-25). Hepatitis C and HIV antibodies were nonreactive.
The ongoing iron deficiency despite parenteral iron replacement raises the question of ongoing gastrointestinal or genitourinary blood loss. While the level of vitamin B12 in the serum may be misleadingly normal with cobalamin deficiency, a methylmalonic acid level is indicated to evaluate whether tissue stores are depleted. Copper levels are warranted given the prior bariatric surgery. The mild elevations of inflammatory markers are nonspecific but reduce the likelihood of a highly inflammatory process to account for the neurological and abdominal symptoms.
At her 3-month follow-up visit, she noted that the paresthesia had improved and was now limited to her bilateral lower extremities. During the same clinic visit, she experienced a 45-minute episode of ascending left upper extremity numbness. Her physical examination revealed normal strength and reflexes. She had diminished response to pinprick in both legs to the knees and in both hands to the wrists. Vibration sense was diminished in the bilateral lower extremities.
A glycosylated hemoglobin (HbA1c) level was 6.2%. Methylmalonic acid was 69 nmol per liter (normal range, 45-325). Antibodies to Borrelia burgdorferi and Treponema pallidum were absent. Impaired glucose metabolism was the leading diagnosis for her polyneuropathy, and it was recommended that she undergo an oral glucose tolerance test. Electromyography was not performed.
The neurological symptoms are now chronic, and importantly, the patient has developed sensory deficits on neurological examination, suggesting worsening of the underlying process. While the paresthesia is now limited to a “stocking/glove” distribution consistent with distal sensory polyneuropathy, there should still be a concern for spinal cord pathology given that the HbA1c level of 6.2 would not explain her initial distribution of symptoms. Myelopathy may mimic peripheral nerve disease if, for example, there is involvement of the dorsal columns leading to sensory deficits of vibration and proprioception. Additionally, the transient episode of upper extremity numbness raises the question of sensory nerve root involvement (ie, sensory radiculopathy). Unexplained abdominal pain could possibly represent the involvement of other nerve roots innervating the abdominal wall. The patient’s episode of focal arm numbness recalls the lancinating radicular pain of tabes dorsalis; however, the negative specific treponemal antibody test excludes neurosyphilis.
The differential diagnosis going forward will be strongly conditioned by the localization of the neurological lesion(s). To differentiate between myelopathy, radiculopathy, and peripheral neuropathy, I would perform nerve conduction studies, magnetic resonance imaging (MRI) of the spinal cord, and cerebrospinal fluid analysis.
The patient began taking a multivitamin, and after weeks her paresthesia had resolved. One month later, she developed an intermittent, throbbing left-sided headache and pain behind the left eye that was worsened with ocular movement. She then noted decreased visual acuity in her left eye that progressed the following month. She denied photophobia, flashers, or floaters.
In the emergency department, visual acuity was 20/25 in her right eye; in the left eye she was only able to count fingers. Extraocular movements of both eyes were normal as was her right pupillary reflex. Red desaturation and a relative afferent papillary defect were present in the left eye. Fundoscopic exam demonstrated left optic disc swelling. The remainder of her cranial nerves were normal. She had pronation of the left upper extremity and mild right finger-to-nose dysmetria. Muscle tone, strength, sensation, and deep tendon reflexes were normal.
The improvement in the sensory symptoms was unlikely to be related to the nutritional intervention and provides a clue to an underlying waxing and waning illness. That interpretation is supported by the subsequent development of new visual symptoms and signs, which point to optic nerve pathology. Optic neuropathy has a broad differential diagnosis that includes ischemic, metabolic, toxic, and compressive causes. Eye pain, swelling of the optic disc, and prominent impairment of color vision all point to the more specific syndrome of optic neuritis caused by infections (including both Treponema pallidum and Borrelia species), systemic autoimmune diseases (systemic lupus erythematosus or Sjogren’s syndrome), and central nervous system (CNS) demyelinating diseases. Of these, inflammatory demyelinating processes would be the likeliest explanation of intermittent and improving neurologic findings.
With relapsing symptoms and findings that are separate in distribution and time, two diagnoses become most likely, and both of these are most often diagnosed in young women. MS is common, and optic neuritis occurs in more than 50% of patients over the course of illness. Neuromyelitis optica spectrum disorder (NMOSD) is a rare condition that can exist in isolation or be associated with other autoimmune illnesses. While these entities are difficult to differentiate clinically, neuroimaging that demonstrates extensive intracerebral demyelinating lesions and cerebrospinal fluid with oligoclonal bands favor MS, whereas extensive, predominant spinal cord involvement is suggestive of NMOSD. Approximately 70% of NMO patients harbor an antibody directed against the aquaporin-4 channel, and these antibodies are not seen in patients with MS. A milder NMO-like disorder has also been associated with antimyelin oligodendrocyte antibodies (MOG).
Testing for antinuclear antibodies, anti–double-stranded DNA, anti-Ro (SSA), and anti-La (SSB) antibodies was negative. The level of C3 was 162 mg per deciliter (normal range 81-157) and C4 38 (normal range 13-39). T-spot testing for latent tuberculosis was negative.
There is no serological evidence of active systemic lupus erythematosus or Sjogren’s syndrome. The pretest probability of CNS tuberculosis was low in light of her presenting complaints, relatively protracted course, and overall clinical stability without antituberculous therapy. Tests for latent tuberculosis infection have significant limitations of both sensitivity and specificity for the diagnosis of active disease.
Optical coherence tomography showed optic disc edema in the left eye only. MRI of the head with contrast revealed abnormal signal intensity involving the posterior aspect of the pons, right middle cerebellar peduncle, anterior left temporal lobe, bilateral periventricular white matter, subcortical white matter of the frontal lobes bilaterally, and medulla with abnormal signal and enhancement of the left optic nerve (Figure, Panel A). MRI of the cervical and thoracic spine demonstrated multifocal demyelinating lesions at C3, C4, C7, T4, T5, T7, and T8 (Figure, Panel B). The lesions were not longitudinally extensive. There was no significant postcontrast enhancement to suggest active demyelination.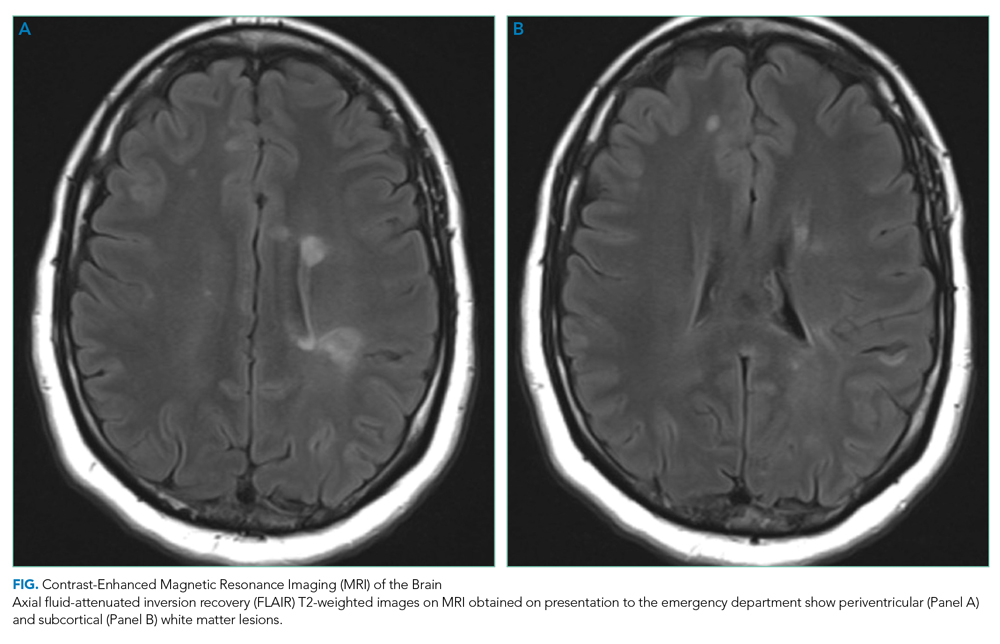
The cerebrospinal fluid analysis revealed glucose of 105 mg per deciliter and a total protein of 26.1 mg per deciliter. In the fourth tube, there were 20 red cells per cubic and four white cells with a differential of 62% neutrophils, 35% lymphocytes, and 3% monocytes. Epstein-Barr and herpes simplex virus DNA were negative. A Venereal Disease Research Laboratory test was negative. Multiple oligoclonal IgG bands were identified only in the cerebrospinal fluid. Aquaporin-4 IgG and MOG antibodies were negative.
In addition to the expected finding of enhancement of the optic nerve, MRI demonstrated numerous multifocal white matter lesions throughout the cerebrum, brainstem, and spinal cord. Many of the lesions were in “silent” areas, which is not directly attributable to specific symptoms, but several did correlate with the subtler deficits of weakness and dysmetria that were noted on examination. Although such lesions may be seen with a diverse group of systemic diseases including adrenal leukodystrophy, sarcoidosis, Behcet’s, cerebral lupus, and vasculitis, primary CNS inflammatory demyelinating diseases are much more likely. The extensive distribution of demyelination argues against NMOSD. The negative aquaporin-4 and MOG assays support this conclusion. Not all multifocal CNS demyelination is caused by MS and can be seen in posterior reversible encephalopathy syndrome, cerebral autosomal dominant arteriopathy with subcortical infarcts and leukoencephalopathy, and adult polyglucosan body disease. Osmotic demyelination is increasingly being recognized as a process that can be more widespread rather than just being limited to the pons. Viral infections of the CNS such as the JC virus (PML) may also provoke multifocal demyelination. Acute disseminated encephalomyelitis is most often seen during childhood, usually after vaccination or after an infectious prodrome. The tempo of the progression of these other diseases tends to be much more rapid than this woman’s course, and often, the neurological deficits are more profound and debilitating. The clinical presentation of sensory-predominant myelopathy, followed by optic neuritis, absence of systemic inflammatory signs or laboratory markers, exclusion of other relevant diseases, multifocal white matter lesions on imaging, minimal pleocytosis, and presence of oligoclonal bands in cerebrospinal fluid, all point to a diagnosis of relapsing-remitting MS.
The patient was diagnosed with MS. She was admitted to the neurology service and treated with 1,000 mg IV methylprednisolone for 3 days with a prompt improvement in her vision. She was started on natalizumab without a relapse of symptoms over the past year.
COMMENTARY
Multiple sclerosis is a chronic demyelinating disease of the CNS.1 The diagnosis of MS has classically been based upon compatible clinical and radiographic evidence of pathology that is disseminated in space and time. Patients typically present with an initial clinically isolated syndrome—involving changes in vision, sensation, strength, mobility, or cognition—for which there is radiographic evidence of demyelination.2 A diagnosis of clinically definite MS is then often made based on a subsequent relapse of symptoms.3
An interval from initial symptoms has been central to the diagnosis of MS (“lesions disseminated in time”). However, recent evidence questions this diagnostic paradigm, and a more rapid diagnosis of MS has been recommended. This recommendation is reflected in the updated McDonald criteria, according to which, if a clinical presentation is supported by the presence of oligoclonal bands in the cerebrospinal fluid, a diagnosis can be made on the basis of radiographic evidence of dissemination of disease in space, without evidence of dissemination in time.4 The importance of such early diagnosis has been supported by numerous studies that have demonstrated improved clinical outcomes with early therapy.5-7
Despite the McDonald criteria, delays in definitive diagnosis are common in MS. Patients with MS in Spain were found to experience a 2-year delay from the first onset of symptoms to diagnosis.8 In this cohort, patients exhibited delays in presenting to a healthcare provider, as well as delays in diagnosis with an average time from seeing an initial provider to diagnosis of 6 months. When patients who were referred for a demyelinating episode were surveyed, over a third reported a prior suggestive event.9 The time from the first suggestive episode to referral to a neurologist for a recognized demyelinating event was 46 months. Other studies have shown that delays in diagnosis are especially common in younger patients, those with primary progressive MS, and those with comorbid disease.10,11
Misapplication of an MS diagnosis also occurs frequently. In one case series, such misapplication was found most often in cases involving migraine, fibromyalgia, psychogenic disorders, and NMOSD.12 NMOSD is distinguished from MS by the presence of typical brain and spine findings on MRI.13 Antibodies to aquaporin-4 are highly specific and moderately sensitive for the disease.14 It is important to distinguish NMOSD from MS as certain disease-modifying drugs used for MS might actually exacerbate NMOSD.15 A lesion that traverses over three or more contiguous vertebral segments with predominant involvement of central gray matter (ie, longitudinally extensive transverse myelitis) on MRI is the most distinct finding of NMOSD. In contrast, similar to our patient, short and often multiple lesions are demonstrated on spinal cord MRI in patients with MS. Sensitive and specific findings of brain MRI in patients with MS include the presence of lateral ventricle and inferior temporal lobe lesion, Dawson’s fingers, central vein sign, or an S-shaped U-fiber lesion. In NMOSD, brain MRI might reveal periependymal lesions surrounding the ventricular system.
This case highlights the diagnostic challenges related to presentations of a waxing and waning neurological process. At the time of the second evaluation, the presentation was interpreted as a length-dependent polyneuropathy due to glucose intolerance. Our patient’s relatively normal HbA1c, subacute onset of neuropathic symptoms (ie, <4 weeks), sensory and motor complaints, and onset in the upper extremities suggested an alternative diagnosis to prediabetes. Once the patient presented with optic neuritis, the cause of the initial symptoms was obvious, but then, hindsight is 20/20.
TEACHING POINTS
- Early treatment of MS results in improved clinical outcomes.
- Delays in the definitive diagnosis of MS are common, especially in younger patients, those with primary progressive MS, and those with comorbid disease.
- If a clinical presentation is supported by the presence of oligoclonal bands in the cerebrospinal fluid, a diagnosis of MS can be made on the basis of radiographic evidence of dissemination of disease in space, without evidence of dissemination in time.
Acknowledgments
The authors wish to thank Rabih Geha, MD, and Gurpreet Dhaliwal, MD, for providing feedback on an earlier version of this manuscript.
1. Reich DS, Lucchinetti CF, Calabresi PA. Multiple sclerosis. N Engl J Med. 2018;378:169-180. https://doi.org/10.1056/NEJMra140148.
2. Brownlee WJ, Hardy TA, Fazekas F, Miller DH. Diagnosis of multiple sclerosis: progress and challenges. Lancet. 2017;389(10076):1336-1346. https://doi.org/10.1016/S0140-6736(16)30959-X.
3. Thompson AJ, Baranzini SE, Geurts J, Hemmer B, Ciccarelli O. Multiple sclerosis. Lancet. 2018;391(10130):1622-1636. https://doi.org/10.1016/S0140-6736(18)30481-1.
4. Thompson AJ, Banwell BL, Barkhof F, et al. Diagnosis of multiple sclerosis: 2017 revisions of the McDonald criteria. Lancet Neurol. 2018;17(2):162-173. https://doi.org/10.1016/S1474-4422(17)30470-2.
5. Comi G, Radaelli M, Soelberg Sørensen P. Evolving concepts in the treatment of relapsing multiple sclerosis. Lancet. 2017;389(10076):1347-1356. https://doi.org/10.1016/S0140-6736(16)32388-1.
6. Freedman MS, Comi G, De Stefano N, et al. Moving toward earlier treatment of multiple sclerosis: Findings from a decade of clinical trials and implications for clinical practice. Mult Scler Relat Disord. 2014;3(2):147-155. https://doi.org/10.1016/j.msard.2013.07.001.
7. Harding K, Williams O, Willis M, et al. Clinical outcomes of escalation vs early intensive disease-modifying therapy in patients with multiple sclerosis. JAMA Neurol. 2019;76(5):536-541. https://doi.org/10.1001/jamaneurol.2018.4905.
8. Fernández O, Fernández V, Arbizu T, et al. Characteristics of multiple sclerosis at onset and delay of diagnosis and treatment in Spain (the Novo Study). J Neurol. 257(9):1500-1507. https://doi.org/10.1007/s00415-010-5560-1.
9. Gout O, Lebrun-Frenay C, Labauge P, et al. Prior suggestive symptoms in one-third of patients consulting for a “first” demyelinating event. J Neurol Neurosurg Psychiatry 2011;82(3):323-325. https://doi.org/10.1136/jnnp.2008.166421.
10. Kingwell E, Leung A, Roger E, et al. Factors associated with delay to medical recognition in two Canadian multiple sclerosis cohorts. J Neurol Sci. 2010(1-2);292:57-62. https://doi.org/10.1016/j.jns.2010.02.007.
11. Marrie RA, Horwitz R, Cutter G, Tyry T, Campagnolo D, Vollmer T. Comorbidity delays diagnosis and increases disability at diagnosis in MS. Neurology. 2009;72(2):117-124. https://doi.org/10.1212/01.wnl.0000333252.78173.5f.
12. Solomon AJ, Bourdette DN, Cross AH, et al. The contemporary spectrum of multiple sclerosis misdiagnosis: A multicenter study. Neurology. 2016;87(13):1393-1399. https://doi.org/10.1212/WNL.0000000000003152.
13. Kim HJ, Paul F, Lana-Peixoto MA, et al. MRI characteristics of neuromyelitis optica spectrum disorder: An international update. Neurology. 2015;84(11):1165-1173. https://doi.org/10.1212/WNL.0000000000001367.
14. Wingerchuk DM, Banwell B, Bennett JL, et al. International consensus diagnostic criteria for neuromyelitis optica spectrum disorders. Neurology. 2015;85(2):177-189. https://doi.org/10.1212/WNL.0000000000001729.
15. Jacob A, Hutchinson M, Elsone L, et al. Does natalizumab therapy worsen neuromyelitis optica? Neurology. 2012;79(10):1065-1066. https://doi.org/10.1212/WNL.0b013e31826845fe.
A 38-year-old woman presented to her primary care clinic with 3 weeks of progressive numbness and tingling sensation, which began in both hands and then progressed to involv
As with all neurological complaints, localization of the process will often inform a more specific differential diagnosis. If both sensory and motor findings are present, both central and peripheral nerve processes deserve consideration. The onset of paresthesia in the hands, rapid progression to the trunk, and unilateral leg weakness would be inconsistent with a length-dependent peripheral neuropathy. The distribution of complaints and the sacral sparing suggests a myelopathic process involving the cervical region rather than a cauda equina or conus lesions. In an otherwise healthy person of this age and gender, an inflammatory demyelinating disease affecting the cord including multiple sclerosis (MS) would be a strong consideration, although metabolic, vascular, infectious, compressive, or neoplastic disease of the spinal cord could also present with similar subacute onset and pattern of deficits.
Her medical history included morbid obesity, dry eyes, depression, iron deficiency anemia requiring recurrent intravenous replenishment, and abnormal uterine bleeding. Her surgical history included gastric band placement 7 years earlier with removal 5 years later due to persistent gastroesophageal reflux disease, dysphagia, nausea, and vomiting. The gastric band removal was complicated by chronic abdominal pain. Her medications consisted of duloxetine, intermittent iron infusions, artificial tears, loratadine, and pregabalin. She was sexually active with her husband. She consumed alcohol occasionally but did not smoke tobacco or use illicit drugs.
On exam, her temperature was 36.6°C (97.8°F), blood pressure 132/84 mm Hg, and heart rate 85 beats per minute. Body mass index was 39.5 kg/m2. The cardiac, pulmonary, and skin examinations were normal. The abdomen was soft with diffuse tenderness to palpation without rebound or guarding. Examination of cranial nerves 2-12 was normal. Cognition, strength, proprioception, deep tendon reflexes, and light touch were all normal. Her gait was normal, and the Romberg test was negative.
The normal neurologic exam is reassuring but imperfectly sensitive and does not eliminate the possibility of underlying neuropathology. Bariatric surgery may result in an array of nutritional deficiencies such as vitamin E, B12, and copper, which can cause myelopathy and/or neuropathy. However, these abnormalities occur less frequently with gastric banding procedures. If her dry eyes are part of the sicca syndrome, an underlying autoimmune diathesis may be present. Her unexplained chronic abdominal pain prompts considering nonmenstrual causes of iron deficiency anemia, such as celiac disease. Bariatric surgery may contribute to iron deficiency through impaired iron absorption. Her stable weight and lack of diarrhea argue against Crohn’s or celiac disease. Iron deficiency predisposes individuals to pica, most commonly described with ice chip ingestion. If lead pica had occurred, abdominal and neurological symptoms could result. Nevertheless, the abdominal pain is nonspecific, and its occurrence after gastric band removal makes its link to her neurologic syndrome unclear. An initial evaluation would include basic metabolic panel, complete blood count with differential, erythrocyte sedimentation rate, C-reactive protein (CRP), thyroid-stimulating hormone, vitamin B12, and copper levels.
A basic metabolic panel was normal. The white cell count was 5,710 per cubic millimeter, hemoglobin level 12.2 g per deciliter, mean corpuscular volume 85.2 fl, and platelet count 279,000 per cubic millimeter. The serum ferritin level was 18 ng per milliliter (normal range, 13-150), iron 28 µg per deciliter (normal range, 50-170), total iron-binding capacity 364 µg per deciliter (normal range, 250-450), and iron saturation 8% (normal range, 20-55). The vitamin B12 level was 621 pg per milliliter (normal range, 232-1,245) and thyroid-stimulating hormone level 1.87 units per milliliter (normal range, 0.50-4.50). Electrolyte and aminotransferase levels were within normal limits. CRP was 1.0 mg per deciliter (normal range, <0.5) and erythrocyte sedimentation rate 33 millimeters per hour (normal range, 4-25). Hepatitis C and HIV antibodies were nonreactive.
The ongoing iron deficiency despite parenteral iron replacement raises the question of ongoing gastrointestinal or genitourinary blood loss. While the level of vitamin B12 in the serum may be misleadingly normal with cobalamin deficiency, a methylmalonic acid level is indicated to evaluate whether tissue stores are depleted. Copper levels are warranted given the prior bariatric surgery. The mild elevations of inflammatory markers are nonspecific but reduce the likelihood of a highly inflammatory process to account for the neurological and abdominal symptoms.
At her 3-month follow-up visit, she noted that the paresthesia had improved and was now limited to her bilateral lower extremities. During the same clinic visit, she experienced a 45-minute episode of ascending left upper extremity numbness. Her physical examination revealed normal strength and reflexes. She had diminished response to pinprick in both legs to the knees and in both hands to the wrists. Vibration sense was diminished in the bilateral lower extremities.
A glycosylated hemoglobin (HbA1c) level was 6.2%. Methylmalonic acid was 69 nmol per liter (normal range, 45-325). Antibodies to Borrelia burgdorferi and Treponema pallidum were absent. Impaired glucose metabolism was the leading diagnosis for her polyneuropathy, and it was recommended that she undergo an oral glucose tolerance test. Electromyography was not performed.
The neurological symptoms are now chronic, and importantly, the patient has developed sensory deficits on neurological examination, suggesting worsening of the underlying process. While the paresthesia is now limited to a “stocking/glove” distribution consistent with distal sensory polyneuropathy, there should still be a concern for spinal cord pathology given that the HbA1c level of 6.2 would not explain her initial distribution of symptoms. Myelopathy may mimic peripheral nerve disease if, for example, there is involvement of the dorsal columns leading to sensory deficits of vibration and proprioception. Additionally, the transient episode of upper extremity numbness raises the question of sensory nerve root involvement (ie, sensory radiculopathy). Unexplained abdominal pain could possibly represent the involvement of other nerve roots innervating the abdominal wall. The patient’s episode of focal arm numbness recalls the lancinating radicular pain of tabes dorsalis; however, the negative specific treponemal antibody test excludes neurosyphilis.
The differential diagnosis going forward will be strongly conditioned by the localization of the neurological lesion(s). To differentiate between myelopathy, radiculopathy, and peripheral neuropathy, I would perform nerve conduction studies, magnetic resonance imaging (MRI) of the spinal cord, and cerebrospinal fluid analysis.
The patient began taking a multivitamin, and after weeks her paresthesia had resolved. One month later, she developed an intermittent, throbbing left-sided headache and pain behind the left eye that was worsened with ocular movement. She then noted decreased visual acuity in her left eye that progressed the following month. She denied photophobia, flashers, or floaters.
In the emergency department, visual acuity was 20/25 in her right eye; in the left eye she was only able to count fingers. Extraocular movements of both eyes were normal as was her right pupillary reflex. Red desaturation and a relative afferent papillary defect were present in the left eye. Fundoscopic exam demonstrated left optic disc swelling. The remainder of her cranial nerves were normal. She had pronation of the left upper extremity and mild right finger-to-nose dysmetria. Muscle tone, strength, sensation, and deep tendon reflexes were normal.
The improvement in the sensory symptoms was unlikely to be related to the nutritional intervention and provides a clue to an underlying waxing and waning illness. That interpretation is supported by the subsequent development of new visual symptoms and signs, which point to optic nerve pathology. Optic neuropathy has a broad differential diagnosis that includes ischemic, metabolic, toxic, and compressive causes. Eye pain, swelling of the optic disc, and prominent impairment of color vision all point to the more specific syndrome of optic neuritis caused by infections (including both Treponema pallidum and Borrelia species), systemic autoimmune diseases (systemic lupus erythematosus or Sjogren’s syndrome), and central nervous system (CNS) demyelinating diseases. Of these, inflammatory demyelinating processes would be the likeliest explanation of intermittent and improving neurologic findings.
With relapsing symptoms and findings that are separate in distribution and time, two diagnoses become most likely, and both of these are most often diagnosed in young women. MS is common, and optic neuritis occurs in more than 50% of patients over the course of illness. Neuromyelitis optica spectrum disorder (NMOSD) is a rare condition that can exist in isolation or be associated with other autoimmune illnesses. While these entities are difficult to differentiate clinically, neuroimaging that demonstrates extensive intracerebral demyelinating lesions and cerebrospinal fluid with oligoclonal bands favor MS, whereas extensive, predominant spinal cord involvement is suggestive of NMOSD. Approximately 70% of NMO patients harbor an antibody directed against the aquaporin-4 channel, and these antibodies are not seen in patients with MS. A milder NMO-like disorder has also been associated with antimyelin oligodendrocyte antibodies (MOG).
Testing for antinuclear antibodies, anti–double-stranded DNA, anti-Ro (SSA), and anti-La (SSB) antibodies was negative. The level of C3 was 162 mg per deciliter (normal range 81-157) and C4 38 (normal range 13-39). T-spot testing for latent tuberculosis was negative.
There is no serological evidence of active systemic lupus erythematosus or Sjogren’s syndrome. The pretest probability of CNS tuberculosis was low in light of her presenting complaints, relatively protracted course, and overall clinical stability without antituberculous therapy. Tests for latent tuberculosis infection have significant limitations of both sensitivity and specificity for the diagnosis of active disease.
Optical coherence tomography showed optic disc edema in the left eye only. MRI of the head with contrast revealed abnormal signal intensity involving the posterior aspect of the pons, right middle cerebellar peduncle, anterior left temporal lobe, bilateral periventricular white matter, subcortical white matter of the frontal lobes bilaterally, and medulla with abnormal signal and enhancement of the left optic nerve (Figure, Panel A). MRI of the cervical and thoracic spine demonstrated multifocal demyelinating lesions at C3, C4, C7, T4, T5, T7, and T8 (Figure, Panel B). The lesions were not longitudinally extensive. There was no significant postcontrast enhancement to suggest active demyelination.
The cerebrospinal fluid analysis revealed glucose of 105 mg per deciliter and a total protein of 26.1 mg per deciliter. In the fourth tube, there were 20 red cells per cubic and four white cells with a differential of 62% neutrophils, 35% lymphocytes, and 3% monocytes. Epstein-Barr and herpes simplex virus DNA were negative. A Venereal Disease Research Laboratory test was negative. Multiple oligoclonal IgG bands were identified only in the cerebrospinal fluid. Aquaporin-4 IgG and MOG antibodies were negative.
In addition to the expected finding of enhancement of the optic nerve, MRI demonstrated numerous multifocal white matter lesions throughout the cerebrum, brainstem, and spinal cord. Many of the lesions were in “silent” areas, which is not directly attributable to specific symptoms, but several did correlate with the subtler deficits of weakness and dysmetria that were noted on examination. Although such lesions may be seen with a diverse group of systemic diseases including adrenal leukodystrophy, sarcoidosis, Behcet’s, cerebral lupus, and vasculitis, primary CNS inflammatory demyelinating diseases are much more likely. The extensive distribution of demyelination argues against NMOSD. The negative aquaporin-4 and MOG assays support this conclusion. Not all multifocal CNS demyelination is caused by MS and can be seen in posterior reversible encephalopathy syndrome, cerebral autosomal dominant arteriopathy with subcortical infarcts and leukoencephalopathy, and adult polyglucosan body disease. Osmotic demyelination is increasingly being recognized as a process that can be more widespread rather than just being limited to the pons. Viral infections of the CNS such as the JC virus (PML) may also provoke multifocal demyelination. Acute disseminated encephalomyelitis is most often seen during childhood, usually after vaccination or after an infectious prodrome. The tempo of the progression of these other diseases tends to be much more rapid than this woman’s course, and often, the neurological deficits are more profound and debilitating. The clinical presentation of sensory-predominant myelopathy, followed by optic neuritis, absence of systemic inflammatory signs or laboratory markers, exclusion of other relevant diseases, multifocal white matter lesions on imaging, minimal pleocytosis, and presence of oligoclonal bands in cerebrospinal fluid, all point to a diagnosis of relapsing-remitting MS.
The patient was diagnosed with MS. She was admitted to the neurology service and treated with 1,000 mg IV methylprednisolone for 3 days with a prompt improvement in her vision. She was started on natalizumab without a relapse of symptoms over the past year.
COMMENTARY
Multiple sclerosis is a chronic demyelinating disease of the CNS.1 The diagnosis of MS has classically been based upon compatible clinical and radiographic evidence of pathology that is disseminated in space and time. Patients typically present with an initial clinically isolated syndrome—involving changes in vision, sensation, strength, mobility, or cognition—for which there is radiographic evidence of demyelination.2 A diagnosis of clinically definite MS is then often made based on a subsequent relapse of symptoms.3
An interval from initial symptoms has been central to the diagnosis of MS (“lesions disseminated in time”). However, recent evidence questions this diagnostic paradigm, and a more rapid diagnosis of MS has been recommended. This recommendation is reflected in the updated McDonald criteria, according to which, if a clinical presentation is supported by the presence of oligoclonal bands in the cerebrospinal fluid, a diagnosis can be made on the basis of radiographic evidence of dissemination of disease in space, without evidence of dissemination in time.4 The importance of such early diagnosis has been supported by numerous studies that have demonstrated improved clinical outcomes with early therapy.5-7
Despite the McDonald criteria, delays in definitive diagnosis are common in MS. Patients with MS in Spain were found to experience a 2-year delay from the first onset of symptoms to diagnosis.8 In this cohort, patients exhibited delays in presenting to a healthcare provider, as well as delays in diagnosis with an average time from seeing an initial provider to diagnosis of 6 months. When patients who were referred for a demyelinating episode were surveyed, over a third reported a prior suggestive event.9 The time from the first suggestive episode to referral to a neurologist for a recognized demyelinating event was 46 months. Other studies have shown that delays in diagnosis are especially common in younger patients, those with primary progressive MS, and those with comorbid disease.10,11
Misapplication of an MS diagnosis also occurs frequently. In one case series, such misapplication was found most often in cases involving migraine, fibromyalgia, psychogenic disorders, and NMOSD.12 NMOSD is distinguished from MS by the presence of typical brain and spine findings on MRI.13 Antibodies to aquaporin-4 are highly specific and moderately sensitive for the disease.14 It is important to distinguish NMOSD from MS as certain disease-modifying drugs used for MS might actually exacerbate NMOSD.15 A lesion that traverses over three or more contiguous vertebral segments with predominant involvement of central gray matter (ie, longitudinally extensive transverse myelitis) on MRI is the most distinct finding of NMOSD. In contrast, similar to our patient, short and often multiple lesions are demonstrated on spinal cord MRI in patients with MS. Sensitive and specific findings of brain MRI in patients with MS include the presence of lateral ventricle and inferior temporal lobe lesion, Dawson’s fingers, central vein sign, or an S-shaped U-fiber lesion. In NMOSD, brain MRI might reveal periependymal lesions surrounding the ventricular system.
This case highlights the diagnostic challenges related to presentations of a waxing and waning neurological process. At the time of the second evaluation, the presentation was interpreted as a length-dependent polyneuropathy due to glucose intolerance. Our patient’s relatively normal HbA1c, subacute onset of neuropathic symptoms (ie, <4 weeks), sensory and motor complaints, and onset in the upper extremities suggested an alternative diagnosis to prediabetes. Once the patient presented with optic neuritis, the cause of the initial symptoms was obvious, but then, hindsight is 20/20.
TEACHING POINTS
- Early treatment of MS results in improved clinical outcomes.
- Delays in the definitive diagnosis of MS are common, especially in younger patients, those with primary progressive MS, and those with comorbid disease.
- If a clinical presentation is supported by the presence of oligoclonal bands in the cerebrospinal fluid, a diagnosis of MS can be made on the basis of radiographic evidence of dissemination of disease in space, without evidence of dissemination in time.
Acknowledgments
The authors wish to thank Rabih Geha, MD, and Gurpreet Dhaliwal, MD, for providing feedback on an earlier version of this manuscript.
A 38-year-old woman presented to her primary care clinic with 3 weeks of progressive numbness and tingling sensation, which began in both hands and then progressed to involv
As with all neurological complaints, localization of the process will often inform a more specific differential diagnosis. If both sensory and motor findings are present, both central and peripheral nerve processes deserve consideration. The onset of paresthesia in the hands, rapid progression to the trunk, and unilateral leg weakness would be inconsistent with a length-dependent peripheral neuropathy. The distribution of complaints and the sacral sparing suggests a myelopathic process involving the cervical region rather than a cauda equina or conus lesions. In an otherwise healthy person of this age and gender, an inflammatory demyelinating disease affecting the cord including multiple sclerosis (MS) would be a strong consideration, although metabolic, vascular, infectious, compressive, or neoplastic disease of the spinal cord could also present with similar subacute onset and pattern of deficits.
Her medical history included morbid obesity, dry eyes, depression, iron deficiency anemia requiring recurrent intravenous replenishment, and abnormal uterine bleeding. Her surgical history included gastric band placement 7 years earlier with removal 5 years later due to persistent gastroesophageal reflux disease, dysphagia, nausea, and vomiting. The gastric band removal was complicated by chronic abdominal pain. Her medications consisted of duloxetine, intermittent iron infusions, artificial tears, loratadine, and pregabalin. She was sexually active with her husband. She consumed alcohol occasionally but did not smoke tobacco or use illicit drugs.
On exam, her temperature was 36.6°C (97.8°F), blood pressure 132/84 mm Hg, and heart rate 85 beats per minute. Body mass index was 39.5 kg/m2. The cardiac, pulmonary, and skin examinations were normal. The abdomen was soft with diffuse tenderness to palpation without rebound or guarding. Examination of cranial nerves 2-12 was normal. Cognition, strength, proprioception, deep tendon reflexes, and light touch were all normal. Her gait was normal, and the Romberg test was negative.
The normal neurologic exam is reassuring but imperfectly sensitive and does not eliminate the possibility of underlying neuropathology. Bariatric surgery may result in an array of nutritional deficiencies such as vitamin E, B12, and copper, which can cause myelopathy and/or neuropathy. However, these abnormalities occur less frequently with gastric banding procedures. If her dry eyes are part of the sicca syndrome, an underlying autoimmune diathesis may be present. Her unexplained chronic abdominal pain prompts considering nonmenstrual causes of iron deficiency anemia, such as celiac disease. Bariatric surgery may contribute to iron deficiency through impaired iron absorption. Her stable weight and lack of diarrhea argue against Crohn’s or celiac disease. Iron deficiency predisposes individuals to pica, most commonly described with ice chip ingestion. If lead pica had occurred, abdominal and neurological symptoms could result. Nevertheless, the abdominal pain is nonspecific, and its occurrence after gastric band removal makes its link to her neurologic syndrome unclear. An initial evaluation would include basic metabolic panel, complete blood count with differential, erythrocyte sedimentation rate, C-reactive protein (CRP), thyroid-stimulating hormone, vitamin B12, and copper levels.
A basic metabolic panel was normal. The white cell count was 5,710 per cubic millimeter, hemoglobin level 12.2 g per deciliter, mean corpuscular volume 85.2 fl, and platelet count 279,000 per cubic millimeter. The serum ferritin level was 18 ng per milliliter (normal range, 13-150), iron 28 µg per deciliter (normal range, 50-170), total iron-binding capacity 364 µg per deciliter (normal range, 250-450), and iron saturation 8% (normal range, 20-55). The vitamin B12 level was 621 pg per milliliter (normal range, 232-1,245) and thyroid-stimulating hormone level 1.87 units per milliliter (normal range, 0.50-4.50). Electrolyte and aminotransferase levels were within normal limits. CRP was 1.0 mg per deciliter (normal range, <0.5) and erythrocyte sedimentation rate 33 millimeters per hour (normal range, 4-25). Hepatitis C and HIV antibodies were nonreactive.
The ongoing iron deficiency despite parenteral iron replacement raises the question of ongoing gastrointestinal or genitourinary blood loss. While the level of vitamin B12 in the serum may be misleadingly normal with cobalamin deficiency, a methylmalonic acid level is indicated to evaluate whether tissue stores are depleted. Copper levels are warranted given the prior bariatric surgery. The mild elevations of inflammatory markers are nonspecific but reduce the likelihood of a highly inflammatory process to account for the neurological and abdominal symptoms.
At her 3-month follow-up visit, she noted that the paresthesia had improved and was now limited to her bilateral lower extremities. During the same clinic visit, she experienced a 45-minute episode of ascending left upper extremity numbness. Her physical examination revealed normal strength and reflexes. She had diminished response to pinprick in both legs to the knees and in both hands to the wrists. Vibration sense was diminished in the bilateral lower extremities.
A glycosylated hemoglobin (HbA1c) level was 6.2%. Methylmalonic acid was 69 nmol per liter (normal range, 45-325). Antibodies to Borrelia burgdorferi and Treponema pallidum were absent. Impaired glucose metabolism was the leading diagnosis for her polyneuropathy, and it was recommended that she undergo an oral glucose tolerance test. Electromyography was not performed.
The neurological symptoms are now chronic, and importantly, the patient has developed sensory deficits on neurological examination, suggesting worsening of the underlying process. While the paresthesia is now limited to a “stocking/glove” distribution consistent with distal sensory polyneuropathy, there should still be a concern for spinal cord pathology given that the HbA1c level of 6.2 would not explain her initial distribution of symptoms. Myelopathy may mimic peripheral nerve disease if, for example, there is involvement of the dorsal columns leading to sensory deficits of vibration and proprioception. Additionally, the transient episode of upper extremity numbness raises the question of sensory nerve root involvement (ie, sensory radiculopathy). Unexplained abdominal pain could possibly represent the involvement of other nerve roots innervating the abdominal wall. The patient’s episode of focal arm numbness recalls the lancinating radicular pain of tabes dorsalis; however, the negative specific treponemal antibody test excludes neurosyphilis.
The differential diagnosis going forward will be strongly conditioned by the localization of the neurological lesion(s). To differentiate between myelopathy, radiculopathy, and peripheral neuropathy, I would perform nerve conduction studies, magnetic resonance imaging (MRI) of the spinal cord, and cerebrospinal fluid analysis.
The patient began taking a multivitamin, and after weeks her paresthesia had resolved. One month later, she developed an intermittent, throbbing left-sided headache and pain behind the left eye that was worsened with ocular movement. She then noted decreased visual acuity in her left eye that progressed the following month. She denied photophobia, flashers, or floaters.
In the emergency department, visual acuity was 20/25 in her right eye; in the left eye she was only able to count fingers. Extraocular movements of both eyes were normal as was her right pupillary reflex. Red desaturation and a relative afferent papillary defect were present in the left eye. Fundoscopic exam demonstrated left optic disc swelling. The remainder of her cranial nerves were normal. She had pronation of the left upper extremity and mild right finger-to-nose dysmetria. Muscle tone, strength, sensation, and deep tendon reflexes were normal.
The improvement in the sensory symptoms was unlikely to be related to the nutritional intervention and provides a clue to an underlying waxing and waning illness. That interpretation is supported by the subsequent development of new visual symptoms and signs, which point to optic nerve pathology. Optic neuropathy has a broad differential diagnosis that includes ischemic, metabolic, toxic, and compressive causes. Eye pain, swelling of the optic disc, and prominent impairment of color vision all point to the more specific syndrome of optic neuritis caused by infections (including both Treponema pallidum and Borrelia species), systemic autoimmune diseases (systemic lupus erythematosus or Sjogren’s syndrome), and central nervous system (CNS) demyelinating diseases. Of these, inflammatory demyelinating processes would be the likeliest explanation of intermittent and improving neurologic findings.
With relapsing symptoms and findings that are separate in distribution and time, two diagnoses become most likely, and both of these are most often diagnosed in young women. MS is common, and optic neuritis occurs in more than 50% of patients over the course of illness. Neuromyelitis optica spectrum disorder (NMOSD) is a rare condition that can exist in isolation or be associated with other autoimmune illnesses. While these entities are difficult to differentiate clinically, neuroimaging that demonstrates extensive intracerebral demyelinating lesions and cerebrospinal fluid with oligoclonal bands favor MS, whereas extensive, predominant spinal cord involvement is suggestive of NMOSD. Approximately 70% of NMO patients harbor an antibody directed against the aquaporin-4 channel, and these antibodies are not seen in patients with MS. A milder NMO-like disorder has also been associated with antimyelin oligodendrocyte antibodies (MOG).
Testing for antinuclear antibodies, anti–double-stranded DNA, anti-Ro (SSA), and anti-La (SSB) antibodies was negative. The level of C3 was 162 mg per deciliter (normal range 81-157) and C4 38 (normal range 13-39). T-spot testing for latent tuberculosis was negative.
There is no serological evidence of active systemic lupus erythematosus or Sjogren’s syndrome. The pretest probability of CNS tuberculosis was low in light of her presenting complaints, relatively protracted course, and overall clinical stability without antituberculous therapy. Tests for latent tuberculosis infection have significant limitations of both sensitivity and specificity for the diagnosis of active disease.
Optical coherence tomography showed optic disc edema in the left eye only. MRI of the head with contrast revealed abnormal signal intensity involving the posterior aspect of the pons, right middle cerebellar peduncle, anterior left temporal lobe, bilateral periventricular white matter, subcortical white matter of the frontal lobes bilaterally, and medulla with abnormal signal and enhancement of the left optic nerve (Figure, Panel A). MRI of the cervical and thoracic spine demonstrated multifocal demyelinating lesions at C3, C4, C7, T4, T5, T7, and T8 (Figure, Panel B). The lesions were not longitudinally extensive. There was no significant postcontrast enhancement to suggest active demyelination.
The cerebrospinal fluid analysis revealed glucose of 105 mg per deciliter and a total protein of 26.1 mg per deciliter. In the fourth tube, there were 20 red cells per cubic and four white cells with a differential of 62% neutrophils, 35% lymphocytes, and 3% monocytes. Epstein-Barr and herpes simplex virus DNA were negative. A Venereal Disease Research Laboratory test was negative. Multiple oligoclonal IgG bands were identified only in the cerebrospinal fluid. Aquaporin-4 IgG and MOG antibodies were negative.
In addition to the expected finding of enhancement of the optic nerve, MRI demonstrated numerous multifocal white matter lesions throughout the cerebrum, brainstem, and spinal cord. Many of the lesions were in “silent” areas, which is not directly attributable to specific symptoms, but several did correlate with the subtler deficits of weakness and dysmetria that were noted on examination. Although such lesions may be seen with a diverse group of systemic diseases including adrenal leukodystrophy, sarcoidosis, Behcet’s, cerebral lupus, and vasculitis, primary CNS inflammatory demyelinating diseases are much more likely. The extensive distribution of demyelination argues against NMOSD. The negative aquaporin-4 and MOG assays support this conclusion. Not all multifocal CNS demyelination is caused by MS and can be seen in posterior reversible encephalopathy syndrome, cerebral autosomal dominant arteriopathy with subcortical infarcts and leukoencephalopathy, and adult polyglucosan body disease. Osmotic demyelination is increasingly being recognized as a process that can be more widespread rather than just being limited to the pons. Viral infections of the CNS such as the JC virus (PML) may also provoke multifocal demyelination. Acute disseminated encephalomyelitis is most often seen during childhood, usually after vaccination or after an infectious prodrome. The tempo of the progression of these other diseases tends to be much more rapid than this woman’s course, and often, the neurological deficits are more profound and debilitating. The clinical presentation of sensory-predominant myelopathy, followed by optic neuritis, absence of systemic inflammatory signs or laboratory markers, exclusion of other relevant diseases, multifocal white matter lesions on imaging, minimal pleocytosis, and presence of oligoclonal bands in cerebrospinal fluid, all point to a diagnosis of relapsing-remitting MS.
The patient was diagnosed with MS. She was admitted to the neurology service and treated with 1,000 mg IV methylprednisolone for 3 days with a prompt improvement in her vision. She was started on natalizumab without a relapse of symptoms over the past year.
COMMENTARY
Multiple sclerosis is a chronic demyelinating disease of the CNS.1 The diagnosis of MS has classically been based upon compatible clinical and radiographic evidence of pathology that is disseminated in space and time. Patients typically present with an initial clinically isolated syndrome—involving changes in vision, sensation, strength, mobility, or cognition—for which there is radiographic evidence of demyelination.2 A diagnosis of clinically definite MS is then often made based on a subsequent relapse of symptoms.3
An interval from initial symptoms has been central to the diagnosis of MS (“lesions disseminated in time”). However, recent evidence questions this diagnostic paradigm, and a more rapid diagnosis of MS has been recommended. This recommendation is reflected in the updated McDonald criteria, according to which, if a clinical presentation is supported by the presence of oligoclonal bands in the cerebrospinal fluid, a diagnosis can be made on the basis of radiographic evidence of dissemination of disease in space, without evidence of dissemination in time.4 The importance of such early diagnosis has been supported by numerous studies that have demonstrated improved clinical outcomes with early therapy.5-7
Despite the McDonald criteria, delays in definitive diagnosis are common in MS. Patients with MS in Spain were found to experience a 2-year delay from the first onset of symptoms to diagnosis.8 In this cohort, patients exhibited delays in presenting to a healthcare provider, as well as delays in diagnosis with an average time from seeing an initial provider to diagnosis of 6 months. When patients who were referred for a demyelinating episode were surveyed, over a third reported a prior suggestive event.9 The time from the first suggestive episode to referral to a neurologist for a recognized demyelinating event was 46 months. Other studies have shown that delays in diagnosis are especially common in younger patients, those with primary progressive MS, and those with comorbid disease.10,11
Misapplication of an MS diagnosis also occurs frequently. In one case series, such misapplication was found most often in cases involving migraine, fibromyalgia, psychogenic disorders, and NMOSD.12 NMOSD is distinguished from MS by the presence of typical brain and spine findings on MRI.13 Antibodies to aquaporin-4 are highly specific and moderately sensitive for the disease.14 It is important to distinguish NMOSD from MS as certain disease-modifying drugs used for MS might actually exacerbate NMOSD.15 A lesion that traverses over three or more contiguous vertebral segments with predominant involvement of central gray matter (ie, longitudinally extensive transverse myelitis) on MRI is the most distinct finding of NMOSD. In contrast, similar to our patient, short and often multiple lesions are demonstrated on spinal cord MRI in patients with MS. Sensitive and specific findings of brain MRI in patients with MS include the presence of lateral ventricle and inferior temporal lobe lesion, Dawson’s fingers, central vein sign, or an S-shaped U-fiber lesion. In NMOSD, brain MRI might reveal periependymal lesions surrounding the ventricular system.
This case highlights the diagnostic challenges related to presentations of a waxing and waning neurological process. At the time of the second evaluation, the presentation was interpreted as a length-dependent polyneuropathy due to glucose intolerance. Our patient’s relatively normal HbA1c, subacute onset of neuropathic symptoms (ie, <4 weeks), sensory and motor complaints, and onset in the upper extremities suggested an alternative diagnosis to prediabetes. Once the patient presented with optic neuritis, the cause of the initial symptoms was obvious, but then, hindsight is 20/20.
TEACHING POINTS
- Early treatment of MS results in improved clinical outcomes.
- Delays in the definitive diagnosis of MS are common, especially in younger patients, those with primary progressive MS, and those with comorbid disease.
- If a clinical presentation is supported by the presence of oligoclonal bands in the cerebrospinal fluid, a diagnosis of MS can be made on the basis of radiographic evidence of dissemination of disease in space, without evidence of dissemination in time.
Acknowledgments
The authors wish to thank Rabih Geha, MD, and Gurpreet Dhaliwal, MD, for providing feedback on an earlier version of this manuscript.
1. Reich DS, Lucchinetti CF, Calabresi PA. Multiple sclerosis. N Engl J Med. 2018;378:169-180. https://doi.org/10.1056/NEJMra140148.
2. Brownlee WJ, Hardy TA, Fazekas F, Miller DH. Diagnosis of multiple sclerosis: progress and challenges. Lancet. 2017;389(10076):1336-1346. https://doi.org/10.1016/S0140-6736(16)30959-X.
3. Thompson AJ, Baranzini SE, Geurts J, Hemmer B, Ciccarelli O. Multiple sclerosis. Lancet. 2018;391(10130):1622-1636. https://doi.org/10.1016/S0140-6736(18)30481-1.
4. Thompson AJ, Banwell BL, Barkhof F, et al. Diagnosis of multiple sclerosis: 2017 revisions of the McDonald criteria. Lancet Neurol. 2018;17(2):162-173. https://doi.org/10.1016/S1474-4422(17)30470-2.
5. Comi G, Radaelli M, Soelberg Sørensen P. Evolving concepts in the treatment of relapsing multiple sclerosis. Lancet. 2017;389(10076):1347-1356. https://doi.org/10.1016/S0140-6736(16)32388-1.
6. Freedman MS, Comi G, De Stefano N, et al. Moving toward earlier treatment of multiple sclerosis: Findings from a decade of clinical trials and implications for clinical practice. Mult Scler Relat Disord. 2014;3(2):147-155. https://doi.org/10.1016/j.msard.2013.07.001.
7. Harding K, Williams O, Willis M, et al. Clinical outcomes of escalation vs early intensive disease-modifying therapy in patients with multiple sclerosis. JAMA Neurol. 2019;76(5):536-541. https://doi.org/10.1001/jamaneurol.2018.4905.
8. Fernández O, Fernández V, Arbizu T, et al. Characteristics of multiple sclerosis at onset and delay of diagnosis and treatment in Spain (the Novo Study). J Neurol. 257(9):1500-1507. https://doi.org/10.1007/s00415-010-5560-1.
9. Gout O, Lebrun-Frenay C, Labauge P, et al. Prior suggestive symptoms in one-third of patients consulting for a “first” demyelinating event. J Neurol Neurosurg Psychiatry 2011;82(3):323-325. https://doi.org/10.1136/jnnp.2008.166421.
10. Kingwell E, Leung A, Roger E, et al. Factors associated with delay to medical recognition in two Canadian multiple sclerosis cohorts. J Neurol Sci. 2010(1-2);292:57-62. https://doi.org/10.1016/j.jns.2010.02.007.
11. Marrie RA, Horwitz R, Cutter G, Tyry T, Campagnolo D, Vollmer T. Comorbidity delays diagnosis and increases disability at diagnosis in MS. Neurology. 2009;72(2):117-124. https://doi.org/10.1212/01.wnl.0000333252.78173.5f.
12. Solomon AJ, Bourdette DN, Cross AH, et al. The contemporary spectrum of multiple sclerosis misdiagnosis: A multicenter study. Neurology. 2016;87(13):1393-1399. https://doi.org/10.1212/WNL.0000000000003152.
13. Kim HJ, Paul F, Lana-Peixoto MA, et al. MRI characteristics of neuromyelitis optica spectrum disorder: An international update. Neurology. 2015;84(11):1165-1173. https://doi.org/10.1212/WNL.0000000000001367.
14. Wingerchuk DM, Banwell B, Bennett JL, et al. International consensus diagnostic criteria for neuromyelitis optica spectrum disorders. Neurology. 2015;85(2):177-189. https://doi.org/10.1212/WNL.0000000000001729.
15. Jacob A, Hutchinson M, Elsone L, et al. Does natalizumab therapy worsen neuromyelitis optica? Neurology. 2012;79(10):1065-1066. https://doi.org/10.1212/WNL.0b013e31826845fe.
1. Reich DS, Lucchinetti CF, Calabresi PA. Multiple sclerosis. N Engl J Med. 2018;378:169-180. https://doi.org/10.1056/NEJMra140148.
2. Brownlee WJ, Hardy TA, Fazekas F, Miller DH. Diagnosis of multiple sclerosis: progress and challenges. Lancet. 2017;389(10076):1336-1346. https://doi.org/10.1016/S0140-6736(16)30959-X.
3. Thompson AJ, Baranzini SE, Geurts J, Hemmer B, Ciccarelli O. Multiple sclerosis. Lancet. 2018;391(10130):1622-1636. https://doi.org/10.1016/S0140-6736(18)30481-1.
4. Thompson AJ, Banwell BL, Barkhof F, et al. Diagnosis of multiple sclerosis: 2017 revisions of the McDonald criteria. Lancet Neurol. 2018;17(2):162-173. https://doi.org/10.1016/S1474-4422(17)30470-2.
5. Comi G, Radaelli M, Soelberg Sørensen P. Evolving concepts in the treatment of relapsing multiple sclerosis. Lancet. 2017;389(10076):1347-1356. https://doi.org/10.1016/S0140-6736(16)32388-1.
6. Freedman MS, Comi G, De Stefano N, et al. Moving toward earlier treatment of multiple sclerosis: Findings from a decade of clinical trials and implications for clinical practice. Mult Scler Relat Disord. 2014;3(2):147-155. https://doi.org/10.1016/j.msard.2013.07.001.
7. Harding K, Williams O, Willis M, et al. Clinical outcomes of escalation vs early intensive disease-modifying therapy in patients with multiple sclerosis. JAMA Neurol. 2019;76(5):536-541. https://doi.org/10.1001/jamaneurol.2018.4905.
8. Fernández O, Fernández V, Arbizu T, et al. Characteristics of multiple sclerosis at onset and delay of diagnosis and treatment in Spain (the Novo Study). J Neurol. 257(9):1500-1507. https://doi.org/10.1007/s00415-010-5560-1.
9. Gout O, Lebrun-Frenay C, Labauge P, et al. Prior suggestive symptoms in one-third of patients consulting for a “first” demyelinating event. J Neurol Neurosurg Psychiatry 2011;82(3):323-325. https://doi.org/10.1136/jnnp.2008.166421.
10. Kingwell E, Leung A, Roger E, et al. Factors associated with delay to medical recognition in two Canadian multiple sclerosis cohorts. J Neurol Sci. 2010(1-2);292:57-62. https://doi.org/10.1016/j.jns.2010.02.007.
11. Marrie RA, Horwitz R, Cutter G, Tyry T, Campagnolo D, Vollmer T. Comorbidity delays diagnosis and increases disability at diagnosis in MS. Neurology. 2009;72(2):117-124. https://doi.org/10.1212/01.wnl.0000333252.78173.5f.
12. Solomon AJ, Bourdette DN, Cross AH, et al. The contemporary spectrum of multiple sclerosis misdiagnosis: A multicenter study. Neurology. 2016;87(13):1393-1399. https://doi.org/10.1212/WNL.0000000000003152.
13. Kim HJ, Paul F, Lana-Peixoto MA, et al. MRI characteristics of neuromyelitis optica spectrum disorder: An international update. Neurology. 2015;84(11):1165-1173. https://doi.org/10.1212/WNL.0000000000001367.
14. Wingerchuk DM, Banwell B, Bennett JL, et al. International consensus diagnostic criteria for neuromyelitis optica spectrum disorders. Neurology. 2015;85(2):177-189. https://doi.org/10.1212/WNL.0000000000001729.
15. Jacob A, Hutchinson M, Elsone L, et al. Does natalizumab therapy worsen neuromyelitis optica? Neurology. 2012;79(10):1065-1066. https://doi.org/10.1212/WNL.0b013e31826845fe.
© 2020 Society of Hospital Medicine
Surgical Comanagement by Hospitalists: Continued Improvement Over 5 Years
In surgical comanagement (SCM), surgeons and hospitalists share responsibility of care for surgical patients. While SCM has been increasingly utilized, many of the reported models are a modification of the consultation model, in which a group of rotating hospitalists, internists, or geriatricians care for the surgical patients, often after medical complications may have occured.1-4
In August 2012, we implemented SCM in Orthopedic and Neurosurgery services at our institution.5 This model is unique because the same Internal Medicine hospitalists are dedicated year round to the same surgical service. SCM hospitalists see patients on their assigned surgical service only; they do not see patients on the Internal Medicine service. After the first year of implementing SCM, we conducted a propensity score–weighted study with 17,057 discharges in the pre-SCM group (January 2009 to July 2012) and 5,533 discharges in the post-SCM group (September 2012 to September 2013).5 In this study, SCM was associated with a decrease in medical complications, length of stay (LOS), medical consultations, 30-day readmissions, and cost.5
Since SCM requires ongoing investment by institutions, we now report a follow-up study to explore if there were continued improvements in patient outcomes with SCM. In this study, we evaluate if there was a decrease in medical complications, LOS, number of medical consultations, rapid response team calls, and code blues and an increase in patient satisfaction with SCM in Orthopedic and Neurosurgery services between 2012 and 2018.
METHODS
We included 26,380 discharges from Orthopedic and Neurosurgery services between September 1, 2012, and June 30, 2018, at our academic medical center. We excluded patients discharged in August 2012 as we transitioned to the SCM model. Our Institutional Review Board exempted this study from further review.
SCM Structure
SCM structure was detailed in a prior article.5 We have 3.0 clinical full-time equivalents on the Orthopedic surgery SCM service and 1.2 on the Neurosurgery SCM service. On weekdays, during the day (8
During the day, SCM hospitalists receive the first call for medical issues. After 5
SCM hospitalists screen the entire patient list on their assigned surgery service each day. After screening the patient list, SCM hospitalists formally see select patients with preventable or active medical conditions and write notes on the patient’s chart. There are no set criteria to determine which patients would be seen by SCM. This is because surgeries can decompensate stable medical conditions or new unexpected medical complications may occur. Additionally, in our prior study, we reported that SCM reduced medical complications and LOS regardless of age or patient acuity.5
Outcomes
Our primary outcome was proportion of patients with ≥1 medical complication (sepsis, pneumonia, urinary tract infection, delirium, acute kidney injury, atrial fibrillation, or ileus). Our secondary outcomes included mean LOS, proportion of patients with ≥2 medical consultations, rapid response team calls, code blues, and top-box patient satisfaction score. Though cost is an important consideration in implementing SCM, limited financial data were available. However, since LOS is a key component in calculating direct costs,6 we estimated the cost savings per discharge using mean direct cost per day and the difference in mean LOS between pre- and post-SCM groups.5
We defined medical complications using International Classification of Disease (ICD) Codes 9 or 10 that were coded as “not present on admission” (Appendix 1). We used Hospital Consumer Assessment of Healthcare Providers and Systems (HCAHPS) survey for three questions for patient satisfaction: Did doctors treat with courtesy and respect, listen carefully, and explain things in a way you could understand?
Statistical Analysis
We used regression analysis to assess trends in patient characteristics by year (Appendix 2). Logistic regression with logit link was used to assess the yearly change in our binary outcomes (proportion of patients with ≥1 medical complication, those with ≥2 medical consultations, rapid response team calls, code blue, and top-box patient satisfaction score) and reported odds ratios. Gamma regression with identity link was performed for our continuous outcome (LOS). Beta coefficient was reported to estimate the yearly change in LOS under their original scales. Age, primary insurance, race, Charlson comorbidity score, general or regional anesthesia, surgical service, and duration of surgery were adjusted in the regression analyses for outcomes. SAS 9.4 was used for analysis.
RESULTS
Patient characteristics are shown in Table 1. Overall, 62.8% patients were discharged from Orthopedic surgery service, 72.5% patients underwent elective surgery, and 88.8% received general anesthesia. Between 2012 and 2018, there was a significant increase in the median age of patients (from 60 years to 63 years), mean Charlson comorbidity score increased from 1.07 to 1.46, and median case mix index, a measure of patient acuity, increased from 2.10 to 2.36 (Appendix 2).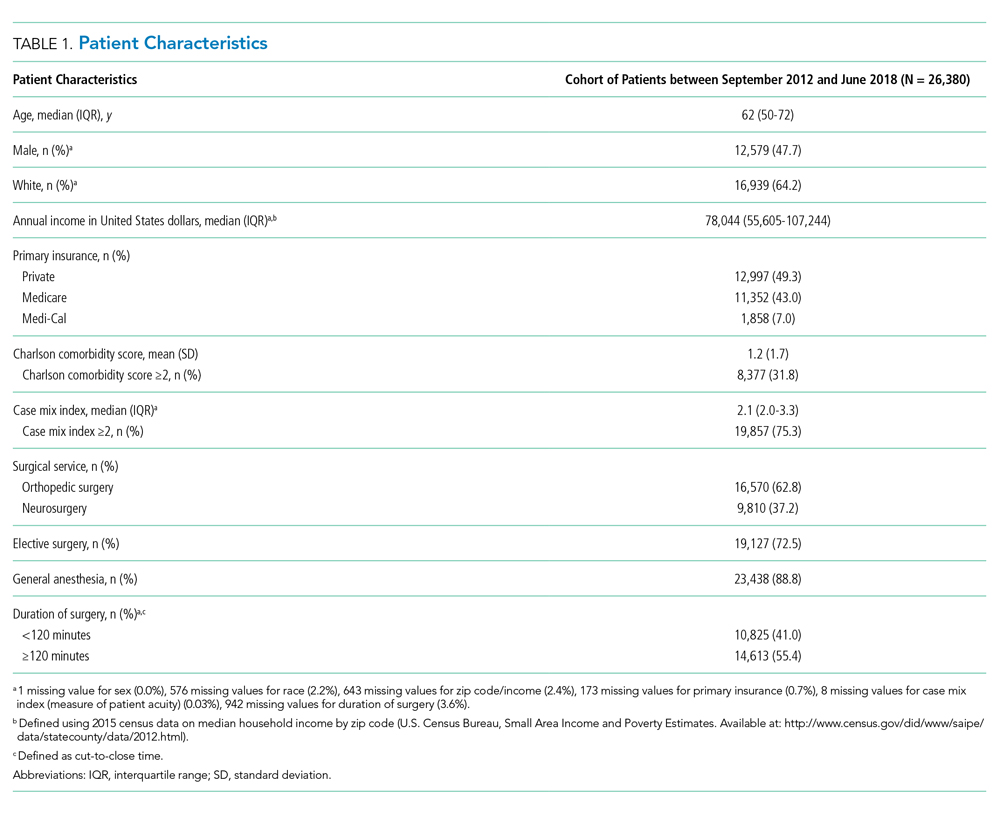
Comparing pre-SCM unadjusted rates reported in our prior study (January 2009 to July 2012) to post-SCM (September 2012 to June 2018; Appendix 3), patients with ≥1 medical complication decreased from 10.1% to 6.1%, LOS (mean ± standard deviation) changed from 5.4 ± 2.2 days to 4.6 ± 5.8 days, patients with ≥2 medical consultations decreased from 19.4% to 9.2%, rapid response team calls changed from 1% to 0.9%, code blues changed from 0.3% to 0.2%, and patients with top-box patient satisfaction score increased from 86.4% to 94.2%.5
In the adjusted analysis from 2012 to 2018, the odds of patients with ≥1 medical complication decreased by 3.8% per year (P = .01), estimated LOS decreased by 0.3 days per year (P < .0001), and the odds of rapid response team calls decreased by 12.2% per year (P = .001; Table 2). Changes over time in the odds of patients with ≥2 medical consultations, code blues, or top-box patient satisfaction score were not statistically significant (Table 2). Based on the LOS reduction pre- to post-SCM, there were estimated average direct cost savings of $3,424 per discharge between 2012 and 2018.
DISCUSSION
Since the implementation of SCM on Orthopedic and Neurosurgery services at our institution, there was a decrease in medical complications, LOS, and rapid response team calls. To our knowledge, this is one of the largest studies evaluating the benefits of SCM over 5.8 years. Similar to our prior studies on this SCM model of care,5,7 other studies have reported a decrease in medical complications,8-10 LOS,11-13 and cost of care14 with SCM.
While the changes in the unadjusted rates of outcomes over the years appeared to be small, while our patient population became older and sicker, there were significant changes in several of our outcomes in the adjusted analysis. We believe that SCM hospitalists have developed a skill set and understanding of these surgical patients over time and can manage more medically complex patients without an increase in medical complications or LOS. We attribute this to our unique SCM model in which the same hospitalists stay year round on the same surgical service. SCM hospitalists have built trusting relationships with the surgical team with greater involvement in decision making, care planning, and patient selection. With minimal turnover in the SCM group and with ongoing learning, SCM hospitalists can anticipate fluid or pain medication requirements after specific surgeries and the surgery-specific medical complications. SCM hospitalists are available on the patient units to provide timely intervention in case of medical deterioration; answer any questions from patients, families, or nursing while the surgical teams may be in the operating room; and coordinate with other medical consultants or outpatient providers as needed.
This study has several limitations. This is a single-center study at an academic institution, limited to two surgical services. We did not have a control group and multiple hospital-wide interventions may have affected these outcomes. This is an observational study in which unobserved variables may bias the results. We used ICD codes to identify medical complications, which relies on the quality of physician documentation. While our response rate of 21.1% for HCAHPS was comparable to the national average of 26.7%, it may not reliably represent our patient population.15 Lastly, we had limited financial data.
CONCLUSION
With the move toward value-based payment and increasing medical complexity of surgical patients, SCM by hospitalists may deliver high-quality care.
1. Auerbach AD, Wachter RM, Cheng HQ, et al. Comanagement of surgical patients between neurosurgeons and hospitalists. Arch Intern Med. 2010;170(22):2004-2010. https://doi.org/10.1001/archinternmed.2010.432
2. Ruiz ME, Merino RÁ, Rodríguez R, Sánchez GM, Alonso A, Barbero M. Effect of comanagement with internal medicine on hospital stay of patients admitted to the service of otolaryngology. Acta Otorrinolaringol Esp. 2015;66(5):264-268. https://doi.org/10.1016/j.otorri.2014.09.010.
3. Tadros RO, Faries PL, Malik R, et al. The effect of a hospitalist comanagement service on vascular surgery inpatients. J Vasc Surg. 2015;61(6):1550-1555. https://doi.org/10.1016/j.jvs.2015.01.006
4. Gregersen M, Mørch MM, Hougaard K, Damsgaard EM. Geriatric intervention in elderly patients with hip fracture in an orthopedic ward. J Inj Violence Res. 2012;4(2):45-51. https://doi.org/10.5249/jivr.v4i2.96
5. Rohatgi N, Loftus P, Grujic O, Cullen M, Hopkins J, Ahuja N. Surgical comanagement by hospitalists improves patient outcomes: A propensity score analysis. Ann Surg. 2016;264(2):275-282. https://doi.org/10.1097/SLA.0000000000001629
6. Polverejan E, Gardiner JC, Bradley CJ, Holmes-Rovner M, Rovner D. Estimating mean hospital cost as a function of length of stay and patient characteristics. Health Econ. 2003;12(11):935-947. https://doi.org/10.1002/hec.774
7. Rohatgi N, Wei PH, Grujic O, Ahuja N. Surgical Comanagement by hospitalists in colorectal surgery. J Am Coll Surg. 2018;227(4):404-410. https://doi.org/10.1016/j.jamcollsurg.2018.06.011
8. Huddleston JM, Long KH, Naessens JM, et al. Medical and surgical comanagement after elective hip and knee arthroplasty: A randomized, controlled trial. Ann Intern Med. 2004;141(1):28-38. https://doi.org/10.7326/0003-4819-141-1-200407060-00012.
9. Swart E, Vasudeva E, Makhni EC, Macaulay W, Bozic KJ. Dedicated perioperative hip fracture comanagement programs are cost-effective in high-volume centers: An economic analysis. Clin Orthop Relat Res. 2016;474(1):222-233. https://doi.org/10.1007/s11999-015-4494-4.
10. Iberti CT, Briones A, Gabriel E, Dunn AS. Hospitalist-vascular surgery comanagement: Effects on complications and mortality. Hosp Pract. 2016;44(5):233-236. https://doi.org/10.1080/21548331.2016.1259543.
11. Kammerlander C, Roth T, Friedman SM, et al. Ortho-geriatric service--A literature review comparing different models. Osteoporos Int. 2010;21(Suppl 4):S637-S646. https://doi.org/10.1007/s00198-010-1396-x.
12. Bracey DN, Kiymaz TC, Holst DC, et al. An orthopedic-hospitalist comanaged hip fracture service reduces inpatient length of stay. Geriatr Orthop Surg Rehabil. 2016;7(4):171-177. https://doi.org/10.1177/2151458516661383.
13. Duplantier NL, Briski DC, Luce LT, Meyer MS, Ochsner JL, Chimento GF. The effects of a hospitalist comanagement model for joint arthroplasty patients in a teaching facility. J Arthroplasty. 2016;31(3):567-572. https://doi.org/10.1016/j.arth.2015.10.010.
14. Roy A, Heckman MG, Roy V. Associations between the hospitalist model of care and quality-of-care-related outcomes in patients undergoing hip fracture surgery. Mayo Clin Proc. 2006;81(1):28-31. https://doi.org/10.4065/81.1.28.
15. Godden E, Paseka A, Gnida J, Inguanzo J. The impact of response rate on Hospital Consumer Assessment of Healthcare Providers and System (HCAHPS) dimension scores. Patient Exp J. 2019;6(1):105-114. https://doi.org/10.35680/2372-0247.1357.
In surgical comanagement (SCM), surgeons and hospitalists share responsibility of care for surgical patients. While SCM has been increasingly utilized, many of the reported models are a modification of the consultation model, in which a group of rotating hospitalists, internists, or geriatricians care for the surgical patients, often after medical complications may have occured.1-4
In August 2012, we implemented SCM in Orthopedic and Neurosurgery services at our institution.5 This model is unique because the same Internal Medicine hospitalists are dedicated year round to the same surgical service. SCM hospitalists see patients on their assigned surgical service only; they do not see patients on the Internal Medicine service. After the first year of implementing SCM, we conducted a propensity score–weighted study with 17,057 discharges in the pre-SCM group (January 2009 to July 2012) and 5,533 discharges in the post-SCM group (September 2012 to September 2013).5 In this study, SCM was associated with a decrease in medical complications, length of stay (LOS), medical consultations, 30-day readmissions, and cost.5
Since SCM requires ongoing investment by institutions, we now report a follow-up study to explore if there were continued improvements in patient outcomes with SCM. In this study, we evaluate if there was a decrease in medical complications, LOS, number of medical consultations, rapid response team calls, and code blues and an increase in patient satisfaction with SCM in Orthopedic and Neurosurgery services between 2012 and 2018.
METHODS
We included 26,380 discharges from Orthopedic and Neurosurgery services between September 1, 2012, and June 30, 2018, at our academic medical center. We excluded patients discharged in August 2012 as we transitioned to the SCM model. Our Institutional Review Board exempted this study from further review.
SCM Structure
SCM structure was detailed in a prior article.5 We have 3.0 clinical full-time equivalents on the Orthopedic surgery SCM service and 1.2 on the Neurosurgery SCM service. On weekdays, during the day (8
During the day, SCM hospitalists receive the first call for medical issues. After 5
SCM hospitalists screen the entire patient list on their assigned surgery service each day. After screening the patient list, SCM hospitalists formally see select patients with preventable or active medical conditions and write notes on the patient’s chart. There are no set criteria to determine which patients would be seen by SCM. This is because surgeries can decompensate stable medical conditions or new unexpected medical complications may occur. Additionally, in our prior study, we reported that SCM reduced medical complications and LOS regardless of age or patient acuity.5
Outcomes
Our primary outcome was proportion of patients with ≥1 medical complication (sepsis, pneumonia, urinary tract infection, delirium, acute kidney injury, atrial fibrillation, or ileus). Our secondary outcomes included mean LOS, proportion of patients with ≥2 medical consultations, rapid response team calls, code blues, and top-box patient satisfaction score. Though cost is an important consideration in implementing SCM, limited financial data were available. However, since LOS is a key component in calculating direct costs,6 we estimated the cost savings per discharge using mean direct cost per day and the difference in mean LOS between pre- and post-SCM groups.5
We defined medical complications using International Classification of Disease (ICD) Codes 9 or 10 that were coded as “not present on admission” (Appendix 1). We used Hospital Consumer Assessment of Healthcare Providers and Systems (HCAHPS) survey for three questions for patient satisfaction: Did doctors treat with courtesy and respect, listen carefully, and explain things in a way you could understand?
Statistical Analysis
We used regression analysis to assess trends in patient characteristics by year (Appendix 2). Logistic regression with logit link was used to assess the yearly change in our binary outcomes (proportion of patients with ≥1 medical complication, those with ≥2 medical consultations, rapid response team calls, code blue, and top-box patient satisfaction score) and reported odds ratios. Gamma regression with identity link was performed for our continuous outcome (LOS). Beta coefficient was reported to estimate the yearly change in LOS under their original scales. Age, primary insurance, race, Charlson comorbidity score, general or regional anesthesia, surgical service, and duration of surgery were adjusted in the regression analyses for outcomes. SAS 9.4 was used for analysis.
RESULTS
Patient characteristics are shown in Table 1. Overall, 62.8% patients were discharged from Orthopedic surgery service, 72.5% patients underwent elective surgery, and 88.8% received general anesthesia. Between 2012 and 2018, there was a significant increase in the median age of patients (from 60 years to 63 years), mean Charlson comorbidity score increased from 1.07 to 1.46, and median case mix index, a measure of patient acuity, increased from 2.10 to 2.36 (Appendix 2).
Comparing pre-SCM unadjusted rates reported in our prior study (January 2009 to July 2012) to post-SCM (September 2012 to June 2018; Appendix 3), patients with ≥1 medical complication decreased from 10.1% to 6.1%, LOS (mean ± standard deviation) changed from 5.4 ± 2.2 days to 4.6 ± 5.8 days, patients with ≥2 medical consultations decreased from 19.4% to 9.2%, rapid response team calls changed from 1% to 0.9%, code blues changed from 0.3% to 0.2%, and patients with top-box patient satisfaction score increased from 86.4% to 94.2%.5
In the adjusted analysis from 2012 to 2018, the odds of patients with ≥1 medical complication decreased by 3.8% per year (P = .01), estimated LOS decreased by 0.3 days per year (P < .0001), and the odds of rapid response team calls decreased by 12.2% per year (P = .001; Table 2). Changes over time in the odds of patients with ≥2 medical consultations, code blues, or top-box patient satisfaction score were not statistically significant (Table 2). Based on the LOS reduction pre- to post-SCM, there were estimated average direct cost savings of $3,424 per discharge between 2012 and 2018.
DISCUSSION
Since the implementation of SCM on Orthopedic and Neurosurgery services at our institution, there was a decrease in medical complications, LOS, and rapid response team calls. To our knowledge, this is one of the largest studies evaluating the benefits of SCM over 5.8 years. Similar to our prior studies on this SCM model of care,5,7 other studies have reported a decrease in medical complications,8-10 LOS,11-13 and cost of care14 with SCM.
While the changes in the unadjusted rates of outcomes over the years appeared to be small, while our patient population became older and sicker, there were significant changes in several of our outcomes in the adjusted analysis. We believe that SCM hospitalists have developed a skill set and understanding of these surgical patients over time and can manage more medically complex patients without an increase in medical complications or LOS. We attribute this to our unique SCM model in which the same hospitalists stay year round on the same surgical service. SCM hospitalists have built trusting relationships with the surgical team with greater involvement in decision making, care planning, and patient selection. With minimal turnover in the SCM group and with ongoing learning, SCM hospitalists can anticipate fluid or pain medication requirements after specific surgeries and the surgery-specific medical complications. SCM hospitalists are available on the patient units to provide timely intervention in case of medical deterioration; answer any questions from patients, families, or nursing while the surgical teams may be in the operating room; and coordinate with other medical consultants or outpatient providers as needed.
This study has several limitations. This is a single-center study at an academic institution, limited to two surgical services. We did not have a control group and multiple hospital-wide interventions may have affected these outcomes. This is an observational study in which unobserved variables may bias the results. We used ICD codes to identify medical complications, which relies on the quality of physician documentation. While our response rate of 21.1% for HCAHPS was comparable to the national average of 26.7%, it may not reliably represent our patient population.15 Lastly, we had limited financial data.
CONCLUSION
With the move toward value-based payment and increasing medical complexity of surgical patients, SCM by hospitalists may deliver high-quality care.
In surgical comanagement (SCM), surgeons and hospitalists share responsibility of care for surgical patients. While SCM has been increasingly utilized, many of the reported models are a modification of the consultation model, in which a group of rotating hospitalists, internists, or geriatricians care for the surgical patients, often after medical complications may have occured.1-4
In August 2012, we implemented SCM in Orthopedic and Neurosurgery services at our institution.5 This model is unique because the same Internal Medicine hospitalists are dedicated year round to the same surgical service. SCM hospitalists see patients on their assigned surgical service only; they do not see patients on the Internal Medicine service. After the first year of implementing SCM, we conducted a propensity score–weighted study with 17,057 discharges in the pre-SCM group (January 2009 to July 2012) and 5,533 discharges in the post-SCM group (September 2012 to September 2013).5 In this study, SCM was associated with a decrease in medical complications, length of stay (LOS), medical consultations, 30-day readmissions, and cost.5
Since SCM requires ongoing investment by institutions, we now report a follow-up study to explore if there were continued improvements in patient outcomes with SCM. In this study, we evaluate if there was a decrease in medical complications, LOS, number of medical consultations, rapid response team calls, and code blues and an increase in patient satisfaction with SCM in Orthopedic and Neurosurgery services between 2012 and 2018.
METHODS
We included 26,380 discharges from Orthopedic and Neurosurgery services between September 1, 2012, and June 30, 2018, at our academic medical center. We excluded patients discharged in August 2012 as we transitioned to the SCM model. Our Institutional Review Board exempted this study from further review.
SCM Structure
SCM structure was detailed in a prior article.5 We have 3.0 clinical full-time equivalents on the Orthopedic surgery SCM service and 1.2 on the Neurosurgery SCM service. On weekdays, during the day (8
During the day, SCM hospitalists receive the first call for medical issues. After 5
SCM hospitalists screen the entire patient list on their assigned surgery service each day. After screening the patient list, SCM hospitalists formally see select patients with preventable or active medical conditions and write notes on the patient’s chart. There are no set criteria to determine which patients would be seen by SCM. This is because surgeries can decompensate stable medical conditions or new unexpected medical complications may occur. Additionally, in our prior study, we reported that SCM reduced medical complications and LOS regardless of age or patient acuity.5
Outcomes
Our primary outcome was proportion of patients with ≥1 medical complication (sepsis, pneumonia, urinary tract infection, delirium, acute kidney injury, atrial fibrillation, or ileus). Our secondary outcomes included mean LOS, proportion of patients with ≥2 medical consultations, rapid response team calls, code blues, and top-box patient satisfaction score. Though cost is an important consideration in implementing SCM, limited financial data were available. However, since LOS is a key component in calculating direct costs,6 we estimated the cost savings per discharge using mean direct cost per day and the difference in mean LOS between pre- and post-SCM groups.5
We defined medical complications using International Classification of Disease (ICD) Codes 9 or 10 that were coded as “not present on admission” (Appendix 1). We used Hospital Consumer Assessment of Healthcare Providers and Systems (HCAHPS) survey for three questions for patient satisfaction: Did doctors treat with courtesy and respect, listen carefully, and explain things in a way you could understand?
Statistical Analysis
We used regression analysis to assess trends in patient characteristics by year (Appendix 2). Logistic regression with logit link was used to assess the yearly change in our binary outcomes (proportion of patients with ≥1 medical complication, those with ≥2 medical consultations, rapid response team calls, code blue, and top-box patient satisfaction score) and reported odds ratios. Gamma regression with identity link was performed for our continuous outcome (LOS). Beta coefficient was reported to estimate the yearly change in LOS under their original scales. Age, primary insurance, race, Charlson comorbidity score, general or regional anesthesia, surgical service, and duration of surgery were adjusted in the regression analyses for outcomes. SAS 9.4 was used for analysis.
RESULTS
Patient characteristics are shown in Table 1. Overall, 62.8% patients were discharged from Orthopedic surgery service, 72.5% patients underwent elective surgery, and 88.8% received general anesthesia. Between 2012 and 2018, there was a significant increase in the median age of patients (from 60 years to 63 years), mean Charlson comorbidity score increased from 1.07 to 1.46, and median case mix index, a measure of patient acuity, increased from 2.10 to 2.36 (Appendix 2).
Comparing pre-SCM unadjusted rates reported in our prior study (January 2009 to July 2012) to post-SCM (September 2012 to June 2018; Appendix 3), patients with ≥1 medical complication decreased from 10.1% to 6.1%, LOS (mean ± standard deviation) changed from 5.4 ± 2.2 days to 4.6 ± 5.8 days, patients with ≥2 medical consultations decreased from 19.4% to 9.2%, rapid response team calls changed from 1% to 0.9%, code blues changed from 0.3% to 0.2%, and patients with top-box patient satisfaction score increased from 86.4% to 94.2%.5
In the adjusted analysis from 2012 to 2018, the odds of patients with ≥1 medical complication decreased by 3.8% per year (P = .01), estimated LOS decreased by 0.3 days per year (P < .0001), and the odds of rapid response team calls decreased by 12.2% per year (P = .001; Table 2). Changes over time in the odds of patients with ≥2 medical consultations, code blues, or top-box patient satisfaction score were not statistically significant (Table 2). Based on the LOS reduction pre- to post-SCM, there were estimated average direct cost savings of $3,424 per discharge between 2012 and 2018.
DISCUSSION
Since the implementation of SCM on Orthopedic and Neurosurgery services at our institution, there was a decrease in medical complications, LOS, and rapid response team calls. To our knowledge, this is one of the largest studies evaluating the benefits of SCM over 5.8 years. Similar to our prior studies on this SCM model of care,5,7 other studies have reported a decrease in medical complications,8-10 LOS,11-13 and cost of care14 with SCM.
While the changes in the unadjusted rates of outcomes over the years appeared to be small, while our patient population became older and sicker, there were significant changes in several of our outcomes in the adjusted analysis. We believe that SCM hospitalists have developed a skill set and understanding of these surgical patients over time and can manage more medically complex patients without an increase in medical complications or LOS. We attribute this to our unique SCM model in which the same hospitalists stay year round on the same surgical service. SCM hospitalists have built trusting relationships with the surgical team with greater involvement in decision making, care planning, and patient selection. With minimal turnover in the SCM group and with ongoing learning, SCM hospitalists can anticipate fluid or pain medication requirements after specific surgeries and the surgery-specific medical complications. SCM hospitalists are available on the patient units to provide timely intervention in case of medical deterioration; answer any questions from patients, families, or nursing while the surgical teams may be in the operating room; and coordinate with other medical consultants or outpatient providers as needed.
This study has several limitations. This is a single-center study at an academic institution, limited to two surgical services. We did not have a control group and multiple hospital-wide interventions may have affected these outcomes. This is an observational study in which unobserved variables may bias the results. We used ICD codes to identify medical complications, which relies on the quality of physician documentation. While our response rate of 21.1% for HCAHPS was comparable to the national average of 26.7%, it may not reliably represent our patient population.15 Lastly, we had limited financial data.
CONCLUSION
With the move toward value-based payment and increasing medical complexity of surgical patients, SCM by hospitalists may deliver high-quality care.
1. Auerbach AD, Wachter RM, Cheng HQ, et al. Comanagement of surgical patients between neurosurgeons and hospitalists. Arch Intern Med. 2010;170(22):2004-2010. https://doi.org/10.1001/archinternmed.2010.432
2. Ruiz ME, Merino RÁ, Rodríguez R, Sánchez GM, Alonso A, Barbero M. Effect of comanagement with internal medicine on hospital stay of patients admitted to the service of otolaryngology. Acta Otorrinolaringol Esp. 2015;66(5):264-268. https://doi.org/10.1016/j.otorri.2014.09.010.
3. Tadros RO, Faries PL, Malik R, et al. The effect of a hospitalist comanagement service on vascular surgery inpatients. J Vasc Surg. 2015;61(6):1550-1555. https://doi.org/10.1016/j.jvs.2015.01.006
4. Gregersen M, Mørch MM, Hougaard K, Damsgaard EM. Geriatric intervention in elderly patients with hip fracture in an orthopedic ward. J Inj Violence Res. 2012;4(2):45-51. https://doi.org/10.5249/jivr.v4i2.96
5. Rohatgi N, Loftus P, Grujic O, Cullen M, Hopkins J, Ahuja N. Surgical comanagement by hospitalists improves patient outcomes: A propensity score analysis. Ann Surg. 2016;264(2):275-282. https://doi.org/10.1097/SLA.0000000000001629
6. Polverejan E, Gardiner JC, Bradley CJ, Holmes-Rovner M, Rovner D. Estimating mean hospital cost as a function of length of stay and patient characteristics. Health Econ. 2003;12(11):935-947. https://doi.org/10.1002/hec.774
7. Rohatgi N, Wei PH, Grujic O, Ahuja N. Surgical Comanagement by hospitalists in colorectal surgery. J Am Coll Surg. 2018;227(4):404-410. https://doi.org/10.1016/j.jamcollsurg.2018.06.011
8. Huddleston JM, Long KH, Naessens JM, et al. Medical and surgical comanagement after elective hip and knee arthroplasty: A randomized, controlled trial. Ann Intern Med. 2004;141(1):28-38. https://doi.org/10.7326/0003-4819-141-1-200407060-00012.
9. Swart E, Vasudeva E, Makhni EC, Macaulay W, Bozic KJ. Dedicated perioperative hip fracture comanagement programs are cost-effective in high-volume centers: An economic analysis. Clin Orthop Relat Res. 2016;474(1):222-233. https://doi.org/10.1007/s11999-015-4494-4.
10. Iberti CT, Briones A, Gabriel E, Dunn AS. Hospitalist-vascular surgery comanagement: Effects on complications and mortality. Hosp Pract. 2016;44(5):233-236. https://doi.org/10.1080/21548331.2016.1259543.
11. Kammerlander C, Roth T, Friedman SM, et al. Ortho-geriatric service--A literature review comparing different models. Osteoporos Int. 2010;21(Suppl 4):S637-S646. https://doi.org/10.1007/s00198-010-1396-x.
12. Bracey DN, Kiymaz TC, Holst DC, et al. An orthopedic-hospitalist comanaged hip fracture service reduces inpatient length of stay. Geriatr Orthop Surg Rehabil. 2016;7(4):171-177. https://doi.org/10.1177/2151458516661383.
13. Duplantier NL, Briski DC, Luce LT, Meyer MS, Ochsner JL, Chimento GF. The effects of a hospitalist comanagement model for joint arthroplasty patients in a teaching facility. J Arthroplasty. 2016;31(3):567-572. https://doi.org/10.1016/j.arth.2015.10.010.
14. Roy A, Heckman MG, Roy V. Associations between the hospitalist model of care and quality-of-care-related outcomes in patients undergoing hip fracture surgery. Mayo Clin Proc. 2006;81(1):28-31. https://doi.org/10.4065/81.1.28.
15. Godden E, Paseka A, Gnida J, Inguanzo J. The impact of response rate on Hospital Consumer Assessment of Healthcare Providers and System (HCAHPS) dimension scores. Patient Exp J. 2019;6(1):105-114. https://doi.org/10.35680/2372-0247.1357.
1. Auerbach AD, Wachter RM, Cheng HQ, et al. Comanagement of surgical patients between neurosurgeons and hospitalists. Arch Intern Med. 2010;170(22):2004-2010. https://doi.org/10.1001/archinternmed.2010.432
2. Ruiz ME, Merino RÁ, Rodríguez R, Sánchez GM, Alonso A, Barbero M. Effect of comanagement with internal medicine on hospital stay of patients admitted to the service of otolaryngology. Acta Otorrinolaringol Esp. 2015;66(5):264-268. https://doi.org/10.1016/j.otorri.2014.09.010.
3. Tadros RO, Faries PL, Malik R, et al. The effect of a hospitalist comanagement service on vascular surgery inpatients. J Vasc Surg. 2015;61(6):1550-1555. https://doi.org/10.1016/j.jvs.2015.01.006
4. Gregersen M, Mørch MM, Hougaard K, Damsgaard EM. Geriatric intervention in elderly patients with hip fracture in an orthopedic ward. J Inj Violence Res. 2012;4(2):45-51. https://doi.org/10.5249/jivr.v4i2.96
5. Rohatgi N, Loftus P, Grujic O, Cullen M, Hopkins J, Ahuja N. Surgical comanagement by hospitalists improves patient outcomes: A propensity score analysis. Ann Surg. 2016;264(2):275-282. https://doi.org/10.1097/SLA.0000000000001629
6. Polverejan E, Gardiner JC, Bradley CJ, Holmes-Rovner M, Rovner D. Estimating mean hospital cost as a function of length of stay and patient characteristics. Health Econ. 2003;12(11):935-947. https://doi.org/10.1002/hec.774
7. Rohatgi N, Wei PH, Grujic O, Ahuja N. Surgical Comanagement by hospitalists in colorectal surgery. J Am Coll Surg. 2018;227(4):404-410. https://doi.org/10.1016/j.jamcollsurg.2018.06.011
8. Huddleston JM, Long KH, Naessens JM, et al. Medical and surgical comanagement after elective hip and knee arthroplasty: A randomized, controlled trial. Ann Intern Med. 2004;141(1):28-38. https://doi.org/10.7326/0003-4819-141-1-200407060-00012.
9. Swart E, Vasudeva E, Makhni EC, Macaulay W, Bozic KJ. Dedicated perioperative hip fracture comanagement programs are cost-effective in high-volume centers: An economic analysis. Clin Orthop Relat Res. 2016;474(1):222-233. https://doi.org/10.1007/s11999-015-4494-4.
10. Iberti CT, Briones A, Gabriel E, Dunn AS. Hospitalist-vascular surgery comanagement: Effects on complications and mortality. Hosp Pract. 2016;44(5):233-236. https://doi.org/10.1080/21548331.2016.1259543.
11. Kammerlander C, Roth T, Friedman SM, et al. Ortho-geriatric service--A literature review comparing different models. Osteoporos Int. 2010;21(Suppl 4):S637-S646. https://doi.org/10.1007/s00198-010-1396-x.
12. Bracey DN, Kiymaz TC, Holst DC, et al. An orthopedic-hospitalist comanaged hip fracture service reduces inpatient length of stay. Geriatr Orthop Surg Rehabil. 2016;7(4):171-177. https://doi.org/10.1177/2151458516661383.
13. Duplantier NL, Briski DC, Luce LT, Meyer MS, Ochsner JL, Chimento GF. The effects of a hospitalist comanagement model for joint arthroplasty patients in a teaching facility. J Arthroplasty. 2016;31(3):567-572. https://doi.org/10.1016/j.arth.2015.10.010.
14. Roy A, Heckman MG, Roy V. Associations between the hospitalist model of care and quality-of-care-related outcomes in patients undergoing hip fracture surgery. Mayo Clin Proc. 2006;81(1):28-31. https://doi.org/10.4065/81.1.28.
15. Godden E, Paseka A, Gnida J, Inguanzo J. The impact of response rate on Hospital Consumer Assessment of Healthcare Providers and System (HCAHPS) dimension scores. Patient Exp J. 2019;6(1):105-114. https://doi.org/10.35680/2372-0247.1357.
© 2020 Society of Hospital Medicine
Describing Variability of Inpatient Consultation Practices: Physician, Patient, and Admission Factors
Inpatient consultation is an extremely common practice with the potential to improve patient outcomes significantly.1-3 However, variability in consultation practices may be risky for patients. In addition to underuse when the benefit is clear, the overuse of consultation may lead to additional testing and therapies, increased length of stay (LOS) and costs, conflicting recommendations, and opportunities for communication breakdown.
Consultation use is often at the discretion of individual providers. While this decision is frequently driven by patient needs, significant variation in consultation practices not fully explained by patient factors exists.1 Prior work has described hospital-level variation1 and that primary care physicians use more consultation than hospitalists.4 However, other factors affecting consultation remain unknown. We sought to explore physician-, patient-, and admission-level factors associated with consultation use on inpatient general medicine services.
METHODS
Study Design
We conducted a retrospective analysis of data from the University of Chicago Hospitalist Project (UCHP). UCHP is a longstanding study of the care of hospitalized patients admitted to the University of Chicago general medicine services, involving both patient data collection and physician experience surveys.5 Data were obtained for enrolled UCHP patients between 2011-2016 from the Center for Research Informatics (CRI). The University of Chicago Institutional Review Board approved this study.
Data Collection
Attendings and patients consented to UCHP participation. Data collection details are described elsewhere.5,6 Data from EpicCare (EpicSystems Corp, Wisconsin) and Centricity Billing (GE Healthcare, Illinois) were obtained via CRI for all encounters of enrolled UCHP patients during the study period (N = 218,591).
Attending Attribution
We determined attending attribution for admissions as follows: the attending author of the first history and physical (H&P) was assigned. If this was unavailable, the attending author of the first progress note (PN) was assigned. For patients admitted by hospitalists on admitting shifts to nonteaching services (ie, service without residents/students), the author of the first PN was assigned if different from H&P. Where available, attribution was corroborated with call schedules.
Sample and Variables
All encounters containing inpatient admissions to the University of Chicago from May 10, 2011 (Electronic Health Record activation date), through December 31, 2016, were considered for inclusion (N = 51,171, Appendix 1). Admissions including only documentation from ancillary services were excluded (eg, encounters for hemodialysis or physical therapy). Admissions were limited to a length of stay (LOS) ≤ 5 days, corresponding to the average US inpatient LOS of 4.6 days,7 to minimize the likelihood of attending handoffs (N = 31,592). If attending attribution was not possible via the above-described methods, the admission was eliminated (N = 3,103; 10.9% of admissions with LOS ≤ 5 days). Finally, the sample was restricted to general medicine service admissions under attendings enrolled in UCHP who completed surveys. After the application of all criteria, 6,153 admissions remained for analysis.
The outcome variable was the number of consultations per admission, determined by counting the unique number of services creating clinical documentation, and subtracting one for the primary team. If the Medical/Surgical intensive care unit (ICU) was a service, then two were subtracted to account for the ICU transfer.
Attending years in practice (ie, years since medical school graduation) and gender were determined from public resources. Practice characteristics were determined from UCHP attending surveys, which address perceptions of workload and satisfaction (Appendix 2).
Patient characteristics (gender, age, Elixhauser Indices) and admission characteristics (LOS, season of admission, payor) were determined from UCHP and CRI data. The Elixhauser Index uses a well-validated system combining the presence/absence of 31 comorbidities to predict mortality and 30-day readmission.8 Elixhauser Indices were calculated using the “Creation of Elixhauser Comorbidity Index Scores 1.0” software.9 For admissions under hospitalist attendings, teaching/nonteaching team was ascertained via internal teaching service calendars.
Analysis
We used descriptive statistics to examine demographic characteristics. The difference between the lowest and highest quartile consultation use was determined via a two-sample t test. Given the multilevel nature of our count data, we used a mixed-effects Poisson model accounting for within-group variation by clustering on attending and patient (3-level random-effects model). The analysis was done using Stata 15 (StataCorp, Texas).
RESULTS
From 2011 to 2016, 14,848 patients and 88 attendings were enrolled in UCHP; 4,772 patients (32%) and 69 attendings (59.4%) had data available and were included. Mean LOS was 3.0 days (SD = 1.3). Table 1 describes the characteristics of attendings, patients, and admissions.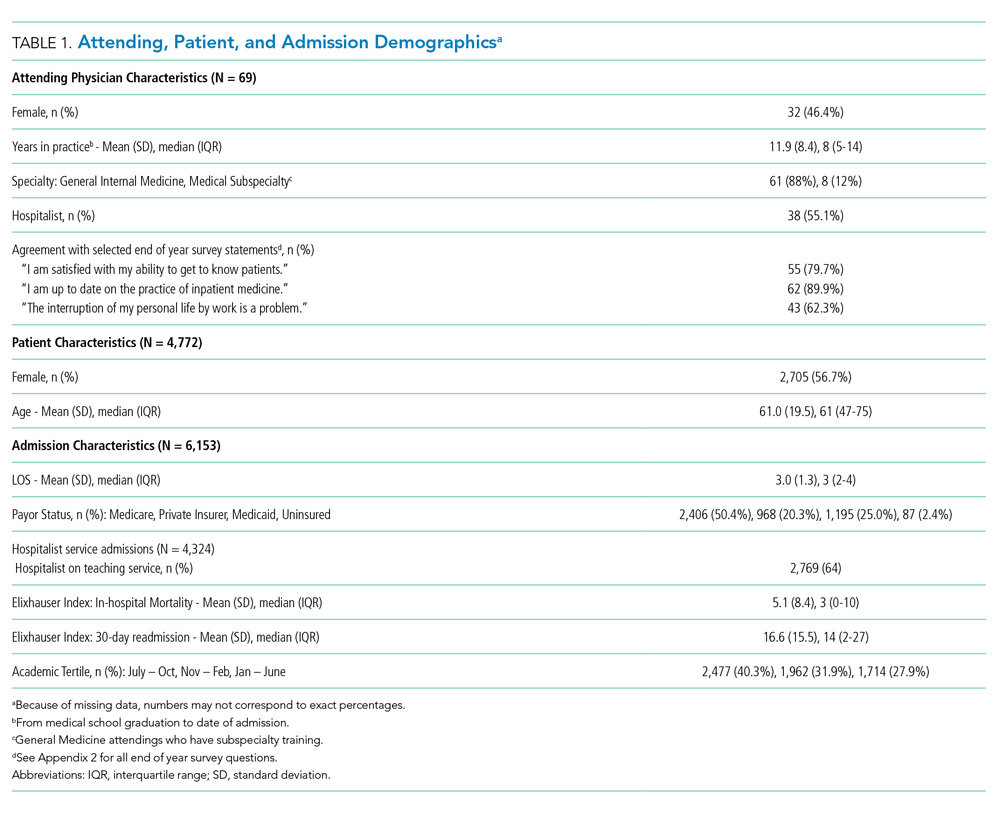
Seventy-six percent of admissions included at least one consultation. Consultation use varied widely, ranging from 0 to 10 per admission (mean = 1.39, median = 1; standard deviation [SD] = 1.17). The number of consultations per admission in the highest quartile of consultation frequency (mean = 3.47, median = 3) was 5.7-fold that of the lowest quartile (mean = 0.613, median = 1; P <.001).
In multivariable regression, physician-, patient-, and admission-level characteristics were associated with the differential use of consultation (Table 2). On teaching services, consultations called by hospitalist vs nonhospitalist generalists did not differ (P =.361). However, hospitalists on nonteaching services called 8.6% more consultations than hospitalists on teaching services (P =.02). Attending agreement with survey item “The interruption of my personal life by work is a problem” was associated with 8.2% fewer consultations per admission (P =.002).
Patients older than 75 years received 19% fewer consultations compared with patients younger than 49 years (P <.001). Compared with Medicare, Medicaid admissions had 12.2% fewer consultations (P <.001), whereas privately insured admissions had 10.7% more (P =.001). The number of consultations per admission decreased every year, with 45.3% fewer consultations in 2015 than 2011 (P <.001). Consultations increased by each 22% per day increase in LOS (P <.001).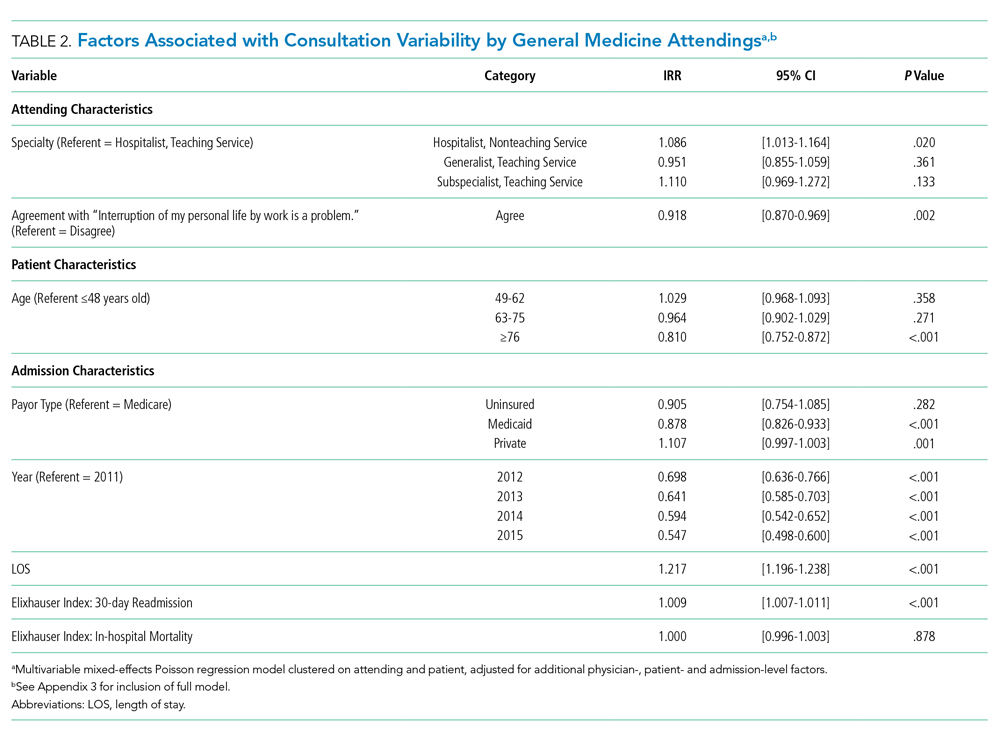
DISCUSSION
Our analysis described several physician-, patient-, and admission-level characteristics associated with the use of inpatient consultation. Our results strengthen prior work demonstrating that patient-level factors alone are insufficient to explain consultation variability.1
Hospitalists on nonteaching services called more consultations, which may reflect a higher workload on these services. Busy hospitalists on nonteaching teams may lack time to delve deeply into clinical problems and require more consultations, especially for work with heavy cognitive loads such as diagnosis. “Outsourcing” tasks when workload increases occurs in other cognitive activities such as teaching.10 The association between work interrupting personal life and fewer consultations may also implicate the effects of time. Attendings who are experiencing work encroaching on their personal lives may be those spending more time with patients and consulting less. This finding merits further study, especially with increasing concern about balancing time spent in meaningful patient care activities with risk of physician burnout.
This finding could also indicate that trainee participation modifies consultation use for hospitalists. Teaching service teams with more individual members may allow a greater pool of collective knowledge, decreasing the need for consultation to answer clinical questions.11 Interestingly, there was no difference in consultation use between generalists or subspecialists and hospitalists on teaching services, possibly suggesting a unique effect in hospitalists who vary clinical practice depending on team structure. These differences deserve further investigation, with implications for education and resource utilization.
We were surprised by the finding that consultations decreased each year, despite increasing patient complexity and availability of consultation services. This could be explained by a growing emphasis on shortening LOS in our institution, thus shifting consultative care to outpatient settings. Understanding these effects is critically important with growing evidence that consultation improves patient outcomes because these external pressures could lead to unintended consequences for quality or access to care.
Several findings related to patient factors additionally emerged, including age and insurance status. Although related to medical complexity, these effects persist despite adjustment, which raises the question of whether they contribute to the decision to seek consultation. Older patients received fewer consultations, which could reflect the use of more conservative practice models in the elderly,12 or ageism, which is associated with undertreatment.13 With respect to insurance status, Medicaid patients were associated with fewer consultations. This finding is consistent with previous work showing the decreased intensity of hospital services used for Medicaid patients.14Our study has limitations. Our data were from one large urban academic center that limits generalizability. Although systematic and redundant, attending attribution may have been flawed: incomplete or erroneous documentation could have led to attribution error, and we cannot rule out the possibility of service handoffs. We used a LOS ≤ 5 days to minimize this possibility, but this limits the applicability of our findings to longer admissions. Unsurprisingly, longer LOS correlated with the increased use of consultation even within our restricted sample, and future work should examine the effects of prolonged LOS. As a retrospective analysis, unmeasured confounders due to our limited adjustment will likely explain some findings, although we took steps to address this in our statistical design. Finally, we could not measure patient outcomes and, therefore, cannot determine the value of more or fewer consultations for specific patients or illnesses. Positive and negative outcomes of increased consultation are described, and understanding the impact of consultation is critical for further study.2,3
CONCLUSION
We found that the use of consultation on general medicine services varies widely between admissions, with large differences between the highest and lowest frequencies of use. This variation can be partially explained by several physician-, patient-, and admission-level characteristics. Our work may help identify patient and attending groups at high risk for under- or overuse of consultation and guide the subsequent development of interventions to improve value in consultation. One additional consultation over the average LOS of 4.6 days adds $420 per admission or $4.8 billion to the 11.5 million annual Medicare admissions.15 Increasing research, guidelines, and education on the judicious use of inpatient consultation will be key in maximizing high-value care and improving patient outcomes.
Acknowledgments
The authors would like to acknowledge the invaluable support and assistance of the University of Chicago Hospitalist Project, the Pritzker School of Medicine Summer Research Program, the University of Chicago Center for Quality, and the University of Chicago Center for Health and the Social Sciences (CHeSS). The authors would additionally like to thank John Cursio, PhD, for his support and guidance in statistical analysis for this project.
Disclaimer
The content is solely the responsibility of the authors and does not necessarily represent the official views of the NIH. The funders had no role in the design of the study; the collection, analysis, and interpretation of the data; or the decision to approve publication of the finished manuscript. Preliminary results of this analysis were presented at the 2018 Society of Hospital Medicine Annual Meeting in Orlando, Florida. All coauthors have seen and agree with the contents of the manuscript. The submission is not under review by any other publication.
1. Stevens JP, Nyweide D, Maresh S, et al. Variation in inpatient consultation among older adults in the United States. J Gen Intern Med. 2015;30(7):992-999. https://doi.org/10.1007/s11606-015-3216-7.
2. Lahey T, Shah R, Gittzus J, Schwartzman J, Kirkland K. Infectious diseases consultation lowers mortality from Staphylococcus aureus bacteremia. Medicine (Baltimore). 2009;88(5):263-267. https://doi.org/10.1097/MD.0b013e3181b8fccb.
3. Morrison RS, Dietrich J, Ladwig S, et al. Palliative care consultation teams cut hospital costs for Medicaid beneficiaries. Health Aff Proj Hope. 2011;30(3):454-463. https://doi.org/10.1377/hlthaff.2010.0929.
4. Stevens JP, Nyweide DJ, Maresh S, Hatfield LA, Howell MD, Landon BE. Comparison of hospital resource use and outcomes among hospitalists, primary care physicians, and other generalists. JAMA Intern Med. 2017;177(12):1781. https://doi.org/10.1001/jamainternmed.2017.5824.
5. Meltzer D. Effects of physician experience on costs and outcomes on an academic general medicine service: Results of a trial of hospitalists. Ann Intern Med. 2002;137(11):866. https://doi.org/10.7326/0003-4819-137-11-200212030-00007.
6. Martin SK, Farnan JM, Flores A, Kurina LM, Meltzer DO, Arora VM. Exploring entrustment: Housestaff autonomy and patient readmission. Am J Med. 2014;127(8):791-797. https://doi.org/10.1016/j.amjmed.2014.04.013.
7. HCUP-US NIS Overview. https://www.hcup-us.ahrq.gov/nisoverview.jsp. Accessed July 7, 2017.
8. Austin SR, Wong Y-N, Uzzo RG, Beck JR, Egleston BL. Why summary comorbidity measures such as the Charlson Comorbidity Index and Elixhauser Score work. Med Care. 2015;53(9):e65-e72. https://doi.org/10.1097/MLR.0b013e318297429c.
9. Elixhauser Comorbidity Software. Elixhauser Comorbidity Software. https://www.hcup-us.ahrq.gov/toolssoftware/comorbidity/comorbidity.jsp#references. Accessed May 13, 2019.
10. Roshetsky LM, Coltri A, Flores A, et al. No time for teaching? Inpatient attending physicians’ workload and teaching before and after the implementation of the 2003 duty hours regulations. Acad Med J Assoc Am Med Coll. 2013;88(9):1293-1298. https://doi.org/10.1097/ACM.0b013e31829eb795.
11. Barnett ML, Boddupalli D, Nundy S, Bates DW. Comparative accuracy of diagnosis by collective intelligence of multiple physicians vs individual physicians. JAMA Netw Open. 2019;2(3):e190096. https://doi.org/10.1001/jamanetworkopen.2019.0096.
12. Aoyama T, Kunisawa S, Fushimi K, Sawa T, Imanaka Y. Comparison of surgical and conservative treatment outcomes for type A aortic dissection in elderly patients. J Cardiothorac Surg. 2018;13(1):129. https://doi.org/10.1186/s13019-018-0814-6.
13. Lindau ST, Schumm LP, Laumann EO, Levinson W, O’Muircheartaigh CA, Waite LJ. A study of sexuality and health among older adults in the United States. N Engl J Med. 2007;357(8):762-774. https://doi.org/10.1056/NEJMoa067423.
14. Yergan J, Flood AB, Diehr P, LoGerfo JP. Relationship between patient source of payment and the intensity of hospital services. Med Care. 1988;26(11):1111-1114. https://doi.org/10.1097/00005650-198811000-00009.
15. Center for Medicare and Medicaid Services. MDCR INPT HOSP 1.; 2008. https://www.cms.gov/Research-Statistics-Data-and-Systems/Statistics-Trends-and-Reports/CMSProgramStatistics/2013/Downloads/MDCR_UTIL/CPS_MDCR_INPT_HOSP_1.pdf. Accessed April 15, 2018.
Inpatient consultation is an extremely common practice with the potential to improve patient outcomes significantly.1-3 However, variability in consultation practices may be risky for patients. In addition to underuse when the benefit is clear, the overuse of consultation may lead to additional testing and therapies, increased length of stay (LOS) and costs, conflicting recommendations, and opportunities for communication breakdown.
Consultation use is often at the discretion of individual providers. While this decision is frequently driven by patient needs, significant variation in consultation practices not fully explained by patient factors exists.1 Prior work has described hospital-level variation1 and that primary care physicians use more consultation than hospitalists.4 However, other factors affecting consultation remain unknown. We sought to explore physician-, patient-, and admission-level factors associated with consultation use on inpatient general medicine services.
METHODS
Study Design
We conducted a retrospective analysis of data from the University of Chicago Hospitalist Project (UCHP). UCHP is a longstanding study of the care of hospitalized patients admitted to the University of Chicago general medicine services, involving both patient data collection and physician experience surveys.5 Data were obtained for enrolled UCHP patients between 2011-2016 from the Center for Research Informatics (CRI). The University of Chicago Institutional Review Board approved this study.
Data Collection
Attendings and patients consented to UCHP participation. Data collection details are described elsewhere.5,6 Data from EpicCare (EpicSystems Corp, Wisconsin) and Centricity Billing (GE Healthcare, Illinois) were obtained via CRI for all encounters of enrolled UCHP patients during the study period (N = 218,591).
Attending Attribution
We determined attending attribution for admissions as follows: the attending author of the first history and physical (H&P) was assigned. If this was unavailable, the attending author of the first progress note (PN) was assigned. For patients admitted by hospitalists on admitting shifts to nonteaching services (ie, service without residents/students), the author of the first PN was assigned if different from H&P. Where available, attribution was corroborated with call schedules.
Sample and Variables
All encounters containing inpatient admissions to the University of Chicago from May 10, 2011 (Electronic Health Record activation date), through December 31, 2016, were considered for inclusion (N = 51,171, Appendix 1). Admissions including only documentation from ancillary services were excluded (eg, encounters for hemodialysis or physical therapy). Admissions were limited to a length of stay (LOS) ≤ 5 days, corresponding to the average US inpatient LOS of 4.6 days,7 to minimize the likelihood of attending handoffs (N = 31,592). If attending attribution was not possible via the above-described methods, the admission was eliminated (N = 3,103; 10.9% of admissions with LOS ≤ 5 days). Finally, the sample was restricted to general medicine service admissions under attendings enrolled in UCHP who completed surveys. After the application of all criteria, 6,153 admissions remained for analysis.
The outcome variable was the number of consultations per admission, determined by counting the unique number of services creating clinical documentation, and subtracting one for the primary team. If the Medical/Surgical intensive care unit (ICU) was a service, then two were subtracted to account for the ICU transfer.
Attending years in practice (ie, years since medical school graduation) and gender were determined from public resources. Practice characteristics were determined from UCHP attending surveys, which address perceptions of workload and satisfaction (Appendix 2).
Patient characteristics (gender, age, Elixhauser Indices) and admission characteristics (LOS, season of admission, payor) were determined from UCHP and CRI data. The Elixhauser Index uses a well-validated system combining the presence/absence of 31 comorbidities to predict mortality and 30-day readmission.8 Elixhauser Indices were calculated using the “Creation of Elixhauser Comorbidity Index Scores 1.0” software.9 For admissions under hospitalist attendings, teaching/nonteaching team was ascertained via internal teaching service calendars.
Analysis
We used descriptive statistics to examine demographic characteristics. The difference between the lowest and highest quartile consultation use was determined via a two-sample t test. Given the multilevel nature of our count data, we used a mixed-effects Poisson model accounting for within-group variation by clustering on attending and patient (3-level random-effects model). The analysis was done using Stata 15 (StataCorp, Texas).
RESULTS
From 2011 to 2016, 14,848 patients and 88 attendings were enrolled in UCHP; 4,772 patients (32%) and 69 attendings (59.4%) had data available and were included. Mean LOS was 3.0 days (SD = 1.3). Table 1 describes the characteristics of attendings, patients, and admissions.
Seventy-six percent of admissions included at least one consultation. Consultation use varied widely, ranging from 0 to 10 per admission (mean = 1.39, median = 1; standard deviation [SD] = 1.17). The number of consultations per admission in the highest quartile of consultation frequency (mean = 3.47, median = 3) was 5.7-fold that of the lowest quartile (mean = 0.613, median = 1; P <.001).
In multivariable regression, physician-, patient-, and admission-level characteristics were associated with the differential use of consultation (Table 2). On teaching services, consultations called by hospitalist vs nonhospitalist generalists did not differ (P =.361). However, hospitalists on nonteaching services called 8.6% more consultations than hospitalists on teaching services (P =.02). Attending agreement with survey item “The interruption of my personal life by work is a problem” was associated with 8.2% fewer consultations per admission (P =.002).
Patients older than 75 years received 19% fewer consultations compared with patients younger than 49 years (P <.001). Compared with Medicare, Medicaid admissions had 12.2% fewer consultations (P <.001), whereas privately insured admissions had 10.7% more (P =.001). The number of consultations per admission decreased every year, with 45.3% fewer consultations in 2015 than 2011 (P <.001). Consultations increased by each 22% per day increase in LOS (P <.001).
DISCUSSION
Our analysis described several physician-, patient-, and admission-level characteristics associated with the use of inpatient consultation. Our results strengthen prior work demonstrating that patient-level factors alone are insufficient to explain consultation variability.1
Hospitalists on nonteaching services called more consultations, which may reflect a higher workload on these services. Busy hospitalists on nonteaching teams may lack time to delve deeply into clinical problems and require more consultations, especially for work with heavy cognitive loads such as diagnosis. “Outsourcing” tasks when workload increases occurs in other cognitive activities such as teaching.10 The association between work interrupting personal life and fewer consultations may also implicate the effects of time. Attendings who are experiencing work encroaching on their personal lives may be those spending more time with patients and consulting less. This finding merits further study, especially with increasing concern about balancing time spent in meaningful patient care activities with risk of physician burnout.
This finding could also indicate that trainee participation modifies consultation use for hospitalists. Teaching service teams with more individual members may allow a greater pool of collective knowledge, decreasing the need for consultation to answer clinical questions.11 Interestingly, there was no difference in consultation use between generalists or subspecialists and hospitalists on teaching services, possibly suggesting a unique effect in hospitalists who vary clinical practice depending on team structure. These differences deserve further investigation, with implications for education and resource utilization.
We were surprised by the finding that consultations decreased each year, despite increasing patient complexity and availability of consultation services. This could be explained by a growing emphasis on shortening LOS in our institution, thus shifting consultative care to outpatient settings. Understanding these effects is critically important with growing evidence that consultation improves patient outcomes because these external pressures could lead to unintended consequences for quality or access to care.
Several findings related to patient factors additionally emerged, including age and insurance status. Although related to medical complexity, these effects persist despite adjustment, which raises the question of whether they contribute to the decision to seek consultation. Older patients received fewer consultations, which could reflect the use of more conservative practice models in the elderly,12 or ageism, which is associated with undertreatment.13 With respect to insurance status, Medicaid patients were associated with fewer consultations. This finding is consistent with previous work showing the decreased intensity of hospital services used for Medicaid patients.14Our study has limitations. Our data were from one large urban academic center that limits generalizability. Although systematic and redundant, attending attribution may have been flawed: incomplete or erroneous documentation could have led to attribution error, and we cannot rule out the possibility of service handoffs. We used a LOS ≤ 5 days to minimize this possibility, but this limits the applicability of our findings to longer admissions. Unsurprisingly, longer LOS correlated with the increased use of consultation even within our restricted sample, and future work should examine the effects of prolonged LOS. As a retrospective analysis, unmeasured confounders due to our limited adjustment will likely explain some findings, although we took steps to address this in our statistical design. Finally, we could not measure patient outcomes and, therefore, cannot determine the value of more or fewer consultations for specific patients or illnesses. Positive and negative outcomes of increased consultation are described, and understanding the impact of consultation is critical for further study.2,3
CONCLUSION
We found that the use of consultation on general medicine services varies widely between admissions, with large differences between the highest and lowest frequencies of use. This variation can be partially explained by several physician-, patient-, and admission-level characteristics. Our work may help identify patient and attending groups at high risk for under- or overuse of consultation and guide the subsequent development of interventions to improve value in consultation. One additional consultation over the average LOS of 4.6 days adds $420 per admission or $4.8 billion to the 11.5 million annual Medicare admissions.15 Increasing research, guidelines, and education on the judicious use of inpatient consultation will be key in maximizing high-value care and improving patient outcomes.
Acknowledgments
The authors would like to acknowledge the invaluable support and assistance of the University of Chicago Hospitalist Project, the Pritzker School of Medicine Summer Research Program, the University of Chicago Center for Quality, and the University of Chicago Center for Health and the Social Sciences (CHeSS). The authors would additionally like to thank John Cursio, PhD, for his support and guidance in statistical analysis for this project.
Disclaimer
The content is solely the responsibility of the authors and does not necessarily represent the official views of the NIH. The funders had no role in the design of the study; the collection, analysis, and interpretation of the data; or the decision to approve publication of the finished manuscript. Preliminary results of this analysis were presented at the 2018 Society of Hospital Medicine Annual Meeting in Orlando, Florida. All coauthors have seen and agree with the contents of the manuscript. The submission is not under review by any other publication.
Inpatient consultation is an extremely common practice with the potential to improve patient outcomes significantly.1-3 However, variability in consultation practices may be risky for patients. In addition to underuse when the benefit is clear, the overuse of consultation may lead to additional testing and therapies, increased length of stay (LOS) and costs, conflicting recommendations, and opportunities for communication breakdown.
Consultation use is often at the discretion of individual providers. While this decision is frequently driven by patient needs, significant variation in consultation practices not fully explained by patient factors exists.1 Prior work has described hospital-level variation1 and that primary care physicians use more consultation than hospitalists.4 However, other factors affecting consultation remain unknown. We sought to explore physician-, patient-, and admission-level factors associated with consultation use on inpatient general medicine services.
METHODS
Study Design
We conducted a retrospective analysis of data from the University of Chicago Hospitalist Project (UCHP). UCHP is a longstanding study of the care of hospitalized patients admitted to the University of Chicago general medicine services, involving both patient data collection and physician experience surveys.5 Data were obtained for enrolled UCHP patients between 2011-2016 from the Center for Research Informatics (CRI). The University of Chicago Institutional Review Board approved this study.
Data Collection
Attendings and patients consented to UCHP participation. Data collection details are described elsewhere.5,6 Data from EpicCare (EpicSystems Corp, Wisconsin) and Centricity Billing (GE Healthcare, Illinois) were obtained via CRI for all encounters of enrolled UCHP patients during the study period (N = 218,591).
Attending Attribution
We determined attending attribution for admissions as follows: the attending author of the first history and physical (H&P) was assigned. If this was unavailable, the attending author of the first progress note (PN) was assigned. For patients admitted by hospitalists on admitting shifts to nonteaching services (ie, service without residents/students), the author of the first PN was assigned if different from H&P. Where available, attribution was corroborated with call schedules.
Sample and Variables
All encounters containing inpatient admissions to the University of Chicago from May 10, 2011 (Electronic Health Record activation date), through December 31, 2016, were considered for inclusion (N = 51,171, Appendix 1). Admissions including only documentation from ancillary services were excluded (eg, encounters for hemodialysis or physical therapy). Admissions were limited to a length of stay (LOS) ≤ 5 days, corresponding to the average US inpatient LOS of 4.6 days,7 to minimize the likelihood of attending handoffs (N = 31,592). If attending attribution was not possible via the above-described methods, the admission was eliminated (N = 3,103; 10.9% of admissions with LOS ≤ 5 days). Finally, the sample was restricted to general medicine service admissions under attendings enrolled in UCHP who completed surveys. After the application of all criteria, 6,153 admissions remained for analysis.
The outcome variable was the number of consultations per admission, determined by counting the unique number of services creating clinical documentation, and subtracting one for the primary team. If the Medical/Surgical intensive care unit (ICU) was a service, then two were subtracted to account for the ICU transfer.
Attending years in practice (ie, years since medical school graduation) and gender were determined from public resources. Practice characteristics were determined from UCHP attending surveys, which address perceptions of workload and satisfaction (Appendix 2).
Patient characteristics (gender, age, Elixhauser Indices) and admission characteristics (LOS, season of admission, payor) were determined from UCHP and CRI data. The Elixhauser Index uses a well-validated system combining the presence/absence of 31 comorbidities to predict mortality and 30-day readmission.8 Elixhauser Indices were calculated using the “Creation of Elixhauser Comorbidity Index Scores 1.0” software.9 For admissions under hospitalist attendings, teaching/nonteaching team was ascertained via internal teaching service calendars.
Analysis
We used descriptive statistics to examine demographic characteristics. The difference between the lowest and highest quartile consultation use was determined via a two-sample t test. Given the multilevel nature of our count data, we used a mixed-effects Poisson model accounting for within-group variation by clustering on attending and patient (3-level random-effects model). The analysis was done using Stata 15 (StataCorp, Texas).
RESULTS
From 2011 to 2016, 14,848 patients and 88 attendings were enrolled in UCHP; 4,772 patients (32%) and 69 attendings (59.4%) had data available and were included. Mean LOS was 3.0 days (SD = 1.3). Table 1 describes the characteristics of attendings, patients, and admissions.
Seventy-six percent of admissions included at least one consultation. Consultation use varied widely, ranging from 0 to 10 per admission (mean = 1.39, median = 1; standard deviation [SD] = 1.17). The number of consultations per admission in the highest quartile of consultation frequency (mean = 3.47, median = 3) was 5.7-fold that of the lowest quartile (mean = 0.613, median = 1; P <.001).
In multivariable regression, physician-, patient-, and admission-level characteristics were associated with the differential use of consultation (Table 2). On teaching services, consultations called by hospitalist vs nonhospitalist generalists did not differ (P =.361). However, hospitalists on nonteaching services called 8.6% more consultations than hospitalists on teaching services (P =.02). Attending agreement with survey item “The interruption of my personal life by work is a problem” was associated with 8.2% fewer consultations per admission (P =.002).
Patients older than 75 years received 19% fewer consultations compared with patients younger than 49 years (P <.001). Compared with Medicare, Medicaid admissions had 12.2% fewer consultations (P <.001), whereas privately insured admissions had 10.7% more (P =.001). The number of consultations per admission decreased every year, with 45.3% fewer consultations in 2015 than 2011 (P <.001). Consultations increased by each 22% per day increase in LOS (P <.001).
DISCUSSION
Our analysis described several physician-, patient-, and admission-level characteristics associated with the use of inpatient consultation. Our results strengthen prior work demonstrating that patient-level factors alone are insufficient to explain consultation variability.1
Hospitalists on nonteaching services called more consultations, which may reflect a higher workload on these services. Busy hospitalists on nonteaching teams may lack time to delve deeply into clinical problems and require more consultations, especially for work with heavy cognitive loads such as diagnosis. “Outsourcing” tasks when workload increases occurs in other cognitive activities such as teaching.10 The association between work interrupting personal life and fewer consultations may also implicate the effects of time. Attendings who are experiencing work encroaching on their personal lives may be those spending more time with patients and consulting less. This finding merits further study, especially with increasing concern about balancing time spent in meaningful patient care activities with risk of physician burnout.
This finding could also indicate that trainee participation modifies consultation use for hospitalists. Teaching service teams with more individual members may allow a greater pool of collective knowledge, decreasing the need for consultation to answer clinical questions.11 Interestingly, there was no difference in consultation use between generalists or subspecialists and hospitalists on teaching services, possibly suggesting a unique effect in hospitalists who vary clinical practice depending on team structure. These differences deserve further investigation, with implications for education and resource utilization.
We were surprised by the finding that consultations decreased each year, despite increasing patient complexity and availability of consultation services. This could be explained by a growing emphasis on shortening LOS in our institution, thus shifting consultative care to outpatient settings. Understanding these effects is critically important with growing evidence that consultation improves patient outcomes because these external pressures could lead to unintended consequences for quality or access to care.
Several findings related to patient factors additionally emerged, including age and insurance status. Although related to medical complexity, these effects persist despite adjustment, which raises the question of whether they contribute to the decision to seek consultation. Older patients received fewer consultations, which could reflect the use of more conservative practice models in the elderly,12 or ageism, which is associated with undertreatment.13 With respect to insurance status, Medicaid patients were associated with fewer consultations. This finding is consistent with previous work showing the decreased intensity of hospital services used for Medicaid patients.14Our study has limitations. Our data were from one large urban academic center that limits generalizability. Although systematic and redundant, attending attribution may have been flawed: incomplete or erroneous documentation could have led to attribution error, and we cannot rule out the possibility of service handoffs. We used a LOS ≤ 5 days to minimize this possibility, but this limits the applicability of our findings to longer admissions. Unsurprisingly, longer LOS correlated with the increased use of consultation even within our restricted sample, and future work should examine the effects of prolonged LOS. As a retrospective analysis, unmeasured confounders due to our limited adjustment will likely explain some findings, although we took steps to address this in our statistical design. Finally, we could not measure patient outcomes and, therefore, cannot determine the value of more or fewer consultations for specific patients or illnesses. Positive and negative outcomes of increased consultation are described, and understanding the impact of consultation is critical for further study.2,3
CONCLUSION
We found that the use of consultation on general medicine services varies widely between admissions, with large differences between the highest and lowest frequencies of use. This variation can be partially explained by several physician-, patient-, and admission-level characteristics. Our work may help identify patient and attending groups at high risk for under- or overuse of consultation and guide the subsequent development of interventions to improve value in consultation. One additional consultation over the average LOS of 4.6 days adds $420 per admission or $4.8 billion to the 11.5 million annual Medicare admissions.15 Increasing research, guidelines, and education on the judicious use of inpatient consultation will be key in maximizing high-value care and improving patient outcomes.
Acknowledgments
The authors would like to acknowledge the invaluable support and assistance of the University of Chicago Hospitalist Project, the Pritzker School of Medicine Summer Research Program, the University of Chicago Center for Quality, and the University of Chicago Center for Health and the Social Sciences (CHeSS). The authors would additionally like to thank John Cursio, PhD, for his support and guidance in statistical analysis for this project.
Disclaimer
The content is solely the responsibility of the authors and does not necessarily represent the official views of the NIH. The funders had no role in the design of the study; the collection, analysis, and interpretation of the data; or the decision to approve publication of the finished manuscript. Preliminary results of this analysis were presented at the 2018 Society of Hospital Medicine Annual Meeting in Orlando, Florida. All coauthors have seen and agree with the contents of the manuscript. The submission is not under review by any other publication.
1. Stevens JP, Nyweide D, Maresh S, et al. Variation in inpatient consultation among older adults in the United States. J Gen Intern Med. 2015;30(7):992-999. https://doi.org/10.1007/s11606-015-3216-7.
2. Lahey T, Shah R, Gittzus J, Schwartzman J, Kirkland K. Infectious diseases consultation lowers mortality from Staphylococcus aureus bacteremia. Medicine (Baltimore). 2009;88(5):263-267. https://doi.org/10.1097/MD.0b013e3181b8fccb.
3. Morrison RS, Dietrich J, Ladwig S, et al. Palliative care consultation teams cut hospital costs for Medicaid beneficiaries. Health Aff Proj Hope. 2011;30(3):454-463. https://doi.org/10.1377/hlthaff.2010.0929.
4. Stevens JP, Nyweide DJ, Maresh S, Hatfield LA, Howell MD, Landon BE. Comparison of hospital resource use and outcomes among hospitalists, primary care physicians, and other generalists. JAMA Intern Med. 2017;177(12):1781. https://doi.org/10.1001/jamainternmed.2017.5824.
5. Meltzer D. Effects of physician experience on costs and outcomes on an academic general medicine service: Results of a trial of hospitalists. Ann Intern Med. 2002;137(11):866. https://doi.org/10.7326/0003-4819-137-11-200212030-00007.
6. Martin SK, Farnan JM, Flores A, Kurina LM, Meltzer DO, Arora VM. Exploring entrustment: Housestaff autonomy and patient readmission. Am J Med. 2014;127(8):791-797. https://doi.org/10.1016/j.amjmed.2014.04.013.
7. HCUP-US NIS Overview. https://www.hcup-us.ahrq.gov/nisoverview.jsp. Accessed July 7, 2017.
8. Austin SR, Wong Y-N, Uzzo RG, Beck JR, Egleston BL. Why summary comorbidity measures such as the Charlson Comorbidity Index and Elixhauser Score work. Med Care. 2015;53(9):e65-e72. https://doi.org/10.1097/MLR.0b013e318297429c.
9. Elixhauser Comorbidity Software. Elixhauser Comorbidity Software. https://www.hcup-us.ahrq.gov/toolssoftware/comorbidity/comorbidity.jsp#references. Accessed May 13, 2019.
10. Roshetsky LM, Coltri A, Flores A, et al. No time for teaching? Inpatient attending physicians’ workload and teaching before and after the implementation of the 2003 duty hours regulations. Acad Med J Assoc Am Med Coll. 2013;88(9):1293-1298. https://doi.org/10.1097/ACM.0b013e31829eb795.
11. Barnett ML, Boddupalli D, Nundy S, Bates DW. Comparative accuracy of diagnosis by collective intelligence of multiple physicians vs individual physicians. JAMA Netw Open. 2019;2(3):e190096. https://doi.org/10.1001/jamanetworkopen.2019.0096.
12. Aoyama T, Kunisawa S, Fushimi K, Sawa T, Imanaka Y. Comparison of surgical and conservative treatment outcomes for type A aortic dissection in elderly patients. J Cardiothorac Surg. 2018;13(1):129. https://doi.org/10.1186/s13019-018-0814-6.
13. Lindau ST, Schumm LP, Laumann EO, Levinson W, O’Muircheartaigh CA, Waite LJ. A study of sexuality and health among older adults in the United States. N Engl J Med. 2007;357(8):762-774. https://doi.org/10.1056/NEJMoa067423.
14. Yergan J, Flood AB, Diehr P, LoGerfo JP. Relationship between patient source of payment and the intensity of hospital services. Med Care. 1988;26(11):1111-1114. https://doi.org/10.1097/00005650-198811000-00009.
15. Center for Medicare and Medicaid Services. MDCR INPT HOSP 1.; 2008. https://www.cms.gov/Research-Statistics-Data-and-Systems/Statistics-Trends-and-Reports/CMSProgramStatistics/2013/Downloads/MDCR_UTIL/CPS_MDCR_INPT_HOSP_1.pdf. Accessed April 15, 2018.
1. Stevens JP, Nyweide D, Maresh S, et al. Variation in inpatient consultation among older adults in the United States. J Gen Intern Med. 2015;30(7):992-999. https://doi.org/10.1007/s11606-015-3216-7.
2. Lahey T, Shah R, Gittzus J, Schwartzman J, Kirkland K. Infectious diseases consultation lowers mortality from Staphylococcus aureus bacteremia. Medicine (Baltimore). 2009;88(5):263-267. https://doi.org/10.1097/MD.0b013e3181b8fccb.
3. Morrison RS, Dietrich J, Ladwig S, et al. Palliative care consultation teams cut hospital costs for Medicaid beneficiaries. Health Aff Proj Hope. 2011;30(3):454-463. https://doi.org/10.1377/hlthaff.2010.0929.
4. Stevens JP, Nyweide DJ, Maresh S, Hatfield LA, Howell MD, Landon BE. Comparison of hospital resource use and outcomes among hospitalists, primary care physicians, and other generalists. JAMA Intern Med. 2017;177(12):1781. https://doi.org/10.1001/jamainternmed.2017.5824.
5. Meltzer D. Effects of physician experience on costs and outcomes on an academic general medicine service: Results of a trial of hospitalists. Ann Intern Med. 2002;137(11):866. https://doi.org/10.7326/0003-4819-137-11-200212030-00007.
6. Martin SK, Farnan JM, Flores A, Kurina LM, Meltzer DO, Arora VM. Exploring entrustment: Housestaff autonomy and patient readmission. Am J Med. 2014;127(8):791-797. https://doi.org/10.1016/j.amjmed.2014.04.013.
7. HCUP-US NIS Overview. https://www.hcup-us.ahrq.gov/nisoverview.jsp. Accessed July 7, 2017.
8. Austin SR, Wong Y-N, Uzzo RG, Beck JR, Egleston BL. Why summary comorbidity measures such as the Charlson Comorbidity Index and Elixhauser Score work. Med Care. 2015;53(9):e65-e72. https://doi.org/10.1097/MLR.0b013e318297429c.
9. Elixhauser Comorbidity Software. Elixhauser Comorbidity Software. https://www.hcup-us.ahrq.gov/toolssoftware/comorbidity/comorbidity.jsp#references. Accessed May 13, 2019.
10. Roshetsky LM, Coltri A, Flores A, et al. No time for teaching? Inpatient attending physicians’ workload and teaching before and after the implementation of the 2003 duty hours regulations. Acad Med J Assoc Am Med Coll. 2013;88(9):1293-1298. https://doi.org/10.1097/ACM.0b013e31829eb795.
11. Barnett ML, Boddupalli D, Nundy S, Bates DW. Comparative accuracy of diagnosis by collective intelligence of multiple physicians vs individual physicians. JAMA Netw Open. 2019;2(3):e190096. https://doi.org/10.1001/jamanetworkopen.2019.0096.
12. Aoyama T, Kunisawa S, Fushimi K, Sawa T, Imanaka Y. Comparison of surgical and conservative treatment outcomes for type A aortic dissection in elderly patients. J Cardiothorac Surg. 2018;13(1):129. https://doi.org/10.1186/s13019-018-0814-6.
13. Lindau ST, Schumm LP, Laumann EO, Levinson W, O’Muircheartaigh CA, Waite LJ. A study of sexuality and health among older adults in the United States. N Engl J Med. 2007;357(8):762-774. https://doi.org/10.1056/NEJMoa067423.
14. Yergan J, Flood AB, Diehr P, LoGerfo JP. Relationship between patient source of payment and the intensity of hospital services. Med Care. 1988;26(11):1111-1114. https://doi.org/10.1097/00005650-198811000-00009.
15. Center for Medicare and Medicaid Services. MDCR INPT HOSP 1.; 2008. https://www.cms.gov/Research-Statistics-Data-and-Systems/Statistics-Trends-and-Reports/CMSProgramStatistics/2013/Downloads/MDCR_UTIL/CPS_MDCR_INPT_HOSP_1.pdf. Accessed April 15, 2018.
© 2020 Society of Hospital Medicine
The Hospital Readmissions Reduction Program and COPD: More Answers, More Questions
Many provisions of the Affordable Care Act (ACA) have served to support the hospitalized patient. The expansion of Medicaid and the creation of state and federal insurance exchanges for the individual insurance market both significantly lessened the financial burden of hospital care for millions of Americans. Other aspects have proven more controversial, as many of the ACA’s health policy interventions linked to cost and quality in new ways, implementing untested concepts derived from healthcare services research on a national scale.
The Hospital Readmissions Reduction Program (HRRP) was no exception. Based on early research examining readmissions,1 the ACA included a mandate for the Centers for Medicare and Medicaid Services (CMS) to establish the HRRP. Beginning in Fiscal Year 2013, the HRRP reduced payments for excessive, 30-day, risk-standardized readmissions covering six conditions and procedures. As the third leading cause of 30-day readmissions, chronic obstructive pulmonary disease (COPD) was included in the list of designated HRRP conditions.
This inclusion of COPD in HRRP was not without controversy; analysis of Medicare data from before the ACA’s implementation demonstrated that only half of all readmissions for acute exacerbations of COPD were respiratory-related and only a third were directly related to COPD.2 Unsurprisingly, the high proportion of readmissions due to non-COPD-related causes is considered to be one of the leading factors for the failure of COPD readmission reduction programs to find significant reductions in readmissions.3 In this month’s issue of the Journal of Hospital Medicine, Buhr and colleagues explore differential readmission diagnoses following acute exacerbations of COPD using a validated, national, all-payer database.4
Like many analyses of payer datasets, this study has several limitations. First, although a large area of the US was included, the data did not include all US states. Further, as the study used multiple cross-sectional data using pooling techniques, it was not truly a longitudinal study. It was additionally limited to 10 months out of the calendar year, missing December and January, which have a high seasonal prevalence of viral respiratory illness. Finally, due to the nature of the data, COPD diagnoses were identified through administrative data known to be highly unreliable for fully capturing admissions for acute exacerbation of COPD.
Despite these limitations, the analysis by Buhr and colleagues provides additional value. They found an overall readmission rate of 17%, with just under half (7.69%) due to recurrent COPD. Patients with COPD-related readmissions were younger, had a higher proportion with Medicaid as the payer, were more frequently discharged home without services, had a shorter length of stay, and had fewer comorbidities.
Most critically, Buhr and colleagues—with a multipayer database—confirmed what researchers found in uni-payer5 and site-specific6 datasets: over half of readmissions are due to diagnoses other than COPD or respiratory-related causes. Patients readmitted due to other, unrelated diagnoses had a higher mean Elixhauser Comorbidity Index score along with higher rates of congestive heart failure and renal failure. To the practicing hospitalist, this finding supports what our internal clinical voice tells us: sicker patients are readmitted more often and more frequently with conditions unrelated to their index admission diagnosis.
The reaffirmation of the finding that the majority of readmissions are due to nonrespiratory-related causes suggests that perhaps we have a different problem than physicians and policymakers originally thought when adding COPD to the HRRP. Many COPD patients suffer from a polychronic disease, requiring a more holistic approach rather than a traditional, disease-driven, siloed approach focused solely on improving COPD-related care. It may also be true that for other subpopulations of patients with COPD, additional in-hospital and transition of care interventions are required to address patients’ multimorbidity and social determinants of health.
As physicians on the front lines of the readmitted patient, hospitalists are uniquely situated to see the challenges of populations with increasing disease complexity and disease combinations.7 The HRRP policy remains controversial. This is due in large part to recent work suggesting that while the HRRP may have helped reduce readmissions, its implementation may have driven the unintended consequence of increased mortality.8 Thus, our profession faces an existential challenge to traditional care delivery models targeting diseases. What has not been well parsed by the hospital industry or policymakers is what to do about it.
Readmission of the multimorbid patient, coupled with the challenges of the HRRP, focuses our attention on the need to transition care delivery to a model that is better suited to our patients’ needs: mass-customized, mass-produced service delivery. As physicians, we know that care delivery must be oriented around patients who have many diseases and unique life circumstances. It is our profession’s greatest challenge to collaborate with researchers and administrators to help do this with scale.
The authors thank Mary Akel for her assistance with manuscript submission.
1. Jencks SF, Williams MV, Coleman EA. Rehospitalization among patients in the Medicare Fee-for-Service Program. N Engl J Med. 2009;360(14):1418-1428. https://doi.org/10.1056/NEJMsa0803563.
2. Shah T, Churpek MM, Coca Perraillon M, Konetzka RT. Understanding why patients with COPD get readmitted: a large national study to delineate the Medicare population for the readmissions penalty expansion. Chest. 2015;147(5):1219-1226. https://doi.org/10.1378/chest.14-2181.
3. Press VG, Au DH, Bourbeau J, Dransfield MT, Gershon AS, Krishnan JA, et al. An American thoracic society workshop report: reducing COPD hospital readmissions. Ann Am Thorac Soc. 2019;16(2):161-170. https://doi.org/10.1513/AnnalsATS.201811-755WS.
4. Buhr R, Jackson N, Kominski G, Ong M, Mangione C. Factors associated with differential readmission diagnoses following acute exacerbations of COPD. J Hosp Med. 2020;15(4):252-253. https://doi.org/10.12788/jhm.3367.
5. Sharif R, Parekh TM, Pierson KS, Kuo Y-F, Sharma G. Predictors of early readmission among patients 40 to 64 years of age hospitalized for chronic obstructive pulmonary disease. Annals ATS. 2014;11(5):685-694. https://doi.org/10.1513/AnnalsATS.201310-358OC.
6. Glaser JB, El-Haddad H. Exploring novel Medicare readmission risk variables in chronic obstructive pulmonary disease patients at high risk of readmission within 30 days of hospital discharge. Ann Am Thorac Soc. 2015;12(9):1288-1293. https://doi.org/10.1513/AnnalsATS.201504-228OC.
7. Sorace J, Wong HH, Worrall C, Kelman J, Saneinejad S, MaCurdy T. The complexity of disease combinations in the Medicare population. Popul Health Manag. 2011;14(4):161-166. https://doi.org/10.1089/pop.2010.0044
8. Wadhera RK, Joynt Maddox KE, Wasfy JH, Haneuse S, Shen C, Yeh RW. Association of the hospital readmissions reduction program with mortality among medicare beneficiaries hospitalized for heart failure, acute myocardial infarction, and pneumonia. JAMA. 2018;320(24):2542-2552. https://doi.org/10.1001/jama.2018.19232.
Many provisions of the Affordable Care Act (ACA) have served to support the hospitalized patient. The expansion of Medicaid and the creation of state and federal insurance exchanges for the individual insurance market both significantly lessened the financial burden of hospital care for millions of Americans. Other aspects have proven more controversial, as many of the ACA’s health policy interventions linked to cost and quality in new ways, implementing untested concepts derived from healthcare services research on a national scale.
The Hospital Readmissions Reduction Program (HRRP) was no exception. Based on early research examining readmissions,1 the ACA included a mandate for the Centers for Medicare and Medicaid Services (CMS) to establish the HRRP. Beginning in Fiscal Year 2013, the HRRP reduced payments for excessive, 30-day, risk-standardized readmissions covering six conditions and procedures. As the third leading cause of 30-day readmissions, chronic obstructive pulmonary disease (COPD) was included in the list of designated HRRP conditions.
This inclusion of COPD in HRRP was not without controversy; analysis of Medicare data from before the ACA’s implementation demonstrated that only half of all readmissions for acute exacerbations of COPD were respiratory-related and only a third were directly related to COPD.2 Unsurprisingly, the high proportion of readmissions due to non-COPD-related causes is considered to be one of the leading factors for the failure of COPD readmission reduction programs to find significant reductions in readmissions.3 In this month’s issue of the Journal of Hospital Medicine, Buhr and colleagues explore differential readmission diagnoses following acute exacerbations of COPD using a validated, national, all-payer database.4
Like many analyses of payer datasets, this study has several limitations. First, although a large area of the US was included, the data did not include all US states. Further, as the study used multiple cross-sectional data using pooling techniques, it was not truly a longitudinal study. It was additionally limited to 10 months out of the calendar year, missing December and January, which have a high seasonal prevalence of viral respiratory illness. Finally, due to the nature of the data, COPD diagnoses were identified through administrative data known to be highly unreliable for fully capturing admissions for acute exacerbation of COPD.
Despite these limitations, the analysis by Buhr and colleagues provides additional value. They found an overall readmission rate of 17%, with just under half (7.69%) due to recurrent COPD. Patients with COPD-related readmissions were younger, had a higher proportion with Medicaid as the payer, were more frequently discharged home without services, had a shorter length of stay, and had fewer comorbidities.
Most critically, Buhr and colleagues—with a multipayer database—confirmed what researchers found in uni-payer5 and site-specific6 datasets: over half of readmissions are due to diagnoses other than COPD or respiratory-related causes. Patients readmitted due to other, unrelated diagnoses had a higher mean Elixhauser Comorbidity Index score along with higher rates of congestive heart failure and renal failure. To the practicing hospitalist, this finding supports what our internal clinical voice tells us: sicker patients are readmitted more often and more frequently with conditions unrelated to their index admission diagnosis.
The reaffirmation of the finding that the majority of readmissions are due to nonrespiratory-related causes suggests that perhaps we have a different problem than physicians and policymakers originally thought when adding COPD to the HRRP. Many COPD patients suffer from a polychronic disease, requiring a more holistic approach rather than a traditional, disease-driven, siloed approach focused solely on improving COPD-related care. It may also be true that for other subpopulations of patients with COPD, additional in-hospital and transition of care interventions are required to address patients’ multimorbidity and social determinants of health.
As physicians on the front lines of the readmitted patient, hospitalists are uniquely situated to see the challenges of populations with increasing disease complexity and disease combinations.7 The HRRP policy remains controversial. This is due in large part to recent work suggesting that while the HRRP may have helped reduce readmissions, its implementation may have driven the unintended consequence of increased mortality.8 Thus, our profession faces an existential challenge to traditional care delivery models targeting diseases. What has not been well parsed by the hospital industry or policymakers is what to do about it.
Readmission of the multimorbid patient, coupled with the challenges of the HRRP, focuses our attention on the need to transition care delivery to a model that is better suited to our patients’ needs: mass-customized, mass-produced service delivery. As physicians, we know that care delivery must be oriented around patients who have many diseases and unique life circumstances. It is our profession’s greatest challenge to collaborate with researchers and administrators to help do this with scale.
The authors thank Mary Akel for her assistance with manuscript submission.
Many provisions of the Affordable Care Act (ACA) have served to support the hospitalized patient. The expansion of Medicaid and the creation of state and federal insurance exchanges for the individual insurance market both significantly lessened the financial burden of hospital care for millions of Americans. Other aspects have proven more controversial, as many of the ACA’s health policy interventions linked to cost and quality in new ways, implementing untested concepts derived from healthcare services research on a national scale.
The Hospital Readmissions Reduction Program (HRRP) was no exception. Based on early research examining readmissions,1 the ACA included a mandate for the Centers for Medicare and Medicaid Services (CMS) to establish the HRRP. Beginning in Fiscal Year 2013, the HRRP reduced payments for excessive, 30-day, risk-standardized readmissions covering six conditions and procedures. As the third leading cause of 30-day readmissions, chronic obstructive pulmonary disease (COPD) was included in the list of designated HRRP conditions.
This inclusion of COPD in HRRP was not without controversy; analysis of Medicare data from before the ACA’s implementation demonstrated that only half of all readmissions for acute exacerbations of COPD were respiratory-related and only a third were directly related to COPD.2 Unsurprisingly, the high proportion of readmissions due to non-COPD-related causes is considered to be one of the leading factors for the failure of COPD readmission reduction programs to find significant reductions in readmissions.3 In this month’s issue of the Journal of Hospital Medicine, Buhr and colleagues explore differential readmission diagnoses following acute exacerbations of COPD using a validated, national, all-payer database.4
Like many analyses of payer datasets, this study has several limitations. First, although a large area of the US was included, the data did not include all US states. Further, as the study used multiple cross-sectional data using pooling techniques, it was not truly a longitudinal study. It was additionally limited to 10 months out of the calendar year, missing December and January, which have a high seasonal prevalence of viral respiratory illness. Finally, due to the nature of the data, COPD diagnoses were identified through administrative data known to be highly unreliable for fully capturing admissions for acute exacerbation of COPD.
Despite these limitations, the analysis by Buhr and colleagues provides additional value. They found an overall readmission rate of 17%, with just under half (7.69%) due to recurrent COPD. Patients with COPD-related readmissions were younger, had a higher proportion with Medicaid as the payer, were more frequently discharged home without services, had a shorter length of stay, and had fewer comorbidities.
Most critically, Buhr and colleagues—with a multipayer database—confirmed what researchers found in uni-payer5 and site-specific6 datasets: over half of readmissions are due to diagnoses other than COPD or respiratory-related causes. Patients readmitted due to other, unrelated diagnoses had a higher mean Elixhauser Comorbidity Index score along with higher rates of congestive heart failure and renal failure. To the practicing hospitalist, this finding supports what our internal clinical voice tells us: sicker patients are readmitted more often and more frequently with conditions unrelated to their index admission diagnosis.
The reaffirmation of the finding that the majority of readmissions are due to nonrespiratory-related causes suggests that perhaps we have a different problem than physicians and policymakers originally thought when adding COPD to the HRRP. Many COPD patients suffer from a polychronic disease, requiring a more holistic approach rather than a traditional, disease-driven, siloed approach focused solely on improving COPD-related care. It may also be true that for other subpopulations of patients with COPD, additional in-hospital and transition of care interventions are required to address patients’ multimorbidity and social determinants of health.
As physicians on the front lines of the readmitted patient, hospitalists are uniquely situated to see the challenges of populations with increasing disease complexity and disease combinations.7 The HRRP policy remains controversial. This is due in large part to recent work suggesting that while the HRRP may have helped reduce readmissions, its implementation may have driven the unintended consequence of increased mortality.8 Thus, our profession faces an existential challenge to traditional care delivery models targeting diseases. What has not been well parsed by the hospital industry or policymakers is what to do about it.
Readmission of the multimorbid patient, coupled with the challenges of the HRRP, focuses our attention on the need to transition care delivery to a model that is better suited to our patients’ needs: mass-customized, mass-produced service delivery. As physicians, we know that care delivery must be oriented around patients who have many diseases and unique life circumstances. It is our profession’s greatest challenge to collaborate with researchers and administrators to help do this with scale.
The authors thank Mary Akel for her assistance with manuscript submission.
1. Jencks SF, Williams MV, Coleman EA. Rehospitalization among patients in the Medicare Fee-for-Service Program. N Engl J Med. 2009;360(14):1418-1428. https://doi.org/10.1056/NEJMsa0803563.
2. Shah T, Churpek MM, Coca Perraillon M, Konetzka RT. Understanding why patients with COPD get readmitted: a large national study to delineate the Medicare population for the readmissions penalty expansion. Chest. 2015;147(5):1219-1226. https://doi.org/10.1378/chest.14-2181.
3. Press VG, Au DH, Bourbeau J, Dransfield MT, Gershon AS, Krishnan JA, et al. An American thoracic society workshop report: reducing COPD hospital readmissions. Ann Am Thorac Soc. 2019;16(2):161-170. https://doi.org/10.1513/AnnalsATS.201811-755WS.
4. Buhr R, Jackson N, Kominski G, Ong M, Mangione C. Factors associated with differential readmission diagnoses following acute exacerbations of COPD. J Hosp Med. 2020;15(4):252-253. https://doi.org/10.12788/jhm.3367.
5. Sharif R, Parekh TM, Pierson KS, Kuo Y-F, Sharma G. Predictors of early readmission among patients 40 to 64 years of age hospitalized for chronic obstructive pulmonary disease. Annals ATS. 2014;11(5):685-694. https://doi.org/10.1513/AnnalsATS.201310-358OC.
6. Glaser JB, El-Haddad H. Exploring novel Medicare readmission risk variables in chronic obstructive pulmonary disease patients at high risk of readmission within 30 days of hospital discharge. Ann Am Thorac Soc. 2015;12(9):1288-1293. https://doi.org/10.1513/AnnalsATS.201504-228OC.
7. Sorace J, Wong HH, Worrall C, Kelman J, Saneinejad S, MaCurdy T. The complexity of disease combinations in the Medicare population. Popul Health Manag. 2011;14(4):161-166. https://doi.org/10.1089/pop.2010.0044
8. Wadhera RK, Joynt Maddox KE, Wasfy JH, Haneuse S, Shen C, Yeh RW. Association of the hospital readmissions reduction program with mortality among medicare beneficiaries hospitalized for heart failure, acute myocardial infarction, and pneumonia. JAMA. 2018;320(24):2542-2552. https://doi.org/10.1001/jama.2018.19232.
1. Jencks SF, Williams MV, Coleman EA. Rehospitalization among patients in the Medicare Fee-for-Service Program. N Engl J Med. 2009;360(14):1418-1428. https://doi.org/10.1056/NEJMsa0803563.
2. Shah T, Churpek MM, Coca Perraillon M, Konetzka RT. Understanding why patients with COPD get readmitted: a large national study to delineate the Medicare population for the readmissions penalty expansion. Chest. 2015;147(5):1219-1226. https://doi.org/10.1378/chest.14-2181.
3. Press VG, Au DH, Bourbeau J, Dransfield MT, Gershon AS, Krishnan JA, et al. An American thoracic society workshop report: reducing COPD hospital readmissions. Ann Am Thorac Soc. 2019;16(2):161-170. https://doi.org/10.1513/AnnalsATS.201811-755WS.
4. Buhr R, Jackson N, Kominski G, Ong M, Mangione C. Factors associated with differential readmission diagnoses following acute exacerbations of COPD. J Hosp Med. 2020;15(4):252-253. https://doi.org/10.12788/jhm.3367.
5. Sharif R, Parekh TM, Pierson KS, Kuo Y-F, Sharma G. Predictors of early readmission among patients 40 to 64 years of age hospitalized for chronic obstructive pulmonary disease. Annals ATS. 2014;11(5):685-694. https://doi.org/10.1513/AnnalsATS.201310-358OC.
6. Glaser JB, El-Haddad H. Exploring novel Medicare readmission risk variables in chronic obstructive pulmonary disease patients at high risk of readmission within 30 days of hospital discharge. Ann Am Thorac Soc. 2015;12(9):1288-1293. https://doi.org/10.1513/AnnalsATS.201504-228OC.
7. Sorace J, Wong HH, Worrall C, Kelman J, Saneinejad S, MaCurdy T. The complexity of disease combinations in the Medicare population. Popul Health Manag. 2011;14(4):161-166. https://doi.org/10.1089/pop.2010.0044
8. Wadhera RK, Joynt Maddox KE, Wasfy JH, Haneuse S, Shen C, Yeh RW. Association of the hospital readmissions reduction program with mortality among medicare beneficiaries hospitalized for heart failure, acute myocardial infarction, and pneumonia. JAMA. 2018;320(24):2542-2552. https://doi.org/10.1001/jama.2018.19232.
© 2020 Society of Hospital Medicine
Hypofractionated radiotherapy for prostate cancer stands the test of time
SAN FRANCISCO – an update of the CHHiP trial shows.

The 3,216 men in the phase 3 trial had node-negative T1b-T3a prostate cancer and were evenly assigned to a conventional regimen of 74 Gy delivered in 37 fractions, a hypofractionated regimen of 60 Gy in 20 fractions, or a hypofractionated regimen of 57 Gy in 19 fractions. All regimens were delivered with intensity-modulated techniques.
The trial’s 5-year results, previously reported, showed noninferiority of the 60-Gy regimen, compared with the 74-Gy regimen on risk of biochemical or clinical failure (hazard ratio, 0.84), prompting recommendation of the former as a new standard of care for localized prostate cancer (Lancet Oncol. 2016;17:1047-60). Noninferiority could not be established for the 57-Gy regimen.
The 8-year results were essentially the same, confirming noninferiority of the 60-Gy regimen (HR, 0.85) but not the 57-Gy regimen. Meanwhile, bowel and bladder toxicity continued to be low across regimens.
David P. Dearnaley, MB BCh, MD, of the Royal Marsden NHS Foundation Trust, London, reported the 8-year results at the 2020 Genitourinary Cancers Symposium, sponsored by the American Society for Clinical Oncology, ASTRO, and the Society of Urologic Oncology.
Study details
At a median follow-up of 9.3 years, the 8-year rate of freedom from biochemical failure (defined by Phoenix consensus guidelines) or clinical failure (cancer recurrence) was 80.6% with 74 Gy, 83.7% with 60 Gy, and 78.5% with 57 Gy, Dr. Dearnaley reported.
Analyses confirmed noninferiority of the 60-Gy regimen (HR, 0.85; 95% confidence interval, 0.72-1.01; P = .11), but not the 57-Gy regimen (HR, 1.17; 95% CI, 1.00-1.36; P = .10), as the upper bound of the confidence interval crossed the predefined 1.21 boundary for noninferiority.
In an unplanned analysis, the pattern among men younger than 75 years was similar to that in the entire trial population. But among men 75 years of age and older, the 57-Gy arm is actually outperforming the 74-Gy arm (HR, 0.77).
The three regimens yielded a similarly high rate of freedom from metastases, at about 95% in each arm. The 60-Gy regimen had an edge in overall survival relative to the 74-Gy regimen (88.6% vs. 85.9%; HR, 0.84) that is hard to explain, according to Dr. Dearnaley.
“Because there is an 8:1 ratio of non–prostate cancer deaths to prostate cancer deaths, you would have to postulate something other than prostate cancer being affected by the radiotherapy fractionation,” he said. “The answers on a postcard, because I can’t think of one.”
On central pathology review, nearly a fifth of evaluated trial patients had high-risk disease. “I know everybody wants to know about high-risk patients, but I’d rather take the trial results as a whole and look to see if there is any heterogeneity between those groups rather than perform a specific high-risk subgroup analysis,” Dr. Dearnaley said, expressing concern about performing too many subgroup analyses.
That said, older patients on the trial tended to have higher risk. “It does seem hypofractionation was particularly useful in those patients,” he noted. “Now, whether that’s anything to do with their pathology or whether it’s due to their age per se, I really don’t know.”
There were no differences between groups on rates of Radiation Therapy Oncology Group toxicity at 5 years, with grade 2 or worse bowel toxicity and bladder toxicity each seen in about 2% of patients.
There were no significant differences in rates of patient-reported “moderate or big” bowel bother (roughly 5%-8%) and urinary bother (roughly 7%-9%). For all regimens, bowel and urinary symptoms remained stable from 2-5 years.
Reassuring for practice
These updated findings “support the continued use of 60 Gy in 20 fractions as the standard of care,” Dr. Dearnaley said.
When the math is run to permit comparison, efficacy findings of the CHHiP trial show “amazing agreement” with those of the similar multinational PROFIT trial, he noted (J Clin Oncol. 2017 Jun 10;35(17):1884-90).
The absolute advantage in the failure-free rate of 3.1% and the overall survival rate of 2.7% for the 60-Gy regimen in CHHiP generated interest among symposium attendees about its possible superiority. “I think the 60 Gy is marginally more effective than the 74 Gy,” Dr. Dearnaley said, but he acknowledged that there are no statistics to prove that.

“This CHHiP update is fantastic,” said session cochair Paul L. Nguyen, MD, of the Dana-Farber Cancer Institute in Boston. “It is very reassuring that the initial results the investigators presented several years ago still hold up in the long term. It’s even more reassuring for the use of hypofractionation, and it’s great to know that we can use it across the age spectrum and it works well.”
This trial is the only noninferiority hypofractionation trial in prostate cancer that includes a sizable share of patients at high risk for poor outcomes, a population for whom efficacy of this strategy is of particular interest, Dr. Nguyen noted.
“That’s always been a question,” he said. “The majority of the data from the noninferiority trials is for the low- and intermediate-risk patients. So it really would be interesting to learn whatever we can about high-risk patients from this trial.”
The trial was funded by Cancer Research UK, Department of Health (UK), and the National Institute for Health Research Cancer Research Network. Dr. Dearnaley and Dr. Nguyen disclosed relationships with a range of pharmaceutical companies.
SOURCE: Dearnaley DP et al. GUCS 2020. Abstract 325.
SAN FRANCISCO – an update of the CHHiP trial shows.
The 3,216 men in the phase 3 trial had node-negative T1b-T3a prostate cancer and were evenly assigned to a conventional regimen of 74 Gy delivered in 37 fractions, a hypofractionated regimen of 60 Gy in 20 fractions, or a hypofractionated regimen of 57 Gy in 19 fractions. All regimens were delivered with intensity-modulated techniques.
The trial’s 5-year results, previously reported, showed noninferiority of the 60-Gy regimen, compared with the 74-Gy regimen on risk of biochemical or clinical failure (hazard ratio, 0.84), prompting recommendation of the former as a new standard of care for localized prostate cancer (Lancet Oncol. 2016;17:1047-60). Noninferiority could not be established for the 57-Gy regimen.
The 8-year results were essentially the same, confirming noninferiority of the 60-Gy regimen (HR, 0.85) but not the 57-Gy regimen. Meanwhile, bowel and bladder toxicity continued to be low across regimens.
David P. Dearnaley, MB BCh, MD, of the Royal Marsden NHS Foundation Trust, London, reported the 8-year results at the 2020 Genitourinary Cancers Symposium, sponsored by the American Society for Clinical Oncology, ASTRO, and the Society of Urologic Oncology.
Study details
At a median follow-up of 9.3 years, the 8-year rate of freedom from biochemical failure (defined by Phoenix consensus guidelines) or clinical failure (cancer recurrence) was 80.6% with 74 Gy, 83.7% with 60 Gy, and 78.5% with 57 Gy, Dr. Dearnaley reported.
Analyses confirmed noninferiority of the 60-Gy regimen (HR, 0.85; 95% confidence interval, 0.72-1.01; P = .11), but not the 57-Gy regimen (HR, 1.17; 95% CI, 1.00-1.36; P = .10), as the upper bound of the confidence interval crossed the predefined 1.21 boundary for noninferiority.
In an unplanned analysis, the pattern among men younger than 75 years was similar to that in the entire trial population. But among men 75 years of age and older, the 57-Gy arm is actually outperforming the 74-Gy arm (HR, 0.77).
The three regimens yielded a similarly high rate of freedom from metastases, at about 95% in each arm. The 60-Gy regimen had an edge in overall survival relative to the 74-Gy regimen (88.6% vs. 85.9%; HR, 0.84) that is hard to explain, according to Dr. Dearnaley.
“Because there is an 8:1 ratio of non–prostate cancer deaths to prostate cancer deaths, you would have to postulate something other than prostate cancer being affected by the radiotherapy fractionation,” he said. “The answers on a postcard, because I can’t think of one.”
On central pathology review, nearly a fifth of evaluated trial patients had high-risk disease. “I know everybody wants to know about high-risk patients, but I’d rather take the trial results as a whole and look to see if there is any heterogeneity between those groups rather than perform a specific high-risk subgroup analysis,” Dr. Dearnaley said, expressing concern about performing too many subgroup analyses.
That said, older patients on the trial tended to have higher risk. “It does seem hypofractionation was particularly useful in those patients,” he noted. “Now, whether that’s anything to do with their pathology or whether it’s due to their age per se, I really don’t know.”
There were no differences between groups on rates of Radiation Therapy Oncology Group toxicity at 5 years, with grade 2 or worse bowel toxicity and bladder toxicity each seen in about 2% of patients.
There were no significant differences in rates of patient-reported “moderate or big” bowel bother (roughly 5%-8%) and urinary bother (roughly 7%-9%). For all regimens, bowel and urinary symptoms remained stable from 2-5 years.
Reassuring for practice
These updated findings “support the continued use of 60 Gy in 20 fractions as the standard of care,” Dr. Dearnaley said.
When the math is run to permit comparison, efficacy findings of the CHHiP trial show “amazing agreement” with those of the similar multinational PROFIT trial, he noted (J Clin Oncol. 2017 Jun 10;35(17):1884-90).
The absolute advantage in the failure-free rate of 3.1% and the overall survival rate of 2.7% for the 60-Gy regimen in CHHiP generated interest among symposium attendees about its possible superiority. “I think the 60 Gy is marginally more effective than the 74 Gy,” Dr. Dearnaley said, but he acknowledged that there are no statistics to prove that.
“This CHHiP update is fantastic,” said session cochair Paul L. Nguyen, MD, of the Dana-Farber Cancer Institute in Boston. “It is very reassuring that the initial results the investigators presented several years ago still hold up in the long term. It’s even more reassuring for the use of hypofractionation, and it’s great to know that we can use it across the age spectrum and it works well.”
This trial is the only noninferiority hypofractionation trial in prostate cancer that includes a sizable share of patients at high risk for poor outcomes, a population for whom efficacy of this strategy is of particular interest, Dr. Nguyen noted.
“That’s always been a question,” he said. “The majority of the data from the noninferiority trials is for the low- and intermediate-risk patients. So it really would be interesting to learn whatever we can about high-risk patients from this trial.”
The trial was funded by Cancer Research UK, Department of Health (UK), and the National Institute for Health Research Cancer Research Network. Dr. Dearnaley and Dr. Nguyen disclosed relationships with a range of pharmaceutical companies.
SOURCE: Dearnaley DP et al. GUCS 2020. Abstract 325.
SAN FRANCISCO – an update of the CHHiP trial shows.
The 3,216 men in the phase 3 trial had node-negative T1b-T3a prostate cancer and were evenly assigned to a conventional regimen of 74 Gy delivered in 37 fractions, a hypofractionated regimen of 60 Gy in 20 fractions, or a hypofractionated regimen of 57 Gy in 19 fractions. All regimens were delivered with intensity-modulated techniques.
The trial’s 5-year results, previously reported, showed noninferiority of the 60-Gy regimen, compared with the 74-Gy regimen on risk of biochemical or clinical failure (hazard ratio, 0.84), prompting recommendation of the former as a new standard of care for localized prostate cancer (Lancet Oncol. 2016;17:1047-60). Noninferiority could not be established for the 57-Gy regimen.
The 8-year results were essentially the same, confirming noninferiority of the 60-Gy regimen (HR, 0.85) but not the 57-Gy regimen. Meanwhile, bowel and bladder toxicity continued to be low across regimens.
David P. Dearnaley, MB BCh, MD, of the Royal Marsden NHS Foundation Trust, London, reported the 8-year results at the 2020 Genitourinary Cancers Symposium, sponsored by the American Society for Clinical Oncology, ASTRO, and the Society of Urologic Oncology.
Study details
At a median follow-up of 9.3 years, the 8-year rate of freedom from biochemical failure (defined by Phoenix consensus guidelines) or clinical failure (cancer recurrence) was 80.6% with 74 Gy, 83.7% with 60 Gy, and 78.5% with 57 Gy, Dr. Dearnaley reported.
Analyses confirmed noninferiority of the 60-Gy regimen (HR, 0.85; 95% confidence interval, 0.72-1.01; P = .11), but not the 57-Gy regimen (HR, 1.17; 95% CI, 1.00-1.36; P = .10), as the upper bound of the confidence interval crossed the predefined 1.21 boundary for noninferiority.
In an unplanned analysis, the pattern among men younger than 75 years was similar to that in the entire trial population. But among men 75 years of age and older, the 57-Gy arm is actually outperforming the 74-Gy arm (HR, 0.77).
The three regimens yielded a similarly high rate of freedom from metastases, at about 95% in each arm. The 60-Gy regimen had an edge in overall survival relative to the 74-Gy regimen (88.6% vs. 85.9%; HR, 0.84) that is hard to explain, according to Dr. Dearnaley.
“Because there is an 8:1 ratio of non–prostate cancer deaths to prostate cancer deaths, you would have to postulate something other than prostate cancer being affected by the radiotherapy fractionation,” he said. “The answers on a postcard, because I can’t think of one.”
On central pathology review, nearly a fifth of evaluated trial patients had high-risk disease. “I know everybody wants to know about high-risk patients, but I’d rather take the trial results as a whole and look to see if there is any heterogeneity between those groups rather than perform a specific high-risk subgroup analysis,” Dr. Dearnaley said, expressing concern about performing too many subgroup analyses.
That said, older patients on the trial tended to have higher risk. “It does seem hypofractionation was particularly useful in those patients,” he noted. “Now, whether that’s anything to do with their pathology or whether it’s due to their age per se, I really don’t know.”
There were no differences between groups on rates of Radiation Therapy Oncology Group toxicity at 5 years, with grade 2 or worse bowel toxicity and bladder toxicity each seen in about 2% of patients.
There were no significant differences in rates of patient-reported “moderate or big” bowel bother (roughly 5%-8%) and urinary bother (roughly 7%-9%). For all regimens, bowel and urinary symptoms remained stable from 2-5 years.
Reassuring for practice
These updated findings “support the continued use of 60 Gy in 20 fractions as the standard of care,” Dr. Dearnaley said.
When the math is run to permit comparison, efficacy findings of the CHHiP trial show “amazing agreement” with those of the similar multinational PROFIT trial, he noted (J Clin Oncol. 2017 Jun 10;35(17):1884-90).
The absolute advantage in the failure-free rate of 3.1% and the overall survival rate of 2.7% for the 60-Gy regimen in CHHiP generated interest among symposium attendees about its possible superiority. “I think the 60 Gy is marginally more effective than the 74 Gy,” Dr. Dearnaley said, but he acknowledged that there are no statistics to prove that.
“This CHHiP update is fantastic,” said session cochair Paul L. Nguyen, MD, of the Dana-Farber Cancer Institute in Boston. “It is very reassuring that the initial results the investigators presented several years ago still hold up in the long term. It’s even more reassuring for the use of hypofractionation, and it’s great to know that we can use it across the age spectrum and it works well.”
This trial is the only noninferiority hypofractionation trial in prostate cancer that includes a sizable share of patients at high risk for poor outcomes, a population for whom efficacy of this strategy is of particular interest, Dr. Nguyen noted.
“That’s always been a question,” he said. “The majority of the data from the noninferiority trials is for the low- and intermediate-risk patients. So it really would be interesting to learn whatever we can about high-risk patients from this trial.”
The trial was funded by Cancer Research UK, Department of Health (UK), and the National Institute for Health Research Cancer Research Network. Dr. Dearnaley and Dr. Nguyen disclosed relationships with a range of pharmaceutical companies.
SOURCE: Dearnaley DP et al. GUCS 2020. Abstract 325.
REPORTING FROM GUCS 2020

Brain imaging offers new insight into persistent antisocial behavior
Individuals who exhibit antisocial behavior over a lifetime have a thinner cortex and smaller surface area in key brain regions relative to their counterparts who do not engage in antisocial behavior, new research shows.
However, investigators found no widespread structural brain abnormalities in the group of individuals who exhibited antisocial behavior only during adolescence.
These brain differences seem to be “quite specific and unique” to individuals who exhibit persistent antisocial behavior over their life, lead researcher Christina O. Carlisi, PhD, of University College London, said during a press briefing.
“Critically, the findings don’t directly link brain structure abnormalities to antisocial behavior,” she said. Nor do they mean that anyone with a smaller brain or brain area is destined to be antisocial or to commit a crime.
“Our findings support the idea that, for the small proportion of individuals with life-course–persistent antisocial behavior, there may be differences in their brain structure that make it difficult for them to develop social skills that prevent them from engaging in antisocial behavior,” Dr. Carlisi said in a news release. “These people could benefit from more support throughout their lives.”
It was published online Feb. 17 in the Lancet Psychiatry (doi: 10.1016/S2215-0366[20]30002-X).
Support for second chances
Speaking at the press briefing, coauthor Terrie E. Moffitt, PhD, of Duke University, Durham, N.C., said it’s well known that most young criminals are between the ages of 16 and 25.
Breaking the law is not at all rare in this age group, but not all of these young offenders are alike, she noted. Only a few become persistent repeat offenders.
“They start as a young child with aggressive conduct problems and eventually sink into a long-term lifestyle of repetitive serious crime that lasts well into adulthood, but this is a small group,” Dr. Moffitt explained. “In contrast, the larger majority of offenders will have only a short-term brush with lawbreaking and then grow up to become law-abiding members of society.”
The current study suggests that what makes short-term offenders behave differently from long-term offenders might involve some vulnerability at the level of the structure of the brain, Dr. Moffitt said.
The findings stem from 672 individuals in the Dunedin Multidisciplinary Health and Development Study, a population-representative, longitudinal birth cohort that assesses health and behavior.
On the basis of reports from parents, care givers, and teachers, as well as self-reports of conduct problems in persons aged 7-26 years, 80 participants (12%) had “life-course–persistent” antisocial behavior, 151 (23%) had adolescent-only antisocial behavior, and 441 (66%) had “low” antisocial behavior (control group, whose members never had a pervasive or persistent pattern of antisocial behavior).
Brain MRI obtained at age 45 years showed that, among individuals with persistent antisocial behavior, mean surface area was smaller (95% confidence interval, –0.24 to –0.11; P less than .0001) and mean cortical thickness was lower (95% CI, –0.19 to –0.02; P = .020) than was those of their peers in the control group.
For those in the life-course–persistent group, surface area was reduced in 282 of 360 anatomically defined brain parcels, and cortex was thinner in 11 of 360 parcels encompassing frontal and temporal regions (which were associated with executive function, emotion regulation, and motivation), compared with the control group.
Widespread differences in brain surface morphometry were not found in those who exhibited antisocial behavior during adolescence only. Such behavior was likely the result of their having to navigate through socially tough years.
“These findings underscore prior research that really highlights that there are different types of young offenders. They are not all the same; they should not all be treated the same,” coauthor Essi Viding, PhD, who also is affiliated with University College London, told reporters.
The findings support current strategies aimed at giving young offenders “a second chance” as opposed to enforcing harsher policies that prioritize incarceration for all young offenders, Dr. Viding added.
Important contribution
The authors of an accompanying commentary noted that, despite “remarkable progress in the past 3 decades, the etiology of antisocial behavior remains elusive” (Lancet Psychiatry. 2020 Feb 17. doi: 10.1016/S2215-0366[20]30035-3).
This study makes “an important contribution by identifying structural brain correlates of antisocial behavior that could be used to differentiate among individuals with life-course-persistent antisocial behavior, those with adolescence-limited antisocial behavior, and non-antisocial controls,” write Inti A. Brazil, PhD, of the Donders Institute for Brain, Cognition and Behavior, Radboud University, Nijmegen, the Netherlands, and Macià Buades-Rotger, PhD, of the Institute of Psychology II, University of Lübeck, Germany.
They noted that the findings might help to move the field closer to achieving the long-standing goal of incorporating neural data into assessment protocols for antisocial behavior.
The discovery of “meaningful morphologic differences between individuals with life-course–persistent and adolescence-limited antisocial behavior offers an important advance in the use of brain metrics for differentiating among individuals with antisocial dispositions.
“Importantly, however, it remains to be determined whether and how measuring the brain can be used to bridge the different taxometric views and theories on the etiology of antisocial behavior,” Dr. Brazil and Dr. Buades-Rotger concluded.
The study was funded by the U.S. National Institute on Aging; the Health Research Council of New Zealand; the New Zealand Ministry of Business, Innovation and Employment; the U.K. Medical Research Council; the Avielle Foundation; and the Wellcome Trust. The study authors and the authors of the commentary disclosed no relevant financial relationships.
A version of this article first appeared on Medscape.com.
Individuals who exhibit antisocial behavior over a lifetime have a thinner cortex and smaller surface area in key brain regions relative to their counterparts who do not engage in antisocial behavior, new research shows.
However, investigators found no widespread structural brain abnormalities in the group of individuals who exhibited antisocial behavior only during adolescence.
These brain differences seem to be “quite specific and unique” to individuals who exhibit persistent antisocial behavior over their life, lead researcher Christina O. Carlisi, PhD, of University College London, said during a press briefing.
“Critically, the findings don’t directly link brain structure abnormalities to antisocial behavior,” she said. Nor do they mean that anyone with a smaller brain or brain area is destined to be antisocial or to commit a crime.
“Our findings support the idea that, for the small proportion of individuals with life-course–persistent antisocial behavior, there may be differences in their brain structure that make it difficult for them to develop social skills that prevent them from engaging in antisocial behavior,” Dr. Carlisi said in a news release. “These people could benefit from more support throughout their lives.”
It was published online Feb. 17 in the Lancet Psychiatry (doi: 10.1016/S2215-0366[20]30002-X).
Support for second chances
Speaking at the press briefing, coauthor Terrie E. Moffitt, PhD, of Duke University, Durham, N.C., said it’s well known that most young criminals are between the ages of 16 and 25.
Breaking the law is not at all rare in this age group, but not all of these young offenders are alike, she noted. Only a few become persistent repeat offenders.
“They start as a young child with aggressive conduct problems and eventually sink into a long-term lifestyle of repetitive serious crime that lasts well into adulthood, but this is a small group,” Dr. Moffitt explained. “In contrast, the larger majority of offenders will have only a short-term brush with lawbreaking and then grow up to become law-abiding members of society.”
The current study suggests that what makes short-term offenders behave differently from long-term offenders might involve some vulnerability at the level of the structure of the brain, Dr. Moffitt said.
The findings stem from 672 individuals in the Dunedin Multidisciplinary Health and Development Study, a population-representative, longitudinal birth cohort that assesses health and behavior.
On the basis of reports from parents, care givers, and teachers, as well as self-reports of conduct problems in persons aged 7-26 years, 80 participants (12%) had “life-course–persistent” antisocial behavior, 151 (23%) had adolescent-only antisocial behavior, and 441 (66%) had “low” antisocial behavior (control group, whose members never had a pervasive or persistent pattern of antisocial behavior).
Brain MRI obtained at age 45 years showed that, among individuals with persistent antisocial behavior, mean surface area was smaller (95% confidence interval, –0.24 to –0.11; P less than .0001) and mean cortical thickness was lower (95% CI, –0.19 to –0.02; P = .020) than was those of their peers in the control group.
For those in the life-course–persistent group, surface area was reduced in 282 of 360 anatomically defined brain parcels, and cortex was thinner in 11 of 360 parcels encompassing frontal and temporal regions (which were associated with executive function, emotion regulation, and motivation), compared with the control group.
Widespread differences in brain surface morphometry were not found in those who exhibited antisocial behavior during adolescence only. Such behavior was likely the result of their having to navigate through socially tough years.
“These findings underscore prior research that really highlights that there are different types of young offenders. They are not all the same; they should not all be treated the same,” coauthor Essi Viding, PhD, who also is affiliated with University College London, told reporters.
The findings support current strategies aimed at giving young offenders “a second chance” as opposed to enforcing harsher policies that prioritize incarceration for all young offenders, Dr. Viding added.
Important contribution
The authors of an accompanying commentary noted that, despite “remarkable progress in the past 3 decades, the etiology of antisocial behavior remains elusive” (Lancet Psychiatry. 2020 Feb 17. doi: 10.1016/S2215-0366[20]30035-3).
This study makes “an important contribution by identifying structural brain correlates of antisocial behavior that could be used to differentiate among individuals with life-course-persistent antisocial behavior, those with adolescence-limited antisocial behavior, and non-antisocial controls,” write Inti A. Brazil, PhD, of the Donders Institute for Brain, Cognition and Behavior, Radboud University, Nijmegen, the Netherlands, and Macià Buades-Rotger, PhD, of the Institute of Psychology II, University of Lübeck, Germany.
They noted that the findings might help to move the field closer to achieving the long-standing goal of incorporating neural data into assessment protocols for antisocial behavior.
The discovery of “meaningful morphologic differences between individuals with life-course–persistent and adolescence-limited antisocial behavior offers an important advance in the use of brain metrics for differentiating among individuals with antisocial dispositions.
“Importantly, however, it remains to be determined whether and how measuring the brain can be used to bridge the different taxometric views and theories on the etiology of antisocial behavior,” Dr. Brazil and Dr. Buades-Rotger concluded.
The study was funded by the U.S. National Institute on Aging; the Health Research Council of New Zealand; the New Zealand Ministry of Business, Innovation and Employment; the U.K. Medical Research Council; the Avielle Foundation; and the Wellcome Trust. The study authors and the authors of the commentary disclosed no relevant financial relationships.
A version of this article first appeared on Medscape.com.
Individuals who exhibit antisocial behavior over a lifetime have a thinner cortex and smaller surface area in key brain regions relative to their counterparts who do not engage in antisocial behavior, new research shows.
However, investigators found no widespread structural brain abnormalities in the group of individuals who exhibited antisocial behavior only during adolescence.
These brain differences seem to be “quite specific and unique” to individuals who exhibit persistent antisocial behavior over their life, lead researcher Christina O. Carlisi, PhD, of University College London, said during a press briefing.
“Critically, the findings don’t directly link brain structure abnormalities to antisocial behavior,” she said. Nor do they mean that anyone with a smaller brain or brain area is destined to be antisocial or to commit a crime.
“Our findings support the idea that, for the small proportion of individuals with life-course–persistent antisocial behavior, there may be differences in their brain structure that make it difficult for them to develop social skills that prevent them from engaging in antisocial behavior,” Dr. Carlisi said in a news release. “These people could benefit from more support throughout their lives.”
It was published online Feb. 17 in the Lancet Psychiatry (doi: 10.1016/S2215-0366[20]30002-X).
Support for second chances
Speaking at the press briefing, coauthor Terrie E. Moffitt, PhD, of Duke University, Durham, N.C., said it’s well known that most young criminals are between the ages of 16 and 25.
Breaking the law is not at all rare in this age group, but not all of these young offenders are alike, she noted. Only a few become persistent repeat offenders.
“They start as a young child with aggressive conduct problems and eventually sink into a long-term lifestyle of repetitive serious crime that lasts well into adulthood, but this is a small group,” Dr. Moffitt explained. “In contrast, the larger majority of offenders will have only a short-term brush with lawbreaking and then grow up to become law-abiding members of society.”
The current study suggests that what makes short-term offenders behave differently from long-term offenders might involve some vulnerability at the level of the structure of the brain, Dr. Moffitt said.
The findings stem from 672 individuals in the Dunedin Multidisciplinary Health and Development Study, a population-representative, longitudinal birth cohort that assesses health and behavior.
On the basis of reports from parents, care givers, and teachers, as well as self-reports of conduct problems in persons aged 7-26 years, 80 participants (12%) had “life-course–persistent” antisocial behavior, 151 (23%) had adolescent-only antisocial behavior, and 441 (66%) had “low” antisocial behavior (control group, whose members never had a pervasive or persistent pattern of antisocial behavior).
Brain MRI obtained at age 45 years showed that, among individuals with persistent antisocial behavior, mean surface area was smaller (95% confidence interval, –0.24 to –0.11; P less than .0001) and mean cortical thickness was lower (95% CI, –0.19 to –0.02; P = .020) than was those of their peers in the control group.
For those in the life-course–persistent group, surface area was reduced in 282 of 360 anatomically defined brain parcels, and cortex was thinner in 11 of 360 parcels encompassing frontal and temporal regions (which were associated with executive function, emotion regulation, and motivation), compared with the control group.
Widespread differences in brain surface morphometry were not found in those who exhibited antisocial behavior during adolescence only. Such behavior was likely the result of their having to navigate through socially tough years.
“These findings underscore prior research that really highlights that there are different types of young offenders. They are not all the same; they should not all be treated the same,” coauthor Essi Viding, PhD, who also is affiliated with University College London, told reporters.
The findings support current strategies aimed at giving young offenders “a second chance” as opposed to enforcing harsher policies that prioritize incarceration for all young offenders, Dr. Viding added.
Important contribution
The authors of an accompanying commentary noted that, despite “remarkable progress in the past 3 decades, the etiology of antisocial behavior remains elusive” (Lancet Psychiatry. 2020 Feb 17. doi: 10.1016/S2215-0366[20]30035-3).
This study makes “an important contribution by identifying structural brain correlates of antisocial behavior that could be used to differentiate among individuals with life-course-persistent antisocial behavior, those with adolescence-limited antisocial behavior, and non-antisocial controls,” write Inti A. Brazil, PhD, of the Donders Institute for Brain, Cognition and Behavior, Radboud University, Nijmegen, the Netherlands, and Macià Buades-Rotger, PhD, of the Institute of Psychology II, University of Lübeck, Germany.
They noted that the findings might help to move the field closer to achieving the long-standing goal of incorporating neural data into assessment protocols for antisocial behavior.
The discovery of “meaningful morphologic differences between individuals with life-course–persistent and adolescence-limited antisocial behavior offers an important advance in the use of brain metrics for differentiating among individuals with antisocial dispositions.
“Importantly, however, it remains to be determined whether and how measuring the brain can be used to bridge the different taxometric views and theories on the etiology of antisocial behavior,” Dr. Brazil and Dr. Buades-Rotger concluded.
The study was funded by the U.S. National Institute on Aging; the Health Research Council of New Zealand; the New Zealand Ministry of Business, Innovation and Employment; the U.K. Medical Research Council; the Avielle Foundation; and the Wellcome Trust. The study authors and the authors of the commentary disclosed no relevant financial relationships.
A version of this article first appeared on Medscape.com.
My inspiration
Kobe Bryant knew me. Not personally, of course. I never received an autograph or shook his hand. But once in a while if I was up early enough, I’d run into Kobe at the gym in Newport Beach where he and I both worked out. As he did for all his fans at the gym, he’d make eye contact with me and nod hello. He was always focused on his workout – working with a trainer, never with headphones on. In person, he appeared enormous. Unlike most retired professional athletes, he still was in great shape. No doubt he could have suited up in purple and gold, and played against the Clippers that night if needed.

Being from New England, I never was a Laker fan. But I thought, if Kobe can head to the gym after midnight and take a 1,000 shots to prepare for a game, then I could set my alarm for 4 a.m. and take a few dozen more questions from my First Aid books. Head down, “Kryptonite” cranked on my iPod, I wasn’t going to let anyone in that test room outwork me. Neither did he. I put in the time and, like Kobe in the 2002 conference finals against Sacramento, I crushed it.*
When we moved to California, I followed Kobe and the Lakers until he retired. To be clear, I didn’t aspire to be like him, firstly because I’m slightly shorter than Michael Bloomberg, but also because although accomplished, Kobe made some poor choices at times. Indeed, it seems he might have been kinder and more considerate when he was at the top. But in his retirement he looked to be toiling to make reparations, refocusing his prodigious energy and talent for the benefit of others rather than for just for scoring 81 points. His Rolls Royce was there before mine at the gym, and I was there early. He was still getting up early and now preparing to be a great venture capitalist, podcaster, author, and father to his girls.

Watching him carry kettle bells across the floor one morning, I wondered, do people like Kobe Bryant look to others for inspiration? Or are they are born with an endless supply of it? For me, I seemed to push harder and faster when watching idols pass by. Whether it was Kobe or Clayton Christensen (author of “The Innovator’s Dilemma”), Joe Jorizzo, or Barack Obama, I found I could do just a bit more if I had them in mind.
On game days, Kobe spoke of arriving at the arena early, long before anyone. He would use the silent, solo time to reflect on what he needed to do perform that night. I tried this last week, arriving at our clinic early, before any patients or staff. I turned the lights on and took a few minutes to think about what we needed to accomplish that day. I previewed patients on my schedule, searched Up to Date for the latest recommendations on a difficult case. I didn’t know Kobe, but I felt like I did.
When I received the text that Kobe Bryant had died, I was actually working on this column. So I decided to change the topic to write about people who inspire me, ironically inspired by him again. May he rest in peace.
Dr. Benabio is director of Healthcare Transformation and chief of dermatology at Kaiser Permanente San Diego. The opinions expressed in this column are his own and do not represent those of Kaiser Permanente. Dr. Benabio is @Dermdoc on Twitter. Write to him at dermnews@mdedge.com.
*This article was updated 2/19/2020.
Kobe Bryant knew me. Not personally, of course. I never received an autograph or shook his hand. But once in a while if I was up early enough, I’d run into Kobe at the gym in Newport Beach where he and I both worked out. As he did for all his fans at the gym, he’d make eye contact with me and nod hello. He was always focused on his workout – working with a trainer, never with headphones on. In person, he appeared enormous. Unlike most retired professional athletes, he still was in great shape. No doubt he could have suited up in purple and gold, and played against the Clippers that night if needed.
Being from New England, I never was a Laker fan. But I thought, if Kobe can head to the gym after midnight and take a 1,000 shots to prepare for a game, then I could set my alarm for 4 a.m. and take a few dozen more questions from my First Aid books. Head down, “Kryptonite” cranked on my iPod, I wasn’t going to let anyone in that test room outwork me. Neither did he. I put in the time and, like Kobe in the 2002 conference finals against Sacramento, I crushed it.*
When we moved to California, I followed Kobe and the Lakers until he retired. To be clear, I didn’t aspire to be like him, firstly because I’m slightly shorter than Michael Bloomberg, but also because although accomplished, Kobe made some poor choices at times. Indeed, it seems he might have been kinder and more considerate when he was at the top. But in his retirement he looked to be toiling to make reparations, refocusing his prodigious energy and talent for the benefit of others rather than for just for scoring 81 points. His Rolls Royce was there before mine at the gym, and I was there early. He was still getting up early and now preparing to be a great venture capitalist, podcaster, author, and father to his girls.
Watching him carry kettle bells across the floor one morning, I wondered, do people like Kobe Bryant look to others for inspiration? Or are they are born with an endless supply of it? For me, I seemed to push harder and faster when watching idols pass by. Whether it was Kobe or Clayton Christensen (author of “The Innovator’s Dilemma”), Joe Jorizzo, or Barack Obama, I found I could do just a bit more if I had them in mind.
On game days, Kobe spoke of arriving at the arena early, long before anyone. He would use the silent, solo time to reflect on what he needed to do perform that night. I tried this last week, arriving at our clinic early, before any patients or staff. I turned the lights on and took a few minutes to think about what we needed to accomplish that day. I previewed patients on my schedule, searched Up to Date for the latest recommendations on a difficult case. I didn’t know Kobe, but I felt like I did.
When I received the text that Kobe Bryant had died, I was actually working on this column. So I decided to change the topic to write about people who inspire me, ironically inspired by him again. May he rest in peace.
Dr. Benabio is director of Healthcare Transformation and chief of dermatology at Kaiser Permanente San Diego. The opinions expressed in this column are his own and do not represent those of Kaiser Permanente. Dr. Benabio is @Dermdoc on Twitter. Write to him at dermnews@mdedge.com.
*This article was updated 2/19/2020.
Kobe Bryant knew me. Not personally, of course. I never received an autograph or shook his hand. But once in a while if I was up early enough, I’d run into Kobe at the gym in Newport Beach where he and I both worked out. As he did for all his fans at the gym, he’d make eye contact with me and nod hello. He was always focused on his workout – working with a trainer, never with headphones on. In person, he appeared enormous. Unlike most retired professional athletes, he still was in great shape. No doubt he could have suited up in purple and gold, and played against the Clippers that night if needed.
Being from New England, I never was a Laker fan. But I thought, if Kobe can head to the gym after midnight and take a 1,000 shots to prepare for a game, then I could set my alarm for 4 a.m. and take a few dozen more questions from my First Aid books. Head down, “Kryptonite” cranked on my iPod, I wasn’t going to let anyone in that test room outwork me. Neither did he. I put in the time and, like Kobe in the 2002 conference finals against Sacramento, I crushed it.*
When we moved to California, I followed Kobe and the Lakers until he retired. To be clear, I didn’t aspire to be like him, firstly because I’m slightly shorter than Michael Bloomberg, but also because although accomplished, Kobe made some poor choices at times. Indeed, it seems he might have been kinder and more considerate when he was at the top. But in his retirement he looked to be toiling to make reparations, refocusing his prodigious energy and talent for the benefit of others rather than for just for scoring 81 points. His Rolls Royce was there before mine at the gym, and I was there early. He was still getting up early and now preparing to be a great venture capitalist, podcaster, author, and father to his girls.
Watching him carry kettle bells across the floor one morning, I wondered, do people like Kobe Bryant look to others for inspiration? Or are they are born with an endless supply of it? For me, I seemed to push harder and faster when watching idols pass by. Whether it was Kobe or Clayton Christensen (author of “The Innovator’s Dilemma”), Joe Jorizzo, or Barack Obama, I found I could do just a bit more if I had them in mind.
On game days, Kobe spoke of arriving at the arena early, long before anyone. He would use the silent, solo time to reflect on what he needed to do perform that night. I tried this last week, arriving at our clinic early, before any patients or staff. I turned the lights on and took a few minutes to think about what we needed to accomplish that day. I previewed patients on my schedule, searched Up to Date for the latest recommendations on a difficult case. I didn’t know Kobe, but I felt like I did.
When I received the text that Kobe Bryant had died, I was actually working on this column. So I decided to change the topic to write about people who inspire me, ironically inspired by him again. May he rest in peace.
Dr. Benabio is director of Healthcare Transformation and chief of dermatology at Kaiser Permanente San Diego. The opinions expressed in this column are his own and do not represent those of Kaiser Permanente. Dr. Benabio is @Dermdoc on Twitter. Write to him at dermnews@mdedge.com.
*This article was updated 2/19/2020.

Hyperhidrosis treatment options include glycopyrrolate
LAHAINA, HAWAII – Hyperhidrosis affects nearly 5% of the U.S. population, and in a survey of U.S. teenagers, about 17% reported excessive sweating, Jashin Wu, MD, said at the Hawaii Dermatology Seminar provided by the Global Academy for Medical Education/Skin Disease Education Foundation.
In an interview with MDedge reporter Bruce Jancin, Dr. Wu, founder of the Dermatology Research and Education Foundation, Irvine, Calif., discussed the off-label use of oral agents to treat hyperhidrosis. Dr. Wu said he is a fan of oral glycopyrrolate in particular, which he tends to use even earlier than suggested in the International Hyperhidrosis Society guidelines.
Glycopyrrolate is available in 1 mg and 2 mg tablets; Dr. Wu starts patients at a dose of 1 mg twice a day, escalating by 1 mg per week until the “desired effects occur” or the patient has problems tolerating treatment because of side effects.
Other oral options include oxybutynin and propranolol. Sofpironium bromide, an analog of glycopyrrolate, is in the pipeline, he said.
During the interview, Dr. Wu discussed mydriasis, an adverse effect associated with both topical and systemic anticholinergic treatment. In the two pivotal phase 3 randomized trials of prescription glycopyrronium cloth (Qbrexza) for axillary hyperhidrosis, the incidence of mydriasis was 6.8% in 463 patients on active treatment for 4 weeks. Three-quarters of cases were unilateral. The mydriasis resolved without permanent treatment discontinuation in 27 of the 31 patients (J Am Acad Dermatol. 2019 Jan;80[1]:128-138.e2).
“The most important point is that patients need to be educated that they need to wash their hands very well after they apply it to the affected areas” to prevent accidental medication contact with the eyes, he advised.
Alarm bells can go off when a patient with anticholinergic therapy–induced mydriasis presents to an ED without mentioning their treatment status, Dr. Wu observed.
Dr. Wu had no relevant disclosures. SDEF/Global Academy for Medical Education and this news organization are owned by the same parent company.
To listen to the interview, click the play button below.
LAHAINA, HAWAII – Hyperhidrosis affects nearly 5% of the U.S. population, and in a survey of U.S. teenagers, about 17% reported excessive sweating, Jashin Wu, MD, said at the Hawaii Dermatology Seminar provided by the Global Academy for Medical Education/Skin Disease Education Foundation.
In an interview with MDedge reporter Bruce Jancin, Dr. Wu, founder of the Dermatology Research and Education Foundation, Irvine, Calif., discussed the off-label use of oral agents to treat hyperhidrosis. Dr. Wu said he is a fan of oral glycopyrrolate in particular, which he tends to use even earlier than suggested in the International Hyperhidrosis Society guidelines.
Glycopyrrolate is available in 1 mg and 2 mg tablets; Dr. Wu starts patients at a dose of 1 mg twice a day, escalating by 1 mg per week until the “desired effects occur” or the patient has problems tolerating treatment because of side effects.
Other oral options include oxybutynin and propranolol. Sofpironium bromide, an analog of glycopyrrolate, is in the pipeline, he said.
During the interview, Dr. Wu discussed mydriasis, an adverse effect associated with both topical and systemic anticholinergic treatment. In the two pivotal phase 3 randomized trials of prescription glycopyrronium cloth (Qbrexza) for axillary hyperhidrosis, the incidence of mydriasis was 6.8% in 463 patients on active treatment for 4 weeks. Three-quarters of cases were unilateral. The mydriasis resolved without permanent treatment discontinuation in 27 of the 31 patients (J Am Acad Dermatol. 2019 Jan;80[1]:128-138.e2).
“The most important point is that patients need to be educated that they need to wash their hands very well after they apply it to the affected areas” to prevent accidental medication contact with the eyes, he advised.
Alarm bells can go off when a patient with anticholinergic therapy–induced mydriasis presents to an ED without mentioning their treatment status, Dr. Wu observed.
Dr. Wu had no relevant disclosures. SDEF/Global Academy for Medical Education and this news organization are owned by the same parent company.
To listen to the interview, click the play button below.
LAHAINA, HAWAII – Hyperhidrosis affects nearly 5% of the U.S. population, and in a survey of U.S. teenagers, about 17% reported excessive sweating, Jashin Wu, MD, said at the Hawaii Dermatology Seminar provided by the Global Academy for Medical Education/Skin Disease Education Foundation.
In an interview with MDedge reporter Bruce Jancin, Dr. Wu, founder of the Dermatology Research and Education Foundation, Irvine, Calif., discussed the off-label use of oral agents to treat hyperhidrosis. Dr. Wu said he is a fan of oral glycopyrrolate in particular, which he tends to use even earlier than suggested in the International Hyperhidrosis Society guidelines.
Glycopyrrolate is available in 1 mg and 2 mg tablets; Dr. Wu starts patients at a dose of 1 mg twice a day, escalating by 1 mg per week until the “desired effects occur” or the patient has problems tolerating treatment because of side effects.
Other oral options include oxybutynin and propranolol. Sofpironium bromide, an analog of glycopyrrolate, is in the pipeline, he said.
During the interview, Dr. Wu discussed mydriasis, an adverse effect associated with both topical and systemic anticholinergic treatment. In the two pivotal phase 3 randomized trials of prescription glycopyrronium cloth (Qbrexza) for axillary hyperhidrosis, the incidence of mydriasis was 6.8% in 463 patients on active treatment for 4 weeks. Three-quarters of cases were unilateral. The mydriasis resolved without permanent treatment discontinuation in 27 of the 31 patients (J Am Acad Dermatol. 2019 Jan;80[1]:128-138.e2).
“The most important point is that patients need to be educated that they need to wash their hands very well after they apply it to the affected areas” to prevent accidental medication contact with the eyes, he advised.
Alarm bells can go off when a patient with anticholinergic therapy–induced mydriasis presents to an ED without mentioning their treatment status, Dr. Wu observed.
Dr. Wu had no relevant disclosures. SDEF/Global Academy for Medical Education and this news organization are owned by the same parent company.
To listen to the interview, click the play button below.
REPORTING FROM THE HAWAII DERMATOLOGY SEMINAR