User login
Meta-analysis Shows Link Between Shift Work and Risk for Headache and Migraine
Key clinical point: Shift work was associated with significantly increased risks for headache and migraine, whereas night shifts only increased the risk for headaches.
Major finding: Shift work was significantly associated with an increased risk for headaches (hazard ratio [HR] 1.32; P < .001) and migraine (HR 1.63; P < .001), with the risk for headaches being further elevated in individuals who worked night shifts (HR 1.44; P = .011).
Study details: Findings are from a meta-analysis of seven cross-sectional studies that included 422,869 participants.
Disclosures: This study was supported by the Sichuan Youth Science and Technology Innovation Research Team. The authors declared no conflicts of interest.
Source: Wang Z, Zhu T, Gong M, et al. Relationship between shift work, night work, and headache and migraine risk: A meta-analysis of observational studies. Sleep Med. 2024;115:218-225 (Feb 19). doi: 10.1016/j.sleep.2024.02.011 Source
Studies Reinforce JAK Inhibitor Efficacy for Most Challenging Alopecia Types
FROM AAD 2024
SAN DIEGO — , according to late-breaking data presented at the annual meeting of the American Academy of Dermatology.
In one study of brepocitinib, the target was cicatricial alopecia (CA), a form of hair loss for which there are no approved therapies. In the other, a subanalysis from phase 3 trials of ritlecitinib for alopecia areata (AA), hair regrowth was shown in the subset of patients who entered the study with alopecia totalis or alopecia universalis (AT/AU).
Reflecting comments from several experts, including one of the late-breaking session moderators, April W. Armstrong, MD, MPH, professor and chief of dermatology, University of California, Los Angeles, said that the CA study, which matched clinical response to changes in CA biomarkers, suggested that the results are a potential breakthrough.
“This is the first placebo-controlled study with an oral JAK inhibitor that not only shows that scarring alopecia can be reversible but also gives insights to the mechanism of action and which patients might respond best,” Emma Guttman-Yassky, MD, PhD, said in an interview. Dr. Guttman-Yassky, professor of Dermatology and Immunology, and director of the Laboratory of Inflammatory Skin Diseases, Icahn School of Medicine at Mount Sinai, New York City, was the study’s senior investigator.
Scarring Alopecia and Brepocitinib
For the study of scarring alopecia, 49 patients with CA were randomized in a 3:1 ratio to brepocitinib, a first-in-class inhibitor that targets both JAK1 and TYK2, or placebo. Because of the small size of the study, the primary endpoint was the change in CA biomarkers. The secondary outcome was clinical response, but because of a correlation between the two, these were mutually reinforcing.
Of the subtypes, nine patients enrolled in the study had frontal fibrosing alopecia (FFA), 16 had lichen planopilaris (LPP) alopecia, and 24 had central centrifugal cicatricial alopecia (CCCA). All of the forms of CA are more common in women overall and women of color specifically, particularly CCCA. For this analysis, the FFA and LPP subtypes were considered similar for assessing response and were combined.
The data included a comparison of response and safety during the 24-week randomization phase, as well as an additional follow-up conducted after another 24 weeks of open-label treatment. During the second phase, all patients on placebo were switched to active treatment.
Overall, there was a reduction in all four of the key scalp inflammatory biomarkers measured among those in the combined FFA/LLP group. In the placebo group, each of these markers — interferon gamma (IFN-gamma), CCLS, CXCL10, and STAT1 — increased over the same time period. In almost all cases, the differences were statistically significant.
In the CCCA subgroup, the same pattern (an increase among those on placebo but a decrease among those on brepocitinib) was observed for CCLS and CXCL10. For IFN-gamma and STAT1, a rise was observed among those on placebo and those on active treatment, although the rise was greater for placebo.
For clinical response, improvement on brepocitinib was observed on disease activity indexes, particularly among those in the FFA/LLP group, according to Marguerite Meariman, MD, a dermatology resident at Mount Sinai, who presented the results. She called the improvement in clinical activity scores at 48 weeks “dramatic.” Moreover, improvement was apparent within 4 weeks of starting therapy.
For CCCA, a more challenging condition to treat, Dr. Meariman said that no further progression might represent an acceptable response for many patients, but there were also cases of hair regrowth in this subset. Although improvement was not generally on the order seen among those with FFA/LLP, she suggested that there is promise even in these more difficult patients.
Further studies are planned, but Dr. Meariman said that it might be important to focus on early treatment regardless of CA subtype. She noted that patients with less than 5 years disease duration typically did better than those with longer durations.
Ritlecitinib for AT/AU
The analysis of patients with AT/AU was based on a subset analysis from the ALLEGRO phase 2b/3 study of ritlecitinib, which targets JAK3 and TEC kinases. The full results of the ALLEGRO trial were published last year in The Lancet. In the new late-breaker analysis, Severity of Alopecia Tool (SALT) scores were evaluated on an observed or last-observation-carried-forward basis. Generally, responses in the subgroup of patients with AT/AU, who had a median SALT score of 80.3 (signifying 80.3% hair loss) at baseline, were only modestly lower than those in the overall trial.
At 24 months, about 50% of patients achieved a SALT score of 20, according to Melissa Piliang, MD, chair of Dermatology at the Cleveland Clinic, Cleveland, Ohio, who presented the data. In this group, as in the non-AT/AU population, responses climbed over time, and these responses have been maintained for as long as patients have remained on therapy.
At the more rigorous threshold of SALT < 10, the proportion of responders was only slightly lower, meaning a substantial proportion of patients with AT/AU “are achieving 90% or more of hair regrowth, so really an excellent response,” Dr. Piliang said.
For the subgroup with AU, specifically, regrowth of eyebrows and eyelashes was also observed in a substantial proportion, according to Dr. Piliang. Attributed to the often-devastating psychological burden of hair loss, patient-reported assessments of these responses global were generally “even better” than those reported by the investigators.
However, Dr. Piliang advised clinicians to treat AA as early as possible. Despite the benefits seen in the AT/AU subgroup, she pointed out that starting treatment before total hair loss is associated with a higher likelihood of complete or nearly complete hair regrowth.
There are no data from the ALLEGRO trial to determine how long hair regrowth persists after discontinuation of ritlecitinib, which has been approved for the treatment of AA, but Dr. Piliang said that patients should be told that lifelong therapy should be expected in the vast majority of individuals, whether or not AA has advanced to AT/AU.
“In my experience with JAK inhibitors, you lose response when you come off these drugs,” she said.
Dr. Meariman reported a financial relationship with AbbVie. Dr. Piliang reported financial relationships with Eli Lilly, Pfizer, and Proctor & Gamble. Dr. Armstrong reported financial relationships with more than 30 pharmaceutical companies, including those that manufacture JAK inhibitors. Dr. Guttman-Yassky reported financial relationships with more than 30 companies, including those that manufacture JAK inhibitors.
A version of this article appeared on Medscape.com.
Cognitive Deficits After Most Severe COVID Cases Associated With 9-Point IQ Drop
A new study from the United Kingdom provides greater clarity on how SARS-CoV-2 infection can affect cognition and memory, including novel data on how long brain fog may last after the illness resolves and which cognitive functions are most vulnerable.
In a large community sample, researchers found that on average, people who had recovered from COVID-19 showed small cognitive deficits equivalent to a 3-point loss in IQ for up to 1 year or more after recovering from the acute illness compared with peers who never had COVID-19.
However, people who had more severe cases, requiring treatment in a hospital intensive care unit, had cognitive deficits equivalent to a 9-point drop in IQ.
“People with ongoing persistent symptoms, indicative of long COVID, had larger cognitive deficits than people whose symptoms had resolved,” first author Adam Hampshire, PhD, with Imperial College London, London, England, told this news organization.
The largest deficits among cognitive tasks were in memory, reasoning, and executive function, he added.
“That is, people who had had COVID-19 were both slower and less accurate when performing tasks that measure those abilities,” Dr. Hampshire said. “The group with the largest cognitive deficits were patients who had been in intensive care for COVID-19.”
The study was published online in The New England Journal of Medicine.
Lingering Brain Fog
Cognitive symptoms after SARS-CoV-2 infection are well recognized, but whether objectively measurable cognitive deficits exist and how long they persist remains unclear.
To investigate, researchers invited 800,000 adults from the REACT study of SARS-CoV-2 transmission in England to complete an online assessment for cognitive function with eight domains.
Altogether, 141,583 participants started the cognitive battery by completing at least one task, and 112,964 completed all eight tasks.
The researchers estimated global cognitive scores among participants who had been previously infected with SARS-CoV-2 with symptoms that persisted for at least 12 weeks, whether or not resolved, and among uninfected participants.
Compared with uninfected adults, those who had COVID-19 that resolved had a small cognitive deficit, corresponding to a 3-point loss in IQ, the researchers found.
Adults with unresolved persistent COVID-19 symptoms had the equivalent of a 6-point loss in IQ, and those who had been admitted to the intensive care unit had the equivalent of a 9-point loss in IQ, in line with previous findings of cognitive deficits in patients hospitalized in a critical care unit, the researchers report.
Larger cognitive deficits were evident in adults infected early in the pandemic by the original SARS-CoV-2 virus or the B.1.1.7 variant, whereas peers infected later in the pandemic (eg., in the Omicron period), showed smaller cognitive deficits. This finding is in line with other studies suggesting that the association between COVID-19–associated cognitive deficits attenuated as the pandemic progressed, the researchers noted.
They also found that people who had COVID-19 after receiving two or more vaccinations showed better cognitive performance compared with those who had not been vaccinated.
The memory, reasoning, and executive function tasks were among the most sensitive to COVID-19–related cognitive differences and performance on these tasks differed according to illness duration and hospitalization.
Dr. Hampshire said that more research is needed to determine whether the cognitive deficits resolve with time.
“The implications of longer-term persistence of cognitive deficits and their clinical relevance remain unclear and warrant ongoing surveillance,” he said.
Larger Cognitive Deficits Likely?
These results are “a concern and the broader implications require evaluation,” wrote Ziyad Al-Aly, MD, with Washington University School of Medicine in St. Louis, Missouri, and Clifford Rosen, MD, with Tufts University School of Medicine in Boston, Massachusetts, in an accompanying editorial.
In their view, several outstanding questions remain, including what the potential functional implications of a 3-point loss in IQ may be and whether COVID-19–related cognitive deficits predispose to a higher risk for dementia later in life.
“A deeper understanding of the biology of cognitive dysfunction after SARS-CoV-2 infection and how best to prevent and treat it are critical for addressing the needs of affected persons and preserving the cognitive health of populations,” Drs. Al-Aly and Rosen concluded.
Commenting on the study for this news organization, Jacqueline Becker, PhD, clinical neuropsychologist and assistant professor of medicine, Icahn School of Medicine at Mount Sinai, New York City, noted that “one important caveat” is that the study used an online assessment tool for cognitive function and therefore the findings should be taken with “a grain of salt.”
“That said, this is a large sample, and the findings are generally consistent with what we’ve seen in terms of cognitive deficits post-COVID,” Dr. Becker said.
It’s likely that this study “underestimates” the degree of cognitive deficits that would be seen on validated neuropsychological tests, she added.
In a recent study, Dr. Becker and her colleagues investigated rates of cognitive impairment in 740 COVID-19 patients who recovered and were treated in outpatient, emergency department, or inpatient hospital settings.
Using validated neuropsychological measures, they found a relatively high frequency of cognitive impairment several months after patients contracted COVID-19. Impairments in executive functioning, processing speed, category fluency, memory encoding, and recall were predominant among hospitalized patients.
Dr. Becker noted that in her experience, cognition typically will improve in some patients 12-18 months post COVID.
Support for the study was provided by the National Institute for Health and Care Research and UK Research and Innovation and by the Department of Health and Social Care in England and the Huo Family Foundation. Disclosures for authors and editorial writers are available at NEJM.org. Dr. Becker has no relevant disclosures.
A version of this article appeared on Medscape.com.
Consider These Factors in an Academic Radiation Oncology Position
TOPLINE:
— and accept an offer if the practice is “great” in at least two of those areas and “good” in the third, experts say in a recent editorial.
METHODOLOGY:
- Many physicians choose to go into academic medicine because they want to stay involved in research and education while still treating patients.
- However, graduating radiation oncology residents often lack or have limited guidance on what to look for in a prospective job and how to assess their contract.
- This recent editorial provides guidance to radiation oncologists seeking academic positions. The authors advise prospective employees to evaluate three main factors — compensation, daily duties, and location — as well as provide tips for identifying red flags in each category.
TAKEAWAY:
- Compensation: Prospective faculty should assess both direct compensation, that is, salary, and indirect compensation, which typically includes retirement contributions and other perks. For direct compensation, what is the base salary? Is extra work compensated? How does the salary offer measure up to salary data reported by national agencies? Also: Don’t overlook uncompensated duties, such as time in tumor boards or in meetings, which may be time-consuming, and make sure compensation terms are clearly delineated in a contract and equitable among physicians in a specific rank.
- Daily duties: When it comes to daily life on the job, a prospective employee should consider many factors, including the cancer center’s excitement to hire you, the reputation of the faculty and leaders at the organization, employee turnover rates, diversity among faculty, and the time line of career advancement.
- Location: The location of the job encompasses the geography — such as distance from home to work, the number of practices covered, cost of living, and the area itself — as well as the atmosphere for conducting research and publishing.
- Finally, carefully review the job contract. All the key aspects of the job, including compensation and benefits, should be clearly stated in the contract to “improve communication of expectations.”
IN PRACTICE:
“A prospective faculty member can ask 100 questions, but they can’t make 100 demands; consideration of the three domains can help to focus negotiation efforts where the efforts are needed,” the authors noted.
SOURCE:
This editorial, led by Nicholas G. Zaorsky from the Department of Radiation Oncology, University Hospitals Seidman Cancer Center, Case Western Reserve School of Medicine, Cleveland, Ohio, was published online in Practical Radiation Oncology
DISCLOSURES:
The lead author declared being supported by the American Cancer Society and National Institutes of Health. He also reported having ties with many other sources.
A version of this article appeared on Medscape.com.
Essential Tremor Tied to a Threefold Increased Risk for Dementia
, new research showed.
In a prospective, longitudinal study, incidence of dementia was nearly 20% among older adults with ET. However, the rates were lower than those in adults with Parkinson’s disease.
The study is “the most complete exposition of the longitudinal trajectory of cognitive impairment in an ET cohort,” said the authors, led by Elan D. Louis, MD, MSc, from University of Texas Southwestern Medical Center in Dallas, Texas.
The findings were released ahead of the study’s scheduled presentation at the annual meeting of the American Academy of Neurology.
Mild Cognitive Impairment Prevalence Nearly Double
For the study, 222 adults with ET with an average age of 79 years at baseline underwent detailed cognitive assessments and were followed for an average of 5 years.
At baseline, 168 people had normal cognitive skills, 35 had mild cognitive impairment (MCI), and 19 had dementia. During the follow-up, 59 individuals developed MCI and 41 developed dementia.
During the follow-up, the cumulative prevalence of dementia was 18.5%, and the average annual conversion rate of MCI to dementia was 12.2% — nearly threefold higher than rates in the general population and roughly one-half the magnitude of those reported for adults with Parkinson’s disease.
The cumulative prevalence of MCI (26.6%) was nearly double that of the general population but less than that in patients with Parkinson’s disease.
“Our data indicate that the prevalence of and conversion rates to dementia in ET fall between those associated with the natural course of aging and the more pronounced rates observed in individuals with Parkinson’s disease,” the researchers wrote in their conference abstract.
Far From Trivial
Reached for comment, Shaheen Lakhan, MD, a neurologist and researcher based in Miami, Florida, said, “The days of viewing ET as just a ‘nuisance tremor’ are over. This study shatters the notion that essential tremor is a trivial condition.”
“Moving forward, the research agenda must further elucidate the link between ET and dementia and develop neuroprotective strategies. But this study represents a seismic shift in how we understand essential tremor,” Dr. Lakhan said.
“The benign label no longer applies given the cognitive risks ET patients face. Our clinical practice and communication with patients must adapt accordingly,” he added.
The study was supported by the National Institutes of Health. Drs. Louis and Lakhan had no relevant disclosures.
A version of this article appeared on Medscape.com.
FROM AAN 2024
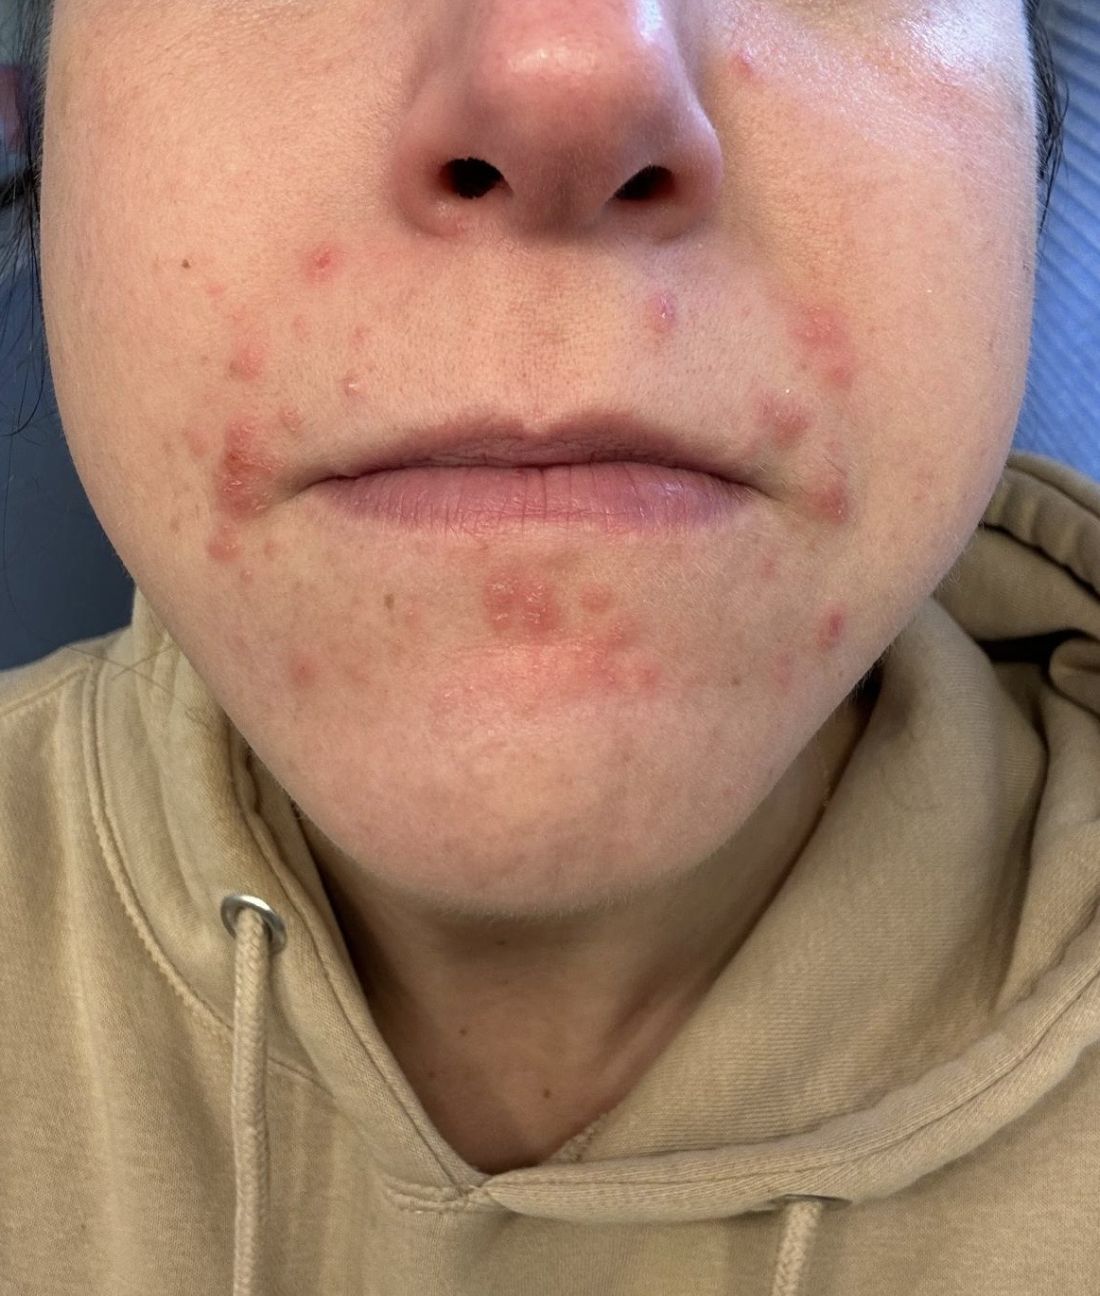
A 35-year-old female presented with a 1-day history of eroded papules and vesicles distributed periorally
.1 While it predominantly affects children, it is important to note that it can also affect adults. Although it is not a life threatening infection, it can cause a painful rash and is highly contagious. The infection is easily spread in multiple ways, including via respiratory droplets, contact with vesicular or nasal secretions, or through fecal-oral transmission. Most cases occur during the summer and fall seasons but individuals can be infected at any time of the year.
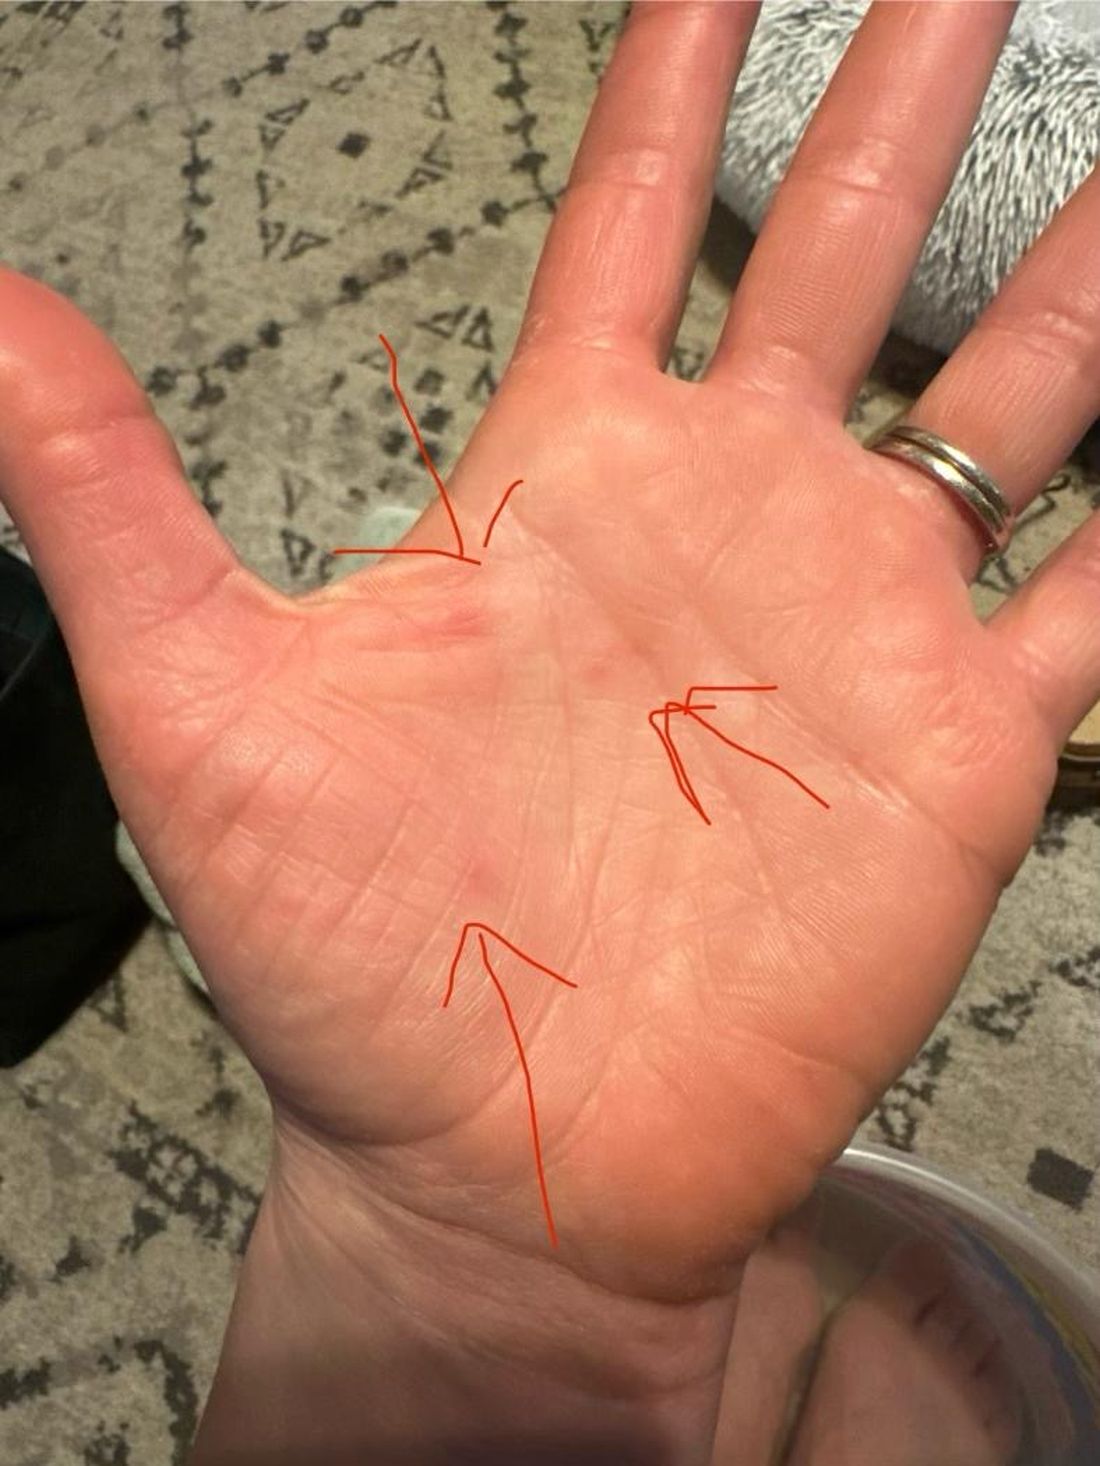
HFMD typically starts with a few days of non-specific viral symptoms, such as fever, cough, sore throat, and fatigue. It is then followed by an eruption of intraoral macules and vesicles and a widespread distribution of oval shaped macules that predominantly involve the hands and feet.1 Both children and adults can present atypically. Atypical presentations include vesicles and bullae on extensor surfaces such as the forearms, as well as eruptions on the face or buttocks.2 Other atypical morphologies include eczema herpeticum-like, Gianotti-Crosti-like, and purpuric/petechiae.3 Atypical hand, food, and mouth disease cases are often caused by coxsackievirus A6, however other strains of coxsackievirus can also cause atypical symptoms.2,3
Our 35-year-old female patient presented with eroded papules and vesicles around the mouth. A diagnosis of atypical HFMD was made clinically in the following days when the patient developed the more classic intraoral and acral macules and vesicles.
Similar to our case, HFMD is most often diagnosed clinically. PCR testing from an active vesicle or nasopharyngeal swab can be obtained. Treatment for HFMD is supportive and symptoms generally resolve over 7-10 days. Over-the-counter analgesics, such as ibuprofen and acetaminophen, as well as oral analgesics that contain lidocaine or diphenhydramine are often helpful3. In this case, our patient improved over the course of seven days without needing therapy.

This case and the photos were submitted by Vanessa Ortega, BS, University of California, San Diego; Brooke Resh Sateesh, MD, and Justin Gordon, MD, San Diego Family Dermatology. The column was edited by Donna Bilu Martin, MD.
Dr. Bilu Martin is a board-certified dermatologist in private practice at Premier Dermatology, MD, in Aventura, Fla. More diagnostic cases are available at mdedge.com/dermatology. To submit a case for possible publication, send an email to dermnews@mdedge.com.
References
1. Centers for Disease Control and Prevention. (2023, June 20). Symptoms of hand, foot, and mouth disease.
2. Drago F et al. J Am Acad Dermatol. 2017 Aug;77(2):e51-6. doi: 10.1016/j.jaad.2017.03.046.
3. Starkey SY et al. Pediatr Dermatol. 2024 Jan-Feb;41(1):23-7. doi: 10.1111/pde.15461.
.1 While it predominantly affects children, it is important to note that it can also affect adults. Although it is not a life threatening infection, it can cause a painful rash and is highly contagious. The infection is easily spread in multiple ways, including via respiratory droplets, contact with vesicular or nasal secretions, or through fecal-oral transmission. Most cases occur during the summer and fall seasons but individuals can be infected at any time of the year.
HFMD typically starts with a few days of non-specific viral symptoms, such as fever, cough, sore throat, and fatigue. It is then followed by an eruption of intraoral macules and vesicles and a widespread distribution of oval shaped macules that predominantly involve the hands and feet.1 Both children and adults can present atypically. Atypical presentations include vesicles and bullae on extensor surfaces such as the forearms, as well as eruptions on the face or buttocks.2 Other atypical morphologies include eczema herpeticum-like, Gianotti-Crosti-like, and purpuric/petechiae.3 Atypical hand, food, and mouth disease cases are often caused by coxsackievirus A6, however other strains of coxsackievirus can also cause atypical symptoms.2,3
Our 35-year-old female patient presented with eroded papules and vesicles around the mouth. A diagnosis of atypical HFMD was made clinically in the following days when the patient developed the more classic intraoral and acral macules and vesicles.
Similar to our case, HFMD is most often diagnosed clinically. PCR testing from an active vesicle or nasopharyngeal swab can be obtained. Treatment for HFMD is supportive and symptoms generally resolve over 7-10 days. Over-the-counter analgesics, such as ibuprofen and acetaminophen, as well as oral analgesics that contain lidocaine or diphenhydramine are often helpful3. In this case, our patient improved over the course of seven days without needing therapy.
This case and the photos were submitted by Vanessa Ortega, BS, University of California, San Diego; Brooke Resh Sateesh, MD, and Justin Gordon, MD, San Diego Family Dermatology. The column was edited by Donna Bilu Martin, MD.
Dr. Bilu Martin is a board-certified dermatologist in private practice at Premier Dermatology, MD, in Aventura, Fla. More diagnostic cases are available at mdedge.com/dermatology. To submit a case for possible publication, send an email to dermnews@mdedge.com.
References
1. Centers for Disease Control and Prevention. (2023, June 20). Symptoms of hand, foot, and mouth disease.
2. Drago F et al. J Am Acad Dermatol. 2017 Aug;77(2):e51-6. doi: 10.1016/j.jaad.2017.03.046.
3. Starkey SY et al. Pediatr Dermatol. 2024 Jan-Feb;41(1):23-7. doi: 10.1111/pde.15461.
Rosemary, Part 2

Used as a spice in various, particularly Mediterranean, cuisines and in traditional medicine for hundreds of years, this aromatic shrub has been the focus of substantial research this century to clarify its roles in skin care. It is used broadly in cosmetic formulations, particularly to preserve the product, and acts as a skin conditioner and fragrance in safe concentrations.1 Rosemary essential oil is also a popular choice frequently used in aromatherapy.2,3 This column focuses on recent promising results supporting the antioxidant and anti-photoaging activities, especially, of rosemary.
UV Protection and Rosemary in Combination
A 2021 study in mice authored by Auh and Madhavan showed that a mixture of marigold and rosemary extracts yielded anti-photoaging effects, with the botanical formula suppressing UV-induced damage.4
Seven years earlier, Pérez-Sánchez et al. combined rosemary and citrus extracts and found that they exerted protective effects against UV damage in human HaCaT keratinocytes as well as human volunteers after oral consumption. Significant increases in minimal erythema dose (MED) were seen in participants, with daily intake of 250 mg of botanical combination, at 8 weeks (34%) and 12 weeks (56%). The investigators attributed the photoprotective effects of the formula to rosemary polyphenols and diterpenes as well as citrus flavonoids.5
Evaluation of a human skin cell model by Sánchez-Marzo et al. in 2020 revealed that rosemary diterpenes were instrumental in an herbal extract that combined citrus, olive, and rosemary in conferring genoprotection against UV-induced DNA damage. The authors note that human trials are needed to overcome the limitations of the cellular model in ascertaining whether the tested herbal formulations can yield oral and/or topical photoprotection.6
Anti-Photoaging and Anti-Pollution
In 2022, Ibrahim et al. assessed a hexane extract of rosemary leaves for anti-photoaging activity. Their evaluation showed an abundance of triterpenoids, monoterpenoids, and phenolic diterpenes in rosemary, with in vitro assays verifying the anti-aging, antioxidant, and wound healing functions of the extract. Further, topical rosemary hexane extract–loaded lipid nanocapsules protected rat skin from UV radiation, as epidermal and dermal histological parameters improved, antioxidant biochemical balance was restored, and inflammatory markers and wrinkling were diminished. The researchers concluded that the use of rosemary hexane extract represents a safe, efficient, and cost-effective way to deliver anti-aging, photoprotective functions to cosmeceutical formulations.7
In March 2021, Nobile et al. published a report on their randomized, double-blind, placebo-controlled parallel group study to investigate the efficacy of a marketed polyphenol-enriched dietary supplement (Zeropollution, which contains four standardized herbal extracts: Olea europaea leaf, Lippia citriodora, S. rosmarinus, and Sophora japonica) in diminishing pollution-induced oxidative stress and in improving skin aging in 100 White and Asian women who were outdoor workers living in a polluted environment (Milan, Italy). Statistically significant improvements in reducing wrinkle depth and hyperpigmentation, enhancing elasticity and firmness, as well as promoting skin moisturization and diminishing transepidermal water loss were noted as early as 2 weeks after product consumption began, with inter-group and intra-group analysis verifying that all skin parameters were ameliorated in Asian and White subjects.8
Previously, Nobile et al. conducted a randomized, parallel-group study on 90 subjects to evaluate the photoprotective effects of a combination of rosemary and grapefruit (Citrus paradisi) extracts (Nutroxsun). The investigators also performed a pilot, randomized crossover study on five participants. Both studies included only females with Fitzpatrick skin phototypes I-III who manifested mild to moderate chronological aging or photoaging. Within as little as 2 weeks, treated individuals exhibited reductions in UVA- and UVB-induced skin changes. Skin elasticity improved in this group, with wrinkles diminishing along with skin redness and lipoperoxides. The investigators concluded that the oral blend of rosemary and grapefruit consumed long term merits consideration as an adjuvant approach to preventing the deleterious effects of solar exposure.9
In 2021, Hoskin et al. used ex vivo human biopsies exposed to diesel engine exhaust to study the impact of spray-dried algae-rosemary particles against pollution-induced damage. The spirulina-rosemary gel that was developed lowered levels of 4-hydroxynonenal protein adducts (4HNE-PA) as well as matrix metalloproteinase-9 (MMP-9) and reduced the loss of filaggrin. The researchers concluded that their topically applied spirulina-rosemary gel was effective in mitigating or preventing skin aging and cutaneous damage caused by diesel air pollution.10
Antioxidant, Antibacterial, and Anti-Inflammatory Activity
Based on a 2023 literature search by Li Pomi et al. of in vitro as well as in vivo animal and human studies involving S. rosmarinus and the skin, researchers reported on substantial evidence buttressing the antioxidant role of the botanical agent. They cautioned that, while data support the harnessing of the bioactive constituents of rosemary to address inflammatory and infectious skin conditions, large controlled trials remain necessary to establish its potential functions in dermatologic clinical practice.11

Ten years earlier, Park et al. determined that a phenolic diterpene from rosemary (carnosic acid) prevented UV-induced expression of MMP-1, MMP-3, and MMP-9 in human skin fibroblasts and keratinocytes in a concentration-dependent manner by suppressing reactive oxygen species and blocking through the inhibition of ROS and the suppression of extracellular signal-regulated kinase (ERK)-mediated AP-1 activation.12
Around the same time, Sienkiewicz et al. showed that rosemary essential oil exhibits antibacterial activity against the standard strain Escherichia coli ATCC 25922 and 60 other clinical strains of the bacteria.13
Further, anti-inflammatory properties have been attributed to rosemary essential oil, which are thought to be due to its suppression of nuclear factor kappa B transcription and inhibition of the arachidonic acid cascade.14
Other Functions of Rosemary
In 2022, Sutkowska-Skolimowska et al. demonstrated that rosemary extract in concentrations of 50 and 100mcg/mL significantly diminished accumulated collagen in the fibroblasts of four patients with severe and fatal osteogenesis imperfecta, suggesting that the botanical agent may have a role targeting cellular stress and inducing autophagy in therapy for this condition.15
In 2015, Akbari et al. established that 0.5% and 1% concentrations of rosemary essential oil were effective in facilitating the percutaneous absorption of diclofenac sodium topical gel.16
Conclusion
In Western culture, rosemary is thought of more as a spice to add flavor to food. However, there appears to be an emerging body of evidence suggesting various possible functions for rosemary in the dermatologic armamentarium. Much more research is necessary, though, to ascertain the most appropriate and optimal roles for this popular herb in skin care.
Dr. Baumann is a private practice dermatologist, researcher, author, and entrepreneur in Miami, Florida. She founded the division of cosmetic dermatology at the University of Miami in 1997. The third edition of her bestselling textbook, “Cosmetic Dermatology,” was published in 2022. Dr. Baumann has received funding for advisory boards and/or clinical research trials from Allergan, Galderma, Johnson & Johnson, and Burt’s Bees. She is the CEO of Skin Type Solutions Inc., a SaaS company used to generate skin care routines in office and as a ecommerce solution. Write to her at dermnews@mdedge.com.
References
1. González-Minero FJ et al. Cosmetics. 2020 Oct 3;7(4):77.
2. Sayorwan W et al. Sci Pharm. 2013 Apr-Jun;81(2):531-42.
3. Pazyar N et al. Skin Pharmacol Physiol. 2014;27(6):303-10.
4. Auh JH and Madhavan J Biomed Pharmacother. 2021 Mar;135:111178.
5. Pérez-Sánchez A et al. J Photochem Photobiol B. 2014 Jul 5;136:12-8.
6. Sánchez-Marzo N et al. Antioxidants (Basel). 2020 Mar 20;9(3):255.
7. Ibrahim N et al. Sci Rep. 2022 Jul 30;12(1):13102.
8. Nobile V et al. Food Nutr Res. 2021 Mar 29:65.
9. Nobile V et al. Food Nutr Res. 2016 Jul 1;60:31871.
10. Hoskin R et al. Molecules. 2021 Jun 22;26(13):3781.
11. Li Pomi F et al. Antioxidants (Basel). 2023 Mar 9;12(3):680.
12. Park M et al. Exp Dermatol. 2013 May;22(5):336-41.
13. Sienkiewicz M et al. Molecules. 2013 Aug 5;18(8):9334-51.
14. Borges RS et al. J Ethnopharmacol. 2019 Jan 30;229:29-45.
15. Sutkowska-Skolimowska. Int J Mol Sci. 2022 Sep 7;23(18):10341.
16. Akbari J et al. Pharm Biol. 2015;53(10):1442-7.
Used as a spice in various, particularly Mediterranean, cuisines and in traditional medicine for hundreds of years, this aromatic shrub has been the focus of substantial research this century to clarify its roles in skin care. It is used broadly in cosmetic formulations, particularly to preserve the product, and acts as a skin conditioner and fragrance in safe concentrations.1 Rosemary essential oil is also a popular choice frequently used in aromatherapy.2,3 This column focuses on recent promising results supporting the antioxidant and anti-photoaging activities, especially, of rosemary.
UV Protection and Rosemary in Combination
A 2021 study in mice authored by Auh and Madhavan showed that a mixture of marigold and rosemary extracts yielded anti-photoaging effects, with the botanical formula suppressing UV-induced damage.4
Seven years earlier, Pérez-Sánchez et al. combined rosemary and citrus extracts and found that they exerted protective effects against UV damage in human HaCaT keratinocytes as well as human volunteers after oral consumption. Significant increases in minimal erythema dose (MED) were seen in participants, with daily intake of 250 mg of botanical combination, at 8 weeks (34%) and 12 weeks (56%). The investigators attributed the photoprotective effects of the formula to rosemary polyphenols and diterpenes as well as citrus flavonoids.5
Evaluation of a human skin cell model by Sánchez-Marzo et al. in 2020 revealed that rosemary diterpenes were instrumental in an herbal extract that combined citrus, olive, and rosemary in conferring genoprotection against UV-induced DNA damage. The authors note that human trials are needed to overcome the limitations of the cellular model in ascertaining whether the tested herbal formulations can yield oral and/or topical photoprotection.6
Anti-Photoaging and Anti-Pollution
In 2022, Ibrahim et al. assessed a hexane extract of rosemary leaves for anti-photoaging activity. Their evaluation showed an abundance of triterpenoids, monoterpenoids, and phenolic diterpenes in rosemary, with in vitro assays verifying the anti-aging, antioxidant, and wound healing functions of the extract. Further, topical rosemary hexane extract–loaded lipid nanocapsules protected rat skin from UV radiation, as epidermal and dermal histological parameters improved, antioxidant biochemical balance was restored, and inflammatory markers and wrinkling were diminished. The researchers concluded that the use of rosemary hexane extract represents a safe, efficient, and cost-effective way to deliver anti-aging, photoprotective functions to cosmeceutical formulations.7
In March 2021, Nobile et al. published a report on their randomized, double-blind, placebo-controlled parallel group study to investigate the efficacy of a marketed polyphenol-enriched dietary supplement (Zeropollution, which contains four standardized herbal extracts: Olea europaea leaf, Lippia citriodora, S. rosmarinus, and Sophora japonica) in diminishing pollution-induced oxidative stress and in improving skin aging in 100 White and Asian women who were outdoor workers living in a polluted environment (Milan, Italy). Statistically significant improvements in reducing wrinkle depth and hyperpigmentation, enhancing elasticity and firmness, as well as promoting skin moisturization and diminishing transepidermal water loss were noted as early as 2 weeks after product consumption began, with inter-group and intra-group analysis verifying that all skin parameters were ameliorated in Asian and White subjects.8
Previously, Nobile et al. conducted a randomized, parallel-group study on 90 subjects to evaluate the photoprotective effects of a combination of rosemary and grapefruit (Citrus paradisi) extracts (Nutroxsun). The investigators also performed a pilot, randomized crossover study on five participants. Both studies included only females with Fitzpatrick skin phototypes I-III who manifested mild to moderate chronological aging or photoaging. Within as little as 2 weeks, treated individuals exhibited reductions in UVA- and UVB-induced skin changes. Skin elasticity improved in this group, with wrinkles diminishing along with skin redness and lipoperoxides. The investigators concluded that the oral blend of rosemary and grapefruit consumed long term merits consideration as an adjuvant approach to preventing the deleterious effects of solar exposure.9
In 2021, Hoskin et al. used ex vivo human biopsies exposed to diesel engine exhaust to study the impact of spray-dried algae-rosemary particles against pollution-induced damage. The spirulina-rosemary gel that was developed lowered levels of 4-hydroxynonenal protein adducts (4HNE-PA) as well as matrix metalloproteinase-9 (MMP-9) and reduced the loss of filaggrin. The researchers concluded that their topically applied spirulina-rosemary gel was effective in mitigating or preventing skin aging and cutaneous damage caused by diesel air pollution.10
Antioxidant, Antibacterial, and Anti-Inflammatory Activity
Based on a 2023 literature search by Li Pomi et al. of in vitro as well as in vivo animal and human studies involving S. rosmarinus and the skin, researchers reported on substantial evidence buttressing the antioxidant role of the botanical agent. They cautioned that, while data support the harnessing of the bioactive constituents of rosemary to address inflammatory and infectious skin conditions, large controlled trials remain necessary to establish its potential functions in dermatologic clinical practice.11
Ten years earlier, Park et al. determined that a phenolic diterpene from rosemary (carnosic acid) prevented UV-induced expression of MMP-1, MMP-3, and MMP-9 in human skin fibroblasts and keratinocytes in a concentration-dependent manner by suppressing reactive oxygen species and blocking through the inhibition of ROS and the suppression of extracellular signal-regulated kinase (ERK)-mediated AP-1 activation.12
Around the same time, Sienkiewicz et al. showed that rosemary essential oil exhibits antibacterial activity against the standard strain Escherichia coli ATCC 25922 and 60 other clinical strains of the bacteria.13
Further, anti-inflammatory properties have been attributed to rosemary essential oil, which are thought to be due to its suppression of nuclear factor kappa B transcription and inhibition of the arachidonic acid cascade.14
Other Functions of Rosemary
In 2022, Sutkowska-Skolimowska et al. demonstrated that rosemary extract in concentrations of 50 and 100mcg/mL significantly diminished accumulated collagen in the fibroblasts of four patients with severe and fatal osteogenesis imperfecta, suggesting that the botanical agent may have a role targeting cellular stress and inducing autophagy in therapy for this condition.15
In 2015, Akbari et al. established that 0.5% and 1% concentrations of rosemary essential oil were effective in facilitating the percutaneous absorption of diclofenac sodium topical gel.16
Conclusion
In Western culture, rosemary is thought of more as a spice to add flavor to food. However, there appears to be an emerging body of evidence suggesting various possible functions for rosemary in the dermatologic armamentarium. Much more research is necessary, though, to ascertain the most appropriate and optimal roles for this popular herb in skin care.
Dr. Baumann is a private practice dermatologist, researcher, author, and entrepreneur in Miami, Florida. She founded the division of cosmetic dermatology at the University of Miami in 1997. The third edition of her bestselling textbook, “Cosmetic Dermatology,” was published in 2022. Dr. Baumann has received funding for advisory boards and/or clinical research trials from Allergan, Galderma, Johnson & Johnson, and Burt’s Bees. She is the CEO of Skin Type Solutions Inc., a SaaS company used to generate skin care routines in office and as a ecommerce solution. Write to her at dermnews@mdedge.com.
References
1. González-Minero FJ et al. Cosmetics. 2020 Oct 3;7(4):77.
2. Sayorwan W et al. Sci Pharm. 2013 Apr-Jun;81(2):531-42.
3. Pazyar N et al. Skin Pharmacol Physiol. 2014;27(6):303-10.
4. Auh JH and Madhavan J Biomed Pharmacother. 2021 Mar;135:111178.
5. Pérez-Sánchez A et al. J Photochem Photobiol B. 2014 Jul 5;136:12-8.
6. Sánchez-Marzo N et al. Antioxidants (Basel). 2020 Mar 20;9(3):255.
7. Ibrahim N et al. Sci Rep. 2022 Jul 30;12(1):13102.
8. Nobile V et al. Food Nutr Res. 2021 Mar 29:65.
9. Nobile V et al. Food Nutr Res. 2016 Jul 1;60:31871.
10. Hoskin R et al. Molecules. 2021 Jun 22;26(13):3781.
11. Li Pomi F et al. Antioxidants (Basel). 2023 Mar 9;12(3):680.
12. Park M et al. Exp Dermatol. 2013 May;22(5):336-41.
13. Sienkiewicz M et al. Molecules. 2013 Aug 5;18(8):9334-51.
14. Borges RS et al. J Ethnopharmacol. 2019 Jan 30;229:29-45.
15. Sutkowska-Skolimowska. Int J Mol Sci. 2022 Sep 7;23(18):10341.
16. Akbari J et al. Pharm Biol. 2015;53(10):1442-7.
Medicare Doc Pay Cut Eased, but When Will Serious Revisions Come?
President Joe Biden on March 9 signed into law a measure that softened — but did not completely eliminate — a 2024 cut in a key rate used to determine how physicians are paid for treating Medicare patients.
While physician groups hailed the move as partial relief, they say they’ll continue to press for broader changes in the Medicare physician fee schedule.
The Medicare provision was tucked into a larger spending package approved by the US House and Senate.
The American Academy of Family Physicians (AAFP), the American Medical Association (AMA), and other groups have lobbied Congress for months to undo a 3.4% cut in the base rate, or conversion factor, in the physician fee schedule for 2024.
The conversion factor is used in calculations to determine reimbursement for myriad other services. Federal Medicare officials said the cut would mean a 1.25% decrease in overall payments in 2024, compared with 2023.
“With the passage of this legislation, Congress has offset 2.93% of that payment cut,” said Steven P. Furr, MD, AAFP’s president in a statement. “We appreciate this temporary measure but continue to urge Congress to advance comprehensive, long-term Medicare payment reform.”
In a statement, Representative Larry Bucshon, MD (R-IN), said the payment cut could not be completely eliminated because of budget constraints.
The Medicare physician fee schedule covers much of the care clinicians provide to people older than 65 and those with disabilities. It covers about 8000 different types of services, ranging from office visits to surgical procedures, imaging, and tests, according to the Medicare Payment Advisory Commission (MedPAC).
Along with physicians, the fee schedule sets payments for nurse practitioners, physician assistants, podiatrists, physical therapists, psychologists, and other clinicians.
In 2021, the Medicare program and its beneficiaries paid $92.8 billion for services provided by almost 1.3 million clinicians, MedPAC said.
Larger Changes Ahead?
Rep. Bucshon is among the physicians serving in the House who are pressing for a permanent revamp of the Medicare physician fee schedule. He cosponsored a bill (HR 2474) that would peg future annual increases in the physician fee schedule to the Medicare Economic Index, which would reflect inflation’s effect.
In April, more than 120 state and national medical groups signed onto an AMA-led letter urging Congress to pass this bill.
The measure is a key priority for the AMA. The organization reached out repeatedly last year to federal officials about it through its own in-house lobbyists, this news organization found through a review of congressional lobbying forms submitted by AMA.
These required disclosure forms reveal how much AMA and other organizations spend each quarter to appeal to members of Congress and federal agencies on specific issues. The disclosure forms do not include a detailed accounting of spending on each issue.
But they do show which issues are priorities for an organization. AMA’s in-house lobbyists reported raising dozens of issues in 2024 within contacts in Congress and federal agencies. These issues included abortion access, maternal health, physician burnout, and potential for bias in clinical use of algorithms, as well as Medicare payment for physicians.
AMA reported spending estimated cost of $20.6 million. (AMA spent $6.7 million in the first quarter, $4.75 million in the second quarter, $3.42 million in the third quarter, and $5.74 million in the fourth quarter.)
In a March 6 statement, Jesse M. Ehrenfeld, MD, MPH, AMA president, urged Congress to turn to more serious consideration of Medicare physician pay beyond short-term tweaks attached to other larger bills.
“As physicians, we are trained to run toward emergencies. We urge Congress to do the same,” Dr. Ehrenfeld said. “We encourage Congress to act if this policy decision is an emergency because — in fact — it is. It is well past time to put an end to stopgap measures that fail to address the underlying causes of the continuing decline in Medicare physician payments.”
There’s bipartisan interest in a revamp of the physician fee schedule amid widespread criticism of the last such overhaul, the Medicare Access and CHIP Reauthorization Act of 2015.
For example, Senate Budget Chairman Sheldon Whitehouse (D-RI) has proposed the creation of a technical advisory committee to improve how Medicare sets the physician fee schedule. The existing fee schedule provides too little money for primary care services and primary care provider pay, contributing to shortages, Sen. Whitehouse said.
Sen. Whitehouse on March 6 held a hearing on ways to beef up US primary care. Among the experts who appeared was Amol Navathe, MD, PhD, of the University of Pennsylvania, Philadelphia, Pennsylvania.
Dr. Navathe said the current Medicare physician fee schedule tilts in favor of procedural services, leading to “underinvestment in cognitive, diagnostic, and supportive services such as primary care.”
In addition, much of what primary care clinicians do, “such as addressing social challenges, is not included in the codes of the fee schedule itself,” said Dr. Navathe, who also serves as the vice chairman of MedPAC.
It’s unclear when Congress will attempt a serious revision to the Medicare physician fee schedule. Lawmakers are unlikely to take on such a major challenge in this election year.
There would be significant opposition and challenges for lawmakers in trying to clear a bill that added an inflation adjustment for what’s already seen as an imperfect physician fee schedule, said Mark E. Miller, PhD, executive vice president of healthcare at the philanthropy Arnold Ventures, which studies how payment decisions affect medical care.
“That bill could cost a lot of money and raise a lot of questions,” Dr. Miller said.
A version of this article appeared on Medscape.com.
Factors Associated with Patient-Reported Treatment Success in PsA
Key clinical point: Improvements in inflammatory arthritis, pain, physical functioning, and the use of tumor necrosis factor (TNF) inhibitors were associated with patient-reported treatment success in patients with psoriatic arthritis (PsA).
Major finding: Increased odds for patient-reported treatment success was seen with TNF inhibitors therapy (odds ratio [OR] 12.86, 95% CI 1.50-110.47), while pain, fatigue, and swollen and tender joint counts reduced the odds of treatment success (OR < 1.00, P < .05). Each point increase in the physical function score was associated with 12%-14% increased odds of treatment success.
Study details: This single-center study included 178 patients with PsA, of which 116 patients reported treatment success.
Disclosures: This study was supported by Celgene; Amgen; Johns Hopkins School of Medicine Biostatistics, Epidemiology and Data Management Core; and others. Two authors declared serving as principal investigators or private consultants for or having other ties with various sources, including Amgen or John Hopkins University. The other authors declared no conflicts of interest.
Source: Samuel C, Finney A, Grader-Beck T, et al. Characteristics associated with patient-reported treatment success in psoriatic arthritis. Rheumatology (Oxford). 2024 (Mar 9). doi: 10.1093/rheumatology/keae149 Source
Cytokine Profiles and Response to TNFα Inhibitor And IL-17A Inhibitor In PsA: Any Link?
Key clinical point: Patients with psoriatic arthritis (PsA) who did or did not respond to treatment with tumor necrosis factor alpha inhibitor (TNFi) and interleukin-17A inhibitor (IL-17Ai) showed different profiles of pro- and anti- inflammatory cytokines.
Major finding: At 4 months of follow up, a significant decrease in IL-6 (P = .032) and an increase in IL-10 (P = .010) was seen in patients achieving ≥ 50% improvement in Disease Activity in PsA (DAPSA50) response with TNFi treatment. IL-17Ai treatment showed decrease in IL-1α and IL-27 levels in DAPSA50 responders and increase in IL-17A in both DAPSA 50 responders and non-responders (all P < .05).
Study details: This study included 68 patients with PsA who were initiated with TNFi (n = 29), IL-17Ai (n = 19), or methotrexate (n = 20) treatment and were followed for 4 months.
Disclosure: This study was supported by Eli Lilly and Co., the Danish Rheumatism Association, and others. Two authors declared receiving research funding, speaker fees, and other ties with various sources, including Eli Lilly and the Danish Rheumatism Association. Two authors declared no conflicts of interest.
Source: Skougaard M, Sondergaard MF, Ditlev SB, Kristensen LE. Changes in inflammatory cytokines in responders and non-responders to TNFα inhibitor and IL-17A inhibitor: A study examining psoriatic arthritis patients. Int J Mol Sci. 2024:25(5);3002 (Mar 5). doi: 10.3390/ijms25053002 Source