User login
Cardiorenal syndrome
To the Editor: I read with interest the thoughtful review of cardiorenal syndrome by Drs. Thind, Loehrke, and Wilt1 and the accompanying editorial by Dr. Grodin.2 These articles certainly add to our growing knowledge of the syndrome and the importance of treating volume overload in these complex patients.
Indeed, we and others have stressed the primary importance of renal dysfunction in patients with volume overload and acute decompensated heart failure.3,4 We have learned that even small rises in serum creatinine predict poor outcomes in these patients. And even if the serum creatinine level comes back down during hospitalization, acute kidney injury (AKI) is still associated with risk.5
Nevertheless, clinicians remain frustrated with the practical management of patients with volume overload and worsening AKI. When faced with a rising serum creatinine level in a patient being treated for decompensated heart failure with signs or symptoms of volume overload, I suggest the following:
Perform careful bedside and chart review searching for evidence of AKI related to causes other than cardiorenal syndrome. Ask whether the rise in serum creatinine could be caused by new obstruction (eg, urinary retention, upper urinary tract obstruction), a nephrotoxin (eg, nonsteroidal anti-inflammatory drugs), a primary tubulointerstitial or glomerular process (eg, drug-induced acute interstitial nephritis, acute glomerulonephritis), acute tubular necrosis, or a new hemodynamic event threatening renal perfusion (eg, hypotension, a new arrhythmia). It is often best to arrive at a diagnosis of AKI due to cardiorenal dysfunction by exclusion, much like the working definitions of hepatorenal syndrome.6 This requires review of the urine sediment (looking for evidence of granular casts of acute tubular necrosis, or evidence of glomerulonephritis or interstitial nephritis), electronic medical record, vital signs, telemetry, and perhaps renal ultrasonography.
In the absence of frank evidence of “overdiuresis” such as worsening hypernatremia, with dropping blood pressure, clinical hypoperfusion, and contraction alkalosis, avoid the temptation to suspend diuretics. Alternatively, an increase in diuretic dose, or addition of a distal diuretic (ie, metolazone) may be needed to address persistent renal venous congestion as the cause of the AKI.3 In this situation, be sure to monitor electrolytes, volume status, and renal function closely while diuretic treatment is augmented. In many such cases, the serum creatinine may actually start to decrease after a more robust diuresis is generated. In these patients, it may also be prudent to temporarily suspend antagonists of the renin-angiotensin-aldosterone system, although this remains controversial.
Management of such patients should be done collaboratively with cardiologists well versed in the treatment of cardiorenal syndrome. It may be possible that the worsening renal function in these patients represents important changes in cardiac rhythm or function (eg, low cardiac output state, new or worsening valvular disease, ongoing myocardial ischemia, cardiac tamponade, uncontrolled bradycardia or tachyarrythmia). Interventions aimed at reversing such perturbations could be the most important steps in improving cardiorenal function and reversing AKI.
- Thind GS, Loehrke M, Wilt JL. Acute cardiorenal syndrome: mechanisms and clinical implications. Cleve Clin J Med 2018; 85(3):231–239. doi:10.3949/ccjm.85a.17019
- Grodin JL. Hemodynamically, the kidney is at the heart of cardiorenal syndrome. Cleve Clin J Med 2018; 85(3):240–242. doi:10.3949/ccjm.85a.17126
- Freda BJ, Slawsky M, Mallidi J, Braden GL. Decongestive treatment of acute decompensated heart failure: cardiorenal implications of ultrafiltration and diuretics. Am J Kid Dis 2011; 58(6):1005–1017. doi:10.1053/j.ajkd.2011.07.023
- Tang WH, Kitai T. Intrarenal blood flow: a window into the congestive kidney failure phenotype of heart failure? JACC Heart Fail 2016; 4(8):683–686. doi:10.1016/j.jchf.2016.05.009
- Freda BJ, Knee AB, Braden GL, Visintainer PF, Thakaer CV. Effect of transient and sustained acute kidney injury on readmissions in acute decompensated heart failure. Am J Cardiol 2017; 119(11):1809–1814. doi:10.1016/j.amjcard.2017.02.044
- Bucsics T, Krones E. Renal dysfunction in cirrhosis: acute kidney injury and the hepatorenal syndrome. Gastroenterol Rep (Oxf) 2017; 5(2):127–137. doi:10.1093/gastro/gox009
To the Editor: I read with interest the thoughtful review of cardiorenal syndrome by Drs. Thind, Loehrke, and Wilt1 and the accompanying editorial by Dr. Grodin.2 These articles certainly add to our growing knowledge of the syndrome and the importance of treating volume overload in these complex patients.
Indeed, we and others have stressed the primary importance of renal dysfunction in patients with volume overload and acute decompensated heart failure.3,4 We have learned that even small rises in serum creatinine predict poor outcomes in these patients. And even if the serum creatinine level comes back down during hospitalization, acute kidney injury (AKI) is still associated with risk.5
Nevertheless, clinicians remain frustrated with the practical management of patients with volume overload and worsening AKI. When faced with a rising serum creatinine level in a patient being treated for decompensated heart failure with signs or symptoms of volume overload, I suggest the following:
Perform careful bedside and chart review searching for evidence of AKI related to causes other than cardiorenal syndrome. Ask whether the rise in serum creatinine could be caused by new obstruction (eg, urinary retention, upper urinary tract obstruction), a nephrotoxin (eg, nonsteroidal anti-inflammatory drugs), a primary tubulointerstitial or glomerular process (eg, drug-induced acute interstitial nephritis, acute glomerulonephritis), acute tubular necrosis, or a new hemodynamic event threatening renal perfusion (eg, hypotension, a new arrhythmia). It is often best to arrive at a diagnosis of AKI due to cardiorenal dysfunction by exclusion, much like the working definitions of hepatorenal syndrome.6 This requires review of the urine sediment (looking for evidence of granular casts of acute tubular necrosis, or evidence of glomerulonephritis or interstitial nephritis), electronic medical record, vital signs, telemetry, and perhaps renal ultrasonography.
In the absence of frank evidence of “overdiuresis” such as worsening hypernatremia, with dropping blood pressure, clinical hypoperfusion, and contraction alkalosis, avoid the temptation to suspend diuretics. Alternatively, an increase in diuretic dose, or addition of a distal diuretic (ie, metolazone) may be needed to address persistent renal venous congestion as the cause of the AKI.3 In this situation, be sure to monitor electrolytes, volume status, and renal function closely while diuretic treatment is augmented. In many such cases, the serum creatinine may actually start to decrease after a more robust diuresis is generated. In these patients, it may also be prudent to temporarily suspend antagonists of the renin-angiotensin-aldosterone system, although this remains controversial.
Management of such patients should be done collaboratively with cardiologists well versed in the treatment of cardiorenal syndrome. It may be possible that the worsening renal function in these patients represents important changes in cardiac rhythm or function (eg, low cardiac output state, new or worsening valvular disease, ongoing myocardial ischemia, cardiac tamponade, uncontrolled bradycardia or tachyarrythmia). Interventions aimed at reversing such perturbations could be the most important steps in improving cardiorenal function and reversing AKI.
- Thind GS, Loehrke M, Wilt JL. Acute cardiorenal syndrome: mechanisms and clinical implications. Cleve Clin J Med 2018; 85(3):231–239. doi:10.3949/ccjm.85a.17019
- Grodin JL. Hemodynamically, the kidney is at the heart of cardiorenal syndrome. Cleve Clin J Med 2018; 85(3):240–242. doi:10.3949/ccjm.85a.17126
- Freda BJ, Slawsky M, Mallidi J, Braden GL. Decongestive treatment of acute decompensated heart failure: cardiorenal implications of ultrafiltration and diuretics. Am J Kid Dis 2011; 58(6):1005–1017. doi:10.1053/j.ajkd.2011.07.023
- Tang WH, Kitai T. Intrarenal blood flow: a window into the congestive kidney failure phenotype of heart failure? JACC Heart Fail 2016; 4(8):683–686. doi:10.1016/j.jchf.2016.05.009
- Freda BJ, Knee AB, Braden GL, Visintainer PF, Thakaer CV. Effect of transient and sustained acute kidney injury on readmissions in acute decompensated heart failure. Am J Cardiol 2017; 119(11):1809–1814. doi:10.1016/j.amjcard.2017.02.044
- Bucsics T, Krones E. Renal dysfunction in cirrhosis: acute kidney injury and the hepatorenal syndrome. Gastroenterol Rep (Oxf) 2017; 5(2):127–137. doi:10.1093/gastro/gox009

In reply: Cardiorenal syndrome
In Reply: We thank Dr. Freda for his remarks and observations. Certainly, the clinical importance of this entity and the challenge it poses to clinicians cannot be overemphasized. We concur with the overall message and reply to his specific comments:
We completely agree that clinical data-gathering is of paramount importance. This includes careful history-taking, physical examination, electronic medical record review, laboratory data review, and imaging. As discussed in our article, renal electrolytes will reveal a prerenal state in acute cardiorenal syndrome, and other causes of prerenal acute kidney injury (AKI) should be ruled out. The role of point-of-care ultrasonography (eg, to measure the size and respirophasic variation of the inferior vena cava) as a vital diagnostic tool has been well described, and we endorse it.1 Moreover, apart from snapshot values, trends are also very important. This is especially pertinent when the patient care is being transferred to a new service (eg, from hospitalist service to the critical care service). In this case, careful review of diuretic dosage, renal function trend, intake and output, and weight trend would help in the diagnosis.
Inadequate diuretic therapy is perhaps one of the most common errors made in the management of patients with acute cardiorenal syndrome. As mentioned in our article, diuretics should be correctly dosed based on the patient’s renal function. It is a common misconception that diuretics are nephrotoxic: in reality, there is no direct renal toxicity from the drug itself. Certainly, overdiuresis may lead to AKI, but this is not a valid concern in patients with acute cardiorenal syndrome, who are fluid-overloaded by definition.
Another challenging clinical scenario is when a patient is diagnosed with acute cardiorenal syndrome but renal function worsens with diuretic therapy. In our experience, this is a paradoxical situation and often stems from misinterpretation of clinical data. The most common example is diuretic underdosage leading to inadequate diuretic response. Renal function will continue to decline in these patients, as renal congestion has not yet been relieved. This reiterates the importance of paying close attention to urine output and intake-output data. When the diuretic regimen is strengthened and a robust diuretic response is achieved, renal function should improve as systemic congestion diminishes.
Acute cardiorenal syndrome stems from hemodynamic derangements, and a multidisciplinary approach may certainly lead to better outcomes. Although we described the general theme of hemodynamic disturbances, patients with acute cardiorenal syndrome may have certain unique and complex hemodynamic “phenotypes” that we did not discuss due to the limited scope of the paper. One such phenotype worth mentioning is decompensated right heart failure, as seen in patients with severe pulmonary hypertension. Acute cardiorenal syndrome due to renal congestion is often seen in these patients, but they also have certain other unique characteristics such as ventricular interdependence.2 Giving intravenous fluids to these patients not only will worsen renal function but can also cause catastrophic reduction in cardiac output and blood pressure due to worsening interventricular septal bowing. Certain treatments (eg, pulmonary vasodilators) are unique to this patient population, and these patients should hence be managed by experienced clinicians.
- Blehar DJ, Dickman E, Gaspari R. Identification of congestive heart failure via respiratory variation of inferior vena cava diameter. Am J Emerg Med 2009; 27(1):71–75. doi:10.1016/j.ajem.2008.01.002
- Piazza G, Goldhaber SZ. The acutely decompensated right ventricle: pathways for diagnosis and management. Chest 2005128(3):1836–1852. doi:10.1378/chest.128.3.1836
In Reply: We thank Dr. Freda for his remarks and observations. Certainly, the clinical importance of this entity and the challenge it poses to clinicians cannot be overemphasized. We concur with the overall message and reply to his specific comments:
We completely agree that clinical data-gathering is of paramount importance. This includes careful history-taking, physical examination, electronic medical record review, laboratory data review, and imaging. As discussed in our article, renal electrolytes will reveal a prerenal state in acute cardiorenal syndrome, and other causes of prerenal acute kidney injury (AKI) should be ruled out. The role of point-of-care ultrasonography (eg, to measure the size and respirophasic variation of the inferior vena cava) as a vital diagnostic tool has been well described, and we endorse it.1 Moreover, apart from snapshot values, trends are also very important. This is especially pertinent when the patient care is being transferred to a new service (eg, from hospitalist service to the critical care service). In this case, careful review of diuretic dosage, renal function trend, intake and output, and weight trend would help in the diagnosis.
Inadequate diuretic therapy is perhaps one of the most common errors made in the management of patients with acute cardiorenal syndrome. As mentioned in our article, diuretics should be correctly dosed based on the patient’s renal function. It is a common misconception that diuretics are nephrotoxic: in reality, there is no direct renal toxicity from the drug itself. Certainly, overdiuresis may lead to AKI, but this is not a valid concern in patients with acute cardiorenal syndrome, who are fluid-overloaded by definition.
Another challenging clinical scenario is when a patient is diagnosed with acute cardiorenal syndrome but renal function worsens with diuretic therapy. In our experience, this is a paradoxical situation and often stems from misinterpretation of clinical data. The most common example is diuretic underdosage leading to inadequate diuretic response. Renal function will continue to decline in these patients, as renal congestion has not yet been relieved. This reiterates the importance of paying close attention to urine output and intake-output data. When the diuretic regimen is strengthened and a robust diuretic response is achieved, renal function should improve as systemic congestion diminishes.
Acute cardiorenal syndrome stems from hemodynamic derangements, and a multidisciplinary approach may certainly lead to better outcomes. Although we described the general theme of hemodynamic disturbances, patients with acute cardiorenal syndrome may have certain unique and complex hemodynamic “phenotypes” that we did not discuss due to the limited scope of the paper. One such phenotype worth mentioning is decompensated right heart failure, as seen in patients with severe pulmonary hypertension. Acute cardiorenal syndrome due to renal congestion is often seen in these patients, but they also have certain other unique characteristics such as ventricular interdependence.2 Giving intravenous fluids to these patients not only will worsen renal function but can also cause catastrophic reduction in cardiac output and blood pressure due to worsening interventricular septal bowing. Certain treatments (eg, pulmonary vasodilators) are unique to this patient population, and these patients should hence be managed by experienced clinicians.
- Blehar DJ, Dickman E, Gaspari R. Identification of congestive heart failure via respiratory variation of inferior vena cava diameter. Am J Emerg Med 2009; 27(1):71–75. doi:10.1016/j.ajem.2008.01.002
- Piazza G, Goldhaber SZ. The acutely decompensated right ventricle: pathways for diagnosis and management. Chest 2005128(3):1836–1852. doi:10.1378/chest.128.3.1836

Patient-Centered, Payer-Centered, or Both? The 30-Day Readmission Metric
There is little doubt that preventing 30-day readmissions to the hospital results in lower costs for payers. However, reducing costs alone does not make this metric a measure of “high value” care.1 Rather, it is the improvement in the effectiveness of the discharge process that occurs alongside lower costs that makes readmission reduction efforts “high value” – or a “win-win” for patients and payers.
However, the article by Nuckols and colleagues in this month’s issue of the Journal of Hospital Medicine (JHM) suggests that it might not be that simple and adds nuance to the ongoing discussion about the 30-day readmission metric.2 The study used data collected by the federal government to examine changes not only in 30-day readmission rates between 2009-2010 and 2013-2014 but also changes in emergency department (ED) and observation unit visits. What they found is important. In general, despite reductions in 30-day readmissions for patients served by Medicare and private insurance, there were increases in observation unit and ED visits across all payer types (including Medicare and private insurance). These increases in observation unit and ED visits resulted in statistically higher overall “revisit” rates for the uninsured and those insured by Medicaid and offset any improvements in the “revisit” rates resulting from reductions in 30-day readmissions for those with private insurance. Those insured by Medicare—representing about 300,000 of the 420,000 visits analyzed—still had a statistically lower “revisit” rate, but it was only marginally lower (25.0% in 2013-2014 versus 25.3% in 2009-2010).2
The generalizability of the Nuckols’ study was limited in that it examined only index admissions for acute myocardial infarction (AMI), heart failure (HF), and pneumonia and used data from only Georgia, Nebraska, South Carolina, and Tennessee—the four states where observation and ED visit data were available in the federal database.2 The study also did not examine hospital-level revisit data; hence, it was not able to determine if hospitals with greater reductions in readmission rates had greater increases in observation or ED visits, as one might predict. Despite these limitations, the rigor of the study was noteworthy. The authors used matching techniques to ensure that the populations examined in the two time periods were comparable. Unlike previous research,3,4 they also used a comprehensive definition of a hospital “revisit” (including both observation and ED visits) and measured “revisit” rates across several payer types, rather than focusing exclusively on those covered by fee for service Medicare, as in past studies.4,5
What the study by Nuckols and colleagues suggests is that even though patients may be readmitted less, they may be coming back to the ED or getting admitted to the observation unit more, resulting in overall “revisit” rates that are marginally lower for Medicare patients, but often the same or even higher for other payer groups, particularly disadvantaged payer groups who are uninsured or insured by Medicaid.2 Although the authors do not assert causality for these trends, it is worth noting that the much-discussed Hospital Readmission Reduction Program (or “readmission penalty”) applies only to Medicare patients aged more than 65 years. It is likely that this program influenced the differences identified between payer groups in this article.
Beyond the policy implications of these findings, the experience of patients cared for in these different settings is of paramount importance. Unfortunately, there are limited data comparing patient perceptions, preferences, or outcomes resulting from readmission to an inpatient service versus an observation unit or ED visit within 30 days of discharge. However, there is reason to believe that costs could be higher for some patients treated in the ED or an observation unit as compared to those in the inpatient setting,6 and that care continuity and quality may be different across these settings. In a recent white paper on observation care published by the Society of Hospital Medicine (SHM) Public Policy Committee,7 the SHM reported the results of a 2017 survey of its members about observation care. The results were concerning. An overwhelming majority of respondents (87%) believed that the rules for observation are unclear for patients, and 68% of respondents believed that policy changes mandating informing patients of their observation status have created conflict between the provider and the patient.7 As shared by one respondent, “the observation issue can severely damage the therapeutic bond with patient/family, who may conclude that the hospitalist has more interest in saving someone money at the expense of patient care.”7 Thus, there is significant concern about the nature of observation stays and the experience for patients and providers. We should take care to better understand these experiences given that readmission reduction efforts may funnel more patients into observation care.
As a next step, we recommend further examination of how “revisit” rates have changed over time for patients with any discharge diagnosis, and not just those with pneumonia, AMI, or HF.8 Such examinations should be stratified by payer to identify differential impacts on those with lower socioeconomic status. Analyses should also examine changes in “revisit” types at the hospital level to better understand if hospitals with reductions in readmission rates are simply shifting revisits to the observation unit or ED. It is possible that inpatient readmissions for any given hospital are decreasing without concomitant increases in observation visits, as there are forces independent of the readmission penalty, such as the Recovery Audit Contractor program, that are driving hospitals to more frequently code patients as observation visits rather than inpatient admissions.9 Thus, readmissions could decrease and observation unit visits could increase independent of one another. We also recommend further research to examine differences in care quality, clinical outcomes, and costs for those readmitted to the hospital within 30 days of discharge versus those cared for in observation units or the ED. The challenge of such studies will be to identify and examine comparable populations of patients across these three settings. Examining patient perceptions and preferences across these settings is also critical. Finally, when assessing interventions to reduce inpatient readmissions, we need to consider “revisits” as a whole, not simply readmissions.10 Otherwise, we may simply be promoting the use of interventions that shift inpatient readmissions to observation unit or ED revisits, and there is little that is patient-centered or high value about that.9
Disclosures
The authors have nothing to disclose.
1. Smith M, Saunders R, Stuckhardt L, McGinnis JM, eds. Best care at lower cost: the path to continuously learning health care in America. Washington, DC: National Academies Press; 2013. PubMed
2. Nuckols TK, Fingar KR, Barrett ML, et al. Returns to emergency department, observation, or inpatient care within 30 days after hospitalization in 4 states, 2009 and 2010 versus 2013 and 2014. J Hosp Med. 2018;13(5):296-303. PubMed
3. Fingar KR, Washington R. Trends in Hospital Readmissions for Four High-Volume Conditions, 2009–2013. Statistical Brief No. 196. https://www.hcup-us.ahrq.gov/reports/statbriefs/sb196-Readmissions-Trends-High-Volume-Conditions.pdf. Accessed March 5, 2018.
4. Zuckerman RB, Sheingold SH, Orav EJ, Ruhter J, Epstein AM. Readmissions, observation, and the Hospital Readmissions Reduction Program. N Engl J Med. 2016;374(16):1543-1551. DOI: 10.1056/NEJMsa1513024. PubMed
5. Gerhardt G, Yemane A, Apostle K, Oelschlaeger A, Rollins E, Brennan N. Evaluating whether changes in utilization of hospital outpatient services contributed to lower Medicare readmission rate. Medicare Medicaid Res Rev. 2014;4(1). DOI: 10.5600/mmrr2014-004-01-b03 PubMed
6. Kangovi S, Cafardi SG, Smith RA, Kulkarni R, Grande D. Patient financial responsibility for observation care. J Hosp Med. 2015;10(11):718-723. DOI: 10.1002/jhm.2436. PubMed
7. The Hospital Observation Care Problem: Perspectives and Solutions from the Society of Hospital Medicine. Society of Hospital Medicine Public Policy Committee. https://www.hospitalmedicine.org/globalassets/policy-and-advocacy/advocacy-pdf/shms-observation-white-paper-2017. Accessed February 12, 2018.
8. Rosen AK, Chen Q, Shwartz M, et al. Does use of a hospital-wide readmission measure versus condition-specific readmission measures make a difference for hospital profiling and payment penalties? Medical Care. 2016;54(2):155-161. DOI: 10.1097/MLR.0000000000000455. PubMed
9. Baugh CW, Schuur JD. Observation care-high-value care or a cost-shifting loophole? N Engl J Med. 2013;369(4):302-305. DOI: 10.1056/NEJMp1304493. PubMed
10. Cassel CK, Conway PH, Delbanco SF, Jha AK, Saunders RS, Lee TH. Getting more performance from performance measurement. N Engl J Med. 2014;371(23):2145-2147. DOI: 10.1056/NEJMp1408345. PubMed
There is little doubt that preventing 30-day readmissions to the hospital results in lower costs for payers. However, reducing costs alone does not make this metric a measure of “high value” care.1 Rather, it is the improvement in the effectiveness of the discharge process that occurs alongside lower costs that makes readmission reduction efforts “high value” – or a “win-win” for patients and payers.
However, the article by Nuckols and colleagues in this month’s issue of the Journal of Hospital Medicine (JHM) suggests that it might not be that simple and adds nuance to the ongoing discussion about the 30-day readmission metric.2 The study used data collected by the federal government to examine changes not only in 30-day readmission rates between 2009-2010 and 2013-2014 but also changes in emergency department (ED) and observation unit visits. What they found is important. In general, despite reductions in 30-day readmissions for patients served by Medicare and private insurance, there were increases in observation unit and ED visits across all payer types (including Medicare and private insurance). These increases in observation unit and ED visits resulted in statistically higher overall “revisit” rates for the uninsured and those insured by Medicaid and offset any improvements in the “revisit” rates resulting from reductions in 30-day readmissions for those with private insurance. Those insured by Medicare—representing about 300,000 of the 420,000 visits analyzed—still had a statistically lower “revisit” rate, but it was only marginally lower (25.0% in 2013-2014 versus 25.3% in 2009-2010).2
The generalizability of the Nuckols’ study was limited in that it examined only index admissions for acute myocardial infarction (AMI), heart failure (HF), and pneumonia and used data from only Georgia, Nebraska, South Carolina, and Tennessee—the four states where observation and ED visit data were available in the federal database.2 The study also did not examine hospital-level revisit data; hence, it was not able to determine if hospitals with greater reductions in readmission rates had greater increases in observation or ED visits, as one might predict. Despite these limitations, the rigor of the study was noteworthy. The authors used matching techniques to ensure that the populations examined in the two time periods were comparable. Unlike previous research,3,4 they also used a comprehensive definition of a hospital “revisit” (including both observation and ED visits) and measured “revisit” rates across several payer types, rather than focusing exclusively on those covered by fee for service Medicare, as in past studies.4,5
What the study by Nuckols and colleagues suggests is that even though patients may be readmitted less, they may be coming back to the ED or getting admitted to the observation unit more, resulting in overall “revisit” rates that are marginally lower for Medicare patients, but often the same or even higher for other payer groups, particularly disadvantaged payer groups who are uninsured or insured by Medicaid.2 Although the authors do not assert causality for these trends, it is worth noting that the much-discussed Hospital Readmission Reduction Program (or “readmission penalty”) applies only to Medicare patients aged more than 65 years. It is likely that this program influenced the differences identified between payer groups in this article.
Beyond the policy implications of these findings, the experience of patients cared for in these different settings is of paramount importance. Unfortunately, there are limited data comparing patient perceptions, preferences, or outcomes resulting from readmission to an inpatient service versus an observation unit or ED visit within 30 days of discharge. However, there is reason to believe that costs could be higher for some patients treated in the ED or an observation unit as compared to those in the inpatient setting,6 and that care continuity and quality may be different across these settings. In a recent white paper on observation care published by the Society of Hospital Medicine (SHM) Public Policy Committee,7 the SHM reported the results of a 2017 survey of its members about observation care. The results were concerning. An overwhelming majority of respondents (87%) believed that the rules for observation are unclear for patients, and 68% of respondents believed that policy changes mandating informing patients of their observation status have created conflict between the provider and the patient.7 As shared by one respondent, “the observation issue can severely damage the therapeutic bond with patient/family, who may conclude that the hospitalist has more interest in saving someone money at the expense of patient care.”7 Thus, there is significant concern about the nature of observation stays and the experience for patients and providers. We should take care to better understand these experiences given that readmission reduction efforts may funnel more patients into observation care.
As a next step, we recommend further examination of how “revisit” rates have changed over time for patients with any discharge diagnosis, and not just those with pneumonia, AMI, or HF.8 Such examinations should be stratified by payer to identify differential impacts on those with lower socioeconomic status. Analyses should also examine changes in “revisit” types at the hospital level to better understand if hospitals with reductions in readmission rates are simply shifting revisits to the observation unit or ED. It is possible that inpatient readmissions for any given hospital are decreasing without concomitant increases in observation visits, as there are forces independent of the readmission penalty, such as the Recovery Audit Contractor program, that are driving hospitals to more frequently code patients as observation visits rather than inpatient admissions.9 Thus, readmissions could decrease and observation unit visits could increase independent of one another. We also recommend further research to examine differences in care quality, clinical outcomes, and costs for those readmitted to the hospital within 30 days of discharge versus those cared for in observation units or the ED. The challenge of such studies will be to identify and examine comparable populations of patients across these three settings. Examining patient perceptions and preferences across these settings is also critical. Finally, when assessing interventions to reduce inpatient readmissions, we need to consider “revisits” as a whole, not simply readmissions.10 Otherwise, we may simply be promoting the use of interventions that shift inpatient readmissions to observation unit or ED revisits, and there is little that is patient-centered or high value about that.9
Disclosures
The authors have nothing to disclose.
1. Smith M, Saunders R, Stuckhardt L, McGinnis JM, eds. Best care at lower cost: the path to continuously learning health care in America. Washington, DC: National Academies Press; 2013. PubMed
2. Nuckols TK, Fingar KR, Barrett ML, et al. Returns to emergency department, observation, or inpatient care within 30 days after hospitalization in 4 states, 2009 and 2010 versus 2013 and 2014. J Hosp Med. 2018;13(5):296-303. PubMed
3. Fingar KR, Washington R. Trends in Hospital Readmissions for Four High-Volume Conditions, 2009–2013. Statistical Brief No. 196. https://www.hcup-us.ahrq.gov/reports/statbriefs/sb196-Readmissions-Trends-High-Volume-Conditions.pdf. Accessed March 5, 2018.
4. Zuckerman RB, Sheingold SH, Orav EJ, Ruhter J, Epstein AM. Readmissions, observation, and the Hospital Readmissions Reduction Program. N Engl J Med. 2016;374(16):1543-1551. DOI: 10.1056/NEJMsa1513024. PubMed
5. Gerhardt G, Yemane A, Apostle K, Oelschlaeger A, Rollins E, Brennan N. Evaluating whether changes in utilization of hospital outpatient services contributed to lower Medicare readmission rate. Medicare Medicaid Res Rev. 2014;4(1). DOI: 10.5600/mmrr2014-004-01-b03 PubMed
6. Kangovi S, Cafardi SG, Smith RA, Kulkarni R, Grande D. Patient financial responsibility for observation care. J Hosp Med. 2015;10(11):718-723. DOI: 10.1002/jhm.2436. PubMed
7. The Hospital Observation Care Problem: Perspectives and Solutions from the Society of Hospital Medicine. Society of Hospital Medicine Public Policy Committee. https://www.hospitalmedicine.org/globalassets/policy-and-advocacy/advocacy-pdf/shms-observation-white-paper-2017. Accessed February 12, 2018.
8. Rosen AK, Chen Q, Shwartz M, et al. Does use of a hospital-wide readmission measure versus condition-specific readmission measures make a difference for hospital profiling and payment penalties? Medical Care. 2016;54(2):155-161. DOI: 10.1097/MLR.0000000000000455. PubMed
9. Baugh CW, Schuur JD. Observation care-high-value care or a cost-shifting loophole? N Engl J Med. 2013;369(4):302-305. DOI: 10.1056/NEJMp1304493. PubMed
10. Cassel CK, Conway PH, Delbanco SF, Jha AK, Saunders RS, Lee TH. Getting more performance from performance measurement. N Engl J Med. 2014;371(23):2145-2147. DOI: 10.1056/NEJMp1408345. PubMed
© 2018 Society of Hospital Medicine
Improving Teamwork and Patient Outcomes with Daily Structured Interdisciplinary Bedside Rounds: A Multimethod Evaluation
Evidence has emerged over the last decade of the importance of the front line patient care team in improving quality and safety of patient care.1-3 Improving collaboration and workflow is thought to increase reliability of care delivery.1 One promising method to improve collaboration is the interdisciplinary ward round (IDR), whereby medical, nursing, and allied health staff attend ward rounds together. IDRs have been shown to reduce the average cost and length of hospital stay,4,5 although a recent systematic review found inconsistent improvements across studies.6 Using the term “interdisciplinary,” however, does not necessarily imply the inclusion of all disciplines necessary for patient care. The challenge of conducting interdisciplinary rounds is considerable in today’s busy clinical environment: health professionals who are spread across multiple locations within the hospital, and who have competing hospital responsibilities and priorities, must come together at the same time and for a set period each day. A survey with respondents from Australia, the United States, and Canada found that only 65% of rounds labelled “interdisciplinary” included a physician.7
While IDRs are not new, structured IDRs involve the purposeful inclusion of all disciplinary groups relevant to a patient’s care, alongside a checklist tool to aid comprehensive but concise daily assessment of progress and treatment planning. Novel, structured IDR interventions have been tested recently in various settings, resulting in improved teamwork, hospital performance, and patient outcomes in the US, including the Structured Interdisciplinary Bedside Round (SIBR) model.8-12
The aim of this study was to assess the impact of the new structure and the associated practice changes on interprofessional working and a set of key patient and hospital outcome measures. As part of the intervention, the hospital established an Acute Medical Unit (AMU) based on the Accountable Care Unit model.13
METHODS
Description of the Intervention
The AMU brought together 2 existing medical wards, a general medical ward and a 48-hour turnaround Medical Assessment Unit (MAU), into 1 geographical location with 26 beds. Prior to the merger, the MAU and general medical ward had separate and distinct cultures and workflows. The MAU was staffed with experienced nurses; nurses worked within a patient allocation model, the workload was shared, and relationships were collegial. In contrast, the medical ward was more typical of the remainder of the hospital: nurses had a heavy workload, managed a large group of longer-term complex patients, and they used a team-based nursing model of care in which senior nurses supervised junior staff. It was decided that because of the seniority of the MAU staff, they should be in charge of the combined AMU, and the patient allocation model of care would be used to facilitate SIBR.
Consultants, junior doctors, nurses, and allied health professionals (including a pharmacist, physiotherapist, occupational therapist, and social worker) were geographically aligned to the new ward, allowing them to participate as a team in daily structured ward rounds. Rounds are scheduled at the same time each day to enable family participation. The ward round is coordinated by a registrar or intern, with input from patient, family, nursing staff, pharmacy, allied health, and other doctors (intern, registrar, and consultant) based on the unit. The patient load is distributed between 2 rounds: 1 scheduled for 10
Data Collection Strategy
The study was set in an AMU in a large tertiary care hospital in regional Australia and used a convergent parallel multimethod approach14 to evaluate the implementation and effect of SIBR in the AMU. The study population consisted of 32 clinicians employed at the study hospital: (1) the leadership team involved in the development and implementation of the intervention and (2) members of clinical staff who were part of the AMU team.
Qualitative Data
Qualitative measures consisted of semistructured interviews. We utilized multiple strategies to recruit interviewees, including a snowball technique, criterion sampling,15 and emergent sampling, so that we could seek the views of both the leadership team responsible for the implementation and “frontline” clinical staff whose daily work was directly affected by it. Everyone who was initially recruited agreed to be interviewed, and additional frontline staff asked to be interviewed once they realized that we were asking about how staff experienced the changes in practice.
The research team developed a semistructured interview guide based on an understanding of the merger of the 2 units as well as an understanding of changes in practice of the rounds (provided in Appendix 1). The questions were pilot tested on a separate unit and revised. Questions were structured into 5 topic areas: planning and implementation of AMU/SIBR model, changes in work practices because of the new model, team functioning, job satisfaction, and perceived impact of the new model on patients and families. All interviews were audio-recorded and transcribed verbatim for analysis.
Quantitative Data
Quantitative data were collected on patient outcome measures: length of stay (LOS), discharge date and time, mode of separation (including death), primary diagnostic category, total hospital stay cost and “clinical response calls,” and patient demographic data (age, gender, and Patient Clinical Complexity Level [PCCL]). The PCCL is a standard measure used in Australian public inpatient facilities and is calculated for each episode of care.16 It measures the cumulative effect of a patient’s complications and/or comorbidities and takes an integer value between 0 (no clinical complexity effect) and 4 (catastrophic clinical complexity effect).
Data regarding LOS, diagnosis (Australian Refined Diagnosis Related Groups [AR-DRG], version 7), discharge date, and mode of separation (including death) were obtained from the New South Wales Ministry of Health’s Health Information Exchange for patients discharged during the year prior to the intervention through 1 year after the implementation of the intervention. The total hospital stay cost for these individuals was obtained from the local Health Service Organizational Performance Management unit. Inclusion criteria were inpatients aged over 15 years experiencing acute episodes of care; patients with a primary diagnostic category of mental diseases and disorders were excluded. LOS was calculated based on ward stay. AMU data were compared with the remaining hospital ward data (the control group). Data on “clinical response calls” per month per ward were also obtained for the 12 months prior to intervention and the 12 months of the intervention.
Analysis
Qualitative Analysis
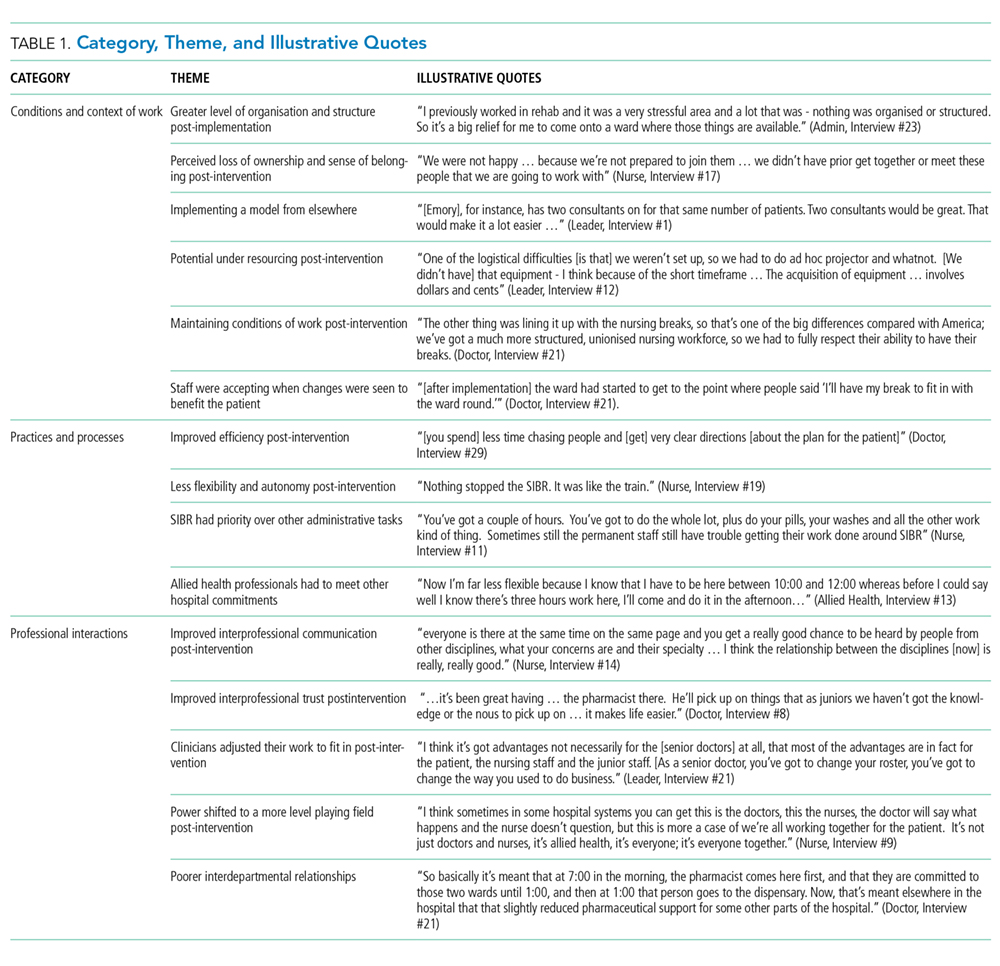
Qualitative data analysis consisted of a hybrid form of textual analysis, combining inductive and deductive logics.17,18 Initially, 3 researchers (J.P., J.J., and R.C.W.) independently coded the interview data inductively to identify themes. Discrepancies were resolved through discussion until consensus was reached. Then, to further facilitate analysis, the researchers deductively imposed a matrix categorization, consisting of 4 a priori categories: context/conditions, practices/processes, professional interactions, and consequences.19,20 Additional a priori categories were used to sort the themes further in terms of experiences prior to, during, and following implementation of the intervention. To compare changes in those different time periods, we wanted to know what themes were related to implementation and whether those themes continued to be applicable to sustainability of the changes.
Quantitative analysis. Distribution of continuous data was examined by using the one-sample Kolmogorov-Smirnov test. We compared pre-SIBR (baseline) measures using the Student t test for normally distributed data, the Mann-Whitney U z test for nonparametric data (denoted as M-W U z), and χ2 tests for categorical data. Changes in monthly “clinical response calls” between the AMU and the control wards over time were explored by using analysis of variance (ANOVA). Changes in LOS and cost of stay from the year prior to the intervention to the first year of the intervention were analyzed by using generalized linear models, which are a form of linear regression. Factors, or independent variables, included in the models were time period (before or during intervention), ward (AMU or control), an interaction term (time by ward), patient age, gender, primary diagnosis (major diagnostic categories of the AR-DRG version 7.0), and acuity (PCCL). The estimated marginal means for cost of stay for the 12-month period prior to the intervention and for the first 12 months of the intervention were produced. All statistical analyses were performed by using IBM SPSS version 21 (IBM Corp., Armonk, New York) and with alpha set at P < .05.
RESULTS
Qualitative Evaluation of the Intervention
Participants.
Three researchers (RCW, JP, and JJ) conducted in-person, semistructured interviews with 32 clinicians (9 male, 23 female) during a 3-day period. The duration of the interviews ranged from 19 minutes to 68 minutes. Participants consisted of 8 doctors, 18 nurses, 5 allied health professionals, and an administrator. Ten of the participants were involved in the leadership group that drove the planning and implementation of SIBR and the AMU.
Themes
Context and Conditions of Work
Practices and Processes
Participants perceived postintervention work processes to be more efficient. A primary example was a near-universal approval of the time saved from not “chasing” other professionals now that they were predictably available on the ward. More timely decision-making was thought to result from this predicted availability and associated improvements in communication.
The SIBR enforced a workflow on all staff, who felt there was less flexibility to work autonomously (doctors) or according to patients’ needs (nurses). More junior staff expressed anxiety about delayed completion of discharge-related administrative tasks because of the midday completion of the round. Allied health professionals who had commitments in other areas of the hospital often faced a dilemma about how to prioritize SIBR attendance and activities on other wards. This was managed differently depending on the specific allied health profession and the individuals within that profession.
Professional Interactions
In terms of interprofessional dynamics on the AMU, the implementation of SIBR resulted in a shift in power between the doctors and the nurses. In the old ward, doctors largely controlled the timing of medical rounding processes. In the new AMU, doctors had to relinquish some control over the timing of personal workflow to comply with the requirements of SIBR. Furthermore, there was evidence that this had some impact on traditional hierarchical models of communication and created a more level playing field, as nonmedical professionals felt more empowered to voice their thoughts during and outside of rounds.
The rounds provided much greater visibility of the “big picture” and each profession’s role within it; this allowed each clinician to adjust their work to fit in and take account of others. The process was not instantaneous, and trust developed over a period of weeks. Better communication meant fewer misunderstandings, and workload dropped.
The participation of allied health professionals in the round enhanced clinician interprofessional skills and knowledge. The more inclusive approach facilitated greater trust between clinical disciplines and a development of increased confidence among nursing, allied health, and administrative professionals.
In contrast to the positive impacts of the new model of care on communication and relationships within the AMU, interdepartmental relationships were seen to have suffered. The processes and practices of the new AMU are different to those in the other hospital departments, resulting in some isolation of the unit and difficulties interacting with other areas of the hospital. For example, the trade-offs that allied health professionals made to participate in SIBR often came at the expense of other units or departments.
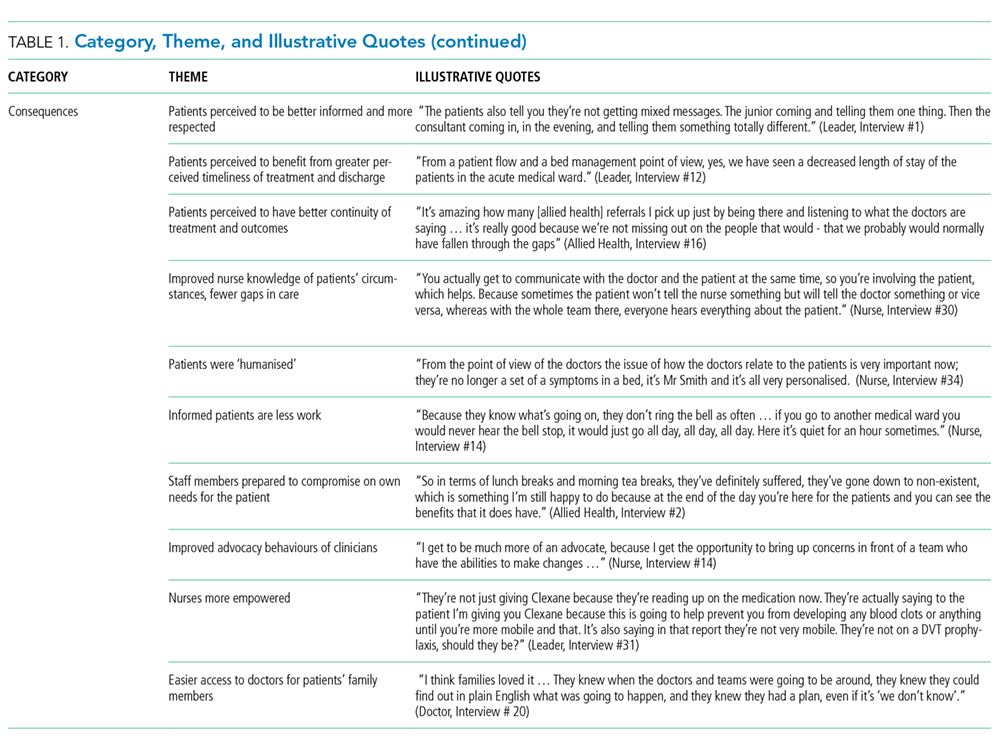
Consequences
All interviewees lauded the benefits of the SIBR intervention for patients. Patients were perceived to be better informed and more respected, and they benefited from greater perceived timeliness of treatment and discharge, easier access to doctors, better continuity of treatment and outcomes, improved nurse knowledge of their circumstances, and fewer gaps in their care. Clinicians spoke directly to the patient during SIBR, rather than consulting with professional colleagues over the patient’s head. Some staff felt that doctors were now thinking of patients as “people” rather than “a set of symptoms.” Nurses discovered that informed patients are easier to manage.
Staff members were prepared to compromise on their own needs in the interests of the patient. The emphasis on the patient during rounds resulted in improved advocacy behaviors of clinicians. The nurses became more empowered and able to show greater initiative. Families appeared to find it much easier to access the doctors and obtain information about the patient, resulting in less distress and a greater sense of control and trust in the process.
Quantitative Evaluation of the Intervention
Hospital Outcomes
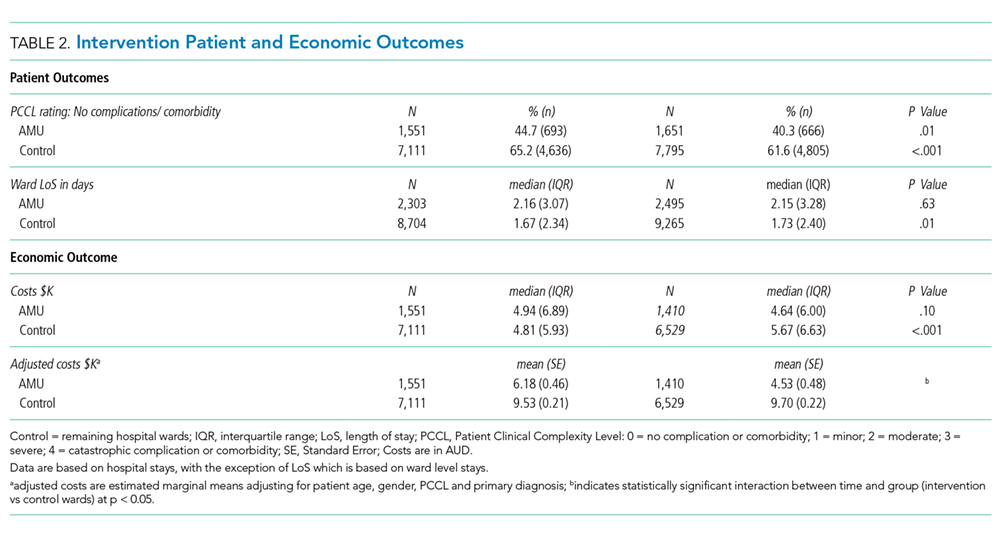
Patient demographics did not change over time within either the AMU or control wards. However, there were significant increases in Patient Clinical Complexity Level (PCCL) ratings for both the AMU (44.7% to 40.3%; P<0.05) and the control wards (65.2% to 61.6%; P < .001). There was not a statistically significant shift over time in median LoS on the ward prior to (2.16 days, IQR 3.07) and during SIBR in the AMU (2.15 days; IQR 3.28), while LoS increased in the control (pre-SIBR: 1.67, 2.34; during SIBR 1.73, 2.40; M-W U z = -2.46, P = .014). Mortality rates were stable across time for both the AMU (pre-SIBR 2.6% [95% confidence interval {CI}, 1.9-3.5]; during SIBR 2.8% [95% CI, 2.1-3.7]) and the control (pre-SIBR 1.3% [95% CI, 1.0-1.5]; during SIBR 1.2% [95% CI, 1.0-1.4]).
The total number of “clinical response calls” or “flags” per month dropped significantly from pre-SIBR to during SIBR for the AMU from a mean of 63.1 (standard deviation 15.1) to 31.5 (10.8), but remained relatively stable in the control (pre-SIBR 72.5 [17.6]; during SIBR 74.0 [28.3]), and this difference was statistically significant (F (1,44) = 9.03; P = .004). There was no change in monthly “red flags” or “rapid response calls” over time (AMU: 10.5 [3.6] to 9.1 [4.7]; control: 40.3 [11.7] to 41.8 [10.8]). The change in total “clinical response calls” over time was attributable to the “yellow flags” or the decline in “calls for clinical review” in the AMU (from 52.6 [13.5] to 22.4 [9.2]). The average monthly “yellow flags” remained stable in the control (pre-SIBR 32.2 [11.6]; during SIBR 32.3 [22.4]). The AMU and the control wards differed significantly in how the number of monthly “calls for clinical review” changed from pre-SIBR to during SIBR (F (1,44) = 12.18; P = .001).
The 2 main outcome measures, LOS and costs, were analyzed to determine whether changes over time differed between the AMU and the control wards after accounting for age, gender, and PCCL. There was no statistically significant difference between the AMU and control wards in terms of change in LOS over time (Wald χ2 = 1.05; degrees of freedom [df] = 1; P = .31). There was a statistically significant interaction for cost of stay, indicating that ward types differed in how they changed over time (with a drop in cost over time observed in the AMU and an increase observed in the control) (Wald χ2 = 6.34; df = 1; P = .012.
DISCUSSION
We report on the implementation of an AMU model of care, including the reorganization of a nursing unit, implementation of IDR, and geographical localization. Our study design allowed a more comprehensive assessment of the implementation of system redesign to include provider perceptions and clinical outcomes.
The 2 very different cultures of the old wards that were combined into the AMU, as well as the fact that the teams had not previously worked together, made the merger of the 2 wards difficult. Historically, the 2 teams had worked in very different ways, and this created barriers to implementation. The SIBR also demanded new ways of working closely with other disciplines, which disrupted older clinical cultures and relationships. While organizational culture is often discussed, and even measured, the full impact of cultural factors when making workplace changes is frequently underestimated.21 The development of a new culture takes time, and it can lag organizational structural changes by months or even years.22 As our interviewees expressed, often emotionally, there was a sense of loss during the merger of the 2 units. While this is a potential consequence of any large organizational change, it could be addressed during the planning stages, prior to implementation, by acknowledging and perhaps honoring what is being left behind. It is safe to assume that future units implementing the rounding intervention will not fully realize commensurate levels of culture change until well after the structural and process changes are finalized, and only then if explicit effort is made to engender cultural change.
Overall, however, the interviewees perceived that the SIBR intervention led to improved teamwork and team functioning. These improvements were thought to benefit task performance and patient safety. Our study is consistent with other research in the literature that reported that greater staff empowerment and commitment is associated with interdisciplinary patient care interventions in front line caregiving teams.23,24 The perception of a more equal nurse-physician relationship resulted in improved job satisfaction, better interprofessional relationships, and perceived improvements in patient care. A flatter power gradient across professions and increased interdisciplinary teamwork has been shown to be associated with improved patient outcomes.25,26
Changes to clinician workflow can significantly impact the introduction of new models of care. A mandated time each day for structured rounds meant less flexibility in workflow for clinicians and made greater demands on their time management and communication skills. Furthermore, the need for human resource negotiations with nurse representatives was an unexpected component of successfully introducing the changes to workflow. Once the benefits of saved time and better communication became evident, changes to workflow were generally accepted. These challenges can be managed if stakeholders are engaged and supportive of the changes.13
Finally, our findings emphasize the importance of combining qualitative and quantitative data when evaluating an intervention. In this case, the qualitative outcomes that include “intangible” positive effects, such as cultural change and improved staff understanding of one another’s roles, might encourage us to continue with the SIBR intervention, which would allow more time to see if the trend of reduced LOS identified in the statistical analysis would translate to a significant effect over time.
We are unable to identify which aspects of the intervention led to the greatest impact on our outcomes. A recent study found that interdisciplinary rounds had no impact on patients’ perceptions of shared decision-making or care satisfaction.27 Although our findings indicated many potential benefits for patients, we were not able to interview patients or their carers to confirm these findings. In addition, we do not have any patient-centered outcomes, which would be important to consider in future work. Although our data on clinical response calls might be seen as a proxy for adverse events, we do not have data on adverse events or errors, and these are important to consider in future work. Finally, our findings are based on data from a single institution.
CONCLUSIONS
While there were some criticisms, participants expressed overwhelmingly positive reactions to the SIBR. The biggest reported benefit was perceived improved communication and understanding between and within the clinical professions, and between clinicians and patients. Improved communication was perceived to have fostered improved teamwork and team functioning, with most respondents feeling that they were a valued part of the new team. Improved teamwork was thought to contribute to improved task performance and led interviewees to perceive a higher level of patient safety. This research highlights the need for multimethod evaluations that address contextual factors as well as clinical outcomes.
Acknowledgments
The authors would like to acknowledge the clinicians and staff members who participated in this study. We would also like to acknowledge the support from the NSW Clinical Excellence Commission, in particular, Dr. Peter Kennedy, Mr. Wilson Yeung, Ms. Tracy Clarke, and Mr. Allan Zhang, and also from Ms. Karen Storey and Mr. Steve Shea of the Organisational Performance Management team at the Orange Health Service.
Disclosures
None of the authors had conflicts of interest in relation to the conduct or reporting of this study, with the exception that the lead author’s institution, the Australian Institute of Health Innovation, received a small grant from the New South Wales Clinical Excellence Commission to conduct the work. Ethics approval for the research was granted by the Greater Western Area Health Service Human Research Ethics Committee (HREC/13/GWAHS/22). All interviewees consented to participate in the study. For patient data, consent was not obtained, but presented data are anonymized. The full dataset is available from the corresponding author with restrictions. This research was funded by the NSW Clinical Excellence Commission, who also encouraged submission of the article for publication. The funding source did not have any role in conduct or reporting of the study. R.C.W., J.P., and J.J. conceptualized and conducted the qualitative component of the study, including method, data collection, data analysis, and writing of the manuscript. G.L., C.H., and H.D. conceptualized the quantitative component of the study, including method, data collection, data analysis, and writing of the manuscript. G.S. contributed to conceptualization of the study, and significantly contributed to the revision of the manuscript. All authors, external and internal, had full access to all of the data (including statistical reports and tables) in the study and can take responsibility for the integrity of the data and the accuracy of the data analysis. As the lead author, R.C.W. affirms that the manuscript is an honest, accurate, and transparent account of the study being reported, that no important aspects of the study have been omitted, and that any discrepancies from the study as planned have been explained.
1. Johnson JK, Batalden PB. Educating health professionals to improve care within the clinical microsystem. McLaughlin and Kaluzny’s Continuous Quality Improvement In Health Care. Burlington: Jones & Bartlett Learning; 2013.
2. Mohr JJ, Batalden P, Barach PB. Integrating patient safety into the clinical microsystem. Qual Saf Health Care. 2004;13:ii34-ii38. PubMed
3. Sanchez JA, Barach PR. High reliability organizations and surgical microsystems: re-engineering surgical care. Surg Clin North Am. 2012;92:1-14. PubMed
4. Curley C, McEachern JE, Speroff T. A firm trial of interdisciplinary rounds on the inpatient medical wards: an intervention designed using continuous quality improvement. Med Care. 1998;36:AS4-AS12. PubMed
5. O’Mahony S, Mazur E, Charney P, Wang Y, Fine J. Use of multidisciplinary rounds to simultaneously improve quality outcomes, enhance resident education, and shorten length of stay. J Gen Intern Med. 2007;22:1073-1079. PubMed
6. Pannick S, Beveridge I, Wachter RM, Sevdalis N. Improving the quality and safety of care on the medical ward: a review and synthesis of the evidence base. Eur J Intern Med. 2014;25:874-887. PubMed
7. Halm MA, Gagner S, Goering M, Sabo J, Smith M, Zaccagnini M. Interdisciplinary rounds: impact on patients, families, and staff. Clin Nurse Spec. 2003;17:133-142. PubMed
8. Stein J, Murphy D, Payne C, et al. A remedy for fragmented hospital care. Harvard Business Review. 2013.
9. O’Leary KJ, Buck R, Fligiel HM, et al. Structured interdisciplinary rounds in a medical teaching unit: improving patient safety. Arch Intern Med. 2010;171:678-684. PubMed
10. O’Leary KJ, Haviley C, Slade ME, Shah HM, Lee J, Williams MV. Improving teamwork: impact of structured interdisciplinary rounds on a hospitalist unit. J Hosp Med. 2011;6:88-93. PubMed
11. O’Leary KJ, Ritter CD, Wheeler H, Szekendi MK, Brinton TS, Williams MV. Teamwork on inpatient medical units: assessing attitudes and barriers. Qual Saf Health Care. 2011;19:117-121. PubMed
12. O’Leary KJ, Creden AJ, Slade ME, et al. Implementation of unit-based interventions to improve teamwork and patient safety on a medical service. Am J Med Qual. 2014;30:409-416. PubMed
13. Stein J, Payne C, Methvin A, et al. Reorganizing a hospital ward as an accountable care unit. J Hosp Med. 2015;10:36-40. PubMed
14. Creswell JW. Research Design: Qualitative, Quantitative, and Mixed Methods Approaches. Thousand Oaks: SAGE Publications; 2013.
15. Palinkas LA, Horwitz SM, Green CA, Wisdom JP, Duan N, Hoagwood K. Purposeful sampling for qualitative data collection and analysis in mixed method implementation research. Adm Pol Ment Health. 2015;42:533-544. PubMed
16. Australian Consortium for Classification Development (ACCD). Review of the AR-DRG classification Case Complexity Process: Final Report; 2014.
http://ihpa.gov.au/internet/ihpa/publishing.nsf/Content/admitted-acute. Accessed September 21, 2015.
17. Lofland J, Lofland LH. Analyzing Social Settings. Belmont: Wadsworth Publishing Company; 2006.
18. Miles MB, Huberman AM, Saldaña J. Qualitative Data Analysis: A Methods Sourcebook. Los Angeles: SAGE Publications; 2014.
19. Corbin J, Strauss A. Basics of Qualitative Research: Techniques and Procedures for Developing Grounded Theory. Thousand Oaks: SAGE Publications; 2008.
20. Corbin JM, Strauss A. Grounded theory research: procedures, canons, and evaluative criteria. Qual Sociol. 1990;13:3-21.
21. O’Leary KJ, Johnson JK, Auerbach AD. Do interdisciplinary rounds improve patient outcomes? only if they improve teamwork. J Hosp Med. 2016;11:524-525. PubMed
22. Clay-Williams R. Restructuring and the resilient organisation: implications for health care. In: Hollnagel E, Braithwaite J, Wears R, editors. Resilient health care. Surrey: Ashgate Publishing Limited; 2013.
23. Williams I, Dickinson H, Robinson S, Allen C. Clinical microsystems and the NHS: a sustainable method for improvement? J Health Organ and Manag. 2009;23:119-132. PubMed
24. Nelson EC, Godfrey MM, Batalden PB, et al. Clinical microsystems, part 1. The building blocks of health systems. Jt Comm J Qual Patient Saf. 2008;34:367-378. PubMed
25. Chisholm-Burns MA, Lee JK, Spivey CA, et al. US pharmacists’ effect as team members on patient care: systematic review and meta-analyses. Med Care. 2010;48:923-933. PubMed
26. Zwarenstein M, Goldman J, Reeves S. Interprofessional collaboration: effects of practice-based interventions on professional practice and healthcare outcomes. Cochrane Database Syst Rev. 2009;3:CD000072. PubMed
27. O’Leary KJ, Killarney A, Hansen LO, et al. Effect of patient-centred bedside rounds on hospitalised patients’ decision control, activation and satisfaction with care. BMJ Qual Saf. 2015;25:921-928. PubMed
Evidence has emerged over the last decade of the importance of the front line patient care team in improving quality and safety of patient care.1-3 Improving collaboration and workflow is thought to increase reliability of care delivery.1 One promising method to improve collaboration is the interdisciplinary ward round (IDR), whereby medical, nursing, and allied health staff attend ward rounds together. IDRs have been shown to reduce the average cost and length of hospital stay,4,5 although a recent systematic review found inconsistent improvements across studies.6 Using the term “interdisciplinary,” however, does not necessarily imply the inclusion of all disciplines necessary for patient care. The challenge of conducting interdisciplinary rounds is considerable in today’s busy clinical environment: health professionals who are spread across multiple locations within the hospital, and who have competing hospital responsibilities and priorities, must come together at the same time and for a set period each day. A survey with respondents from Australia, the United States, and Canada found that only 65% of rounds labelled “interdisciplinary” included a physician.7
While IDRs are not new, structured IDRs involve the purposeful inclusion of all disciplinary groups relevant to a patient’s care, alongside a checklist tool to aid comprehensive but concise daily assessment of progress and treatment planning. Novel, structured IDR interventions have been tested recently in various settings, resulting in improved teamwork, hospital performance, and patient outcomes in the US, including the Structured Interdisciplinary Bedside Round (SIBR) model.8-12
The aim of this study was to assess the impact of the new structure and the associated practice changes on interprofessional working and a set of key patient and hospital outcome measures. As part of the intervention, the hospital established an Acute Medical Unit (AMU) based on the Accountable Care Unit model.13
METHODS
Description of the Intervention
The AMU brought together 2 existing medical wards, a general medical ward and a 48-hour turnaround Medical Assessment Unit (MAU), into 1 geographical location with 26 beds. Prior to the merger, the MAU and general medical ward had separate and distinct cultures and workflows. The MAU was staffed with experienced nurses; nurses worked within a patient allocation model, the workload was shared, and relationships were collegial. In contrast, the medical ward was more typical of the remainder of the hospital: nurses had a heavy workload, managed a large group of longer-term complex patients, and they used a team-based nursing model of care in which senior nurses supervised junior staff. It was decided that because of the seniority of the MAU staff, they should be in charge of the combined AMU, and the patient allocation model of care would be used to facilitate SIBR.
Consultants, junior doctors, nurses, and allied health professionals (including a pharmacist, physiotherapist, occupational therapist, and social worker) were geographically aligned to the new ward, allowing them to participate as a team in daily structured ward rounds. Rounds are scheduled at the same time each day to enable family participation. The ward round is coordinated by a registrar or intern, with input from patient, family, nursing staff, pharmacy, allied health, and other doctors (intern, registrar, and consultant) based on the unit. The patient load is distributed between 2 rounds: 1 scheduled for 10
Data Collection Strategy
The study was set in an AMU in a large tertiary care hospital in regional Australia and used a convergent parallel multimethod approach14 to evaluate the implementation and effect of SIBR in the AMU. The study population consisted of 32 clinicians employed at the study hospital: (1) the leadership team involved in the development and implementation of the intervention and (2) members of clinical staff who were part of the AMU team.
Qualitative Data
Qualitative measures consisted of semistructured interviews. We utilized multiple strategies to recruit interviewees, including a snowball technique, criterion sampling,15 and emergent sampling, so that we could seek the views of both the leadership team responsible for the implementation and “frontline” clinical staff whose daily work was directly affected by it. Everyone who was initially recruited agreed to be interviewed, and additional frontline staff asked to be interviewed once they realized that we were asking about how staff experienced the changes in practice.
The research team developed a semistructured interview guide based on an understanding of the merger of the 2 units as well as an understanding of changes in practice of the rounds (provided in Appendix 1). The questions were pilot tested on a separate unit and revised. Questions were structured into 5 topic areas: planning and implementation of AMU/SIBR model, changes in work practices because of the new model, team functioning, job satisfaction, and perceived impact of the new model on patients and families. All interviews were audio-recorded and transcribed verbatim for analysis.
Quantitative Data
Quantitative data were collected on patient outcome measures: length of stay (LOS), discharge date and time, mode of separation (including death), primary diagnostic category, total hospital stay cost and “clinical response calls,” and patient demographic data (age, gender, and Patient Clinical Complexity Level [PCCL]). The PCCL is a standard measure used in Australian public inpatient facilities and is calculated for each episode of care.16 It measures the cumulative effect of a patient’s complications and/or comorbidities and takes an integer value between 0 (no clinical complexity effect) and 4 (catastrophic clinical complexity effect).
Data regarding LOS, diagnosis (Australian Refined Diagnosis Related Groups [AR-DRG], version 7), discharge date, and mode of separation (including death) were obtained from the New South Wales Ministry of Health’s Health Information Exchange for patients discharged during the year prior to the intervention through 1 year after the implementation of the intervention. The total hospital stay cost for these individuals was obtained from the local Health Service Organizational Performance Management unit. Inclusion criteria were inpatients aged over 15 years experiencing acute episodes of care; patients with a primary diagnostic category of mental diseases and disorders were excluded. LOS was calculated based on ward stay. AMU data were compared with the remaining hospital ward data (the control group). Data on “clinical response calls” per month per ward were also obtained for the 12 months prior to intervention and the 12 months of the intervention.
Analysis
Qualitative Analysis
Qualitative data analysis consisted of a hybrid form of textual analysis, combining inductive and deductive logics.17,18 Initially, 3 researchers (J.P., J.J., and R.C.W.) independently coded the interview data inductively to identify themes. Discrepancies were resolved through discussion until consensus was reached. Then, to further facilitate analysis, the researchers deductively imposed a matrix categorization, consisting of 4 a priori categories: context/conditions, practices/processes, professional interactions, and consequences.19,20 Additional a priori categories were used to sort the themes further in terms of experiences prior to, during, and following implementation of the intervention. To compare changes in those different time periods, we wanted to know what themes were related to implementation and whether those themes continued to be applicable to sustainability of the changes.
Quantitative analysis. Distribution of continuous data was examined by using the one-sample Kolmogorov-Smirnov test. We compared pre-SIBR (baseline) measures using the Student t test for normally distributed data, the Mann-Whitney U z test for nonparametric data (denoted as M-W U z), and χ2 tests for categorical data. Changes in monthly “clinical response calls” between the AMU and the control wards over time were explored by using analysis of variance (ANOVA). Changes in LOS and cost of stay from the year prior to the intervention to the first year of the intervention were analyzed by using generalized linear models, which are a form of linear regression. Factors, or independent variables, included in the models were time period (before or during intervention), ward (AMU or control), an interaction term (time by ward), patient age, gender, primary diagnosis (major diagnostic categories of the AR-DRG version 7.0), and acuity (PCCL). The estimated marginal means for cost of stay for the 12-month period prior to the intervention and for the first 12 months of the intervention were produced. All statistical analyses were performed by using IBM SPSS version 21 (IBM Corp., Armonk, New York) and with alpha set at P < .05.
RESULTS
Qualitative Evaluation of the Intervention
Participants.
Three researchers (RCW, JP, and JJ) conducted in-person, semistructured interviews with 32 clinicians (9 male, 23 female) during a 3-day period. The duration of the interviews ranged from 19 minutes to 68 minutes. Participants consisted of 8 doctors, 18 nurses, 5 allied health professionals, and an administrator. Ten of the participants were involved in the leadership group that drove the planning and implementation of SIBR and the AMU.
Themes
Context and Conditions of Work
Practices and Processes
Participants perceived postintervention work processes to be more efficient. A primary example was a near-universal approval of the time saved from not “chasing” other professionals now that they were predictably available on the ward. More timely decision-making was thought to result from this predicted availability and associated improvements in communication.
The SIBR enforced a workflow on all staff, who felt there was less flexibility to work autonomously (doctors) or according to patients’ needs (nurses). More junior staff expressed anxiety about delayed completion of discharge-related administrative tasks because of the midday completion of the round. Allied health professionals who had commitments in other areas of the hospital often faced a dilemma about how to prioritize SIBR attendance and activities on other wards. This was managed differently depending on the specific allied health profession and the individuals within that profession.
Professional Interactions
In terms of interprofessional dynamics on the AMU, the implementation of SIBR resulted in a shift in power between the doctors and the nurses. In the old ward, doctors largely controlled the timing of medical rounding processes. In the new AMU, doctors had to relinquish some control over the timing of personal workflow to comply with the requirements of SIBR. Furthermore, there was evidence that this had some impact on traditional hierarchical models of communication and created a more level playing field, as nonmedical professionals felt more empowered to voice their thoughts during and outside of rounds.
The rounds provided much greater visibility of the “big picture” and each profession’s role within it; this allowed each clinician to adjust their work to fit in and take account of others. The process was not instantaneous, and trust developed over a period of weeks. Better communication meant fewer misunderstandings, and workload dropped.
The participation of allied health professionals in the round enhanced clinician interprofessional skills and knowledge. The more inclusive approach facilitated greater trust between clinical disciplines and a development of increased confidence among nursing, allied health, and administrative professionals.
In contrast to the positive impacts of the new model of care on communication and relationships within the AMU, interdepartmental relationships were seen to have suffered. The processes and practices of the new AMU are different to those in the other hospital departments, resulting in some isolation of the unit and difficulties interacting with other areas of the hospital. For example, the trade-offs that allied health professionals made to participate in SIBR often came at the expense of other units or departments.
Consequences
All interviewees lauded the benefits of the SIBR intervention for patients. Patients were perceived to be better informed and more respected, and they benefited from greater perceived timeliness of treatment and discharge, easier access to doctors, better continuity of treatment and outcomes, improved nurse knowledge of their circumstances, and fewer gaps in their care. Clinicians spoke directly to the patient during SIBR, rather than consulting with professional colleagues over the patient’s head. Some staff felt that doctors were now thinking of patients as “people” rather than “a set of symptoms.” Nurses discovered that informed patients are easier to manage.
Staff members were prepared to compromise on their own needs in the interests of the patient. The emphasis on the patient during rounds resulted in improved advocacy behaviors of clinicians. The nurses became more empowered and able to show greater initiative. Families appeared to find it much easier to access the doctors and obtain information about the patient, resulting in less distress and a greater sense of control and trust in the process.
Quantitative Evaluation of the Intervention
Hospital Outcomes
Patient demographics did not change over time within either the AMU or control wards. However, there were significant increases in Patient Clinical Complexity Level (PCCL) ratings for both the AMU (44.7% to 40.3%; P<0.05) and the control wards (65.2% to 61.6%; P < .001). There was not a statistically significant shift over time in median LoS on the ward prior to (2.16 days, IQR 3.07) and during SIBR in the AMU (2.15 days; IQR 3.28), while LoS increased in the control (pre-SIBR: 1.67, 2.34; during SIBR 1.73, 2.40; M-W U z = -2.46, P = .014). Mortality rates were stable across time for both the AMU (pre-SIBR 2.6% [95% confidence interval {CI}, 1.9-3.5]; during SIBR 2.8% [95% CI, 2.1-3.7]) and the control (pre-SIBR 1.3% [95% CI, 1.0-1.5]; during SIBR 1.2% [95% CI, 1.0-1.4]).
The total number of “clinical response calls” or “flags” per month dropped significantly from pre-SIBR to during SIBR for the AMU from a mean of 63.1 (standard deviation 15.1) to 31.5 (10.8), but remained relatively stable in the control (pre-SIBR 72.5 [17.6]; during SIBR 74.0 [28.3]), and this difference was statistically significant (F (1,44) = 9.03; P = .004). There was no change in monthly “red flags” or “rapid response calls” over time (AMU: 10.5 [3.6] to 9.1 [4.7]; control: 40.3 [11.7] to 41.8 [10.8]). The change in total “clinical response calls” over time was attributable to the “yellow flags” or the decline in “calls for clinical review” in the AMU (from 52.6 [13.5] to 22.4 [9.2]). The average monthly “yellow flags” remained stable in the control (pre-SIBR 32.2 [11.6]; during SIBR 32.3 [22.4]). The AMU and the control wards differed significantly in how the number of monthly “calls for clinical review” changed from pre-SIBR to during SIBR (F (1,44) = 12.18; P = .001).
The 2 main outcome measures, LOS and costs, were analyzed to determine whether changes over time differed between the AMU and the control wards after accounting for age, gender, and PCCL. There was no statistically significant difference between the AMU and control wards in terms of change in LOS over time (Wald χ2 = 1.05; degrees of freedom [df] = 1; P = .31). There was a statistically significant interaction for cost of stay, indicating that ward types differed in how they changed over time (with a drop in cost over time observed in the AMU and an increase observed in the control) (Wald χ2 = 6.34; df = 1; P = .012.
DISCUSSION
We report on the implementation of an AMU model of care, including the reorganization of a nursing unit, implementation of IDR, and geographical localization. Our study design allowed a more comprehensive assessment of the implementation of system redesign to include provider perceptions and clinical outcomes.
The 2 very different cultures of the old wards that were combined into the AMU, as well as the fact that the teams had not previously worked together, made the merger of the 2 wards difficult. Historically, the 2 teams had worked in very different ways, and this created barriers to implementation. The SIBR also demanded new ways of working closely with other disciplines, which disrupted older clinical cultures and relationships. While organizational culture is often discussed, and even measured, the full impact of cultural factors when making workplace changes is frequently underestimated.21 The development of a new culture takes time, and it can lag organizational structural changes by months or even years.22 As our interviewees expressed, often emotionally, there was a sense of loss during the merger of the 2 units. While this is a potential consequence of any large organizational change, it could be addressed during the planning stages, prior to implementation, by acknowledging and perhaps honoring what is being left behind. It is safe to assume that future units implementing the rounding intervention will not fully realize commensurate levels of culture change until well after the structural and process changes are finalized, and only then if explicit effort is made to engender cultural change.
Overall, however, the interviewees perceived that the SIBR intervention led to improved teamwork and team functioning. These improvements were thought to benefit task performance and patient safety. Our study is consistent with other research in the literature that reported that greater staff empowerment and commitment is associated with interdisciplinary patient care interventions in front line caregiving teams.23,24 The perception of a more equal nurse-physician relationship resulted in improved job satisfaction, better interprofessional relationships, and perceived improvements in patient care. A flatter power gradient across professions and increased interdisciplinary teamwork has been shown to be associated with improved patient outcomes.25,26
Changes to clinician workflow can significantly impact the introduction of new models of care. A mandated time each day for structured rounds meant less flexibility in workflow for clinicians and made greater demands on their time management and communication skills. Furthermore, the need for human resource negotiations with nurse representatives was an unexpected component of successfully introducing the changes to workflow. Once the benefits of saved time and better communication became evident, changes to workflow were generally accepted. These challenges can be managed if stakeholders are engaged and supportive of the changes.13
Finally, our findings emphasize the importance of combining qualitative and quantitative data when evaluating an intervention. In this case, the qualitative outcomes that include “intangible” positive effects, such as cultural change and improved staff understanding of one another’s roles, might encourage us to continue with the SIBR intervention, which would allow more time to see if the trend of reduced LOS identified in the statistical analysis would translate to a significant effect over time.
We are unable to identify which aspects of the intervention led to the greatest impact on our outcomes. A recent study found that interdisciplinary rounds had no impact on patients’ perceptions of shared decision-making or care satisfaction.27 Although our findings indicated many potential benefits for patients, we were not able to interview patients or their carers to confirm these findings. In addition, we do not have any patient-centered outcomes, which would be important to consider in future work. Although our data on clinical response calls might be seen as a proxy for adverse events, we do not have data on adverse events or errors, and these are important to consider in future work. Finally, our findings are based on data from a single institution.
CONCLUSIONS
While there were some criticisms, participants expressed overwhelmingly positive reactions to the SIBR. The biggest reported benefit was perceived improved communication and understanding between and within the clinical professions, and between clinicians and patients. Improved communication was perceived to have fostered improved teamwork and team functioning, with most respondents feeling that they were a valued part of the new team. Improved teamwork was thought to contribute to improved task performance and led interviewees to perceive a higher level of patient safety. This research highlights the need for multimethod evaluations that address contextual factors as well as clinical outcomes.
Acknowledgments
The authors would like to acknowledge the clinicians and staff members who participated in this study. We would also like to acknowledge the support from the NSW Clinical Excellence Commission, in particular, Dr. Peter Kennedy, Mr. Wilson Yeung, Ms. Tracy Clarke, and Mr. Allan Zhang, and also from Ms. Karen Storey and Mr. Steve Shea of the Organisational Performance Management team at the Orange Health Service.
Disclosures
None of the authors had conflicts of interest in relation to the conduct or reporting of this study, with the exception that the lead author’s institution, the Australian Institute of Health Innovation, received a small grant from the New South Wales Clinical Excellence Commission to conduct the work. Ethics approval for the research was granted by the Greater Western Area Health Service Human Research Ethics Committee (HREC/13/GWAHS/22). All interviewees consented to participate in the study. For patient data, consent was not obtained, but presented data are anonymized. The full dataset is available from the corresponding author with restrictions. This research was funded by the NSW Clinical Excellence Commission, who also encouraged submission of the article for publication. The funding source did not have any role in conduct or reporting of the study. R.C.W., J.P., and J.J. conceptualized and conducted the qualitative component of the study, including method, data collection, data analysis, and writing of the manuscript. G.L., C.H., and H.D. conceptualized the quantitative component of the study, including method, data collection, data analysis, and writing of the manuscript. G.S. contributed to conceptualization of the study, and significantly contributed to the revision of the manuscript. All authors, external and internal, had full access to all of the data (including statistical reports and tables) in the study and can take responsibility for the integrity of the data and the accuracy of the data analysis. As the lead author, R.C.W. affirms that the manuscript is an honest, accurate, and transparent account of the study being reported, that no important aspects of the study have been omitted, and that any discrepancies from the study as planned have been explained.
1. Johnson JK, Batalden PB. Educating health professionals to improve care within the clinical microsystem. McLaughlin and Kaluzny’s Continuous Quality Improvement In Health Care. Burlington: Jones & Bartlett Learning; 2013.
2. Mohr JJ, Batalden P, Barach PB. Integrating patient safety into the clinical microsystem. Qual Saf Health Care. 2004;13:ii34-ii38. PubMed
3. Sanchez JA, Barach PR. High reliability organizations and surgical microsystems: re-engineering surgical care. Surg Clin North Am. 2012;92:1-14. PubMed
4. Curley C, McEachern JE, Speroff T. A firm trial of interdisciplinary rounds on the inpatient medical wards: an intervention designed using continuous quality improvement. Med Care. 1998;36:AS4-AS12. PubMed
5. O’Mahony S, Mazur E, Charney P, Wang Y, Fine J. Use of multidisciplinary rounds to simultaneously improve quality outcomes, enhance resident education, and shorten length of stay. J Gen Intern Med. 2007;22:1073-1079. PubMed
6. Pannick S, Beveridge I, Wachter RM, Sevdalis N. Improving the quality and safety of care on the medical ward: a review and synthesis of the evidence base. Eur J Intern Med. 2014;25:874-887. PubMed
7. Halm MA, Gagner S, Goering M, Sabo J, Smith M, Zaccagnini M. Interdisciplinary rounds: impact on patients, families, and staff. Clin Nurse Spec. 2003;17:133-142. PubMed
8. Stein J, Murphy D, Payne C, et al. A remedy for fragmented hospital care. Harvard Business Review. 2013.
9. O’Leary KJ, Buck R, Fligiel HM, et al. Structured interdisciplinary rounds in a medical teaching unit: improving patient safety. Arch Intern Med. 2010;171:678-684. PubMed
10. O’Leary KJ, Haviley C, Slade ME, Shah HM, Lee J, Williams MV. Improving teamwork: impact of structured interdisciplinary rounds on a hospitalist unit. J Hosp Med. 2011;6:88-93. PubMed
11. O’Leary KJ, Ritter CD, Wheeler H, Szekendi MK, Brinton TS, Williams MV. Teamwork on inpatient medical units: assessing attitudes and barriers. Qual Saf Health Care. 2011;19:117-121. PubMed
12. O’Leary KJ, Creden AJ, Slade ME, et al. Implementation of unit-based interventions to improve teamwork and patient safety on a medical service. Am J Med Qual. 2014;30:409-416. PubMed
13. Stein J, Payne C, Methvin A, et al. Reorganizing a hospital ward as an accountable care unit. J Hosp Med. 2015;10:36-40. PubMed
14. Creswell JW. Research Design: Qualitative, Quantitative, and Mixed Methods Approaches. Thousand Oaks: SAGE Publications; 2013.
15. Palinkas LA, Horwitz SM, Green CA, Wisdom JP, Duan N, Hoagwood K. Purposeful sampling for qualitative data collection and analysis in mixed method implementation research. Adm Pol Ment Health. 2015;42:533-544. PubMed
16. Australian Consortium for Classification Development (ACCD). Review of the AR-DRG classification Case Complexity Process: Final Report; 2014.
http://ihpa.gov.au/internet/ihpa/publishing.nsf/Content/admitted-acute. Accessed September 21, 2015.
17. Lofland J, Lofland LH. Analyzing Social Settings. Belmont: Wadsworth Publishing Company; 2006.
18. Miles MB, Huberman AM, Saldaña J. Qualitative Data Analysis: A Methods Sourcebook. Los Angeles: SAGE Publications; 2014.
19. Corbin J, Strauss A. Basics of Qualitative Research: Techniques and Procedures for Developing Grounded Theory. Thousand Oaks: SAGE Publications; 2008.
20. Corbin JM, Strauss A. Grounded theory research: procedures, canons, and evaluative criteria. Qual Sociol. 1990;13:3-21.
21. O’Leary KJ, Johnson JK, Auerbach AD. Do interdisciplinary rounds improve patient outcomes? only if they improve teamwork. J Hosp Med. 2016;11:524-525. PubMed
22. Clay-Williams R. Restructuring and the resilient organisation: implications for health care. In: Hollnagel E, Braithwaite J, Wears R, editors. Resilient health care. Surrey: Ashgate Publishing Limited; 2013.
23. Williams I, Dickinson H, Robinson S, Allen C. Clinical microsystems and the NHS: a sustainable method for improvement? J Health Organ and Manag. 2009;23:119-132. PubMed
24. Nelson EC, Godfrey MM, Batalden PB, et al. Clinical microsystems, part 1. The building blocks of health systems. Jt Comm J Qual Patient Saf. 2008;34:367-378. PubMed
25. Chisholm-Burns MA, Lee JK, Spivey CA, et al. US pharmacists’ effect as team members on patient care: systematic review and meta-analyses. Med Care. 2010;48:923-933. PubMed
26. Zwarenstein M, Goldman J, Reeves S. Interprofessional collaboration: effects of practice-based interventions on professional practice and healthcare outcomes. Cochrane Database Syst Rev. 2009;3:CD000072. PubMed
27. O’Leary KJ, Killarney A, Hansen LO, et al. Effect of patient-centred bedside rounds on hospitalised patients’ decision control, activation and satisfaction with care. BMJ Qual Saf. 2015;25:921-928. PubMed
© 2018 Society of Hospital Medicine
Things We Do for No Reason – The “48 Hour Rule-out” for Well-Appearing Febrile Infants
The “Things We Do for No Reason” (TWDFNR) series reviews practices that have become common parts of hospital care but may provide little value to our patients. Practices reviewed in the TWDFNR series do not represent “black and white” conclusions or clinical practice standards but are meant as a starting place for research and active discussions among hospitalists and patients. We invite you to be part of that discussion. https://www.choosingwisely.org/
CASE PRESENTATION
A 3-week-old, full-term term male febrile infant was evaluated in the emergency department (ED). On the day of admission, he was noted to feel warm to the touch and was found to have a rectal temperature of 101.3°F (38.3°C) at home.
In the ED, the patient was well appearing and had normal physical exam findings. His workup in the ED included a normal chest radiograph, complete blood count (CBC) with differential count, cerebrospinal fluid (CSF) analysis (cell count, protein, and glucose), and urinalysis. Blood, CSF, and catheterized urine cultures were collected, and he was admitted to the hospital on parenteral antibiotics. His provider informed the parents that the infant would be observed in the hospital for 48 hours while monitoring the bacterial cultures. Is it necessary for the hospitalization of this child to last a full 48 hours?
INTRODUCTION
Evaluation and management of fever (T ≥ 38°C) is a common cause of emergency department visits and accounts for up to 20% of pediatric emergency visits.2
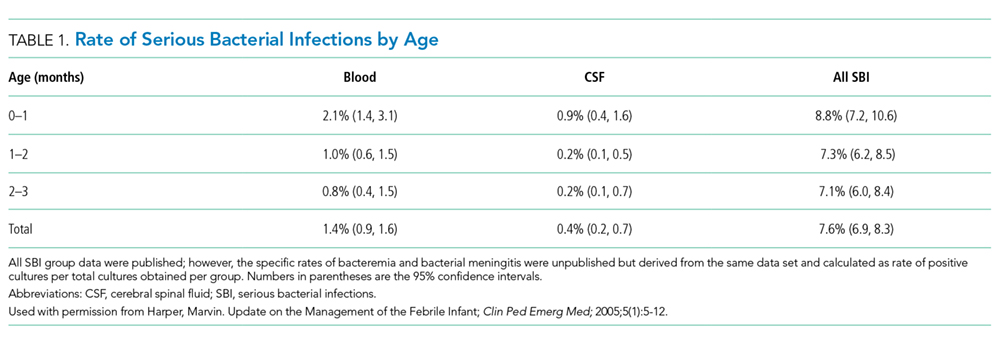
Why You Might Think Hospitalization for at Least 48 Hours is Necessary
The evaluation and management of fever in infants aged less than 90 days is challenging due to concern for occult serious bacterial infections. In particular, providers may be concerned that the physical exam lacks sensitivity.9
There is also a perceived risk of poor outcomes in young infants if a serious bacterial infection is missed. For these reasons, the evaluation and management of febrile infants has been characterized by practice variability in both outpatient10 and ED3 settings.
Commonly used febrile infant management protocols vary in approach and do not provide clear guidelines on the recommended duration of hospitalization and empiric antimicrobial treatment.11-14 Length of hospitalization was widely studied in infants between 1979 and 1999, and results showed that the majority of clinically important bacterial pathogens can be detected within 48 hours.15-17 Many textbooks and online references, based on this literature, continue to support 48 to 72 hours of observation and empiric antimicrobial treatment for febrile infants.18,19 A 2012 AAP Clinical Report advocated for limiting the antimicrobial treatment in low-risk infants suspected of early-onset sepsis to 48 hours.20
Why Shorten the Period of In-Hospital Observation to a Maximum of 36 Hours of Culture Incubation
Discharge of low-risk infants with negative enhanced urinalysis and negative bacterial cultures at 36 hours or earlier can reduce costs21 and potentially preventable harm (eg, intravenous catheter complications, nosocomial infections) without negatively impacting patient outcomes.22 Early discharge is also patient-centered, given the stress and indirect costs associated with hospitalization, including potential separation of a breastfeeding infant and mother, lost wages from time off work, or childcare for well siblings.23
Initial studies that evaluated the time-to-positivity (TTP) of bacterial cultures in febrile infants predate the use of continuous monitoring systems for blood cultures. Traditional bacterial culturing techniques require direct observation of broth turbidity and subsequent subculturing onto chocolate and sheep blood agar, typically occurring only once daily.24 Current commercially available continuous monitoring bacterial culture systems decrease TTP by immediately alerting laboratory technicians to bacterial growth through the detection of 14CO2 released by organisms utilizing radiolabeled glucose in growth media.24 In addition, many studies supporting the evaluation of febrile infants in the hospital for a 48-hour period include those in ICU settings,25 with medically complex histories,24 and aged < 28 days admitted in the NICU,15 where pathogens with longer incubation times are frequently seen.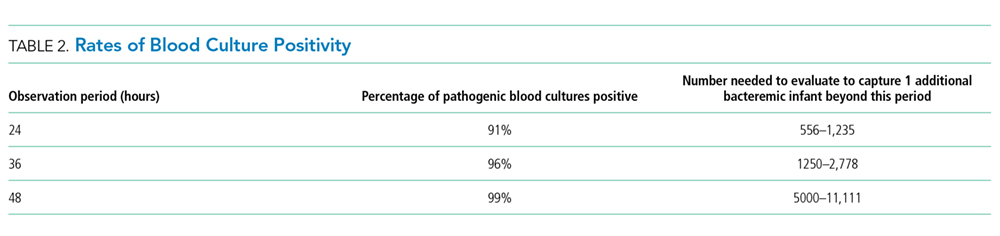
In a recent single-center retrospective study, infant blood cultures with TTP longer than 36 hours are 7.8 times more likely to be identified as contaminant bacteria compared with cultures that tested positive in <36 hours.26 Even if bacterial cultures were unexpectedly positive after 36 hours, which occurs in less than 1.1% of all infants and 0.3% of low-risk infants,1 these patients do not have adverse outcomes. Infants who were deemed low risk based on established criteria and who had bacterial cultures positive for pathogenic bacteria were treated at that time and recovered uneventfully.7, 31
CSF and urine cultures are often reviewed only once or twice daily in most institutions, and this practice artificially prolongs the TTP for pathogenic bacteria. Small sample-sized studies have demonstrated the low detection rate of pathogens in CSF and urine cultures beyond 36 hours. Evans et al. found that in infants aged 0-28 days, 0.03% of urine cultures and no CSF cultures tested positive after 36 hours.26 In a retrospective study of infants aged 28-90 days in the ED setting, Kaplan et al. found that 0.9% of urine cultures and no CSF cultures were positive at >24 hours.1 For well-appearing infants who have reassuring initial CSF studies, the risk of meningitis is extremely low.7 Management criteria for febrile infants provide guidance for determining those infants with abnormal CSF results who may benefit from longer periods of observation.
Urinary tract infections are common serious bacterial infections in this age group. Enhanced urinalysis, in which cell count and Gram stain analysis are performed on uncentrifuged urine, shows 96% sensitivity of predicting urinary tract infection and can provide additional reassurance for well-appearing infants who are discharged prior to 48 hours.27
When a Longer Observation Period May Be Warranted
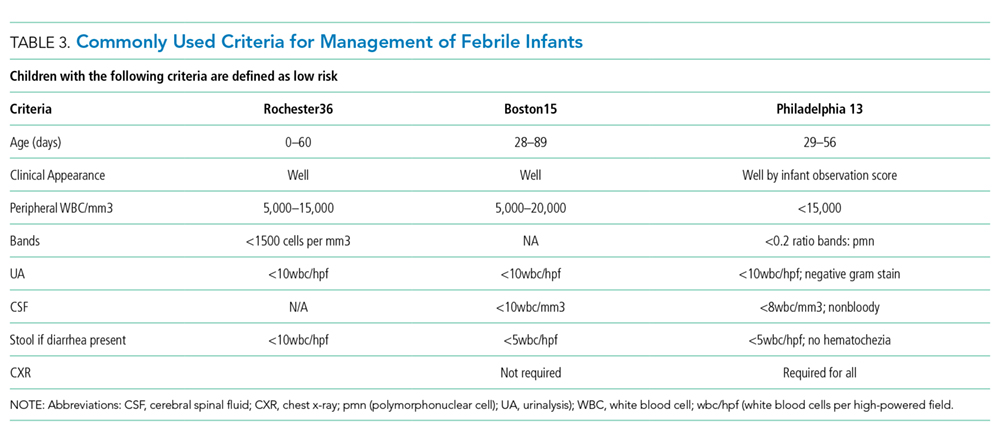
What You Should Do Instead: Limit Hospitalization to a Maximum of 36 Hours
For well-appearing febrile infants between 0–90 days of age hospitalized for observation and awaiting bacterial culture results, providers should consider discharge at 36 hours or less, rather than 48 hours, if blood, urine, and CSF cultures do not show bacterial growth. In a large health system, researchers implemented an evidence-based care process model for febrile infants to provide specific guidelines for laboratory testing, criteria for admission, and recommendation for discontinuation of empiric antibiotics and discharge after 36 hours in infants with negative bacterial cultures. These changes led to a 27% reduction in the length of hospital stay and 23% reduction in inpatient costs without any cases of missed bacteremia.21 The reduction in the in-hospital observation duration to 24 hours of culture incubation for well-appearing febrile infants has been advocated 32 and is a common practice for infants with appropriate follow up and parental assurance. This recommendation is supported by the following:
- Recent data showing the overwhelming majority of pathogens will be identified by blood culture <24 hours in infants aged 0-90 days32 with blood culture TTP in infants aged 0-30 days being either no different26 or potentially shorter32
- Studies showing that infants meeting low-risk clinical and laboratory profiles further reduce the likelihood of identifying serious bacterial infection after 24 hours to 0.3%.1
RECOMMENDATIONS
- Determine if febrile infants aged 0-90 days are at low risk for serious bacterial infection and obtain appropriate bacterial cultures.
- If hospitalized for observation, discharge low-risk febrile infants aged 0–90 days after 36 hours or less if bacterial cultures remain negative.
- If hospitalized for observation, consider reducing the length of inpatient observation for low-risk febrile infants aged 0–90 days with reliable follow-up to 24 hours or less when the culture results are negative.
CONCLUSION
Monitoring patients in the hospital for greater than 36 hours of bacterial culture incubation is unnecessary for patients similar to the 3 week-old full-term infant in the case presentation, who are at low risk for serious bacterial infection based on available scoring systems and have negative cultures. If patients are not deemed low risk, have an incomplete laboratory evaluation, or have had prior antibiotic treatment, longer observation in the hospital may be warranted. Close reassessment of the rare patients whose blood cultures return positive after 36 hours is necessary, but their outcomes are excellent, especially in well-appearing infants.7,33
What do you do?
Do you think this is a low-value practice? Is this truly a “Thing We Do for No Reason”? Let us know what you do in your practice and propose ideas for other “Things We Do for No Reason” topics. Please join in the conversation online at Twitter (#TWDFNR)/Facebook and don’t forget to “Like It” on Facebook or retweet it on Twitter. We invite you to propose ideas for other “Things We Do for No Reason” topics by emailingTWDFNR@hospitalmedicine.org.
Disclosures
There are no conflicts of interest relevant to this work reported by any of the authors.
1. Kaplan RL, Harper MB, Baskin MN, Macone AB, Mandl KD. Time to detection of positive cultures in 28- to 90-day-old febrile infants. Pediatrics 2000;106(6):E74. PubMed
2. Fleisher GR, Ludwig S, Henretig FM. Textbook of Pediatric Emergency Medicine: Lippincott Williams & Wilkins; 2006.
3. Aronson PL, Thurm C, Williams DJ, et al. Association of clinical practice guidelines with emergency department management of febrile infants </=56 days of age. J Hosp Med. 2015;10(6):358-365. PubMed
4. Hui C, Neto G, Tsertsvadze A, et al. Diagnosis and management of febrile infants (0-3 months). Evid Rep Technol Assess. 2012;205:1-297. PubMed
5. Garcia S, Mintegi S, Gomez B, et al. Is 15 days an appropriate cut-off age for considering serious bacterial infection in the management of febrile infants? Pediatr Infect Dis J. 2012;31(5):455-458. PubMed
6. Schwartz S, Raveh D, Toker O, Segal G, Godovitch N, Schlesinger Y. A week-by-week analysis of the low-risk criteria for serious bacterial infection in febrile neonates. Arch Dis Child. 2009;94(4):287-292. PubMed
7. Huppler AR, Eickhoff JC, Wald ER. Performance of low-risk criteria in the evaluation of young infants with fever: review of the literature. Pediatrics 2010;125(2):228-233. PubMed
8. Baskin MN. The prevalence of serious bacterial infections by age in febrile infants during the first 3 months of life. Pediatr Ann. 1993;22(8):462-466. PubMed
9. Nigrovic LE, Mahajan PV, Blumberg SM, et al. The Yale Observation Scale Score and the risk of serious bacterial infections in febrile infants. Pediatrics 2017;140(1):e20170695. PubMed
10. Bergman DA, Mayer ML, Pantell RH, Finch SA, Wasserman RC. Does clinical presentation explain practice variability in the treatment of febrile infants? Pediatrics 2006;117(3):787-795. PubMed
11. Baker MD, Bell LM, Avner JR. Outpatient management without antibiotics of fever in selected infants. N Engl J Med. 1993;329(20):1437-1441. PubMed
12. Jaskiewicz JA, McCarthy CA, Richardson AC, et al. Febrile infants at low risk for serious bacterial infection--an appraisal of the Rochester criteria and implications for management. Febrile Infant Collaborative Study Group. Pediatrics 1994;94(3):390-396. PubMed
13. Baskin MN, O’Rourke EJ, Fleisher GR. Outpatient treatment of febrile infants 28 to 89 days of age with intramuscular administration of ceftriaxone. J Pediatr. 1992;120(1):22-27. PubMed
14. Bachur RG, Harper MB. Predictive model for serious bacterial infections among infants younger than 3 months of age. Pediatrics 2001;108(2):311-316. PubMed
15. Pichichero ME, Todd JK. Detection of neonatal bacteremia. J Pediatr. 1979;94(6):958-960. PubMed
16. Hurst MK, Yoder BA. Detection of bacteremia in young infants: is 48 hours adequate? Pediatr Infect Dis J. 1995;14(8):711-713. PubMed
17. Friedman J, Matlow A. Time to identification of positive bacterial cultures in infants under three months of age hospitalized to rule out sepsis. Paediatr Child Health 1999;4(5):331-334. PubMed
18. Kliegman R, Behrman RE, Nelson WE. Nelson textbook of pediatrics. Edition 20 / ed. Philadelphia, PA: Elsevier; 2016.
19. Fever in infants and children. Merck Sharp & Dohme Corp, 2016. (Accessed 27 Nov 2016, 2016, at https://www.merckmanuals.com/professional/pediatrics/symptoms-in-infants-and-children/fever-in-infants-and-children.)
20. Polin RA, Committee on F, Newborn. Management of neonates with suspected or proven early-onset bacterial sepsis. Pediatrics 2012;129(5):1006-1015. PubMed
21. Byington CL, Reynolds CC, Korgenski K, et al. Costs and infant outcomes after implementation of a care process model for febrile infants. Pediatrics 2012;130(1):e16-e24. PubMed
22. DeAngelis C, Joffe A, Wilson M, Willis E. Iatrogenic risks and financial costs of hospitalizing febrile infants. Am J Dis Child. 1983;137(12):1146-1149. PubMed
23. Nizam M, Norzila MZ. Stress among parents with acutely ill children. Med J Malaysia. 2001;56(4):428-434. PubMed
24. Rowley AH, Wald ER. The incubation period necessary for detection of bacteremia in immunocompetent children with fever. Implications for the clinician. Clin Pediatr (Phila). 1986;25(10):485-489. PubMed
25. La Scolea LJ, Jr., Dryja D, Sullivan TD, Mosovich L, Ellerstein N, Neter E. Diagnosis of bacteremia in children by quantitative direct plating and a radiometric procedure. J Clin Microbiol. 1981;13(3):478-482. PubMed
26. Evans RC, Fine BR. Time to detection of bacterial cultures in infants aged 0 to 90 days. Hosp Pediatr. 2013;3(2):97-102. PubMed
27. Herr SM, Wald ER, Pitetti RD, Choi SS. Enhanced urinalysis improves identification of febrile infants ages 60 days and younger at low risk for serious bacterial illness. Pediatrics 2001;108(4):866-871. PubMed
28. Nigrovic LE, Kuppermann N, Macias CG, et al. Clinical prediction rule for identifying children with cerebrospinal fluid pleocytosis at very low risk of bacterial meningitis. JAMA. 2007;297(1):52-60. PubMed
29. Doby EH, Stockmann C, Korgenski EK, Blaschke AJ, Byington CL. Cerebrospinal fluid pleocytosis in febrile infants 1-90 days with urinary tract infection. Pediatr Infect Dis J. 2013;32(9):1024-1026. PubMed
30. Bhansali P, Wiedermann BL, Pastor W, McMillan J, Shah N. Management of hospitalized febrile neonates without CSF analysis: A study of US pediatric hospitals. Hosp Pediatr. 2015;5(10):528-533. PubMed
31. Kanegaye JT, Soliemanzadeh P, Bradley JS. Lumbar puncture in pediatric bacterial meningitis: defining the time interval for recovery of cerebrospinal fluid pathogens after parenteral antibiotic pretreatment. Pediatrics 2001;108(5):1169-1174. PubMed
32. Biondi EA, Mischler M, Jerardi KE, et al. Blood culture time to positivity in febrile infants with bacteremia. JAMA Pediatr. 2014;168(9):844-849. PubMed
33. Moher D HC, Neto G, Tsertsvadze A. Diagnosis and Management of Febrile Infants (0–3 Months). Evidence Report/Technology Assessment No. 205. In: Center OE-bP, ed. Rockville, MD: Agency for Healthcare Research and Quality; 2012. PubMed
The “Things We Do for No Reason” (TWDFNR) series reviews practices that have become common parts of hospital care but may provide little value to our patients. Practices reviewed in the TWDFNR series do not represent “black and white” conclusions or clinical practice standards but are meant as a starting place for research and active discussions among hospitalists and patients. We invite you to be part of that discussion. https://www.choosingwisely.org/
CASE PRESENTATION
A 3-week-old, full-term term male febrile infant was evaluated in the emergency department (ED). On the day of admission, he was noted to feel warm to the touch and was found to have a rectal temperature of 101.3°F (38.3°C) at home.
In the ED, the patient was well appearing and had normal physical exam findings. His workup in the ED included a normal chest radiograph, complete blood count (CBC) with differential count, cerebrospinal fluid (CSF) analysis (cell count, protein, and glucose), and urinalysis. Blood, CSF, and catheterized urine cultures were collected, and he was admitted to the hospital on parenteral antibiotics. His provider informed the parents that the infant would be observed in the hospital for 48 hours while monitoring the bacterial cultures. Is it necessary for the hospitalization of this child to last a full 48 hours?
INTRODUCTION
Evaluation and management of fever (T ≥ 38°C) is a common cause of emergency department visits and accounts for up to 20% of pediatric emergency visits.2
Why You Might Think Hospitalization for at Least 48 Hours is Necessary
The evaluation and management of fever in infants aged less than 90 days is challenging due to concern for occult serious bacterial infections. In particular, providers may be concerned that the physical exam lacks sensitivity.9
There is also a perceived risk of poor outcomes in young infants if a serious bacterial infection is missed. For these reasons, the evaluation and management of febrile infants has been characterized by practice variability in both outpatient10 and ED3 settings.
Commonly used febrile infant management protocols vary in approach and do not provide clear guidelines on the recommended duration of hospitalization and empiric antimicrobial treatment.11-14 Length of hospitalization was widely studied in infants between 1979 and 1999, and results showed that the majority of clinically important bacterial pathogens can be detected within 48 hours.15-17 Many textbooks and online references, based on this literature, continue to support 48 to 72 hours of observation and empiric antimicrobial treatment for febrile infants.18,19 A 2012 AAP Clinical Report advocated for limiting the antimicrobial treatment in low-risk infants suspected of early-onset sepsis to 48 hours.20
Why Shorten the Period of In-Hospital Observation to a Maximum of 36 Hours of Culture Incubation
Discharge of low-risk infants with negative enhanced urinalysis and negative bacterial cultures at 36 hours or earlier can reduce costs21 and potentially preventable harm (eg, intravenous catheter complications, nosocomial infections) without negatively impacting patient outcomes.22 Early discharge is also patient-centered, given the stress and indirect costs associated with hospitalization, including potential separation of a breastfeeding infant and mother, lost wages from time off work, or childcare for well siblings.23
Initial studies that evaluated the time-to-positivity (TTP) of bacterial cultures in febrile infants predate the use of continuous monitoring systems for blood cultures. Traditional bacterial culturing techniques require direct observation of broth turbidity and subsequent subculturing onto chocolate and sheep blood agar, typically occurring only once daily.24 Current commercially available continuous monitoring bacterial culture systems decrease TTP by immediately alerting laboratory technicians to bacterial growth through the detection of 14CO2 released by organisms utilizing radiolabeled glucose in growth media.24 In addition, many studies supporting the evaluation of febrile infants in the hospital for a 48-hour period include those in ICU settings,25 with medically complex histories,24 and aged < 28 days admitted in the NICU,15 where pathogens with longer incubation times are frequently seen.
In a recent single-center retrospective study, infant blood cultures with TTP longer than 36 hours are 7.8 times more likely to be identified as contaminant bacteria compared with cultures that tested positive in <36 hours.26 Even if bacterial cultures were unexpectedly positive after 36 hours, which occurs in less than 1.1% of all infants and 0.3% of low-risk infants,1 these patients do not have adverse outcomes. Infants who were deemed low risk based on established criteria and who had bacterial cultures positive for pathogenic bacteria were treated at that time and recovered uneventfully.7, 31
CSF and urine cultures are often reviewed only once or twice daily in most institutions, and this practice artificially prolongs the TTP for pathogenic bacteria. Small sample-sized studies have demonstrated the low detection rate of pathogens in CSF and urine cultures beyond 36 hours. Evans et al. found that in infants aged 0-28 days, 0.03% of urine cultures and no CSF cultures tested positive after 36 hours.26 In a retrospective study of infants aged 28-90 days in the ED setting, Kaplan et al. found that 0.9% of urine cultures and no CSF cultures were positive at >24 hours.1 For well-appearing infants who have reassuring initial CSF studies, the risk of meningitis is extremely low.7 Management criteria for febrile infants provide guidance for determining those infants with abnormal CSF results who may benefit from longer periods of observation.
Urinary tract infections are common serious bacterial infections in this age group. Enhanced urinalysis, in which cell count and Gram stain analysis are performed on uncentrifuged urine, shows 96% sensitivity of predicting urinary tract infection and can provide additional reassurance for well-appearing infants who are discharged prior to 48 hours.27
When a Longer Observation Period May Be Warranted
What You Should Do Instead: Limit Hospitalization to a Maximum of 36 Hours
For well-appearing febrile infants between 0–90 days of age hospitalized for observation and awaiting bacterial culture results, providers should consider discharge at 36 hours or less, rather than 48 hours, if blood, urine, and CSF cultures do not show bacterial growth. In a large health system, researchers implemented an evidence-based care process model for febrile infants to provide specific guidelines for laboratory testing, criteria for admission, and recommendation for discontinuation of empiric antibiotics and discharge after 36 hours in infants with negative bacterial cultures. These changes led to a 27% reduction in the length of hospital stay and 23% reduction in inpatient costs without any cases of missed bacteremia.21 The reduction in the in-hospital observation duration to 24 hours of culture incubation for well-appearing febrile infants has been advocated 32 and is a common practice for infants with appropriate follow up and parental assurance. This recommendation is supported by the following:
- Recent data showing the overwhelming majority of pathogens will be identified by blood culture <24 hours in infants aged 0-90 days32 with blood culture TTP in infants aged 0-30 days being either no different26 or potentially shorter32
- Studies showing that infants meeting low-risk clinical and laboratory profiles further reduce the likelihood of identifying serious bacterial infection after 24 hours to 0.3%.1
RECOMMENDATIONS
- Determine if febrile infants aged 0-90 days are at low risk for serious bacterial infection and obtain appropriate bacterial cultures.
- If hospitalized for observation, discharge low-risk febrile infants aged 0–90 days after 36 hours or less if bacterial cultures remain negative.
- If hospitalized for observation, consider reducing the length of inpatient observation for low-risk febrile infants aged 0–90 days with reliable follow-up to 24 hours or less when the culture results are negative.
CONCLUSION
Monitoring patients in the hospital for greater than 36 hours of bacterial culture incubation is unnecessary for patients similar to the 3 week-old full-term infant in the case presentation, who are at low risk for serious bacterial infection based on available scoring systems and have negative cultures. If patients are not deemed low risk, have an incomplete laboratory evaluation, or have had prior antibiotic treatment, longer observation in the hospital may be warranted. Close reassessment of the rare patients whose blood cultures return positive after 36 hours is necessary, but their outcomes are excellent, especially in well-appearing infants.7,33
What do you do?
Do you think this is a low-value practice? Is this truly a “Thing We Do for No Reason”? Let us know what you do in your practice and propose ideas for other “Things We Do for No Reason” topics. Please join in the conversation online at Twitter (#TWDFNR)/Facebook and don’t forget to “Like It” on Facebook or retweet it on Twitter. We invite you to propose ideas for other “Things We Do for No Reason” topics by emailingTWDFNR@hospitalmedicine.org.
Disclosures
There are no conflicts of interest relevant to this work reported by any of the authors.
1. Kaplan RL, Harper MB, Baskin MN, Macone AB, Mandl KD. Time to detection of positive cultures in 28- to 90-day-old febrile infants. Pediatrics 2000;106(6):E74. PubMed
2. Fleisher GR, Ludwig S, Henretig FM. Textbook of Pediatric Emergency Medicine: Lippincott Williams & Wilkins; 2006.
3. Aronson PL, Thurm C, Williams DJ, et al. Association of clinical practice guidelines with emergency department management of febrile infants </=56 days of age. J Hosp Med. 2015;10(6):358-365. PubMed
4. Hui C, Neto G, Tsertsvadze A, et al. Diagnosis and management of febrile infants (0-3 months). Evid Rep Technol Assess. 2012;205:1-297. PubMed
5. Garcia S, Mintegi S, Gomez B, et al. Is 15 days an appropriate cut-off age for considering serious bacterial infection in the management of febrile infants? Pediatr Infect Dis J. 2012;31(5):455-458. PubMed
6. Schwartz S, Raveh D, Toker O, Segal G, Godovitch N, Schlesinger Y. A week-by-week analysis of the low-risk criteria for serious bacterial infection in febrile neonates. Arch Dis Child. 2009;94(4):287-292. PubMed
7. Huppler AR, Eickhoff JC, Wald ER. Performance of low-risk criteria in the evaluation of young infants with fever: review of the literature. Pediatrics 2010;125(2):228-233. PubMed
8. Baskin MN. The prevalence of serious bacterial infections by age in febrile infants during the first 3 months of life. Pediatr Ann. 1993;22(8):462-466. PubMed
9. Nigrovic LE, Mahajan PV, Blumberg SM, et al. The Yale Observation Scale Score and the risk of serious bacterial infections in febrile infants. Pediatrics 2017;140(1):e20170695. PubMed
10. Bergman DA, Mayer ML, Pantell RH, Finch SA, Wasserman RC. Does clinical presentation explain practice variability in the treatment of febrile infants? Pediatrics 2006;117(3):787-795. PubMed
11. Baker MD, Bell LM, Avner JR. Outpatient management without antibiotics of fever in selected infants. N Engl J Med. 1993;329(20):1437-1441. PubMed
12. Jaskiewicz JA, McCarthy CA, Richardson AC, et al. Febrile infants at low risk for serious bacterial infection--an appraisal of the Rochester criteria and implications for management. Febrile Infant Collaborative Study Group. Pediatrics 1994;94(3):390-396. PubMed
13. Baskin MN, O’Rourke EJ, Fleisher GR. Outpatient treatment of febrile infants 28 to 89 days of age with intramuscular administration of ceftriaxone. J Pediatr. 1992;120(1):22-27. PubMed
14. Bachur RG, Harper MB. Predictive model for serious bacterial infections among infants younger than 3 months of age. Pediatrics 2001;108(2):311-316. PubMed
15. Pichichero ME, Todd JK. Detection of neonatal bacteremia. J Pediatr. 1979;94(6):958-960. PubMed
16. Hurst MK, Yoder BA. Detection of bacteremia in young infants: is 48 hours adequate? Pediatr Infect Dis J. 1995;14(8):711-713. PubMed
17. Friedman J, Matlow A. Time to identification of positive bacterial cultures in infants under three months of age hospitalized to rule out sepsis. Paediatr Child Health 1999;4(5):331-334. PubMed
18. Kliegman R, Behrman RE, Nelson WE. Nelson textbook of pediatrics. Edition 20 / ed. Philadelphia, PA: Elsevier; 2016.
19. Fever in infants and children. Merck Sharp & Dohme Corp, 2016. (Accessed 27 Nov 2016, 2016, at https://www.merckmanuals.com/professional/pediatrics/symptoms-in-infants-and-children/fever-in-infants-and-children.)
20. Polin RA, Committee on F, Newborn. Management of neonates with suspected or proven early-onset bacterial sepsis. Pediatrics 2012;129(5):1006-1015. PubMed
21. Byington CL, Reynolds CC, Korgenski K, et al. Costs and infant outcomes after implementation of a care process model for febrile infants. Pediatrics 2012;130(1):e16-e24. PubMed
22. DeAngelis C, Joffe A, Wilson M, Willis E. Iatrogenic risks and financial costs of hospitalizing febrile infants. Am J Dis Child. 1983;137(12):1146-1149. PubMed
23. Nizam M, Norzila MZ. Stress among parents with acutely ill children. Med J Malaysia. 2001;56(4):428-434. PubMed
24. Rowley AH, Wald ER. The incubation period necessary for detection of bacteremia in immunocompetent children with fever. Implications for the clinician. Clin Pediatr (Phila). 1986;25(10):485-489. PubMed
25. La Scolea LJ, Jr., Dryja D, Sullivan TD, Mosovich L, Ellerstein N, Neter E. Diagnosis of bacteremia in children by quantitative direct plating and a radiometric procedure. J Clin Microbiol. 1981;13(3):478-482. PubMed
26. Evans RC, Fine BR. Time to detection of bacterial cultures in infants aged 0 to 90 days. Hosp Pediatr. 2013;3(2):97-102. PubMed
27. Herr SM, Wald ER, Pitetti RD, Choi SS. Enhanced urinalysis improves identification of febrile infants ages 60 days and younger at low risk for serious bacterial illness. Pediatrics 2001;108(4):866-871. PubMed
28. Nigrovic LE, Kuppermann N, Macias CG, et al. Clinical prediction rule for identifying children with cerebrospinal fluid pleocytosis at very low risk of bacterial meningitis. JAMA. 2007;297(1):52-60. PubMed
29. Doby EH, Stockmann C, Korgenski EK, Blaschke AJ, Byington CL. Cerebrospinal fluid pleocytosis in febrile infants 1-90 days with urinary tract infection. Pediatr Infect Dis J. 2013;32(9):1024-1026. PubMed
30. Bhansali P, Wiedermann BL, Pastor W, McMillan J, Shah N. Management of hospitalized febrile neonates without CSF analysis: A study of US pediatric hospitals. Hosp Pediatr. 2015;5(10):528-533. PubMed
31. Kanegaye JT, Soliemanzadeh P, Bradley JS. Lumbar puncture in pediatric bacterial meningitis: defining the time interval for recovery of cerebrospinal fluid pathogens after parenteral antibiotic pretreatment. Pediatrics 2001;108(5):1169-1174. PubMed
32. Biondi EA, Mischler M, Jerardi KE, et al. Blood culture time to positivity in febrile infants with bacteremia. JAMA Pediatr. 2014;168(9):844-849. PubMed
33. Moher D HC, Neto G, Tsertsvadze A. Diagnosis and Management of Febrile Infants (0–3 Months). Evidence Report/Technology Assessment No. 205. In: Center OE-bP, ed. Rockville, MD: Agency for Healthcare Research and Quality; 2012. PubMed
© 2018 Society of Hospital Medicine
May 2018 Digital Edition
Click here to access the May 2018 Digital Edition.
Table of Contents
- Association of Dioxin and Dioxinlike Congeners With Hypertension
- The Clinical Pathophysiology of Chronic Systemic Sclerosis
- The Effects of Ranolazine on Hemoglobin A1c in a Veteran Population
- A Forgotten Cause of Cardiac Tamponade
- Be Part of the (Larger) Conversation
- NOVA Updates
Islet Transplantation Improves Diabetes-Related Quality of Life
Participants reported the greatest improvements in diabetes-related quality of life (QOL) and better overall health status even though they would need lifelong immune-suppressing drugs to prevent transplant rejection.
The study, conducted by the Clinical Islet Transplantation Consortium, involved 48 people with hypoglycemia unawareness who experienced frequent episodes of severe hypoglycemia despite receiving expert care. Each participant received at least 1 islet transplant.
One year after the first transplant, 42 participants (88%) were free of severe hypoglycemic events, had near-normal blood glucose control, and had restored awareness of hypoglycemia. About half of the recipients needed to continue on insulin to control blood glucose, but the reported improvements in QOL were similar between those who did and those who did not. The researchers say the elimination of severe hypoglycemia and the associated fears outweighed concerns about the need for continued insulin treatment.
Islet transplantation is investigational in the US. Although the results are promising, the National Institutes of Health cautions that the process is not appropriate for all patients with type 1 diabetes mellitus due to risks and adverse effects.
AGA Clinical Practice Update: Screening for Barrett’s esophagus requires consideration for those most at risk
The evidence discussed in this article supports the current recommendation of GI societies that screening endoscopy for Barrett’s esophagus be performed only in well-defined, high-risk populations. Alternative tests for screening are not now recommended; however, some of the alternative tests show great promise, and it is expected that they will soon find a useful place in clinical practice. At the same time, there should be a complementary focus on using demographic and clinical factors as well as noninvasive tools to further define populations for screening. All tests and tools should be balanced with the cost and potential risks of the screening proposed.
Stuart Spechler, MD, of the University of Texas and his colleagues looked at a variety of techniques, both conventional and novel, as well as the cost effectiveness of these strategies in a commentary published in the May issue of Gastroenterology.
Some studies have shown that endoscopic surveillance programs have identified early-stage cancer and provided better outcomes, compared with patients presenting after they already have cancer symptoms. One meta-analysis included 51 studies with 11,028 subjects and demonstrated that patients who had surveillance-detected esophageal adenocarcinoma (EAC) had a 61% reduction in their mortality risk. Other studies have shown similar results, but are susceptible to certain biases. Still other studies have refuted that the surveillance programs help at all. In fact, those with Barrett’s esophagus who died of EAC underwent similar surveillance, compared with controls, in those studies, showing that surveillance did very little to improve their outcomes.
Perhaps one of the most intriguing and cost-effective strategies is to identify patients with Barrett’s esophagus and develop a tool based on demographic and historical information. Tools like this have been developed, but have shown lukewarm results, with areas under the receiver operating characteristic curve (AUROC) ranging from 0.61 to 0.75. One study used information concerning obesity, smoking history, and increasing age, combined with weekly symptoms of gastroesophageal reflux and found that this improved results by nearly 25%. Modified versions of this model have also shown improved detection. When Thrift et al. added additional factors like education level, body mass index, smoking status, and more serious alarm symptoms like unexplained weight loss, the model was able to improve AUROC scores to 0.85 (95% confidence interval, 0.78-0.91). Of course, the clinical utility of these models is still unclear. Nonetheless, these models have influenced certain GI societies that only believe in endoscopic screening of patients with additional risk factors.
Although predictive models may assist in identifying at-risk patients, endoscopes are still needed to diagnose. Transnasal endoscopes (TNEs), the thinner cousins of the regular endoscope, tend to be better tolerated by patients and result in less gagging. One study showed that TNEs (45.7%) improved participation, compared with standard endoscopy (40.7%), and almost 80% of TNE patients were willing to undergo the procedure again. Despite the positives, TNEs provided significantly lower biopsy acquisitions than standard endoscopes (83% vs. 100%, P = .001) because of the sheathing on the endoscope. Other studies have demonstrated the strengths of TNEs, including a study in which 38% of patients had a finding that changed management of their disease. TNEs should be considered a reliable screening tool for Barrett’s esophagus.
Other advances in imaging technology like the advent of the high-resolution complementary metal oxide semiconductor (CMOS), which is small enough to fit into a pill capsule, have led researchers to look into its effectiveness as a screening tool for Barrett’s esophagus. One meta-analysis of 618 patients found that the pooled sensitivity and specificity for diagnosis were 77% and 86%, respectively. Despite its ability to produce high-quality images, the device remains difficult to control and lacks the ability to obtain biopsy samples.
Another example of a swallowed medical device, the Cytosponge-TFF3 is an ingestible capsule that degrades in stomach acid. After 5 minutes, the capsule dissolves and releases a mesh sponge that will be withdrawn through the mouth, scraping the esophagus and gathering a sample. The Cytosponge has proven effective in the Barrett’s Esophagus Screening Trials (BEST) 1. The BEST 2 looked at 463 control and 647 patients with Barrett’s esophagus across 11 United Kingdom hospitals. The trial showed that the Cytosponge exhibited sensitivity of 79.9%, which increased to 87.2% in patients with more than 3 cm of circumferential Barrett’s metaplasia.
Breaking from the invasive nature of imaging scopes and the Cytosponge, some researchers are looking to use “liquid biopsy” or blood tests to detect abnormalities in the blood like DNA or microRNA (miRNA) to identify precursors or presence of a disease. Much remains to be done to develop a clinically meaningful test, but the use of miRNAs to detect disease is an intriguing option. miRNAs control gene expression, and their dysregulation has been associated with the development of many diseases. One study found that patients with Barrett’s esophagus had increased levels of miRNA-194, 215, and 143 but these findings were not validated in a larger study. Other studies have demonstrated similar findings, but more research must be done to validate these findings in larger cohorts.
Other novel detection therapies have been investigated, including serum adipokine and electronic nose breathing tests. The serum adipokine test looks at the metabolically active adipokines secreted in obese patients and those with metabolic syndrome to see if they could predict the presence of Barrett’s esophagus. Unfortunately, the data appear to be conflicting, but these tests can be used in conjunction with other tools to detect Barrett’s esophagus. Electronic nose breathing tests also work by detecting metabolically active compounds from human and gut bacterial metabolism. One study found that analyzing these volatile compounds could delineate between Barrett’s and non-Barrett’s patients with 82% sensitivity, 80% specificity, and 81% accuracy. Both of these technologies need large prospective studies in primary care to validate their clinical utility.
A discussion of the effectiveness of these screening tools would be incomplete without a discussion of their costs. Currently, endoscopic screening costs are high. Therefore, it is important to reserve these tools for the patients who will benefit the most – in other words, patients with clear risk factors for Barrett’s esophagus. Even the capsule endoscope is quite expensive because of the cost of materials associated with the tool.
Cost-effectivenes calculations surrounding the Cytosponge are particularly complicated. One analysis found the computed incremental cost-effectiveness ratio (ICER) of endoscopy, compared with Cytosponge, to have a range of $107,583-$330,361. The potential benefit that Cytosponge offers comes at an ICER for Cytosponge screening, compared with no screening, that ranges from $26,358 to $33,307. The numbers skyrocket when you consider what society would be willing to pay (up to $50,000 per quality-adjusted life-year gained).
With all of this information in mind, it would be useful to look at Barrett’s esophagus and the tools used to diagnose it from a broader perspective.
While the adoption of a new screening strategy could succeed where others have failed, Dr. Spechler points out the potential harm.
“There also is potential for harm in identifying asymptomatic patients with Barrett’s esophagus. In addition to the high costs and small risks of standard endoscopy, the diagnosis of Barrett’s esophagus can cause psychological stress, have a negative impact on quality of life, result in higher premiums for health and life insurance, and might identify innocuous lesions that lead to potentially hazardous invasive treatments. Efforts should therefore be continued to combine biomarkers for Barrett’s with risk stratification. Overall, while these vexing uncertainties must temper enthusiasm for the unqualified endorsement of any screening test for Barrett’s esophagus, the alternative of making no attempt to stem the rapidly rising incidence of a lethal malignancy also is unpalatable.”
The development of this commentary was supported solely by the American Gastroenterological Association Institute. No conflicts of interest were disclosed for this report.
SOURCE: Spechler S et al. Gastroenterology. 2018 May doi: 10.1053/j.gastro.2018.03.031).
AGA Resource
AGA patient education on Barrett’s esophagus will help your patients better understand the disease and how to manage it. Learn more at gastro.org/patient-care.
FROM GASTROENTEROLOGY
PPI use not linked to cognitive decline
Use of proton pump inhibitors (PPIs) is not associated with cognitive decline in two prospective, population-based studies of identical twins published in the May issue of Clinical Gastroenterology and Hepatology.
“No stated differences in [mean cognitive] scores between PPI users and nonusers were significant,” wrote Mette Wod, PhD, of the University of Southern Denmark, Odense, with her associates.
Past research has yielded mixed findings about whether using PPIs affects the risk of dementia. Preclinical data suggest that exposure to these drugs affects amyloid levels in mice, but “the evidence is equivocal, [and] the results of epidemiologic studies [of humans] have also been inconclusive, with more recent studies pointing toward a null association,” the investigators wrote. Furthermore, there are only “scant” data on whether long-term PPI use affects cognitive function, they noted.
To help clarify the issue, they analyzed prospective data from two studies of twins in Denmark: the Study of Middle-Aged Danish Twins, in which individuals underwent a five-part cognitive battery at baseline and then 10 years later, and the Longitudinal Study of Aging Danish Twins, in which participants underwent the same test at baseline and 2 years later. The cognitive test assessed verbal fluency, forward and backward digit span, and immediate and delayed recall of a 12-item list. Using data from a national prescription registry, the investigators also estimated individuals’ PPI exposure starting 2 years before study enrollment.
In the study of middle-aged twins, participants who used high-dose PPIs before study enrollment had cognitive scores that were slightly lower at baseline, compared with PPI nonusers. Mean baseline scores were 43.1 (standard deviation, 13.1) and 46.8 (SD, 10.2), respectively. However, after researchers adjusted for numerous clinical and demographic variables, the between-group difference in baseline scores narrowed to just 0.69 (95% confidence interval, –4.98 to 3.61), which was not statistically significant.
The longitudinal study of older twins yielded similar results. Individuals who used high doses of PPIs had slightly higher adjusted mean baseline cognitive score than did nonusers, but the difference did not reach statistical significance (0.95; 95% CI, –1.88 to 3.79).
Furthermore, prospective assessments of cognitive decline found no evidence of an effect. In the longitudinal aging study, high-dose PPI users had slightly less cognitive decline (based on a smaller change in test scores over time) than did nonusers, but the adjusted difference in decline between groups was not significant (1.22 points; 95% CI, –3.73 to 1.29). In the middle-aged twin study, individuals with the highest levels of PPI exposure (at least 1,600 daily doses) had slightly less cognitive decline than did nonusers, with an adjusted difference of 0.94 points (95% CI, –1.63 to 3.50) between groups, but this did not reach statistical significance.
“This study is the first to examine the association between long-term PPI use and cognitive decline in a population-based setting,” the researchers concluded. “Cognitive scores of more than 7,800 middle-aged and older Danish twins at baseline did not indicate an association with previous PPI use. Follow-up data on more than 4,000 of these twins did not indicate that use of this class of drugs was correlated to cognitive decline.”
Odense University Hospital provided partial funding. Dr. Wod had no disclosures. Three coinvestigators disclosed ties to AstraZeneca and Bayer AG.
SOURCE: Wod M et al. Clin Gastro Hepatol. 2018 Feb 3. doi: 10.1016/j.cgh.2018.01.034.
Over the last 20 years, there have been multiple retrospective studies which have shown associations between the use of proton pump inhibitors (PPIs) and a wide constellation of serious medical complications. However, detecting an association between a drug and a complication does not necessarily indicate that the drug was indeed responsible.

This well-done study by Wod et al, which shows no significant association between PPI use and decreased cognition and cognitive decline will, I hope, serve to allay any misplaced concerns that may exist among clinicians and patients about PPI use in this population. This paper has notable strengths, most importantly having access to results of a direct, unbiased assessment of changes in cognitive function over time and accurate assessment of PPI exposure. Short of performing a controlled, prospective trial, we are unlikely to see better evidence indicating a lack of a causal relationship between PPI use and changes in cognitive function. This provides assurance that patients with indications for PPI use can continue to use them.
Laura E. Targownik, MD, MSHS, FRCPC, is section head, section of gastroenterology, University of Manitoba, Winnipeg, Canada; Gastroenterology and Endoscopy Site Lead, Health Sciences Centre, Winnipeg; associate director, University of Manitoba Inflammatory Bowel Disease Research Centre; associate professor, department of internal medicine, section of gastroenterology, University of Manitoba. She has no conflicts of interest.
Over the last 20 years, there have been multiple retrospective studies which have shown associations between the use of proton pump inhibitors (PPIs) and a wide constellation of serious medical complications. However, detecting an association between a drug and a complication does not necessarily indicate that the drug was indeed responsible.
This well-done study by Wod et al, which shows no significant association between PPI use and decreased cognition and cognitive decline will, I hope, serve to allay any misplaced concerns that may exist among clinicians and patients about PPI use in this population. This paper has notable strengths, most importantly having access to results of a direct, unbiased assessment of changes in cognitive function over time and accurate assessment of PPI exposure. Short of performing a controlled, prospective trial, we are unlikely to see better evidence indicating a lack of a causal relationship between PPI use and changes in cognitive function. This provides assurance that patients with indications for PPI use can continue to use them.
Laura E. Targownik, MD, MSHS, FRCPC, is section head, section of gastroenterology, University of Manitoba, Winnipeg, Canada; Gastroenterology and Endoscopy Site Lead, Health Sciences Centre, Winnipeg; associate director, University of Manitoba Inflammatory Bowel Disease Research Centre; associate professor, department of internal medicine, section of gastroenterology, University of Manitoba. She has no conflicts of interest.
Use of proton pump inhibitors (PPIs) is not associated with cognitive decline in two prospective, population-based studies of identical twins published in the May issue of Clinical Gastroenterology and Hepatology.
“No stated differences in [mean cognitive] scores between PPI users and nonusers were significant,” wrote Mette Wod, PhD, of the University of Southern Denmark, Odense, with her associates.
Past research has yielded mixed findings about whether using PPIs affects the risk of dementia. Preclinical data suggest that exposure to these drugs affects amyloid levels in mice, but “the evidence is equivocal, [and] the results of epidemiologic studies [of humans] have also been inconclusive, with more recent studies pointing toward a null association,” the investigators wrote. Furthermore, there are only “scant” data on whether long-term PPI use affects cognitive function, they noted.
To help clarify the issue, they analyzed prospective data from two studies of twins in Denmark: the Study of Middle-Aged Danish Twins, in which individuals underwent a five-part cognitive battery at baseline and then 10 years later, and the Longitudinal Study of Aging Danish Twins, in which participants underwent the same test at baseline and 2 years later. The cognitive test assessed verbal fluency, forward and backward digit span, and immediate and delayed recall of a 12-item list. Using data from a national prescription registry, the investigators also estimated individuals’ PPI exposure starting 2 years before study enrollment.
In the study of middle-aged twins, participants who used high-dose PPIs before study enrollment had cognitive scores that were slightly lower at baseline, compared with PPI nonusers. Mean baseline scores were 43.1 (standard deviation, 13.1) and 46.8 (SD, 10.2), respectively. However, after researchers adjusted for numerous clinical and demographic variables, the between-group difference in baseline scores narrowed to just 0.69 (95% confidence interval, –4.98 to 3.61), which was not statistically significant.
The longitudinal study of older twins yielded similar results. Individuals who used high doses of PPIs had slightly higher adjusted mean baseline cognitive score than did nonusers, but the difference did not reach statistical significance (0.95; 95% CI, –1.88 to 3.79).
Furthermore, prospective assessments of cognitive decline found no evidence of an effect. In the longitudinal aging study, high-dose PPI users had slightly less cognitive decline (based on a smaller change in test scores over time) than did nonusers, but the adjusted difference in decline between groups was not significant (1.22 points; 95% CI, –3.73 to 1.29). In the middle-aged twin study, individuals with the highest levels of PPI exposure (at least 1,600 daily doses) had slightly less cognitive decline than did nonusers, with an adjusted difference of 0.94 points (95% CI, –1.63 to 3.50) between groups, but this did not reach statistical significance.
“This study is the first to examine the association between long-term PPI use and cognitive decline in a population-based setting,” the researchers concluded. “Cognitive scores of more than 7,800 middle-aged and older Danish twins at baseline did not indicate an association with previous PPI use. Follow-up data on more than 4,000 of these twins did not indicate that use of this class of drugs was correlated to cognitive decline.”
Odense University Hospital provided partial funding. Dr. Wod had no disclosures. Three coinvestigators disclosed ties to AstraZeneca and Bayer AG.
SOURCE: Wod M et al. Clin Gastro Hepatol. 2018 Feb 3. doi: 10.1016/j.cgh.2018.01.034.
FROM CLINICAL GASTROENTEROLOGY AND HEPATOLOGY
Key clinical point: Use of proton pump inhibitors was not associated with cognitive decline.
Major finding: Mean baseline cognitive scores did not significantly differ between PPI users and nonusers, nor did changes in cognitive scores over time.
Study details: Two population-based studies of twins in Denmark.
Disclosures: Odense University Hospital provided partial funding. Dr. Wod had no disclosures. Three coinvestigators disclosed ties to AstraZeneca and Bayer AG.
Source: Wod M et al. Clin Gastro Hepatol. 2018 Feb 3. doi: 10.1016/j.cgh.2018.01.034.
Alpha fetoprotein boosted detection of early-stage liver cancer
For patients with cirrhosis, adding serum alpha fetoprotein testing to ultrasound significantly boosted its ability to detect early-stage hepatocellular carcinoma, according to the results of a systematic review and meta-analysis reported in the May issue of Gastroenterology.
Used alone, ultrasound detected only 45% of early-stage hepatocellular carcinomas (95% confidence interval, 30%-62%), reported Kristina Tzartzeva, MD, of the University of Texas, Dallas, with her associates. Adding alpha fetoprotein (AFP) increased this sensitivity to 63% (95% CI, 48%-75%; P = .002). Few studies evaluated alternative surveillance tools, such as CT or MRI.
Diagnosing liver cancer early is key to survival and thus is a central issue in cirrhosis management. However, the best surveillance strategy remains uncertain, hinging as it does on sensitivity, specificity, and cost. The American Association for the Study of Liver Diseases and the European Association for the Study of the Liver recommend that cirrhotic patients undergo twice-yearly ultrasound to screen for hepatocellular carcinoma (HCC), but they disagree about the value of adding serum biomarker AFP testing. Meanwhile, more and more clinics are using CT and MRI because of concerns about the unreliability of ultrasound. “Given few direct comparative studies, we are forced to primarily rely on indirect comparisons across studies,” the reviewers wrote.
To do so, they searched MEDLINE and Scopus and identified 32 studies of HCC surveillance that comprised 13,367 patients, nearly all with baseline cirrhosis. The studies were published from 1990 to August 2016.
Ultrasound detected HCC of any stage with a sensitivity of 84% (95% CI, 76%-92%), but its sensitivity for detecting early-stage disease was less than 50%. In studies that performed direct comparisons, ultrasound alone was significantly less sensitive than ultrasound plus AFP for detecting all stages of HCC (relative risk, 0.80; 95% CI, 0.72-0.88) and early-stage disease (0.78; 0.66-0.92). However, ultrasound alone was more specific than ultrasound plus AFP (RR, 1.08; 95% CI, 1.05-1.09).
Four studies of about 900 patients evaluated cross-sectional imaging with CT or MRI. In one single-center, randomized trial, CT had a sensitivity of 63% for detecting early-stage disease, but the 95% CI for this estimate was very wide (30%-87%) and CT did not significantly outperform ultrasound (Aliment Pharmacol Ther. 2013;38:303-12). In another study, MRI and ultrasound had significantly different sensitivities of 84% and 26% for detecting (usually) early-stage disease (JAMA Oncol. 2017;3[4]:456-63).
“Ultrasound currently forms the backbone of professional society recommendations for HCC surveillance; however, our meta-analysis highlights its suboptimal sensitivity for detection of hepatocellular carcinoma at an early stage. Using ultrasound in combination with AFP appears to significantly improve sensitivity for detecting early HCC with a small, albeit statistically significant, trade-off in specificity. There are currently insufficient data to support routine use of CT- or MRI-based surveillance in all patients with cirrhosis,” the reviewers concluded.
The National Cancer Institute and Cancer Prevention Research Institute of Texas provided funding. None of the reviewers had conflicts of interest.
SOURCE: Tzartzeva K et al. Gastroenterology. 2018 Feb 6. doi: 10.1053/j.gastro.2018.01.064.
FROM GASTROENTEROLOGY
Key clinical point: Ultrasound unreliably detects hepatocellular carcinoma, but adding alpha fetoprotein increases its sensitivity.
Major finding: Used alone, ultrasound detected only 47% of early-stage cases. Adding alpha fetoprotein increased this sensitivity to 63% (P = .002).
Study details: Systematic review and meta-analysis of 32 studies comprising 13,367 patients and spanning from 1990 to August 2016.
Disclosures: The National Cancer Institute and Cancer Prevention Research Institute of Texas provided funding. None of the researchers had conflicts of interest.
Source: Tzartzeva K et al. Gastroenterology. 2018 Feb 6. doi: 10.1053/j.gastro.2018.01.064.