User login
Drug reaction or metastatic lung cancer?
A 76-year-old man with ulcerative colitis presented with a 1-week history of low-grade fever and progressive dyspnea. He was taking infliximab for the ulcerative colitis. He was known to be negative for human immunodeficiency virus.
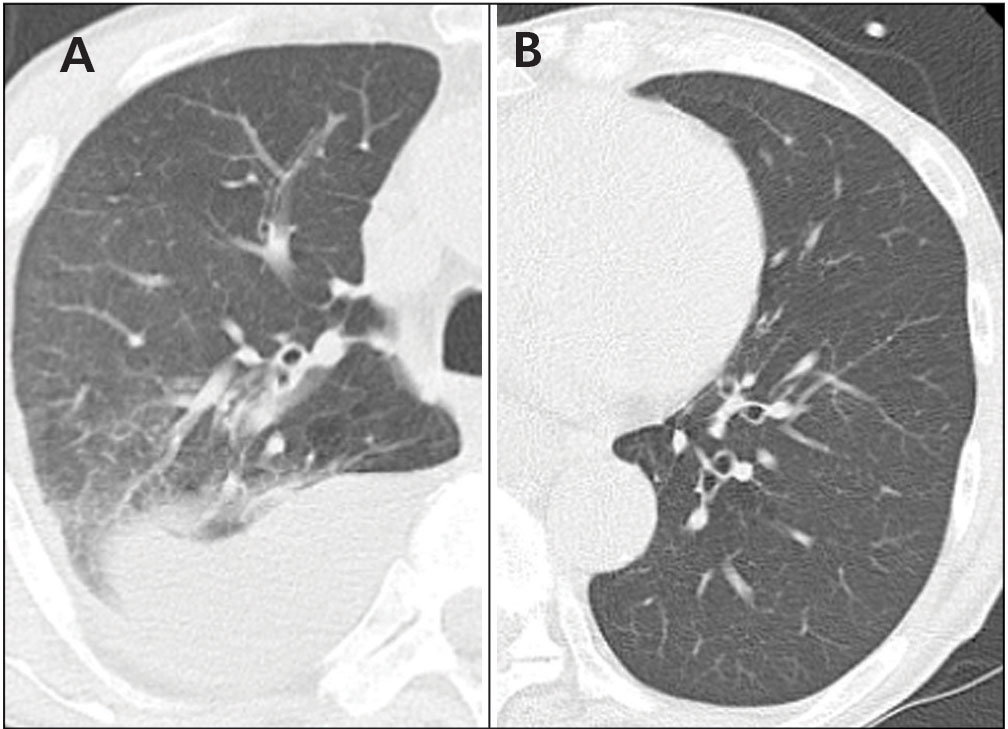
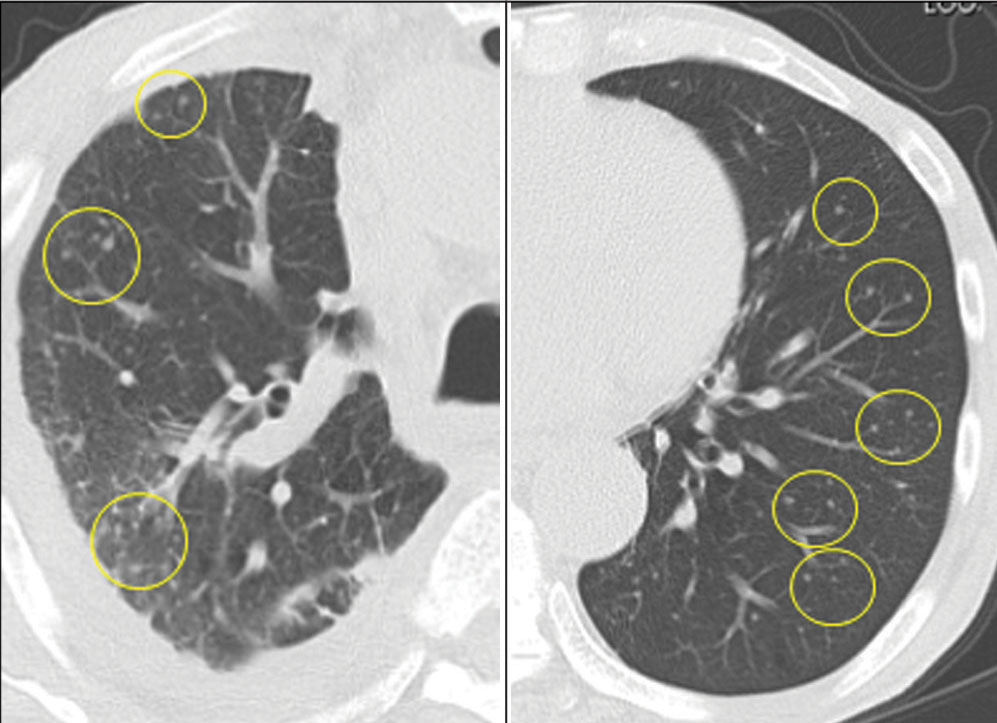
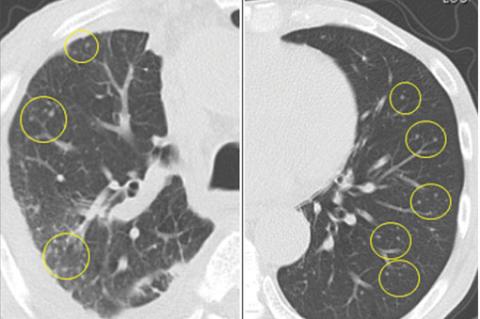
Since the M tuberculosis cultured from his lung proved to be sensitive to the antituberculosis drugs, we suspected that the nodules were a paradoxical reaction to the drug therapy, and thus we continued the treatment because of the continued low-grade fever. After 9 months of therapy, the fever had resolved and the nodules had disappeared, confirming our suspicion of a paradoxical reaction. The number of lymphocytes gradually increased during drug therapy.
Paradoxical reaction during tuberculosis treatment is defined as a worsening of pre-existing lesions or as the emergence of new lesions during appropriate therapy.1,2 The diagnosis is sometimes difficult, since new lesions can resemble other lung diseases. However, a paradoxical reaction involving randomly distributed nodules is rare and radiographically resembles metastatic lung cancer. Clinicians should be aware of this type of reaction in patients on tuberculosis therapy.
- Cheng SL, Wang HC, Yang PC. Paradoxical response during anti-tuberculosis treatment in HIV-negative patients with pulmonary tuberculosis. Int J Tuberc Lung Dis 2007; 11:1290–1295.
- Narita M, Ashkin D, Hollender ES, Pitchenik AE. Paradoxical worsening of tuberculosis following antiretroviral therapy in patients with AIDS. Am J Respir Crit Care Med 1998; 158:157–161.
A 76-year-old man with ulcerative colitis presented with a 1-week history of low-grade fever and progressive dyspnea. He was taking infliximab for the ulcerative colitis. He was known to be negative for human immunodeficiency virus.
Since the M tuberculosis cultured from his lung proved to be sensitive to the antituberculosis drugs, we suspected that the nodules were a paradoxical reaction to the drug therapy, and thus we continued the treatment because of the continued low-grade fever. After 9 months of therapy, the fever had resolved and the nodules had disappeared, confirming our suspicion of a paradoxical reaction. The number of lymphocytes gradually increased during drug therapy.
Paradoxical reaction during tuberculosis treatment is defined as a worsening of pre-existing lesions or as the emergence of new lesions during appropriate therapy.1,2 The diagnosis is sometimes difficult, since new lesions can resemble other lung diseases. However, a paradoxical reaction involving randomly distributed nodules is rare and radiographically resembles metastatic lung cancer. Clinicians should be aware of this type of reaction in patients on tuberculosis therapy.
A 76-year-old man with ulcerative colitis presented with a 1-week history of low-grade fever and progressive dyspnea. He was taking infliximab for the ulcerative colitis. He was known to be negative for human immunodeficiency virus.
Since the M tuberculosis cultured from his lung proved to be sensitive to the antituberculosis drugs, we suspected that the nodules were a paradoxical reaction to the drug therapy, and thus we continued the treatment because of the continued low-grade fever. After 9 months of therapy, the fever had resolved and the nodules had disappeared, confirming our suspicion of a paradoxical reaction. The number of lymphocytes gradually increased during drug therapy.
Paradoxical reaction during tuberculosis treatment is defined as a worsening of pre-existing lesions or as the emergence of new lesions during appropriate therapy.1,2 The diagnosis is sometimes difficult, since new lesions can resemble other lung diseases. However, a paradoxical reaction involving randomly distributed nodules is rare and radiographically resembles metastatic lung cancer. Clinicians should be aware of this type of reaction in patients on tuberculosis therapy.
- Cheng SL, Wang HC, Yang PC. Paradoxical response during anti-tuberculosis treatment in HIV-negative patients with pulmonary tuberculosis. Int J Tuberc Lung Dis 2007; 11:1290–1295.
- Narita M, Ashkin D, Hollender ES, Pitchenik AE. Paradoxical worsening of tuberculosis following antiretroviral therapy in patients with AIDS. Am J Respir Crit Care Med 1998; 158:157–161.
- Cheng SL, Wang HC, Yang PC. Paradoxical response during anti-tuberculosis treatment in HIV-negative patients with pulmonary tuberculosis. Int J Tuberc Lung Dis 2007; 11:1290–1295.
- Narita M, Ashkin D, Hollender ES, Pitchenik AE. Paradoxical worsening of tuberculosis following antiretroviral therapy in patients with AIDS. Am J Respir Crit Care Med 1998; 158:157–161.
The Leser-Trélat sign
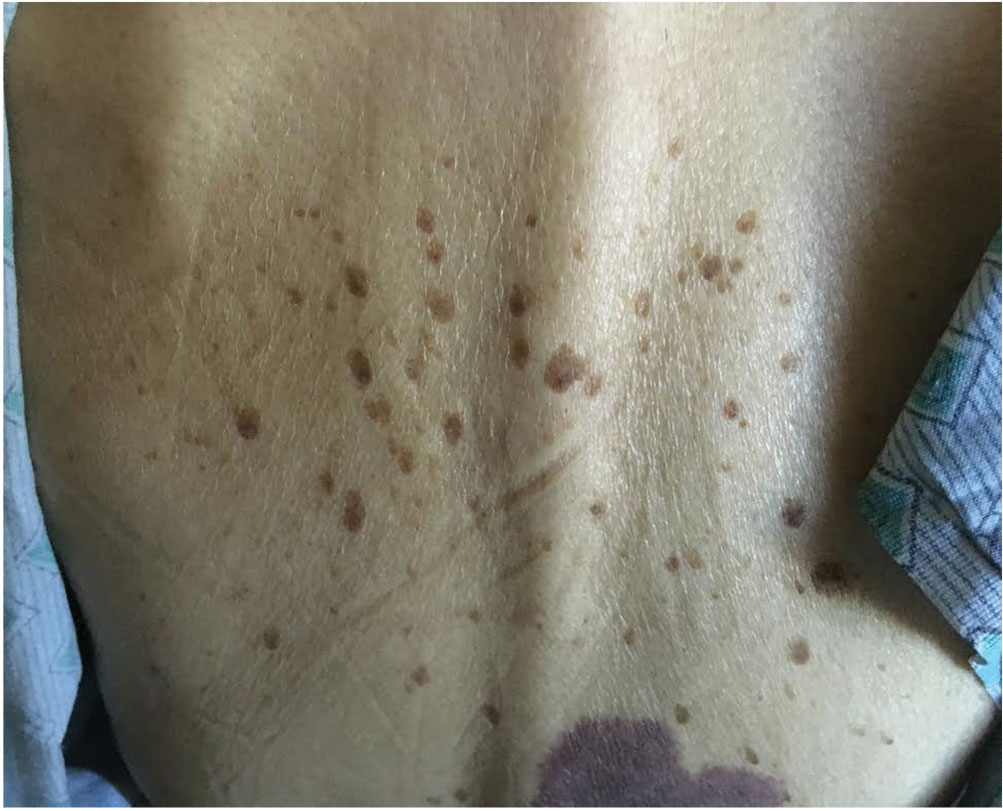
An 85-year-old woman presented with night sweats, dry cough, and an unintended 30-pound weight loss over the preceding 6 months. She also reported the sudden onset of “itchy moles” on her back.
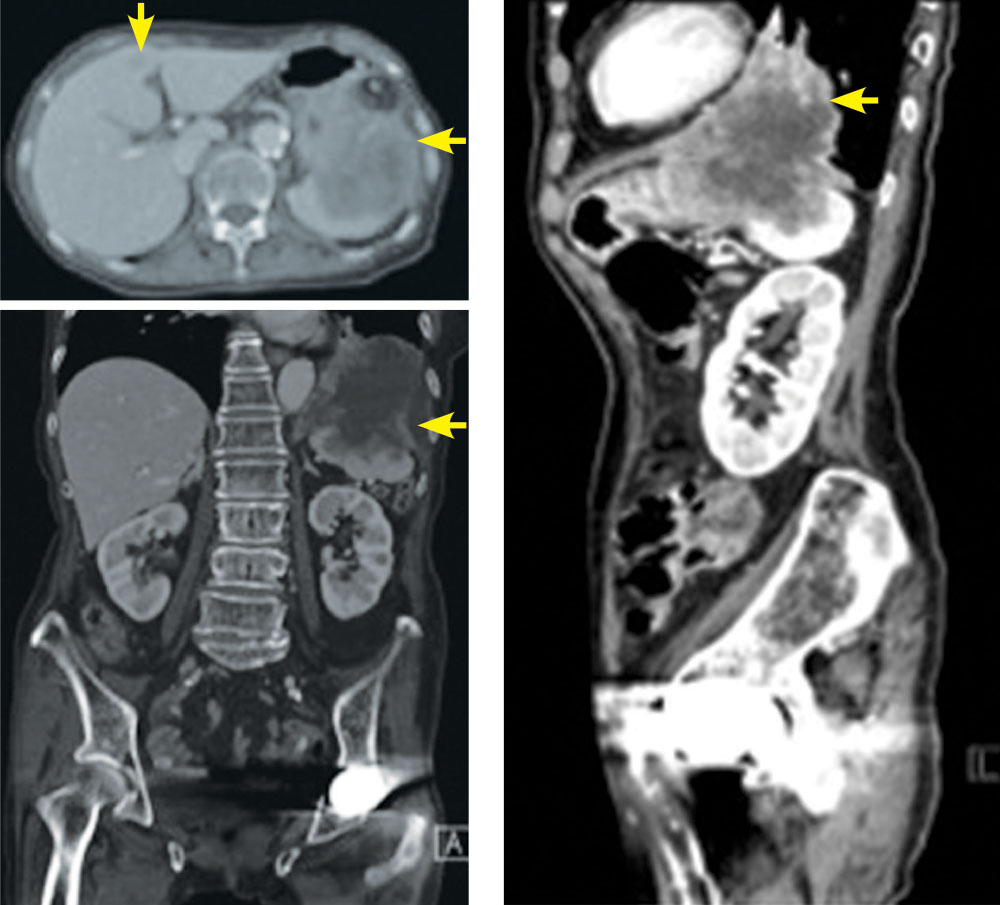
KERATOSES AND MALIGNANCY
The Leser-Trélat sign is the sudden development of multiple pruritic seborrheic keratoses, often associated with malignancy.1–4 Roughly half of these associated malignancies are adenocarcinomas, most commonly of the stomach, breast, colon, or rectum. However, it can be seen in other malignancies, including lymphoma, leukemia, and squamous cell carcinoma, as in this case.
Eruption of seborrheic keratoses has also been observed with benign neoplasms, pregnancy, human immunodeficiency virus infections, and the use of adalimumab, which indicates that the Leser-Trélat sign is not very specific. Despite these concerns, the eruption of multiple seborrheic keratoses should continue to trigger the thought of an internal malignancy in the differential diagnosis.
- Ehst BD, Minzer-Conzetti K, Swerdlin A, Devere TS. Cutaneous manifestations of internal malignancy. Curr Probl Surg 2010; 47:384–445.
- Schwartz RA. Sign of Leser-Trélat. J Am Acad Dermatol 1996; 35:88–95.
- Ellis DL, Yates RA. Sign of Leser-Trélat. Clin Dermatol 1993; 11:141–148.
- Thiers BH, Sahn RE, Callen JP. Cutaneous manifestations of internal malignancy. CA Cancer J Clin 2009; 59:73–98.
An 85-year-old woman presented with night sweats, dry cough, and an unintended 30-pound weight loss over the preceding 6 months. She also reported the sudden onset of “itchy moles” on her back.
KERATOSES AND MALIGNANCY
The Leser-Trélat sign is the sudden development of multiple pruritic seborrheic keratoses, often associated with malignancy.1–4 Roughly half of these associated malignancies are adenocarcinomas, most commonly of the stomach, breast, colon, or rectum. However, it can be seen in other malignancies, including lymphoma, leukemia, and squamous cell carcinoma, as in this case.
Eruption of seborrheic keratoses has also been observed with benign neoplasms, pregnancy, human immunodeficiency virus infections, and the use of adalimumab, which indicates that the Leser-Trélat sign is not very specific. Despite these concerns, the eruption of multiple seborrheic keratoses should continue to trigger the thought of an internal malignancy in the differential diagnosis.
An 85-year-old woman presented with night sweats, dry cough, and an unintended 30-pound weight loss over the preceding 6 months. She also reported the sudden onset of “itchy moles” on her back.
KERATOSES AND MALIGNANCY
The Leser-Trélat sign is the sudden development of multiple pruritic seborrheic keratoses, often associated with malignancy.1–4 Roughly half of these associated malignancies are adenocarcinomas, most commonly of the stomach, breast, colon, or rectum. However, it can be seen in other malignancies, including lymphoma, leukemia, and squamous cell carcinoma, as in this case.
Eruption of seborrheic keratoses has also been observed with benign neoplasms, pregnancy, human immunodeficiency virus infections, and the use of adalimumab, which indicates that the Leser-Trélat sign is not very specific. Despite these concerns, the eruption of multiple seborrheic keratoses should continue to trigger the thought of an internal malignancy in the differential diagnosis.
- Ehst BD, Minzer-Conzetti K, Swerdlin A, Devere TS. Cutaneous manifestations of internal malignancy. Curr Probl Surg 2010; 47:384–445.
- Schwartz RA. Sign of Leser-Trélat. J Am Acad Dermatol 1996; 35:88–95.
- Ellis DL, Yates RA. Sign of Leser-Trélat. Clin Dermatol 1993; 11:141–148.
- Thiers BH, Sahn RE, Callen JP. Cutaneous manifestations of internal malignancy. CA Cancer J Clin 2009; 59:73–98.
- Ehst BD, Minzer-Conzetti K, Swerdlin A, Devere TS. Cutaneous manifestations of internal malignancy. Curr Probl Surg 2010; 47:384–445.
- Schwartz RA. Sign of Leser-Trélat. J Am Acad Dermatol 1996; 35:88–95.
- Ellis DL, Yates RA. Sign of Leser-Trélat. Clin Dermatol 1993; 11:141–148.
- Thiers BH, Sahn RE, Callen JP. Cutaneous manifestations of internal malignancy. CA Cancer J Clin 2009; 59:73–98.

Big heart, small ring
A 58-year-old man presents with a 1-year history of chronic daytime fatigue, low libido, and difficulty achieving erections. He is upset: his wife suspects him of having an extramarital affair because, in addition to problems with his sexual performance, he has not been wearing his wedding ring. The patient explains that the ring has become too small for his finger and that he has never cheated on his wife. His wife has also been complaining that he snores loudly at night.
The patient works as an accountant. He has no known allergies to medications and takes no medications or supplements. He has no surgical history. He has never smoked tobacco or abused illicit drugs. He drinks a glass of wine once a week.
His father died at age 78 of a myocardial infarction; his 86-year-old mother has hypertension. He has no siblings. His 28-year-old biological son is healthy.
Physical examination
His temperature is 97.9°F (36.6°C), blood pressure 150/90 mm Hg, heart rate 80 per minute, respiratory rate 12 per minute, and oxygen saturation 98% on room air. His height is 5 feet 11 inches (180 cm), weight 250 lb (113 kg), and body mass index 35 kg/m2.
His forehead is wide with deep creases, his jaw, nose, and lower lip are prominent, and his tongue, hands, and feet are large. He has mild thyromegaly with no palpable nodules.
On cardiac examination, his point of maximal impulse is 3 cm lateral to the left midclavicular line in the fifth intercostal space; he has normal S1 and S2 with no murmurs, rubs, or gallops. The lungs are clear on auscultation. His abdomen is soft, nontender, and nondistended; the liver is palpated 2 cm below the costal margin. His extremities are not edematous.
LABORATORY TESTING
1. In addition to a complete blood cell count and comprehensive metabolic panel, which is the most appropriate test to order?
- Growth hormone (GH) level
- Insulin-like growth factor 1 (IGF-1) level
- GH and IGF-1 levels
- IGF-2 level
Acromegaly, an overview
The patient’s history of snoring and daytime fatigue suggests obstructive sleep apnea, which together with his enlarging ring finger size, wide forehead with deep creases, prominent jaw, nose, and lower lip, and enlarged thyroid, heart, and liver suggests acromegaly.
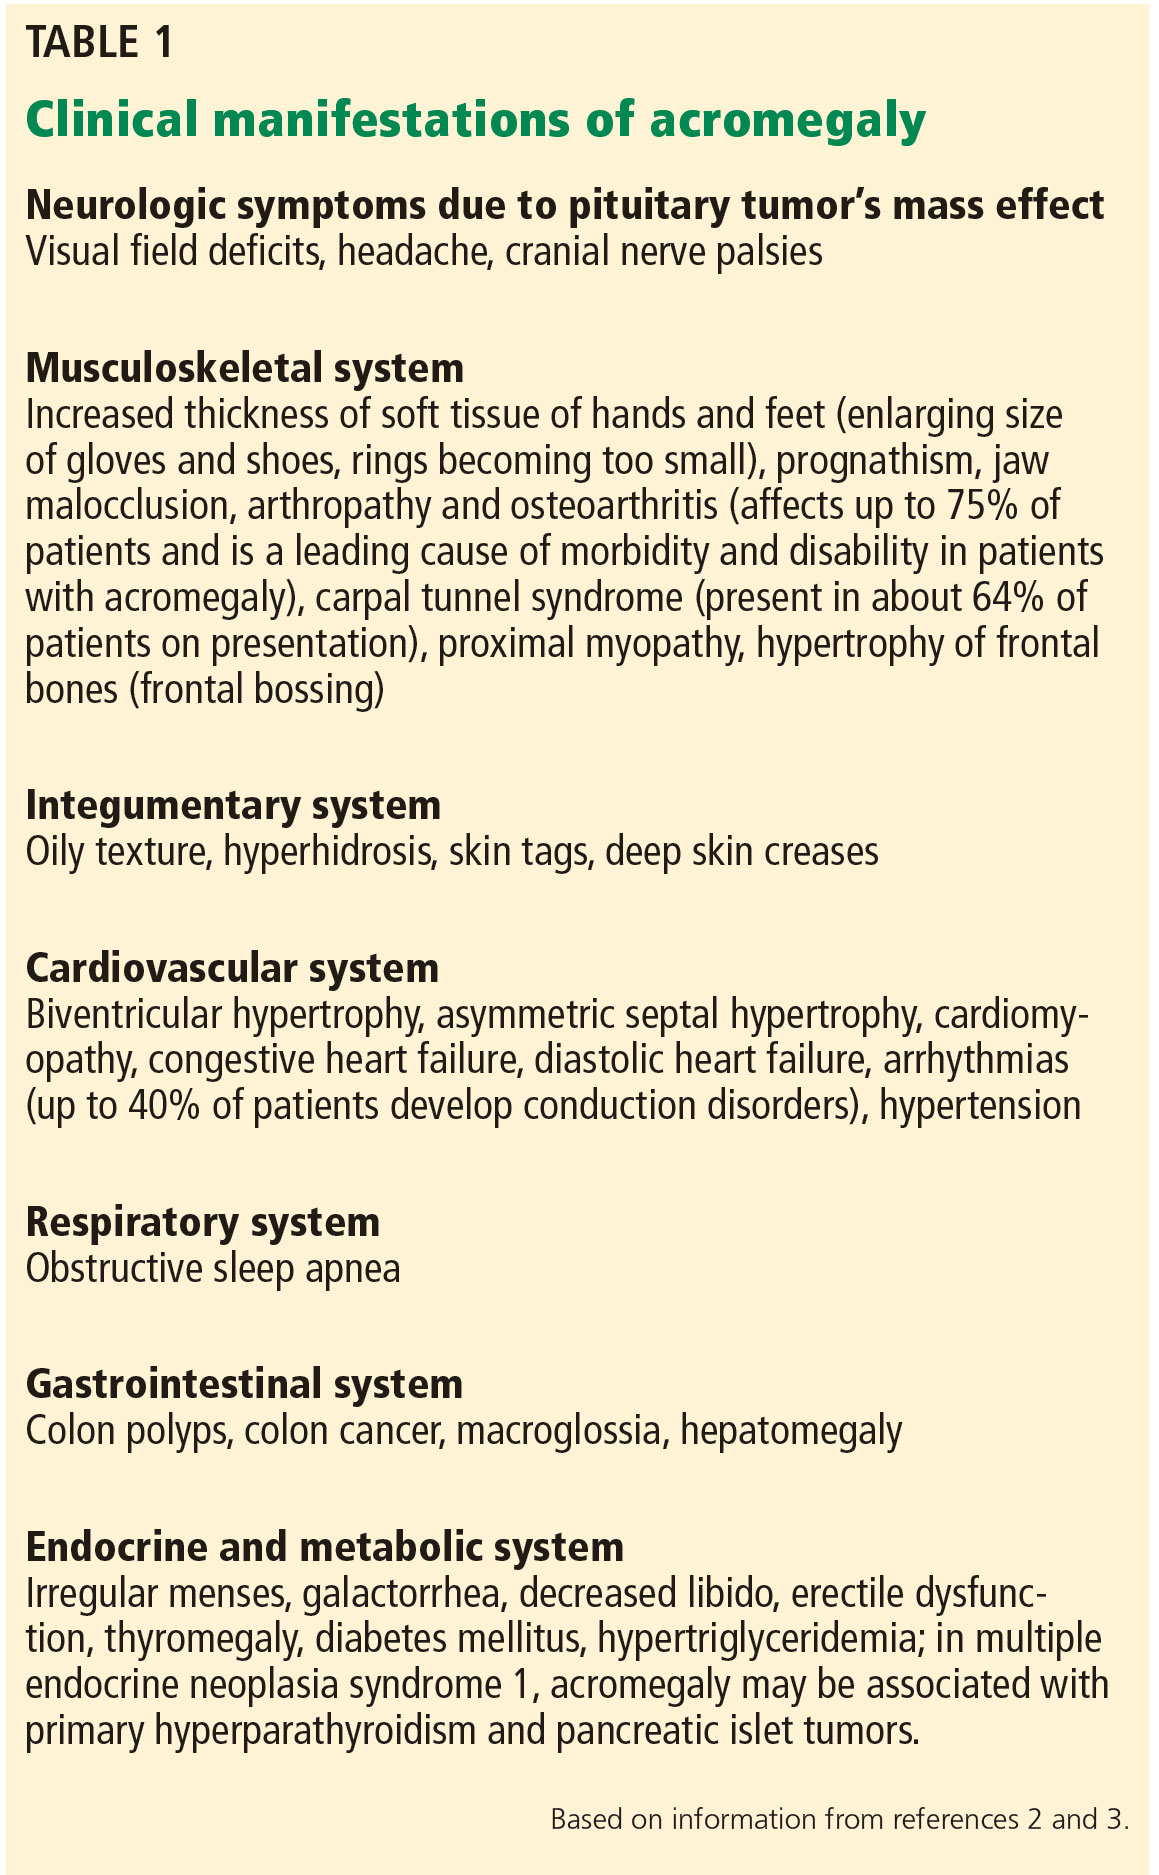
In most cases, acromegaly is caused by a GH-secreting pituitary adenoma. Rare causes include hypothalamic tumors that secrete GH-releasing hormone (GHRH) and ectopic secretion of GHRH or GH.1 Pseudoacromegaly, a mimic, is characterized by acromegalic features without hypersecretion of GH and with normal IGF-1 levels.4
The prevalence of acromegaly is 36 to 60 cases per million, and its annual incidence is 3 to 4 per million.5
With this patient’s presentation, the most appropriate next step is to order an IGF-1 level to screen for acromegaly.
GH secretion is pulsatile, IGF-1 secretion is not
GH is synthesized and stored in somatotroph cells, which account for more than 50% of pituitary hormone-secreting cells.6 Three hormones regulate synthesis and secretion of GH: GHRH, ghrelin, and somatostatin.7 GH secretion is pulsatile, with minimal basal secretion dependent on sex, age, neurotransmitters, exercise, and stress.7 It exerts its physiologic effects through an interaction with the GH receptor, a single-chain transmembrane glycoprotein.8,9
A GH-secreting adenoma develops when pituitary somatotroph cells undergo a monoclonal expansion. Mutations of various genes such as GNAS, PRKAR1A, and AIP are suspected of triggering such expansion. Disruption of the MENIN gene leads to multiple endocrine neoplasia syndrome 1, a combination of pituitary adenoma, pancreatic tumor, and primary hyperparathyroidism.9 The pattern of cytoplasmic keratin in somatotroph cells defines 2 histologic subtypes: densely granulated and sparsely granulated. The latter subtype is associated with more-invasive lesions that are seen more often in younger patients and are less responsive to somatostatin ligand therapy.10
GH induces transcription of IGF-1, mostly in the liver. In contrast to GH, IGF-1 secretion is not pulsatile, and therefore IGF-1 can be measured more reliably in serum, and the results can be interpreted according to age- and sex-adjusted reference ranges.
The IGF-1 level is a very sensitive test, but it is not very specific. It can be falsely elevated in pregnancy, in patients on estrogen replacement therapy, and in late adolescence.11 In addition, it may be difficult to interpret the IGF-1 level in the setting of malnutrition, severe hyperglycemia, renal or hepatic failure, and hypothyroidism.11,12
Nonpulsatile secretion and high sensitivity make the IGF-1 level the screening test of choice for acromegaly.9,12 In contrast, because of the pulsatile nature of GH synthesis, one cannot rely on a random GH level alone to detect the hormone’s hypersecretion.
IGF-2 has no role in acromegaly
IGF-2, produced mainly by the liver, plays an important role in promoting fetal growth. IGF-2 may induce hypoglycemia when secreted by some mesenchymal tumors.13 This hormone has no role in the pathogenesis of acromegaly and should not be measured in this patient.
CASE CONTINUED: FURTHER TESTING
The patient’s IGF-1 level is 590 ng/mL; the reference range for his age and sex is 68 to 245 ng/mL.
A sleep study confirms obstructive sleep apnea, and the patient is started on continuous positive airway pressure at night, with some reduction of his fatigue.
2. What is the most appropriate next step?
- Order magnetic resonance imaging (MRI) of the pituitary with gadolinium contrast
- Perform a GH suppression test with a 75-g oral glucose load
- Perform a GH stimulation test
- Refer the patient to a neurosurgeon for a consultation
The most appropriate next step is a GH suppression test, performed by measuring the plasma GH level 2 hours after giving 75 g of glucose by mouth. This confirmatory test is necessary because the IGF-1 level can be falsely elevated. The normal response to an oral glucose challenge is suppression of the GH level to below 1 μg/L. Failure to suppress GH confirms the diagnosis of acromegaly.14
A GH stimulation test with insulin-induced hypoglycemia or with GHRH-arginine would be appropriate if GH deficiency were suspected rather than hypersecretion.
Imaging of the pituitary with MRI before obtaining biochemical confirmation of the diagnosis of acromegaly may mislead the physician because MRI does not determine the functional status of a pituitary tumor. Correct treatment of a pituitary tumor depends on whether the tumor causes hypersecretion or deficiency of any pituitary hormones.
Referral to a neurosurgeon for a consultation is premature until a biochemical diagnosis of acromegaly is made and a pituitary adenoma is subsequently demonstrated by imaging.
3. The patient’s GH level is 10 μg/L 2 hours after oral administration of 75 g of glucose. What is the most appropriate next step?
- Radiography of the skull to image the pituitary at a low cost
- MRI of the pituitary with contrast after making sure the patient’s renal function is normal
- MRI of the pituitary without contrast
- Computed tomography of the head
The next step is MRI of the pituitary with contrast (gadolinium) after obtaining blood urea nitrogen and creatinine measurements to make sure the patient’s renal function is normal.14
Gadolinium contrast is contraindicated in patients with severely reduced renal function (glomerular filtration rate < 30 mL/min/1.73 m2) because of the risk of nephrogenic systemic fibrosis. In such a case, MRI without contrast would be appropriate.
MRI is the most sensitive imaging test for detecting a pituitary adenoma, as it can detect tumors as small as 2 mm. A pituitary macroadenoma (> 10 mm in diameter) is detected in more than 75% of patients with acromegaly at diagnosis. The tumor often invades one or both cavernous sinuses or extends to the suprasellar region, possibly impinging on the optic chiasm.15
If MRI is contraindicated, computed tomography of the head should be performed.
CASE CONTINUED: IMAGING
The patient’s comprehensive metabolic panel is normal, but his fasting plasma glucose is 135 mg/dL (reference range 74–99). Pituitary MRI with contrast shows a 3-cm pituitary adenoma with suprasellar extension, impinging on the optic chiasm and invading the right cavernous sinus.
4. In addition to repeating the fasting plasma glucose and measuring hemoglobin A1c, what is the most appropriate next step in managing this patient?
- Measure the prolactin, morning serum cortisol, total testosterone, follicle-stimulating hormone (FSH), luteinizing hormone (LH), thyroid-stimulating hormone (TSH), and free thyroxine (T4) levels; refer the patient to an ophthalmologist for a formal evaluation of visual fields
- Measure these hormone levels; perform a gross evaluation of the visual fields and refer the patient to an ophthalmologist only if visual field deficits are found on the gross examination
- Measure these hormone levels; refer the patient to an ophthalmologist only if he complains of vision changes
- Do not order any additional tests; instruct the patient to call the office if he develops any vision changes
This patient should have all of these hormones measured. In addition, given that his macroadenoma is impinging on the optic chiasm, he should be referred to an ophthalmologist for a formal evaluation of visual fields even if the latter are intact on gross examination and even if the patient does not complain of any visual changes.
Abnormalities of hormones other than GH and IGF-1 in acromegaly
Secretion of pituitary hormones other than GH and IGF-1 must be assessed.
Prolactin. GH-secreting tumors also secrete prolactin in up to one-third of patients, with the resulting hyperprolactinemia contributing to hypogonadism.11 Prolactin hypersecretion should be distinguished from hyperprolactinemia caused by pituitary stalk compression, which may be evident on MRI.
Measuring the serum prolactin level with 1:100 dilution to counteract the “hook effect” may unmask severe hyperprolactinemia due to a large macroprolactinoma. (The hook effect occurs when the prolactin level is so high that there is not enough antibody in the assay to bind both ends of all the prolactin molecules present, causing the reading to be falsely low.).
Cortisol, T4, testosterone. Patients with acromegaly may develop central adrenal insufficiency, central hypothyroidism, and central hypogonadism; these hormonal deficits may occur in isolation or in combination.
Also, patients should be assessed for comorbidities such as colon cancer (all patients with acromegaly require a colonoscopy, as acromegaly raises the risk of colon cancer), diabetes mellitus, hypertension, cardiomyopathy, and sleep apnea.16
Visual field loss may be insidious
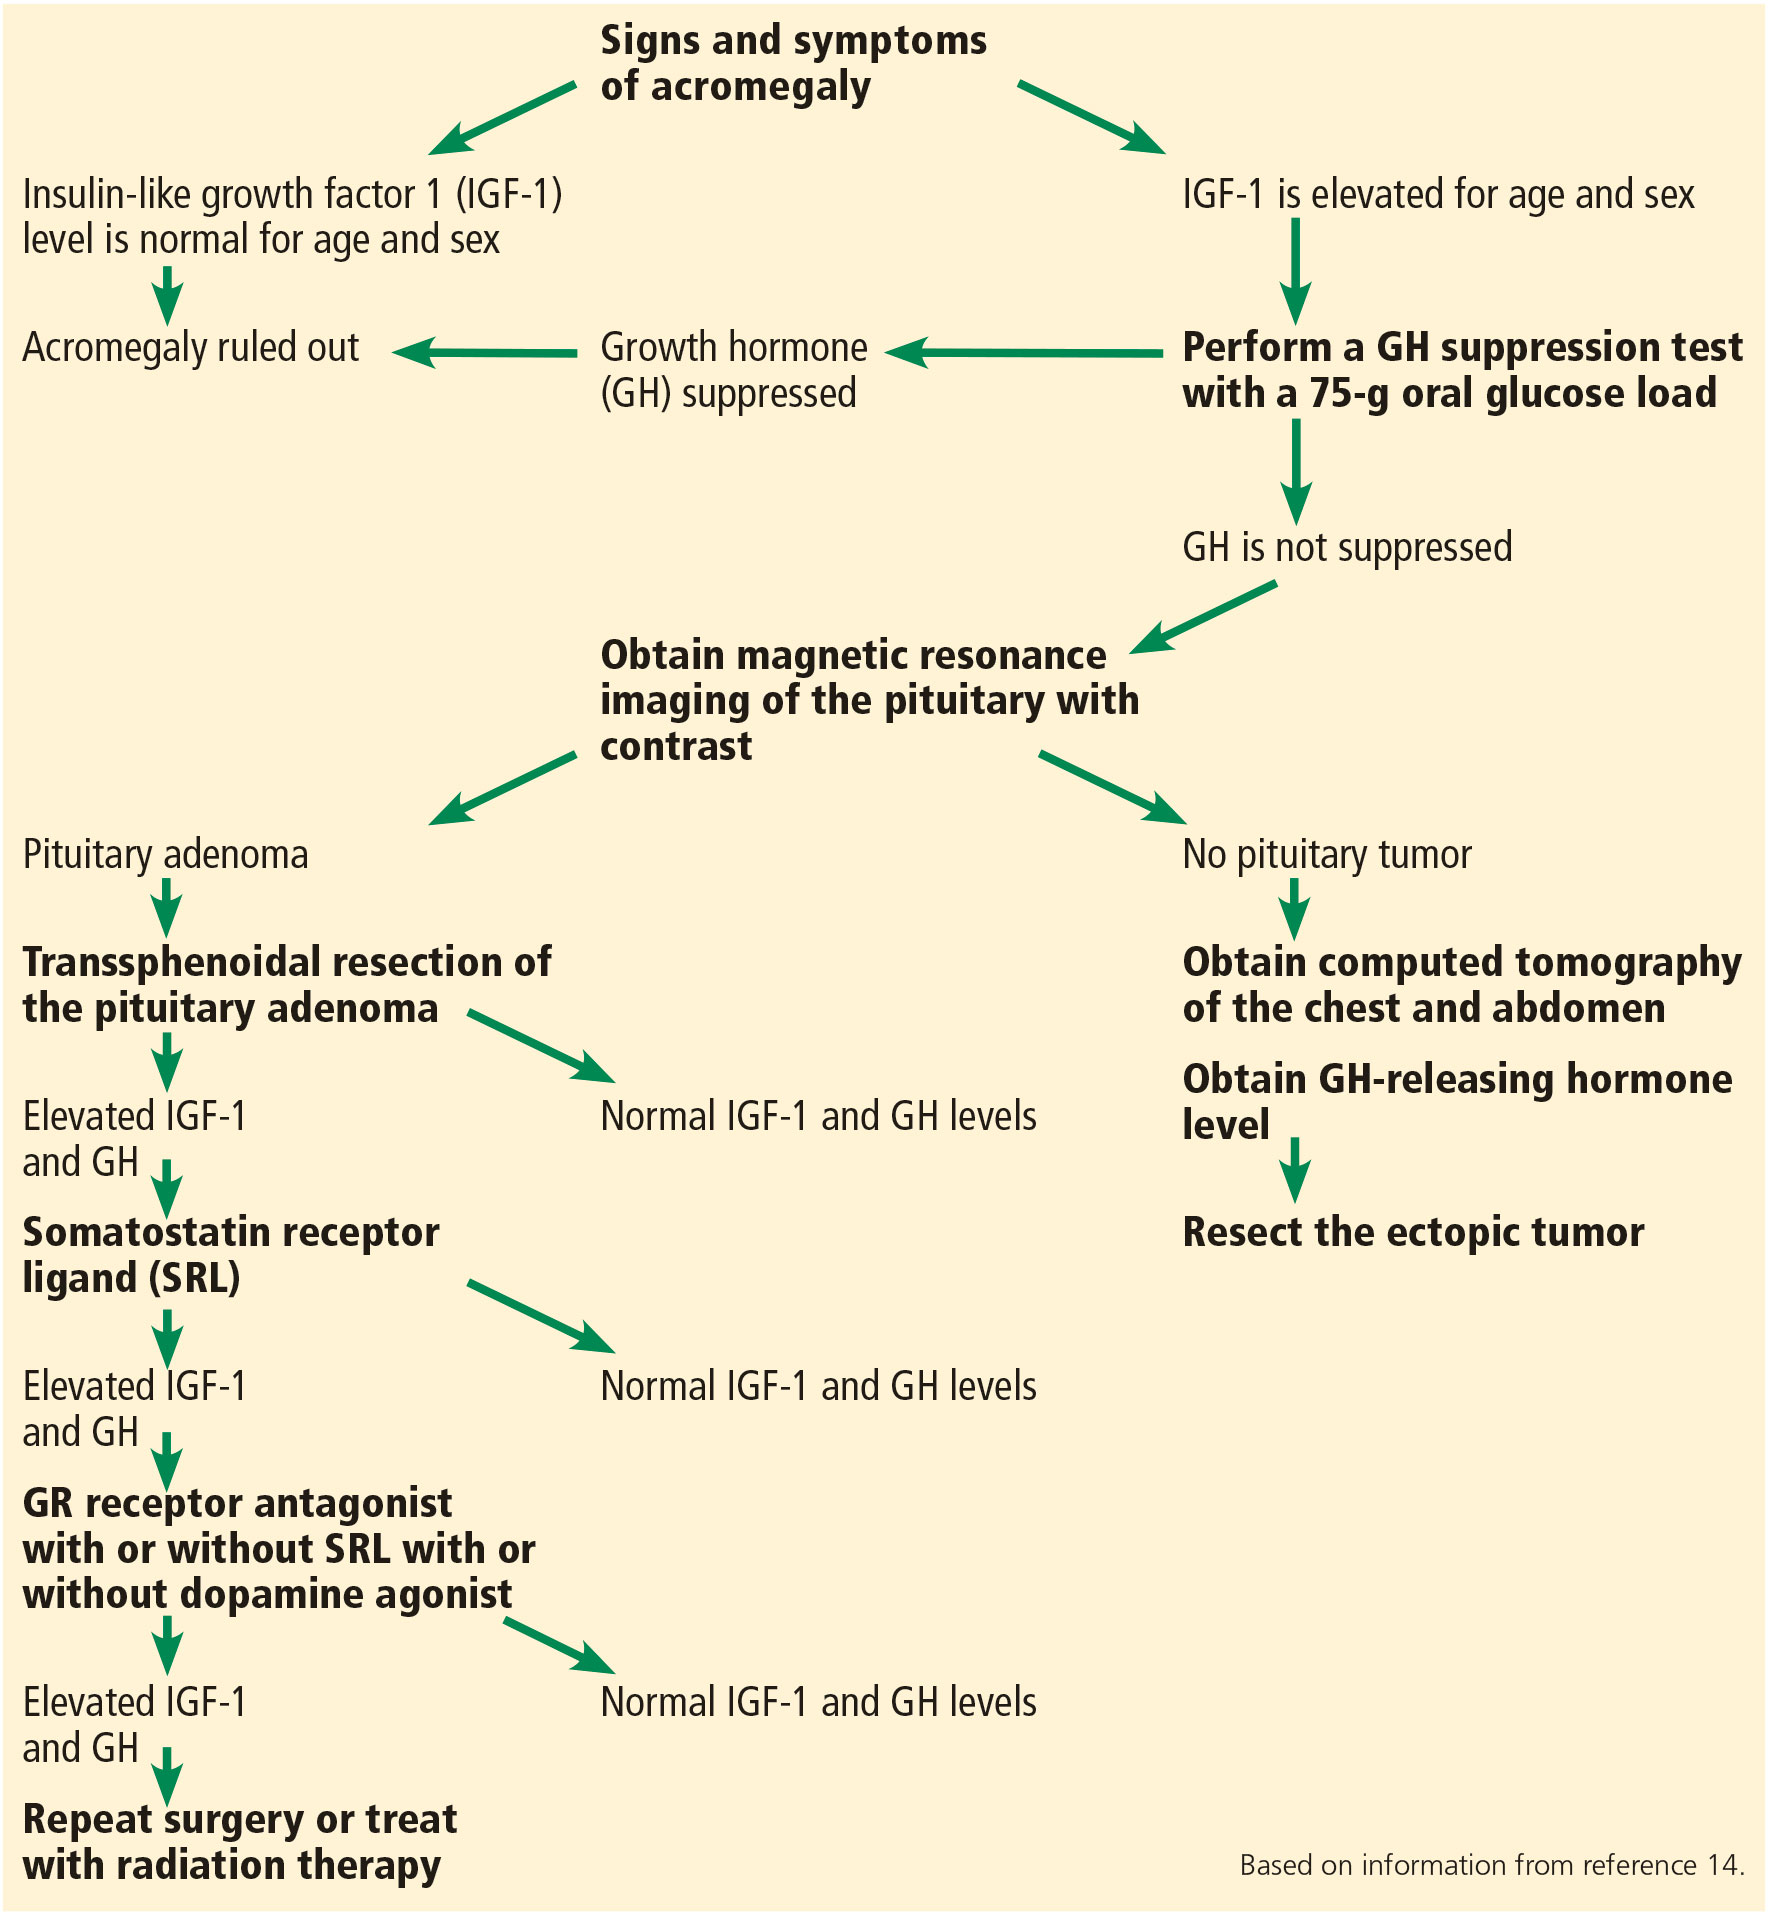
The diagnostic and treatment algorithm for acromegaly is summarized in Figure 1.
CASE CONTINUED: LABORATORY VALUES, TREATMENT OPTIONS
Our patient’s repeat fasting plasma glucose is 137 mg/dL; his hemoglobin A1c is 7.3%, consistent with diabetes mellitus secondary to acromegaly. Other laboratory values:
- Morning cortisol level 15 μg/dL (reference range 5.3–22.5),
- Prolactin 23 ng/mL, confirmed with 1:100 dilution (4.0–15.2)
- Total testosterone 59 ng/dL (193–824)
- LH 2.1 mIU/mL (1.8–10.8)
- FSH 3.0 mIU/mL (1.5–12.4)
- TSH 2.5 mIU/L (0.5–4.5)
- Free T4 1.3 ng/dL (0.9–1.7).
The patient is started on metformin 500 mg by mouth twice a day, counseled on a healthy diet, and informed that his diabetes may be a complication of his acromegaly. He is anxious to learn how his acromegaly can be treated.
5. What treatment would you recommend for the patient’s acromegaly?
- Medical treatment first, then transsphenoidal resection of the pituitary macroadenoma if medical treatment fails
- Medical treatment first, radiotherapy if medical treatment fails, and transsphenoidal resection of the pituitary macroadenoma as a last resort
- Transsphenoidal resection of the pituitary macroadenoma first, medical treatment if surgery fails, and radiotherapy if both surgery and medical treatment fail
- Taking a safe, conservative approach, monitoring IGF-1 levels frequently; starting medical treatment if acromegaly does not go into remission in 1 year
The initial treatment of choice for most patients with acromegaly is resection of the pituitary tumor.
A transsphenoidal approach is used for most patients; only rarely is craniotomy necessary. Endoscopic and microsurgical techniques reduce postoperative morbidity.17 Postoperative complications include symptoms related to the transsphenoidal approach (nasal congestion, sinusitis, epistaxis), cerebrospinal fluid leak, hemorrhage, meningitis, stroke, visual impairment, vascular damage, transient or permanent diabetes insipidus, and hypopituitarism. The surgical mortality rate is less than 0.5%.18,19
Successful resection of a pituitary tumor would lead to normalization of the IGF-1 level, a drop of the GH level to below 1 μg/L, and relief of the effect of the tumor pressing against other structures. An IGF-1 level and a random GH level should be obtained 12 weeks after the surgery.14 If the GH level is higher than 1 μg/L, a GH suppression test with a 75-g oral glucose load should be performed.14 MRI of the sella turcica should be done 12 weeks after surgery to visualize residual tumor and adjacent structures.14
A large tumor size, suprasellar extension, and high preoperative levels of IGF-1 and GH are associated with a lack of surgical success; however, surgical debulking should still be considered in patients with a low chance for surgical cure to improve the probability of achieving biochemical remission with postoperative medical and radiologic therapy.20
Medical therapy can be the initial treatment if the patient refuses surgery or if surgery is contraindicated because of severe comorbidities or because structural features of the tumor confer a high surgical risk (eg, if the adenoma encases the cavernous portion of a carotid artery).13 Medical therapy may shrink the tumor in some patients and may thereby make surgical resection easier and more likely to be successful.
Radiotherapy is usually reserved for patients whose tumors recur or persist postoperatively and who are resistant to or intolerant of medical therapy.14 The soft tissue changes caused by acromegaly may regress with treatment to some degree, but they are not likely to resolve completely; the bone changes do not regress.
CASE CONTINUED: MEDICAL TREATMENT
Three months after transsphenoidal resection of his pituitary macroadenoma, our patient’s laboratory values are as follows:
- IGF-1 400 ng/mL
- Morning cortisol 20 μg/dL
- Testosterone 95 ng/dL
- LH 2.1 mU/mL
- FSH 3.7 mU/mL
- Prolactin 12 ng/mL
- TSH 2.3 mIU/L
- Free T4 1.2 ng/dL
- Basic metabolic panel normal.
The patient denies frequent urination or increased thirst. Repeat MRI of the pituitary with contrast shows a residual 1.3-cm adenoma with no suprasellar extension.
6. What is the best next treatment choice for the patient?
- A GH receptor antagonist (pegvisomant)
- A somatostatin receptor ligand (SRL) such as octreotide
- Cabergoline (a dopamine agonist)
- A combination of an SRL and pegvisomant
An SRL such as octreotide would be the best choice for this patient.
The medical options for acromegaly are SRLs, pegvisomant, and cabergoline.21–23 The Endocrine Society guidelines recommend either an SRL or pegvisomant as the initial adjuvant medical therapy in patients with persistent disease after surgery.14 However, pegvisomant is much more expensive than any SRL, so an SRL would be a better choice in this patient. Also, pegvisomant does not suppress tumor growth, in contrast to SRLs, so SRLs are preferred in patients with large tumors abutting the optic chiasm.14
SRLs are used as primary therapy in patients who cannot be cured by surgery, have extensive cavernous sinus invasion, have no chiasmal compression, or are poor surgical candidates.
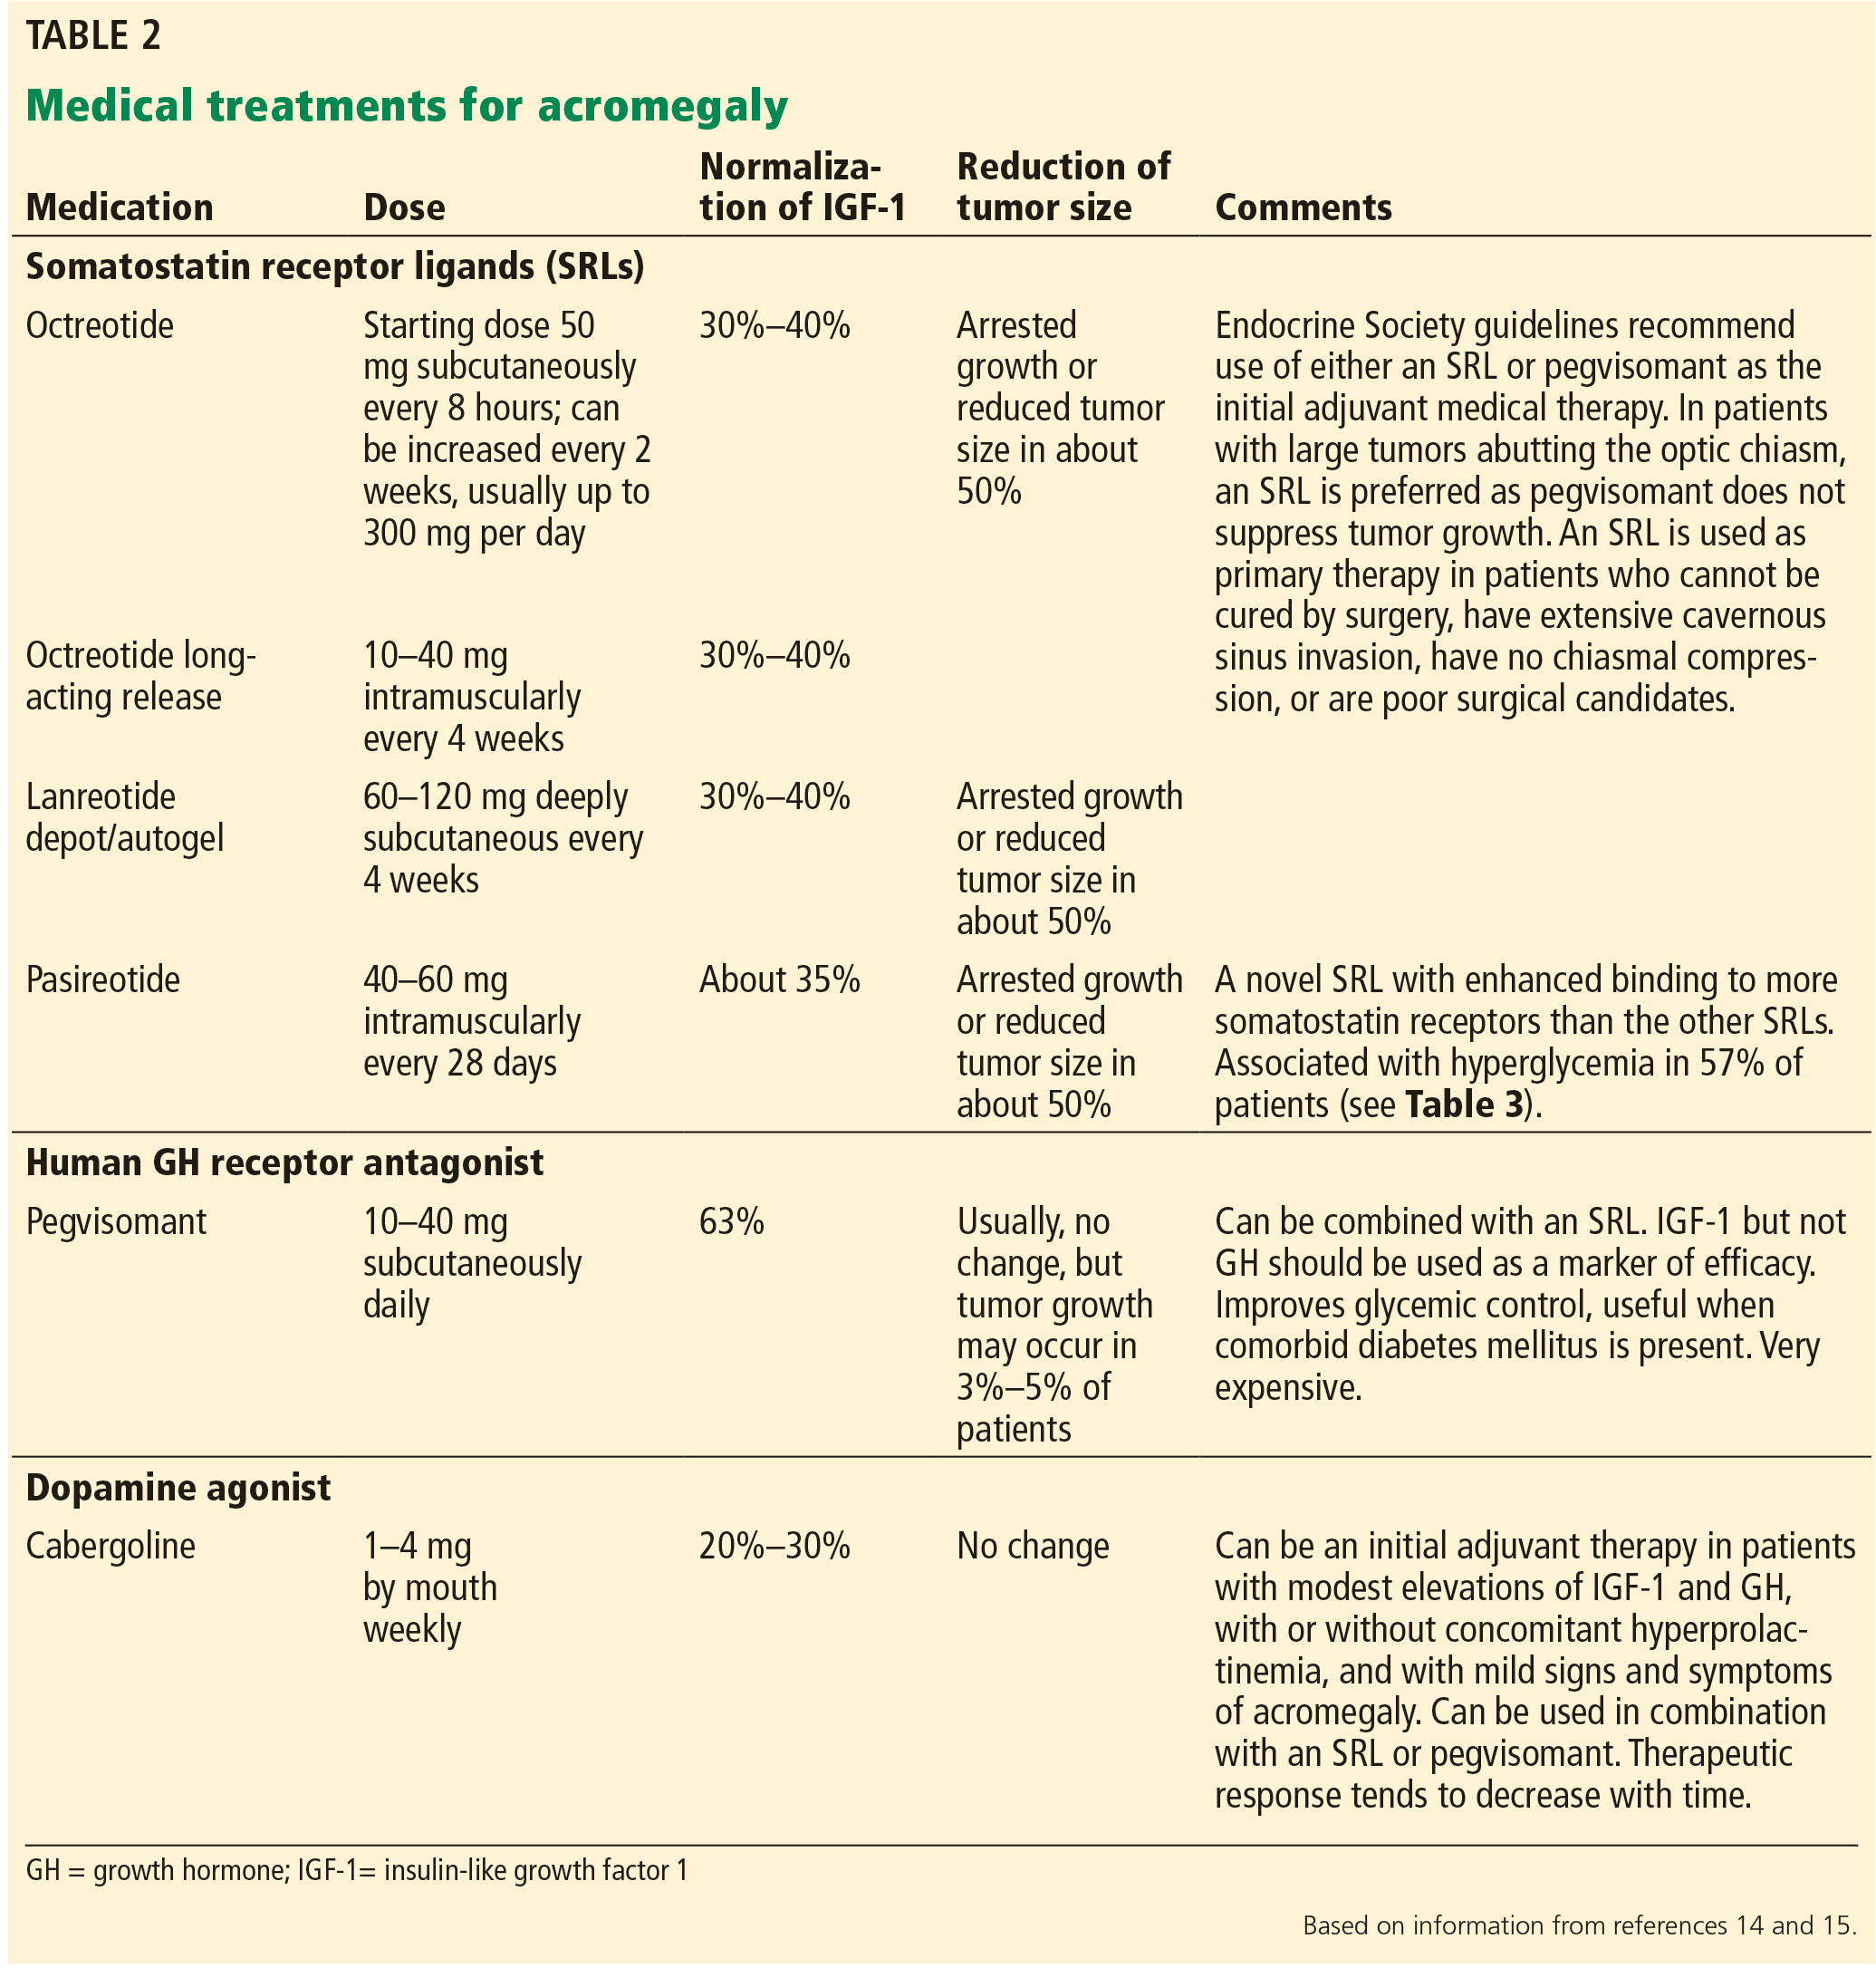
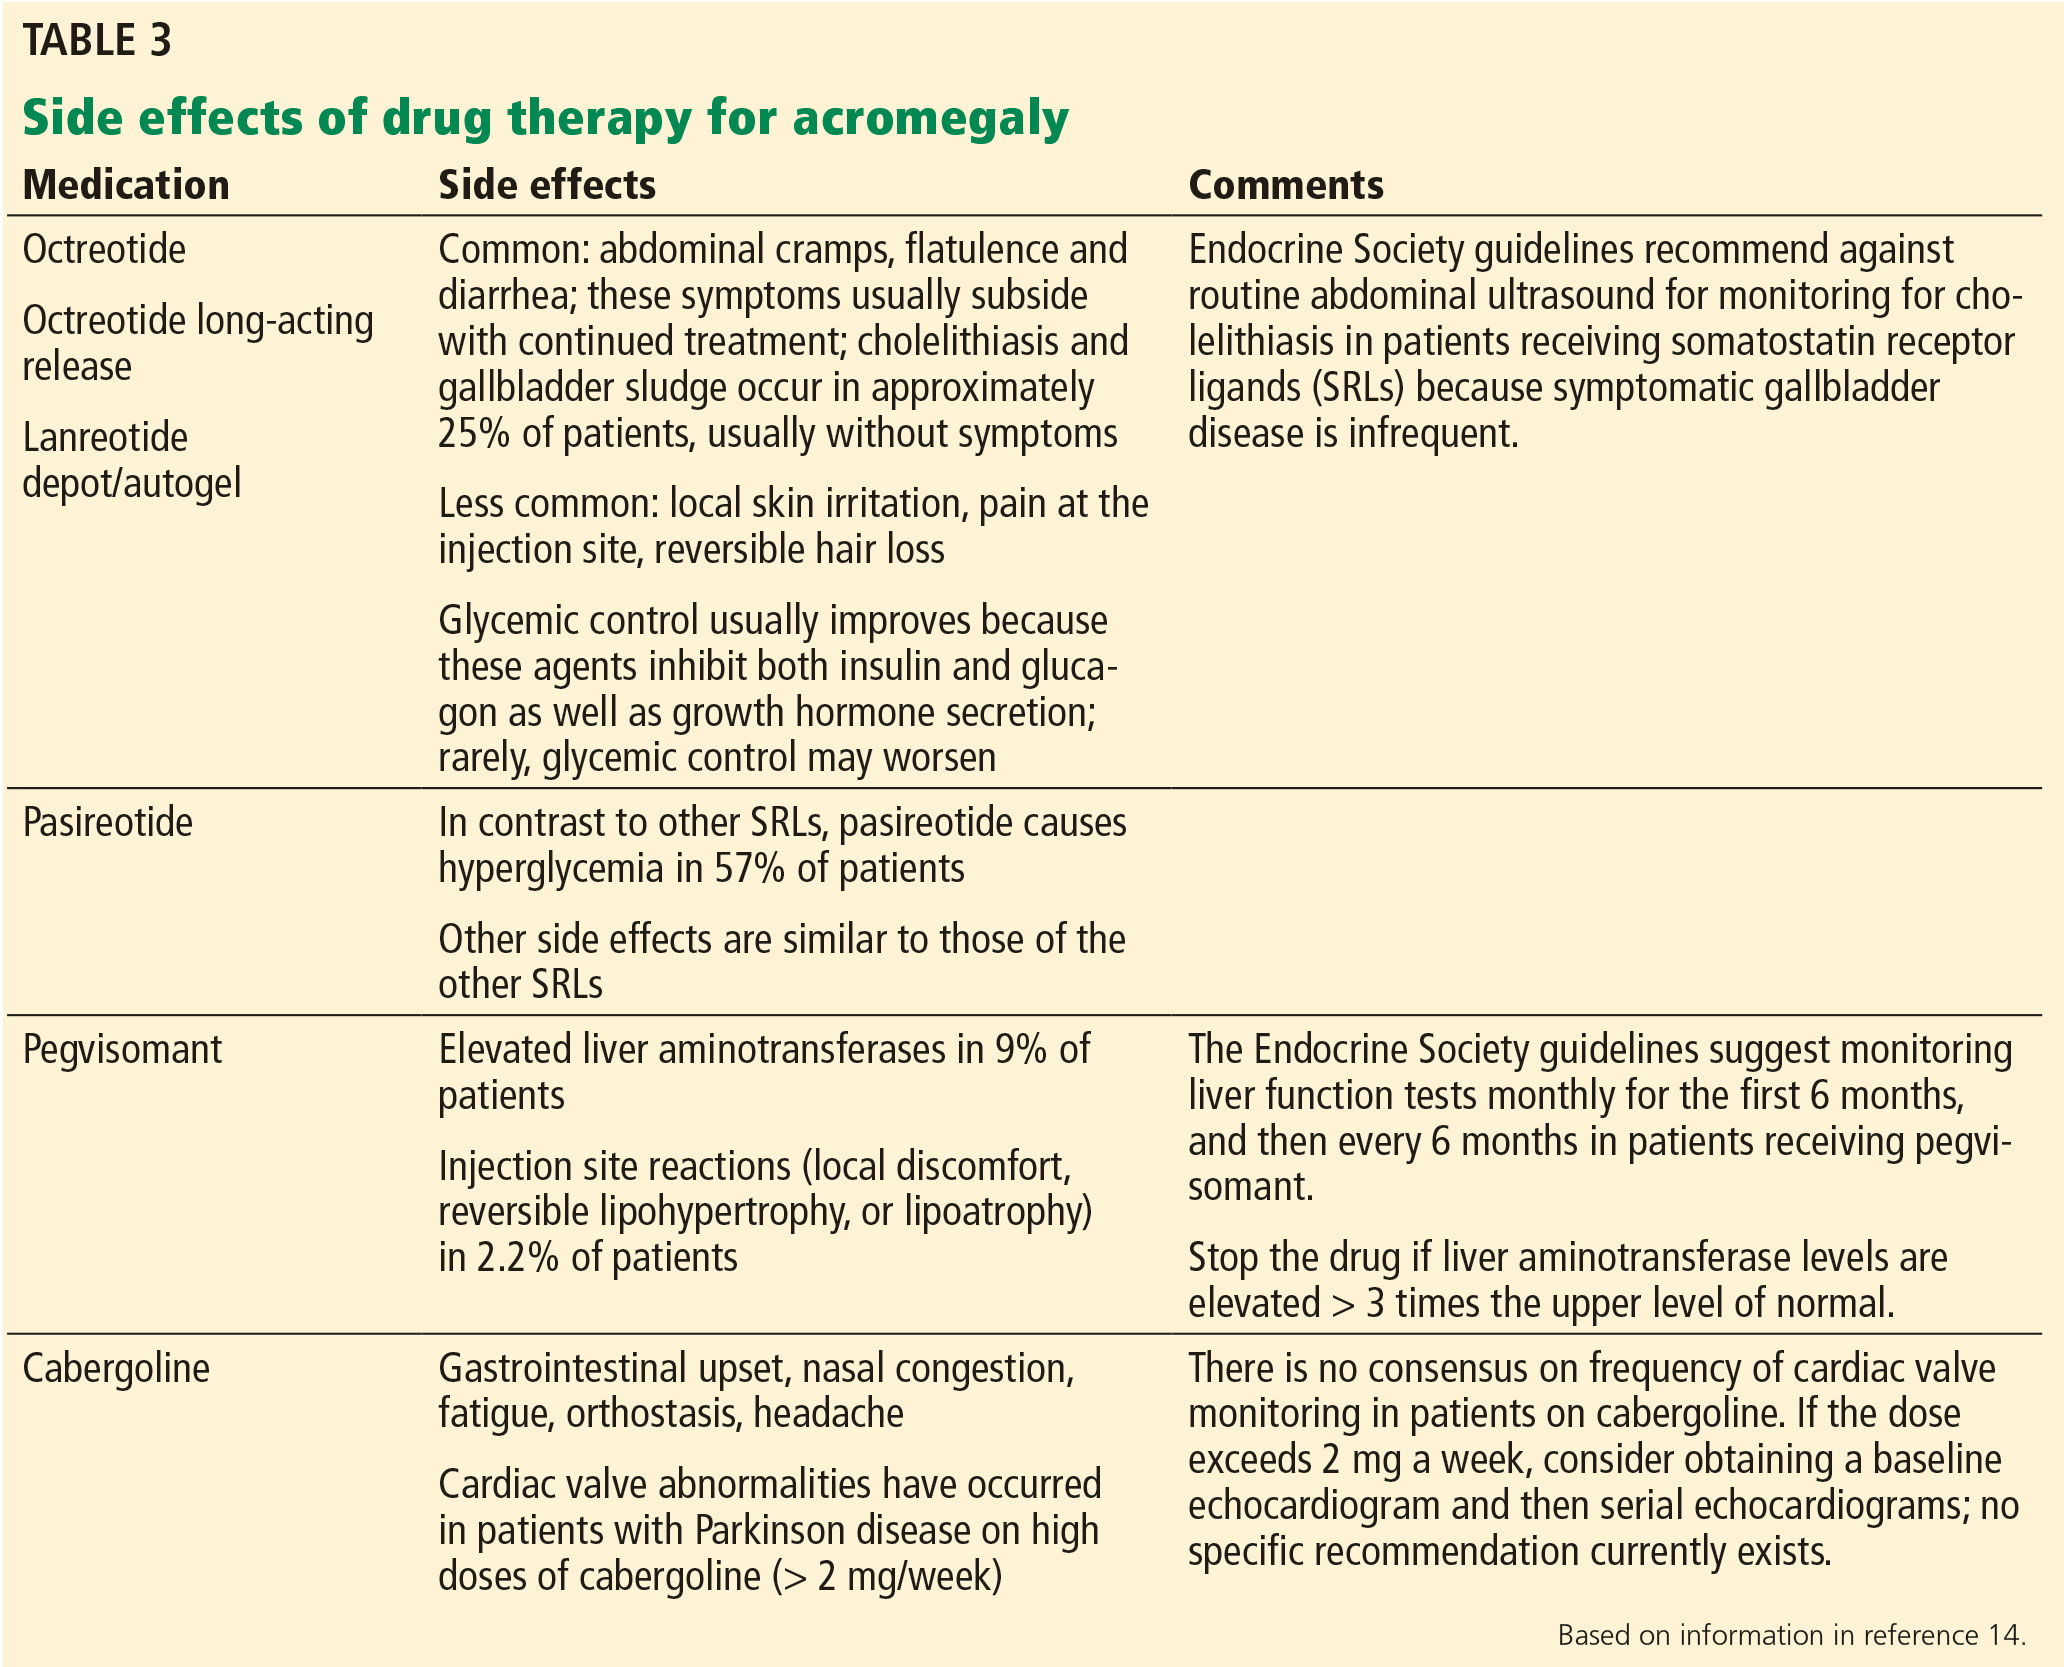
The medical treatment of acromegaly is summarized in Table 2.14,15 Side effects of the medications used to treat acromegaly are summarized in Table 3.14
CASE CONTINUED: RADIOTHERAPY
The patient is treated with octreotide, and the dose is subsequently titrated upward. His central hypogonadism is treated with testosterone gel. After 3 months, his IGF-1 level decreases to 190 ng/mL, the total testosterone increases to 450 ng/dL, and the hemoglobin A1c decreases to 5.9%.
The patient asks if stereotactic radiotherapy, which he read about on the Internet, can cure his acromegaly so that he can avoid the monthly octreotide injections.
7. Which statement best describes radiotherapy’s therapeutic effect in acromegaly?
- Stereotactic radiotherapy is more effective than medical therapy and should be used as a second-line treatment after surgery
- Stereotactic radiotherapy is less effective than conventional radiotherapy
- Stereotactic radiotherapy leads to stability or a decrease in the size of the GH-secreting tumor in 93% to 100% of patients in 5 to 10 years and to biochemical remission in 40% to 60% of patients at 5 years
- Stereotactic radiotherapy causes hypopituitarism in no more than 1% of patients
Stereotactic radiotherapy leads to stability or a decrease in the size of the GH-secreting tumor in 93% to 100% of patients in 5 to 10 years and biochemical remission in 40% to 60% of patients at 5 years.24,25
Hypopituitarism develops in up to 50% of patients at 5 years, and its incidence increases with the duration of follow-up.24 The risk of other complications is low (0% to 5% for new visual deficits, cranial nerve damage, or brain radionecrosis, and 0% to 1% for secondary brain tumors).24
Conventional radiotherapy has fallen out of favor because it is associated with an increased risk of death (mainly from stroke) independent of IGF-1 and GH levels, and a higher rate of complications than stereotactic radiotherapy.14,16 Radiotherapy is reserved for postsurgical treatment of patients with recurrent or persistent tumors who are resistant to or cannot tolerate medical therapy; it is the third-line treatment.24
Given that our patient responded to the medical therapy and tolerated it well and given the high risk of hypopituitarism associated with stereotactic radiotherapy, the latter would not be appropriate for the patient.
His fatigue has diminished further and his sexual performance has improved. He is still married and his wife no longer suspects him of infidelity.
KEY POINTS
- IGF-1 is the screening test of choice in a patient with signs and symptoms of acromegaly.
- A growth hormone suppression test with a 75-g oral glucose load is the gold standard test for confirmation of the diagnosis of acromegaly in patients with an elevated IGF-1 level.
- Transsphenoidal resection of the growth hormone-secreting pituitary macroadenoma is the initial treatment of choice for acromegaly.
- Patients with residual or recurrent growth hormone-secreting pituitary macroadenoma can be treated with somatostatin receptor ligands, a growth hormone receptor antagonist (pegvisomant), and a dopamine agonist cabergoline.
- Radiotherapy is reserved for postsurgical treatment of patients with recurrent or persistent tumors who are resistant to or intolerant of medical therapy. Stereotactic radiotherapy has largely replaced conventional radiotherapy.
- Melmed S. Acromegaly pathogenesis and treatment. J Clin Invest 2009; 119:3189–3202.
- Molitch ME. Clinical manifestations of acromegaly. Endocrinol Metab Clin North Am 1992; 21:597–614.
- Dineen R, Stewart PM, Sherlock M. Acromegaly. QJM 2017; 110:411–420.
- Yacub A, Yaqub N. Insulin-mediated pseudoacromegaly: a case report and review of the literature. W V Med J 2008; 104:12–15.
- Mestron A, Webb SM, Astorga R, et al. Epidemiology, clinical characteristics, outcome, morbidity and mortality in acromegaly based on the Spanish Acromegaly Registry (Registro Espanol de Acromegalia, REA). Eur J Endocrinol 2004; 151:439–446.
- Zhu X, Lin CR, Prefontaine CG, Tollkuhn J, Rosenfeld MG. Genetic control of pituitary development and hypopituitarism. Curr Opin Genet Dev 2005; 15:332–340.
- Tannenbaum GS, Epelbaum J, Bowers CY. Interrelationship between the novel peptide ghrelin and somatostatin/growth hormone-releasing hormone in regulation of pulsatile growth hormone secretion. Endocrinology 2003; 144:967–974.
- Lanning NJ, Carter-Su C. Recent advances in growth hormone signaling. Rev Endocr Metab Disord 2006; 7:225–235.
- Colao A, Ferone D, Marzullo P, Lombardi G. Systemic complications of acromegaly: epidemiology, pathogenesis, and management. Endocr Rev 2004; 25:102–152.
- Larkin S, Reddy R, Karavitaki N, Cudlip S, Wass J, Ansorge O. Granulation pattern, but not GSP or GHR mutation, is associated with clinical characteristics in somatostatin-naive patients with somatotroph adenomas. Eur J Endocrinol 2013; 168:491–499.
- Dineen R, Stewart PM, Sherlock M. Acromegaly. QJM 2017; 110:411–420.
- Peacey SR, Toogood AA, Veldhuis JD, Thorner MO, Shalet SM. The relationship between 24-hour growth hormone secretion and insulin-like growth factor I in patients with successfully treated acromegaly: impact of surgery or radiotherapy. J Clin Endocrinol Metab 2001; 86:259–266.
- Livingstone C. IGF2 and cancer. Endocr Relat Cancer 2013; 20:R321–R339.
- Katznelson L, Laws ER Jr, Melmed S, et al. Acromegaly: an Endocrine Society clinical practice guideline. J Clin Endocrinol Metab 2014; 99:3933–3951.
- Melmed S. Acromegaly. N Engl J Med 2006; 355:2558–2573.
- Melmed S, Casanueva FF, Klibanski A, et al. A consensus on the diagnosis and treatment of acromegaly complications. Pituitary 2013; 16:294–302.
- Marquez Y, Tuchman A, Zada G. Surgery and radiosurgery for acromegaly: a review of indications, operative techniques, outcomes, and complications. Int J Endocrinol 2012; 2012: 386401.
- Jane JA Jr, Starke RM, Elzoghby MA, et al. Endoscopic transsphenoidal surgery for acromegaly: remission using modern criteria, complications, and predictors of outcome. J Clin Endocrinol Metab 2011; 96:2732–2740.
- Cappabianca P, Cavallo LM, Colao A, de Divitiis E. Surgical complications associated with the endoscopic endonasal transsphenoidal approach for pituitary adenomas. J Neurosurg 2002; 97:293–298.
- Nomikos P, Buchfelder M, Fahlbusch R. The outcome of surgery in 668 patients with acromegaly using current criteria of biochemical “cure.” Eur J Endocrinol 2005; 152:379–387.
- Howlett TA, Willis D, Walker G, Wass JA, Trainer PJ; UK Acromegaly Register Study Group (UKAR-3). Control of growth hormone and IGF1 in patients with acromegaly in the UK: responses to medical treatment with somatostatin analogues and dopamine agonists. Clin Endocrinol (Oxf) 2013; 79:689–699.
- Katznelson L. Pegvisomant for the treatment of acromegaly-translation of clinical trials into clinical practice. Nat Clin Pract Endocrinol Metab 2007; 3:514–515.
- Freda PU, Reyes CM, Nuruzzaman AT, Sundeen RE, Khandji AG, Post KD. Cabergoline therapy of growth hormone & growth hormone/prolactin secreting pituitary tumors. Pituitary 2004; 7:21–30.
- Castinetti F, Morange I, Dufour H, Regis J, Brue T. Radiotherapy and radiosurgery in acromegaly. Pituitary 2009; 12:3–10.
- Gheorghiu ML. Updates in outcomes of stereotactic radiation therapy in acromegaly. Pituitary 2017; 20:154–168.
A 58-year-old man presents with a 1-year history of chronic daytime fatigue, low libido, and difficulty achieving erections. He is upset: his wife suspects him of having an extramarital affair because, in addition to problems with his sexual performance, he has not been wearing his wedding ring. The patient explains that the ring has become too small for his finger and that he has never cheated on his wife. His wife has also been complaining that he snores loudly at night.
The patient works as an accountant. He has no known allergies to medications and takes no medications or supplements. He has no surgical history. He has never smoked tobacco or abused illicit drugs. He drinks a glass of wine once a week.
His father died at age 78 of a myocardial infarction; his 86-year-old mother has hypertension. He has no siblings. His 28-year-old biological son is healthy.
Physical examination
His temperature is 97.9°F (36.6°C), blood pressure 150/90 mm Hg, heart rate 80 per minute, respiratory rate 12 per minute, and oxygen saturation 98% on room air. His height is 5 feet 11 inches (180 cm), weight 250 lb (113 kg), and body mass index 35 kg/m2.
His forehead is wide with deep creases, his jaw, nose, and lower lip are prominent, and his tongue, hands, and feet are large. He has mild thyromegaly with no palpable nodules.
On cardiac examination, his point of maximal impulse is 3 cm lateral to the left midclavicular line in the fifth intercostal space; he has normal S1 and S2 with no murmurs, rubs, or gallops. The lungs are clear on auscultation. His abdomen is soft, nontender, and nondistended; the liver is palpated 2 cm below the costal margin. His extremities are not edematous.
LABORATORY TESTING
1. In addition to a complete blood cell count and comprehensive metabolic panel, which is the most appropriate test to order?
- Growth hormone (GH) level
- Insulin-like growth factor 1 (IGF-1) level
- GH and IGF-1 levels
- IGF-2 level
Acromegaly, an overview
The patient’s history of snoring and daytime fatigue suggests obstructive sleep apnea, which together with his enlarging ring finger size, wide forehead with deep creases, prominent jaw, nose, and lower lip, and enlarged thyroid, heart, and liver suggests acromegaly.
In most cases, acromegaly is caused by a GH-secreting pituitary adenoma. Rare causes include hypothalamic tumors that secrete GH-releasing hormone (GHRH) and ectopic secretion of GHRH or GH.1 Pseudoacromegaly, a mimic, is characterized by acromegalic features without hypersecretion of GH and with normal IGF-1 levels.4
The prevalence of acromegaly is 36 to 60 cases per million, and its annual incidence is 3 to 4 per million.5
With this patient’s presentation, the most appropriate next step is to order an IGF-1 level to screen for acromegaly.
GH secretion is pulsatile, IGF-1 secretion is not
GH is synthesized and stored in somatotroph cells, which account for more than 50% of pituitary hormone-secreting cells.6 Three hormones regulate synthesis and secretion of GH: GHRH, ghrelin, and somatostatin.7 GH secretion is pulsatile, with minimal basal secretion dependent on sex, age, neurotransmitters, exercise, and stress.7 It exerts its physiologic effects through an interaction with the GH receptor, a single-chain transmembrane glycoprotein.8,9
A GH-secreting adenoma develops when pituitary somatotroph cells undergo a monoclonal expansion. Mutations of various genes such as GNAS, PRKAR1A, and AIP are suspected of triggering such expansion. Disruption of the MENIN gene leads to multiple endocrine neoplasia syndrome 1, a combination of pituitary adenoma, pancreatic tumor, and primary hyperparathyroidism.9 The pattern of cytoplasmic keratin in somatotroph cells defines 2 histologic subtypes: densely granulated and sparsely granulated. The latter subtype is associated with more-invasive lesions that are seen more often in younger patients and are less responsive to somatostatin ligand therapy.10
GH induces transcription of IGF-1, mostly in the liver. In contrast to GH, IGF-1 secretion is not pulsatile, and therefore IGF-1 can be measured more reliably in serum, and the results can be interpreted according to age- and sex-adjusted reference ranges.
The IGF-1 level is a very sensitive test, but it is not very specific. It can be falsely elevated in pregnancy, in patients on estrogen replacement therapy, and in late adolescence.11 In addition, it may be difficult to interpret the IGF-1 level in the setting of malnutrition, severe hyperglycemia, renal or hepatic failure, and hypothyroidism.11,12
Nonpulsatile secretion and high sensitivity make the IGF-1 level the screening test of choice for acromegaly.9,12 In contrast, because of the pulsatile nature of GH synthesis, one cannot rely on a random GH level alone to detect the hormone’s hypersecretion.
IGF-2 has no role in acromegaly
IGF-2, produced mainly by the liver, plays an important role in promoting fetal growth. IGF-2 may induce hypoglycemia when secreted by some mesenchymal tumors.13 This hormone has no role in the pathogenesis of acromegaly and should not be measured in this patient.
CASE CONTINUED: FURTHER TESTING
The patient’s IGF-1 level is 590 ng/mL; the reference range for his age and sex is 68 to 245 ng/mL.
A sleep study confirms obstructive sleep apnea, and the patient is started on continuous positive airway pressure at night, with some reduction of his fatigue.
2. What is the most appropriate next step?
- Order magnetic resonance imaging (MRI) of the pituitary with gadolinium contrast
- Perform a GH suppression test with a 75-g oral glucose load
- Perform a GH stimulation test
- Refer the patient to a neurosurgeon for a consultation
The most appropriate next step is a GH suppression test, performed by measuring the plasma GH level 2 hours after giving 75 g of glucose by mouth. This confirmatory test is necessary because the IGF-1 level can be falsely elevated. The normal response to an oral glucose challenge is suppression of the GH level to below 1 μg/L. Failure to suppress GH confirms the diagnosis of acromegaly.14
A GH stimulation test with insulin-induced hypoglycemia or with GHRH-arginine would be appropriate if GH deficiency were suspected rather than hypersecretion.
Imaging of the pituitary with MRI before obtaining biochemical confirmation of the diagnosis of acromegaly may mislead the physician because MRI does not determine the functional status of a pituitary tumor. Correct treatment of a pituitary tumor depends on whether the tumor causes hypersecretion or deficiency of any pituitary hormones.
Referral to a neurosurgeon for a consultation is premature until a biochemical diagnosis of acromegaly is made and a pituitary adenoma is subsequently demonstrated by imaging.
3. The patient’s GH level is 10 μg/L 2 hours after oral administration of 75 g of glucose. What is the most appropriate next step?
- Radiography of the skull to image the pituitary at a low cost
- MRI of the pituitary with contrast after making sure the patient’s renal function is normal
- MRI of the pituitary without contrast
- Computed tomography of the head
The next step is MRI of the pituitary with contrast (gadolinium) after obtaining blood urea nitrogen and creatinine measurements to make sure the patient’s renal function is normal.14
Gadolinium contrast is contraindicated in patients with severely reduced renal function (glomerular filtration rate < 30 mL/min/1.73 m2) because of the risk of nephrogenic systemic fibrosis. In such a case, MRI without contrast would be appropriate.
MRI is the most sensitive imaging test for detecting a pituitary adenoma, as it can detect tumors as small as 2 mm. A pituitary macroadenoma (> 10 mm in diameter) is detected in more than 75% of patients with acromegaly at diagnosis. The tumor often invades one or both cavernous sinuses or extends to the suprasellar region, possibly impinging on the optic chiasm.15
If MRI is contraindicated, computed tomography of the head should be performed.
CASE CONTINUED: IMAGING
The patient’s comprehensive metabolic panel is normal, but his fasting plasma glucose is 135 mg/dL (reference range 74–99). Pituitary MRI with contrast shows a 3-cm pituitary adenoma with suprasellar extension, impinging on the optic chiasm and invading the right cavernous sinus.
4. In addition to repeating the fasting plasma glucose and measuring hemoglobin A1c, what is the most appropriate next step in managing this patient?
- Measure the prolactin, morning serum cortisol, total testosterone, follicle-stimulating hormone (FSH), luteinizing hormone (LH), thyroid-stimulating hormone (TSH), and free thyroxine (T4) levels; refer the patient to an ophthalmologist for a formal evaluation of visual fields
- Measure these hormone levels; perform a gross evaluation of the visual fields and refer the patient to an ophthalmologist only if visual field deficits are found on the gross examination
- Measure these hormone levels; refer the patient to an ophthalmologist only if he complains of vision changes
- Do not order any additional tests; instruct the patient to call the office if he develops any vision changes
This patient should have all of these hormones measured. In addition, given that his macroadenoma is impinging on the optic chiasm, he should be referred to an ophthalmologist for a formal evaluation of visual fields even if the latter are intact on gross examination and even if the patient does not complain of any visual changes.
Abnormalities of hormones other than GH and IGF-1 in acromegaly
Secretion of pituitary hormones other than GH and IGF-1 must be assessed.
Prolactin. GH-secreting tumors also secrete prolactin in up to one-third of patients, with the resulting hyperprolactinemia contributing to hypogonadism.11 Prolactin hypersecretion should be distinguished from hyperprolactinemia caused by pituitary stalk compression, which may be evident on MRI.
Measuring the serum prolactin level with 1:100 dilution to counteract the “hook effect” may unmask severe hyperprolactinemia due to a large macroprolactinoma. (The hook effect occurs when the prolactin level is so high that there is not enough antibody in the assay to bind both ends of all the prolactin molecules present, causing the reading to be falsely low.).
Cortisol, T4, testosterone. Patients with acromegaly may develop central adrenal insufficiency, central hypothyroidism, and central hypogonadism; these hormonal deficits may occur in isolation or in combination.
Also, patients should be assessed for comorbidities such as colon cancer (all patients with acromegaly require a colonoscopy, as acromegaly raises the risk of colon cancer), diabetes mellitus, hypertension, cardiomyopathy, and sleep apnea.16
Visual field loss may be insidious
The diagnostic and treatment algorithm for acromegaly is summarized in Figure 1.
CASE CONTINUED: LABORATORY VALUES, TREATMENT OPTIONS
Our patient’s repeat fasting plasma glucose is 137 mg/dL; his hemoglobin A1c is 7.3%, consistent with diabetes mellitus secondary to acromegaly. Other laboratory values:
- Morning cortisol level 15 μg/dL (reference range 5.3–22.5),
- Prolactin 23 ng/mL, confirmed with 1:100 dilution (4.0–15.2)
- Total testosterone 59 ng/dL (193–824)
- LH 2.1 mIU/mL (1.8–10.8)
- FSH 3.0 mIU/mL (1.5–12.4)
- TSH 2.5 mIU/L (0.5–4.5)
- Free T4 1.3 ng/dL (0.9–1.7).
The patient is started on metformin 500 mg by mouth twice a day, counseled on a healthy diet, and informed that his diabetes may be a complication of his acromegaly. He is anxious to learn how his acromegaly can be treated.
5. What treatment would you recommend for the patient’s acromegaly?
- Medical treatment first, then transsphenoidal resection of the pituitary macroadenoma if medical treatment fails
- Medical treatment first, radiotherapy if medical treatment fails, and transsphenoidal resection of the pituitary macroadenoma as a last resort
- Transsphenoidal resection of the pituitary macroadenoma first, medical treatment if surgery fails, and radiotherapy if both surgery and medical treatment fail
- Taking a safe, conservative approach, monitoring IGF-1 levels frequently; starting medical treatment if acromegaly does not go into remission in 1 year
The initial treatment of choice for most patients with acromegaly is resection of the pituitary tumor.
A transsphenoidal approach is used for most patients; only rarely is craniotomy necessary. Endoscopic and microsurgical techniques reduce postoperative morbidity.17 Postoperative complications include symptoms related to the transsphenoidal approach (nasal congestion, sinusitis, epistaxis), cerebrospinal fluid leak, hemorrhage, meningitis, stroke, visual impairment, vascular damage, transient or permanent diabetes insipidus, and hypopituitarism. The surgical mortality rate is less than 0.5%.18,19
Successful resection of a pituitary tumor would lead to normalization of the IGF-1 level, a drop of the GH level to below 1 μg/L, and relief of the effect of the tumor pressing against other structures. An IGF-1 level and a random GH level should be obtained 12 weeks after the surgery.14 If the GH level is higher than 1 μg/L, a GH suppression test with a 75-g oral glucose load should be performed.14 MRI of the sella turcica should be done 12 weeks after surgery to visualize residual tumor and adjacent structures.14
A large tumor size, suprasellar extension, and high preoperative levels of IGF-1 and GH are associated with a lack of surgical success; however, surgical debulking should still be considered in patients with a low chance for surgical cure to improve the probability of achieving biochemical remission with postoperative medical and radiologic therapy.20
Medical therapy can be the initial treatment if the patient refuses surgery or if surgery is contraindicated because of severe comorbidities or because structural features of the tumor confer a high surgical risk (eg, if the adenoma encases the cavernous portion of a carotid artery).13 Medical therapy may shrink the tumor in some patients and may thereby make surgical resection easier and more likely to be successful.
Radiotherapy is usually reserved for patients whose tumors recur or persist postoperatively and who are resistant to or intolerant of medical therapy.14 The soft tissue changes caused by acromegaly may regress with treatment to some degree, but they are not likely to resolve completely; the bone changes do not regress.
CASE CONTINUED: MEDICAL TREATMENT
Three months after transsphenoidal resection of his pituitary macroadenoma, our patient’s laboratory values are as follows:
- IGF-1 400 ng/mL
- Morning cortisol 20 μg/dL
- Testosterone 95 ng/dL
- LH 2.1 mU/mL
- FSH 3.7 mU/mL
- Prolactin 12 ng/mL
- TSH 2.3 mIU/L
- Free T4 1.2 ng/dL
- Basic metabolic panel normal.
The patient denies frequent urination or increased thirst. Repeat MRI of the pituitary with contrast shows a residual 1.3-cm adenoma with no suprasellar extension.
6. What is the best next treatment choice for the patient?
- A GH receptor antagonist (pegvisomant)
- A somatostatin receptor ligand (SRL) such as octreotide
- Cabergoline (a dopamine agonist)
- A combination of an SRL and pegvisomant
An SRL such as octreotide would be the best choice for this patient.
The medical options for acromegaly are SRLs, pegvisomant, and cabergoline.21–23 The Endocrine Society guidelines recommend either an SRL or pegvisomant as the initial adjuvant medical therapy in patients with persistent disease after surgery.14 However, pegvisomant is much more expensive than any SRL, so an SRL would be a better choice in this patient. Also, pegvisomant does not suppress tumor growth, in contrast to SRLs, so SRLs are preferred in patients with large tumors abutting the optic chiasm.14
SRLs are used as primary therapy in patients who cannot be cured by surgery, have extensive cavernous sinus invasion, have no chiasmal compression, or are poor surgical candidates.
The medical treatment of acromegaly is summarized in Table 2.14,15 Side effects of the medications used to treat acromegaly are summarized in Table 3.14
CASE CONTINUED: RADIOTHERAPY
The patient is treated with octreotide, and the dose is subsequently titrated upward. His central hypogonadism is treated with testosterone gel. After 3 months, his IGF-1 level decreases to 190 ng/mL, the total testosterone increases to 450 ng/dL, and the hemoglobin A1c decreases to 5.9%.
The patient asks if stereotactic radiotherapy, which he read about on the Internet, can cure his acromegaly so that he can avoid the monthly octreotide injections.
7. Which statement best describes radiotherapy’s therapeutic effect in acromegaly?
- Stereotactic radiotherapy is more effective than medical therapy and should be used as a second-line treatment after surgery
- Stereotactic radiotherapy is less effective than conventional radiotherapy
- Stereotactic radiotherapy leads to stability or a decrease in the size of the GH-secreting tumor in 93% to 100% of patients in 5 to 10 years and to biochemical remission in 40% to 60% of patients at 5 years
- Stereotactic radiotherapy causes hypopituitarism in no more than 1% of patients
Stereotactic radiotherapy leads to stability or a decrease in the size of the GH-secreting tumor in 93% to 100% of patients in 5 to 10 years and biochemical remission in 40% to 60% of patients at 5 years.24,25
Hypopituitarism develops in up to 50% of patients at 5 years, and its incidence increases with the duration of follow-up.24 The risk of other complications is low (0% to 5% for new visual deficits, cranial nerve damage, or brain radionecrosis, and 0% to 1% for secondary brain tumors).24
Conventional radiotherapy has fallen out of favor because it is associated with an increased risk of death (mainly from stroke) independent of IGF-1 and GH levels, and a higher rate of complications than stereotactic radiotherapy.14,16 Radiotherapy is reserved for postsurgical treatment of patients with recurrent or persistent tumors who are resistant to or cannot tolerate medical therapy; it is the third-line treatment.24
Given that our patient responded to the medical therapy and tolerated it well and given the high risk of hypopituitarism associated with stereotactic radiotherapy, the latter would not be appropriate for the patient.
His fatigue has diminished further and his sexual performance has improved. He is still married and his wife no longer suspects him of infidelity.
KEY POINTS
- IGF-1 is the screening test of choice in a patient with signs and symptoms of acromegaly.
- A growth hormone suppression test with a 75-g oral glucose load is the gold standard test for confirmation of the diagnosis of acromegaly in patients with an elevated IGF-1 level.
- Transsphenoidal resection of the growth hormone-secreting pituitary macroadenoma is the initial treatment of choice for acromegaly.
- Patients with residual or recurrent growth hormone-secreting pituitary macroadenoma can be treated with somatostatin receptor ligands, a growth hormone receptor antagonist (pegvisomant), and a dopamine agonist cabergoline.
- Radiotherapy is reserved for postsurgical treatment of patients with recurrent or persistent tumors who are resistant to or intolerant of medical therapy. Stereotactic radiotherapy has largely replaced conventional radiotherapy.
A 58-year-old man presents with a 1-year history of chronic daytime fatigue, low libido, and difficulty achieving erections. He is upset: his wife suspects him of having an extramarital affair because, in addition to problems with his sexual performance, he has not been wearing his wedding ring. The patient explains that the ring has become too small for his finger and that he has never cheated on his wife. His wife has also been complaining that he snores loudly at night.
The patient works as an accountant. He has no known allergies to medications and takes no medications or supplements. He has no surgical history. He has never smoked tobacco or abused illicit drugs. He drinks a glass of wine once a week.
His father died at age 78 of a myocardial infarction; his 86-year-old mother has hypertension. He has no siblings. His 28-year-old biological son is healthy.
Physical examination
His temperature is 97.9°F (36.6°C), blood pressure 150/90 mm Hg, heart rate 80 per minute, respiratory rate 12 per minute, and oxygen saturation 98% on room air. His height is 5 feet 11 inches (180 cm), weight 250 lb (113 kg), and body mass index 35 kg/m2.
His forehead is wide with deep creases, his jaw, nose, and lower lip are prominent, and his tongue, hands, and feet are large. He has mild thyromegaly with no palpable nodules.
On cardiac examination, his point of maximal impulse is 3 cm lateral to the left midclavicular line in the fifth intercostal space; he has normal S1 and S2 with no murmurs, rubs, or gallops. The lungs are clear on auscultation. His abdomen is soft, nontender, and nondistended; the liver is palpated 2 cm below the costal margin. His extremities are not edematous.
LABORATORY TESTING
1. In addition to a complete blood cell count and comprehensive metabolic panel, which is the most appropriate test to order?
- Growth hormone (GH) level
- Insulin-like growth factor 1 (IGF-1) level
- GH and IGF-1 levels
- IGF-2 level
Acromegaly, an overview
The patient’s history of snoring and daytime fatigue suggests obstructive sleep apnea, which together with his enlarging ring finger size, wide forehead with deep creases, prominent jaw, nose, and lower lip, and enlarged thyroid, heart, and liver suggests acromegaly.
In most cases, acromegaly is caused by a GH-secreting pituitary adenoma. Rare causes include hypothalamic tumors that secrete GH-releasing hormone (GHRH) and ectopic secretion of GHRH or GH.1 Pseudoacromegaly, a mimic, is characterized by acromegalic features without hypersecretion of GH and with normal IGF-1 levels.4
The prevalence of acromegaly is 36 to 60 cases per million, and its annual incidence is 3 to 4 per million.5
With this patient’s presentation, the most appropriate next step is to order an IGF-1 level to screen for acromegaly.
GH secretion is pulsatile, IGF-1 secretion is not
GH is synthesized and stored in somatotroph cells, which account for more than 50% of pituitary hormone-secreting cells.6 Three hormones regulate synthesis and secretion of GH: GHRH, ghrelin, and somatostatin.7 GH secretion is pulsatile, with minimal basal secretion dependent on sex, age, neurotransmitters, exercise, and stress.7 It exerts its physiologic effects through an interaction with the GH receptor, a single-chain transmembrane glycoprotein.8,9
A GH-secreting adenoma develops when pituitary somatotroph cells undergo a monoclonal expansion. Mutations of various genes such as GNAS, PRKAR1A, and AIP are suspected of triggering such expansion. Disruption of the MENIN gene leads to multiple endocrine neoplasia syndrome 1, a combination of pituitary adenoma, pancreatic tumor, and primary hyperparathyroidism.9 The pattern of cytoplasmic keratin in somatotroph cells defines 2 histologic subtypes: densely granulated and sparsely granulated. The latter subtype is associated with more-invasive lesions that are seen more often in younger patients and are less responsive to somatostatin ligand therapy.10
GH induces transcription of IGF-1, mostly in the liver. In contrast to GH, IGF-1 secretion is not pulsatile, and therefore IGF-1 can be measured more reliably in serum, and the results can be interpreted according to age- and sex-adjusted reference ranges.
The IGF-1 level is a very sensitive test, but it is not very specific. It can be falsely elevated in pregnancy, in patients on estrogen replacement therapy, and in late adolescence.11 In addition, it may be difficult to interpret the IGF-1 level in the setting of malnutrition, severe hyperglycemia, renal or hepatic failure, and hypothyroidism.11,12
Nonpulsatile secretion and high sensitivity make the IGF-1 level the screening test of choice for acromegaly.9,12 In contrast, because of the pulsatile nature of GH synthesis, one cannot rely on a random GH level alone to detect the hormone’s hypersecretion.
IGF-2 has no role in acromegaly
IGF-2, produced mainly by the liver, plays an important role in promoting fetal growth. IGF-2 may induce hypoglycemia when secreted by some mesenchymal tumors.13 This hormone has no role in the pathogenesis of acromegaly and should not be measured in this patient.
CASE CONTINUED: FURTHER TESTING
The patient’s IGF-1 level is 590 ng/mL; the reference range for his age and sex is 68 to 245 ng/mL.
A sleep study confirms obstructive sleep apnea, and the patient is started on continuous positive airway pressure at night, with some reduction of his fatigue.
2. What is the most appropriate next step?
- Order magnetic resonance imaging (MRI) of the pituitary with gadolinium contrast
- Perform a GH suppression test with a 75-g oral glucose load
- Perform a GH stimulation test
- Refer the patient to a neurosurgeon for a consultation
The most appropriate next step is a GH suppression test, performed by measuring the plasma GH level 2 hours after giving 75 g of glucose by mouth. This confirmatory test is necessary because the IGF-1 level can be falsely elevated. The normal response to an oral glucose challenge is suppression of the GH level to below 1 μg/L. Failure to suppress GH confirms the diagnosis of acromegaly.14
A GH stimulation test with insulin-induced hypoglycemia or with GHRH-arginine would be appropriate if GH deficiency were suspected rather than hypersecretion.
Imaging of the pituitary with MRI before obtaining biochemical confirmation of the diagnosis of acromegaly may mislead the physician because MRI does not determine the functional status of a pituitary tumor. Correct treatment of a pituitary tumor depends on whether the tumor causes hypersecretion or deficiency of any pituitary hormones.
Referral to a neurosurgeon for a consultation is premature until a biochemical diagnosis of acromegaly is made and a pituitary adenoma is subsequently demonstrated by imaging.
3. The patient’s GH level is 10 μg/L 2 hours after oral administration of 75 g of glucose. What is the most appropriate next step?
- Radiography of the skull to image the pituitary at a low cost
- MRI of the pituitary with contrast after making sure the patient’s renal function is normal
- MRI of the pituitary without contrast
- Computed tomography of the head
The next step is MRI of the pituitary with contrast (gadolinium) after obtaining blood urea nitrogen and creatinine measurements to make sure the patient’s renal function is normal.14
Gadolinium contrast is contraindicated in patients with severely reduced renal function (glomerular filtration rate < 30 mL/min/1.73 m2) because of the risk of nephrogenic systemic fibrosis. In such a case, MRI without contrast would be appropriate.
MRI is the most sensitive imaging test for detecting a pituitary adenoma, as it can detect tumors as small as 2 mm. A pituitary macroadenoma (> 10 mm in diameter) is detected in more than 75% of patients with acromegaly at diagnosis. The tumor often invades one or both cavernous sinuses or extends to the suprasellar region, possibly impinging on the optic chiasm.15
If MRI is contraindicated, computed tomography of the head should be performed.
CASE CONTINUED: IMAGING
The patient’s comprehensive metabolic panel is normal, but his fasting plasma glucose is 135 mg/dL (reference range 74–99). Pituitary MRI with contrast shows a 3-cm pituitary adenoma with suprasellar extension, impinging on the optic chiasm and invading the right cavernous sinus.
4. In addition to repeating the fasting plasma glucose and measuring hemoglobin A1c, what is the most appropriate next step in managing this patient?
- Measure the prolactin, morning serum cortisol, total testosterone, follicle-stimulating hormone (FSH), luteinizing hormone (LH), thyroid-stimulating hormone (TSH), and free thyroxine (T4) levels; refer the patient to an ophthalmologist for a formal evaluation of visual fields
- Measure these hormone levels; perform a gross evaluation of the visual fields and refer the patient to an ophthalmologist only if visual field deficits are found on the gross examination
- Measure these hormone levels; refer the patient to an ophthalmologist only if he complains of vision changes
- Do not order any additional tests; instruct the patient to call the office if he develops any vision changes
This patient should have all of these hormones measured. In addition, given that his macroadenoma is impinging on the optic chiasm, he should be referred to an ophthalmologist for a formal evaluation of visual fields even if the latter are intact on gross examination and even if the patient does not complain of any visual changes.
Abnormalities of hormones other than GH and IGF-1 in acromegaly
Secretion of pituitary hormones other than GH and IGF-1 must be assessed.
Prolactin. GH-secreting tumors also secrete prolactin in up to one-third of patients, with the resulting hyperprolactinemia contributing to hypogonadism.11 Prolactin hypersecretion should be distinguished from hyperprolactinemia caused by pituitary stalk compression, which may be evident on MRI.
Measuring the serum prolactin level with 1:100 dilution to counteract the “hook effect” may unmask severe hyperprolactinemia due to a large macroprolactinoma. (The hook effect occurs when the prolactin level is so high that there is not enough antibody in the assay to bind both ends of all the prolactin molecules present, causing the reading to be falsely low.).
Cortisol, T4, testosterone. Patients with acromegaly may develop central adrenal insufficiency, central hypothyroidism, and central hypogonadism; these hormonal deficits may occur in isolation or in combination.
Also, patients should be assessed for comorbidities such as colon cancer (all patients with acromegaly require a colonoscopy, as acromegaly raises the risk of colon cancer), diabetes mellitus, hypertension, cardiomyopathy, and sleep apnea.16
Visual field loss may be insidious
The diagnostic and treatment algorithm for acromegaly is summarized in Figure 1.
CASE CONTINUED: LABORATORY VALUES, TREATMENT OPTIONS
Our patient’s repeat fasting plasma glucose is 137 mg/dL; his hemoglobin A1c is 7.3%, consistent with diabetes mellitus secondary to acromegaly. Other laboratory values:
- Morning cortisol level 15 μg/dL (reference range 5.3–22.5),
- Prolactin 23 ng/mL, confirmed with 1:100 dilution (4.0–15.2)
- Total testosterone 59 ng/dL (193–824)
- LH 2.1 mIU/mL (1.8–10.8)
- FSH 3.0 mIU/mL (1.5–12.4)
- TSH 2.5 mIU/L (0.5–4.5)
- Free T4 1.3 ng/dL (0.9–1.7).
The patient is started on metformin 500 mg by mouth twice a day, counseled on a healthy diet, and informed that his diabetes may be a complication of his acromegaly. He is anxious to learn how his acromegaly can be treated.
5. What treatment would you recommend for the patient’s acromegaly?
- Medical treatment first, then transsphenoidal resection of the pituitary macroadenoma if medical treatment fails
- Medical treatment first, radiotherapy if medical treatment fails, and transsphenoidal resection of the pituitary macroadenoma as a last resort
- Transsphenoidal resection of the pituitary macroadenoma first, medical treatment if surgery fails, and radiotherapy if both surgery and medical treatment fail
- Taking a safe, conservative approach, monitoring IGF-1 levels frequently; starting medical treatment if acromegaly does not go into remission in 1 year
The initial treatment of choice for most patients with acromegaly is resection of the pituitary tumor.
A transsphenoidal approach is used for most patients; only rarely is craniotomy necessary. Endoscopic and microsurgical techniques reduce postoperative morbidity.17 Postoperative complications include symptoms related to the transsphenoidal approach (nasal congestion, sinusitis, epistaxis), cerebrospinal fluid leak, hemorrhage, meningitis, stroke, visual impairment, vascular damage, transient or permanent diabetes insipidus, and hypopituitarism. The surgical mortality rate is less than 0.5%.18,19
Successful resection of a pituitary tumor would lead to normalization of the IGF-1 level, a drop of the GH level to below 1 μg/L, and relief of the effect of the tumor pressing against other structures. An IGF-1 level and a random GH level should be obtained 12 weeks after the surgery.14 If the GH level is higher than 1 μg/L, a GH suppression test with a 75-g oral glucose load should be performed.14 MRI of the sella turcica should be done 12 weeks after surgery to visualize residual tumor and adjacent structures.14
A large tumor size, suprasellar extension, and high preoperative levels of IGF-1 and GH are associated with a lack of surgical success; however, surgical debulking should still be considered in patients with a low chance for surgical cure to improve the probability of achieving biochemical remission with postoperative medical and radiologic therapy.20
Medical therapy can be the initial treatment if the patient refuses surgery or if surgery is contraindicated because of severe comorbidities or because structural features of the tumor confer a high surgical risk (eg, if the adenoma encases the cavernous portion of a carotid artery).13 Medical therapy may shrink the tumor in some patients and may thereby make surgical resection easier and more likely to be successful.
Radiotherapy is usually reserved for patients whose tumors recur or persist postoperatively and who are resistant to or intolerant of medical therapy.14 The soft tissue changes caused by acromegaly may regress with treatment to some degree, but they are not likely to resolve completely; the bone changes do not regress.
CASE CONTINUED: MEDICAL TREATMENT
Three months after transsphenoidal resection of his pituitary macroadenoma, our patient’s laboratory values are as follows:
- IGF-1 400 ng/mL
- Morning cortisol 20 μg/dL
- Testosterone 95 ng/dL
- LH 2.1 mU/mL
- FSH 3.7 mU/mL
- Prolactin 12 ng/mL
- TSH 2.3 mIU/L
- Free T4 1.2 ng/dL
- Basic metabolic panel normal.
The patient denies frequent urination or increased thirst. Repeat MRI of the pituitary with contrast shows a residual 1.3-cm adenoma with no suprasellar extension.
6. What is the best next treatment choice for the patient?
- A GH receptor antagonist (pegvisomant)
- A somatostatin receptor ligand (SRL) such as octreotide
- Cabergoline (a dopamine agonist)
- A combination of an SRL and pegvisomant
An SRL such as octreotide would be the best choice for this patient.
The medical options for acromegaly are SRLs, pegvisomant, and cabergoline.21–23 The Endocrine Society guidelines recommend either an SRL or pegvisomant as the initial adjuvant medical therapy in patients with persistent disease after surgery.14 However, pegvisomant is much more expensive than any SRL, so an SRL would be a better choice in this patient. Also, pegvisomant does not suppress tumor growth, in contrast to SRLs, so SRLs are preferred in patients with large tumors abutting the optic chiasm.14
SRLs are used as primary therapy in patients who cannot be cured by surgery, have extensive cavernous sinus invasion, have no chiasmal compression, or are poor surgical candidates.
The medical treatment of acromegaly is summarized in Table 2.14,15 Side effects of the medications used to treat acromegaly are summarized in Table 3.14
CASE CONTINUED: RADIOTHERAPY
The patient is treated with octreotide, and the dose is subsequently titrated upward. His central hypogonadism is treated with testosterone gel. After 3 months, his IGF-1 level decreases to 190 ng/mL, the total testosterone increases to 450 ng/dL, and the hemoglobin A1c decreases to 5.9%.
The patient asks if stereotactic radiotherapy, which he read about on the Internet, can cure his acromegaly so that he can avoid the monthly octreotide injections.
7. Which statement best describes radiotherapy’s therapeutic effect in acromegaly?
- Stereotactic radiotherapy is more effective than medical therapy and should be used as a second-line treatment after surgery
- Stereotactic radiotherapy is less effective than conventional radiotherapy
- Stereotactic radiotherapy leads to stability or a decrease in the size of the GH-secreting tumor in 93% to 100% of patients in 5 to 10 years and to biochemical remission in 40% to 60% of patients at 5 years
- Stereotactic radiotherapy causes hypopituitarism in no more than 1% of patients
Stereotactic radiotherapy leads to stability or a decrease in the size of the GH-secreting tumor in 93% to 100% of patients in 5 to 10 years and biochemical remission in 40% to 60% of patients at 5 years.24,25
Hypopituitarism develops in up to 50% of patients at 5 years, and its incidence increases with the duration of follow-up.24 The risk of other complications is low (0% to 5% for new visual deficits, cranial nerve damage, or brain radionecrosis, and 0% to 1% for secondary brain tumors).24
Conventional radiotherapy has fallen out of favor because it is associated with an increased risk of death (mainly from stroke) independent of IGF-1 and GH levels, and a higher rate of complications than stereotactic radiotherapy.14,16 Radiotherapy is reserved for postsurgical treatment of patients with recurrent or persistent tumors who are resistant to or cannot tolerate medical therapy; it is the third-line treatment.24
Given that our patient responded to the medical therapy and tolerated it well and given the high risk of hypopituitarism associated with stereotactic radiotherapy, the latter would not be appropriate for the patient.
His fatigue has diminished further and his sexual performance has improved. He is still married and his wife no longer suspects him of infidelity.
KEY POINTS
- IGF-1 is the screening test of choice in a patient with signs and symptoms of acromegaly.
- A growth hormone suppression test with a 75-g oral glucose load is the gold standard test for confirmation of the diagnosis of acromegaly in patients with an elevated IGF-1 level.
- Transsphenoidal resection of the growth hormone-secreting pituitary macroadenoma is the initial treatment of choice for acromegaly.
- Patients with residual or recurrent growth hormone-secreting pituitary macroadenoma can be treated with somatostatin receptor ligands, a growth hormone receptor antagonist (pegvisomant), and a dopamine agonist cabergoline.
- Radiotherapy is reserved for postsurgical treatment of patients with recurrent or persistent tumors who are resistant to or intolerant of medical therapy. Stereotactic radiotherapy has largely replaced conventional radiotherapy.
- Melmed S. Acromegaly pathogenesis and treatment. J Clin Invest 2009; 119:3189–3202.
- Molitch ME. Clinical manifestations of acromegaly. Endocrinol Metab Clin North Am 1992; 21:597–614.
- Dineen R, Stewart PM, Sherlock M. Acromegaly. QJM 2017; 110:411–420.
- Yacub A, Yaqub N. Insulin-mediated pseudoacromegaly: a case report and review of the literature. W V Med J 2008; 104:12–15.
- Mestron A, Webb SM, Astorga R, et al. Epidemiology, clinical characteristics, outcome, morbidity and mortality in acromegaly based on the Spanish Acromegaly Registry (Registro Espanol de Acromegalia, REA). Eur J Endocrinol 2004; 151:439–446.
- Zhu X, Lin CR, Prefontaine CG, Tollkuhn J, Rosenfeld MG. Genetic control of pituitary development and hypopituitarism. Curr Opin Genet Dev 2005; 15:332–340.
- Tannenbaum GS, Epelbaum J, Bowers CY. Interrelationship between the novel peptide ghrelin and somatostatin/growth hormone-releasing hormone in regulation of pulsatile growth hormone secretion. Endocrinology 2003; 144:967–974.
- Lanning NJ, Carter-Su C. Recent advances in growth hormone signaling. Rev Endocr Metab Disord 2006; 7:225–235.
- Colao A, Ferone D, Marzullo P, Lombardi G. Systemic complications of acromegaly: epidemiology, pathogenesis, and management. Endocr Rev 2004; 25:102–152.
- Larkin S, Reddy R, Karavitaki N, Cudlip S, Wass J, Ansorge O. Granulation pattern, but not GSP or GHR mutation, is associated with clinical characteristics in somatostatin-naive patients with somatotroph adenomas. Eur J Endocrinol 2013; 168:491–499.
- Dineen R, Stewart PM, Sherlock M. Acromegaly. QJM 2017; 110:411–420.
- Peacey SR, Toogood AA, Veldhuis JD, Thorner MO, Shalet SM. The relationship between 24-hour growth hormone secretion and insulin-like growth factor I in patients with successfully treated acromegaly: impact of surgery or radiotherapy. J Clin Endocrinol Metab 2001; 86:259–266.
- Livingstone C. IGF2 and cancer. Endocr Relat Cancer 2013; 20:R321–R339.
- Katznelson L, Laws ER Jr, Melmed S, et al. Acromegaly: an Endocrine Society clinical practice guideline. J Clin Endocrinol Metab 2014; 99:3933–3951.
- Melmed S. Acromegaly. N Engl J Med 2006; 355:2558–2573.
- Melmed S, Casanueva FF, Klibanski A, et al. A consensus on the diagnosis and treatment of acromegaly complications. Pituitary 2013; 16:294–302.
- Marquez Y, Tuchman A, Zada G. Surgery and radiosurgery for acromegaly: a review of indications, operative techniques, outcomes, and complications. Int J Endocrinol 2012; 2012: 386401.
- Jane JA Jr, Starke RM, Elzoghby MA, et al. Endoscopic transsphenoidal surgery for acromegaly: remission using modern criteria, complications, and predictors of outcome. J Clin Endocrinol Metab 2011; 96:2732–2740.
- Cappabianca P, Cavallo LM, Colao A, de Divitiis E. Surgical complications associated with the endoscopic endonasal transsphenoidal approach for pituitary adenomas. J Neurosurg 2002; 97:293–298.
- Nomikos P, Buchfelder M, Fahlbusch R. The outcome of surgery in 668 patients with acromegaly using current criteria of biochemical “cure.” Eur J Endocrinol 2005; 152:379–387.
- Howlett TA, Willis D, Walker G, Wass JA, Trainer PJ; UK Acromegaly Register Study Group (UKAR-3). Control of growth hormone and IGF1 in patients with acromegaly in the UK: responses to medical treatment with somatostatin analogues and dopamine agonists. Clin Endocrinol (Oxf) 2013; 79:689–699.
- Katznelson L. Pegvisomant for the treatment of acromegaly-translation of clinical trials into clinical practice. Nat Clin Pract Endocrinol Metab 2007; 3:514–515.
- Freda PU, Reyes CM, Nuruzzaman AT, Sundeen RE, Khandji AG, Post KD. Cabergoline therapy of growth hormone & growth hormone/prolactin secreting pituitary tumors. Pituitary 2004; 7:21–30.
- Castinetti F, Morange I, Dufour H, Regis J, Brue T. Radiotherapy and radiosurgery in acromegaly. Pituitary 2009; 12:3–10.
- Gheorghiu ML. Updates in outcomes of stereotactic radiation therapy in acromegaly. Pituitary 2017; 20:154–168.
- Melmed S. Acromegaly pathogenesis and treatment. J Clin Invest 2009; 119:3189–3202.
- Molitch ME. Clinical manifestations of acromegaly. Endocrinol Metab Clin North Am 1992; 21:597–614.
- Dineen R, Stewart PM, Sherlock M. Acromegaly. QJM 2017; 110:411–420.
- Yacub A, Yaqub N. Insulin-mediated pseudoacromegaly: a case report and review of the literature. W V Med J 2008; 104:12–15.
- Mestron A, Webb SM, Astorga R, et al. Epidemiology, clinical characteristics, outcome, morbidity and mortality in acromegaly based on the Spanish Acromegaly Registry (Registro Espanol de Acromegalia, REA). Eur J Endocrinol 2004; 151:439–446.
- Zhu X, Lin CR, Prefontaine CG, Tollkuhn J, Rosenfeld MG. Genetic control of pituitary development and hypopituitarism. Curr Opin Genet Dev 2005; 15:332–340.
- Tannenbaum GS, Epelbaum J, Bowers CY. Interrelationship between the novel peptide ghrelin and somatostatin/growth hormone-releasing hormone in regulation of pulsatile growth hormone secretion. Endocrinology 2003; 144:967–974.
- Lanning NJ, Carter-Su C. Recent advances in growth hormone signaling. Rev Endocr Metab Disord 2006; 7:225–235.
- Colao A, Ferone D, Marzullo P, Lombardi G. Systemic complications of acromegaly: epidemiology, pathogenesis, and management. Endocr Rev 2004; 25:102–152.
- Larkin S, Reddy R, Karavitaki N, Cudlip S, Wass J, Ansorge O. Granulation pattern, but not GSP or GHR mutation, is associated with clinical characteristics in somatostatin-naive patients with somatotroph adenomas. Eur J Endocrinol 2013; 168:491–499.
- Dineen R, Stewart PM, Sherlock M. Acromegaly. QJM 2017; 110:411–420.
- Peacey SR, Toogood AA, Veldhuis JD, Thorner MO, Shalet SM. The relationship between 24-hour growth hormone secretion and insulin-like growth factor I in patients with successfully treated acromegaly: impact of surgery or radiotherapy. J Clin Endocrinol Metab 2001; 86:259–266.
- Livingstone C. IGF2 and cancer. Endocr Relat Cancer 2013; 20:R321–R339.
- Katznelson L, Laws ER Jr, Melmed S, et al. Acromegaly: an Endocrine Society clinical practice guideline. J Clin Endocrinol Metab 2014; 99:3933–3951.
- Melmed S. Acromegaly. N Engl J Med 2006; 355:2558–2573.
- Melmed S, Casanueva FF, Klibanski A, et al. A consensus on the diagnosis and treatment of acromegaly complications. Pituitary 2013; 16:294–302.
- Marquez Y, Tuchman A, Zada G. Surgery and radiosurgery for acromegaly: a review of indications, operative techniques, outcomes, and complications. Int J Endocrinol 2012; 2012: 386401.
- Jane JA Jr, Starke RM, Elzoghby MA, et al. Endoscopic transsphenoidal surgery for acromegaly: remission using modern criteria, complications, and predictors of outcome. J Clin Endocrinol Metab 2011; 96:2732–2740.
- Cappabianca P, Cavallo LM, Colao A, de Divitiis E. Surgical complications associated with the endoscopic endonasal transsphenoidal approach for pituitary adenomas. J Neurosurg 2002; 97:293–298.
- Nomikos P, Buchfelder M, Fahlbusch R. The outcome of surgery in 668 patients with acromegaly using current criteria of biochemical “cure.” Eur J Endocrinol 2005; 152:379–387.
- Howlett TA, Willis D, Walker G, Wass JA, Trainer PJ; UK Acromegaly Register Study Group (UKAR-3). Control of growth hormone and IGF1 in patients with acromegaly in the UK: responses to medical treatment with somatostatin analogues and dopamine agonists. Clin Endocrinol (Oxf) 2013; 79:689–699.
- Katznelson L. Pegvisomant for the treatment of acromegaly-translation of clinical trials into clinical practice. Nat Clin Pract Endocrinol Metab 2007; 3:514–515.
- Freda PU, Reyes CM, Nuruzzaman AT, Sundeen RE, Khandji AG, Post KD. Cabergoline therapy of growth hormone & growth hormone/prolactin secreting pituitary tumors. Pituitary 2004; 7:21–30.
- Castinetti F, Morange I, Dufour H, Regis J, Brue T. Radiotherapy and radiosurgery in acromegaly. Pituitary 2009; 12:3–10.
- Gheorghiu ML. Updates in outcomes of stereotactic radiation therapy in acromegaly. Pituitary 2017; 20:154–168.
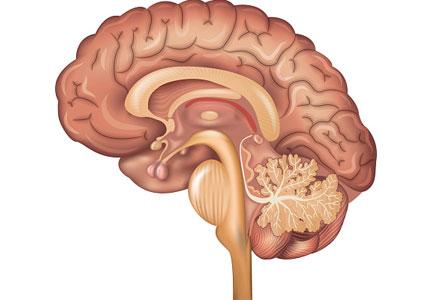
Transforming the delivery of cardiovascular care: Research and innovation in the Heart & Vascular Institute
Supplement Editor:
Umesh Khot, MD
Contents
Results of the GLAGOV trial
Steven E. Nissen and Stephen J. Nicholls
Trends in cardiovascular risk profiles
Samir Kapadia
Expanding indications for TAVR: The preferred procedure in intermediate-risk patients?
David L. Brown
CABG: A continuing evolution
Faisal Bakaeen
Improving the safety and efficacy of robotically assisted mitral valve surgery
Stephanie Mick
Aortic replacement in cardiac surgery
Eric E. Roselli
Supplement Editor:
Umesh Khot, MD
Contents
Results of the GLAGOV trial
Steven E. Nissen and Stephen J. Nicholls
Trends in cardiovascular risk profiles
Samir Kapadia
Expanding indications for TAVR: The preferred procedure in intermediate-risk patients?
David L. Brown
CABG: A continuing evolution
Faisal Bakaeen
Improving the safety and efficacy of robotically assisted mitral valve surgery
Stephanie Mick
Aortic replacement in cardiac surgery
Eric E. Roselli
Supplement Editor:
Umesh Khot, MD
Contents
Results of the GLAGOV trial
Steven E. Nissen and Stephen J. Nicholls
Trends in cardiovascular risk profiles
Samir Kapadia
Expanding indications for TAVR: The preferred procedure in intermediate-risk patients?
David L. Brown
CABG: A continuing evolution
Faisal Bakaeen
Improving the safety and efficacy of robotically assisted mitral valve surgery
Stephanie Mick
Aortic replacement in cardiac surgery
Eric E. Roselli
Palliative and supportive interventions to improve patient-reported outcomes in rural residents with cancer
People in rural areas have increased rates of advanced cancer and mortality compared with those who live in more affluent and urban areas.1,2 Indeed, a recent report from the Center for Disease Control found that rural residents have higher mortality rates from 5 leading causes of death, including cancer, compared with their urban counterparts.1 Significant challenges facing rural residents are due largely to not having easy access to cancer care and supportive care services.3 In addition, living in a rural area is associated with: a lower socioeconomic status, inadequate health insurance coverage, and less flexible employment that in turn decreases the ability to obtain the full range of supportive oncology services.4 The closest available specialists may be several hours away. Individuals may be unwilling or unable to travel hundreds of miles or more to see a specialist.3 Traveling places financial burdens on patients because of the cost of traveling and loss of work, which can compound the stress and fatigue associated with cancer treatment. People living in rural areas also may have less social support in commuting between their place of living and hospitals.5
Background
Typically, the primary goals of treatment for individuals with advanced cancer are to control the spread of the disease; maintain important patient-reported outcomes (PROs) such as physical, mental, and psychosocial function; and optimize quality of life (QoL). Health-related QoL (ie, the physical and mental health perceptions) are increasingly being used to assess effectiveness of cancer treatment.6 Palliative care and supportive oncology focus on managing physical, social, psychological, and spiritual needs of patients and have been recommended by the American Society of Clinical Oncology to be integrated into standard oncology care.7
People living in rural areas are less likely to get their care within a single health system. Often, their care is divided across multiple facilities and providers, which increases the chances of miscommunication between providers and can lead to inferior clinical outcomes and decreased patient QoL.8 There is a growing body of research describing the impact of palliative care on people with advanced cancer. Specifically, palliative care has been shown to reduce symptoms, improve QoL, and increase survival.9-11 Differences have been observed in the palliative care needs between people with cancer living in urban and suburban areas.12 It is likely that palliative care needs as well as the impact of palliative care services for people with advanced cancer in rural areas differs from those of their urban and suburban counterparts. Despite the known differences in access to care and impact of cancer between rural and nonrural residents, the impact of palliative care on people with advanced cancer living in rural areas has not been well described in the literature.
The purpose of this systematic review is to examine effect of palliative care and supportive oncology interventions on QoL in people with advanced cancer living in rural areas.
Methods
This systematic review was developed using the Preferred Reporting Items for Systematic Reviews and Meta-Analyses (PRISMA) guidelines.13
Eligibility criteria
To achieve the objective of a systemic review of studies describing supportive oncology and palliative care interventions in rural communities articles had to meet 4 inclusion criteria:
All research methods were eligible, including mixed-methods and program evaluations, as long as the article met the 4 inclusion criteria. Review articles were ineligible for inclusion as only original research was considered.
Search process
Search terms were developed by the research team with consultation from a medical librarian. Four main search terms were developed and included: palliative care, supportive oncology, rural, and cancer. Synonyms and terms closely related to the main terms were included in the search using the OR command. Examples of closely related search terms include: Palliative care: palliative; Rural: remote; Cancer: neoplasms (Table).
We systematically searched PyschINFO, PubMed, CINHAL, and Scopus for articles that had been published during 1991-2016 and written in English. Databases were chosen to reflect the different subfields that encompass palliative care and supportive oncology: PyschINFO to capture the psychological perspective, CINHAL to capture the nursing perspective, and PubMed to capture the medical perspective. Finally, Scopus was searched to ensure that articles not indexed by the other databases would be included. The search was limited to the past 25 years to capture the most up-to-date literature.
Selection process
In accordance with PRISMA guidelines, articles underwent an initial screening and an eligibility screening for inclusion in the final review.13 After duplicates were removed, 2 research team members reviewed all abstracts to screen for initial eligibility. Articles that successfully passed the screening process were reviewed in full by 4 research team members. Each member made an independent inclusion decision based on the stated inclusion criteria. Disagreements across team members were resolved through discussion and consensus.
Analysis
The articles that met the inclusion criteria were heterogeneous in design and analytic approach. The set of manuscripts identified, therefore, did not meet the statistical assumptions for meta-analytic data analysis. The analytic plan for this review consisted of sorting the results described in the identified articles into meaningful categories, identifying cross cutting themes, and presenting the results of these themes in narrative forms.
Results
Study selection
The search strategy resulted in 886 articles across the 4 databases. The breakdown for each database is as follows: PsychINFO (n = 286), PubMed (n = 194), CINHAL (n = 334), Scopus (n = 72). After duplicates were removed, 864 articles were left and were initially screened resulting in 844 articles being excluded. The remaining 20 articles were reviewed and 12 articles failed to meet the inclusion criteria. Reasons for exclusion included: the population was not rural; no advanced cancer in sample; intervention was not specifically palliative care or supportive oncology. Nine articles representing 8 projects (one project published 2 manuscripts included in this review) were included in the final review (Figure).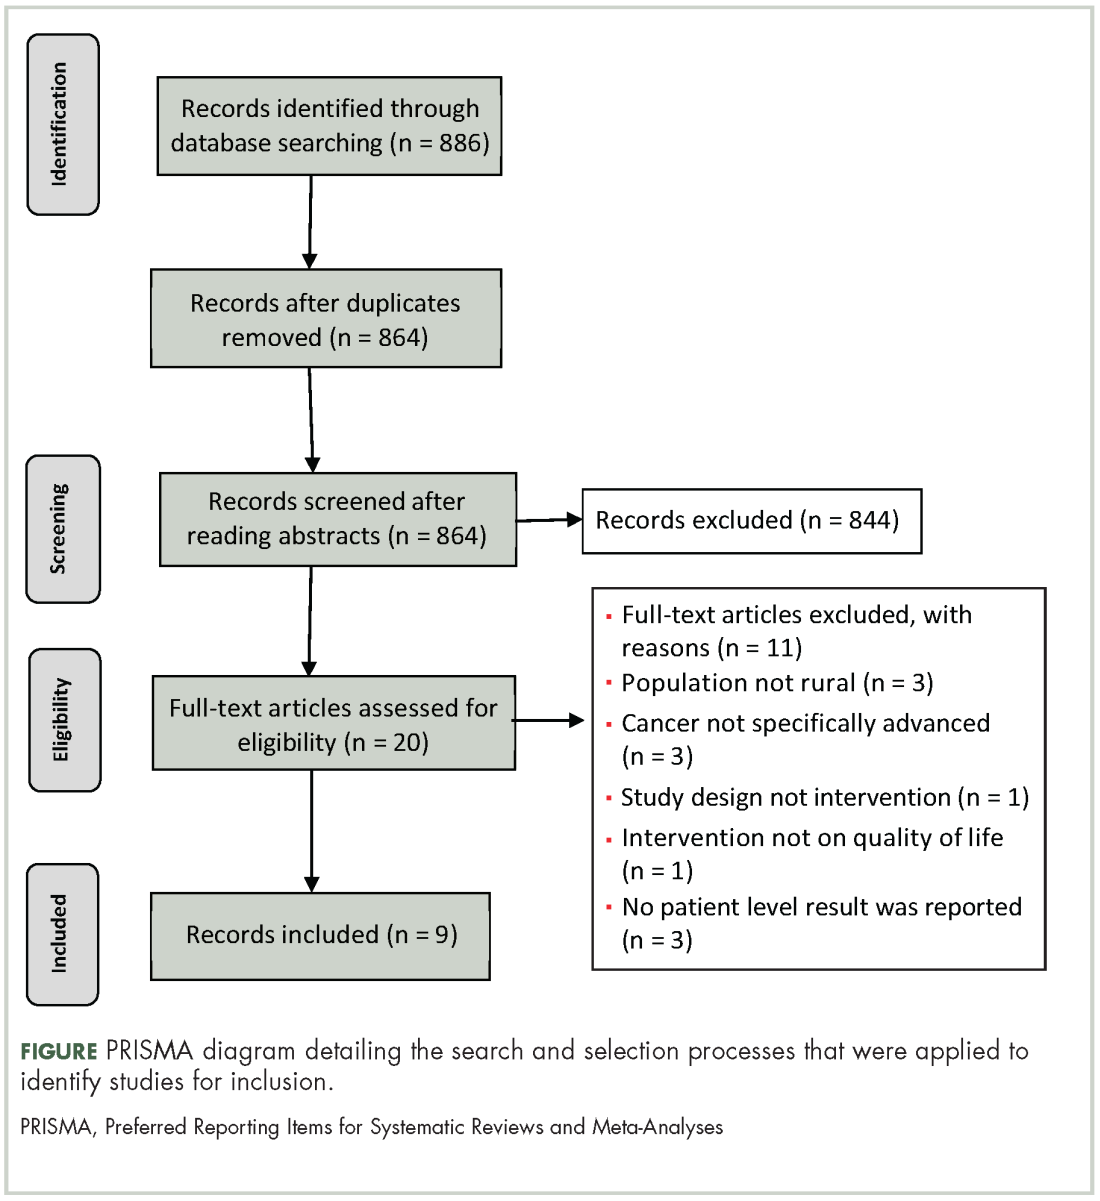
After reviewing the articles, 2 clear themes arose: PROs, and overall impact of rural palliative care for people and society. The PRO theme included articles that provided information on how an intervention or program improved the personal lives experience of rural cancer patients. PROs, such as decreased symptomology, were often reported. The “overall impact of rural palliative care for people and society” theme included articles that provided information on how an intervention or program improved the lives of rural people and society as a larger group. An example would include results indicating how a program increased access to supportive oncology care in a rural area.
Study characteristics
Nine publications, describing 8 projects were included in this review (Table). These projects were conducted in Canada (n = 3)14-16 Australia (n = 1)17 and the United States (n = 5).18-22 All of the the projects used a quantitative approach for the analysis, except 1 that used mixed-methods.16 The studies designs were: 4 feasibilities/pilot studies, 1 randomized control trials (RCT), and 3 program evaluations.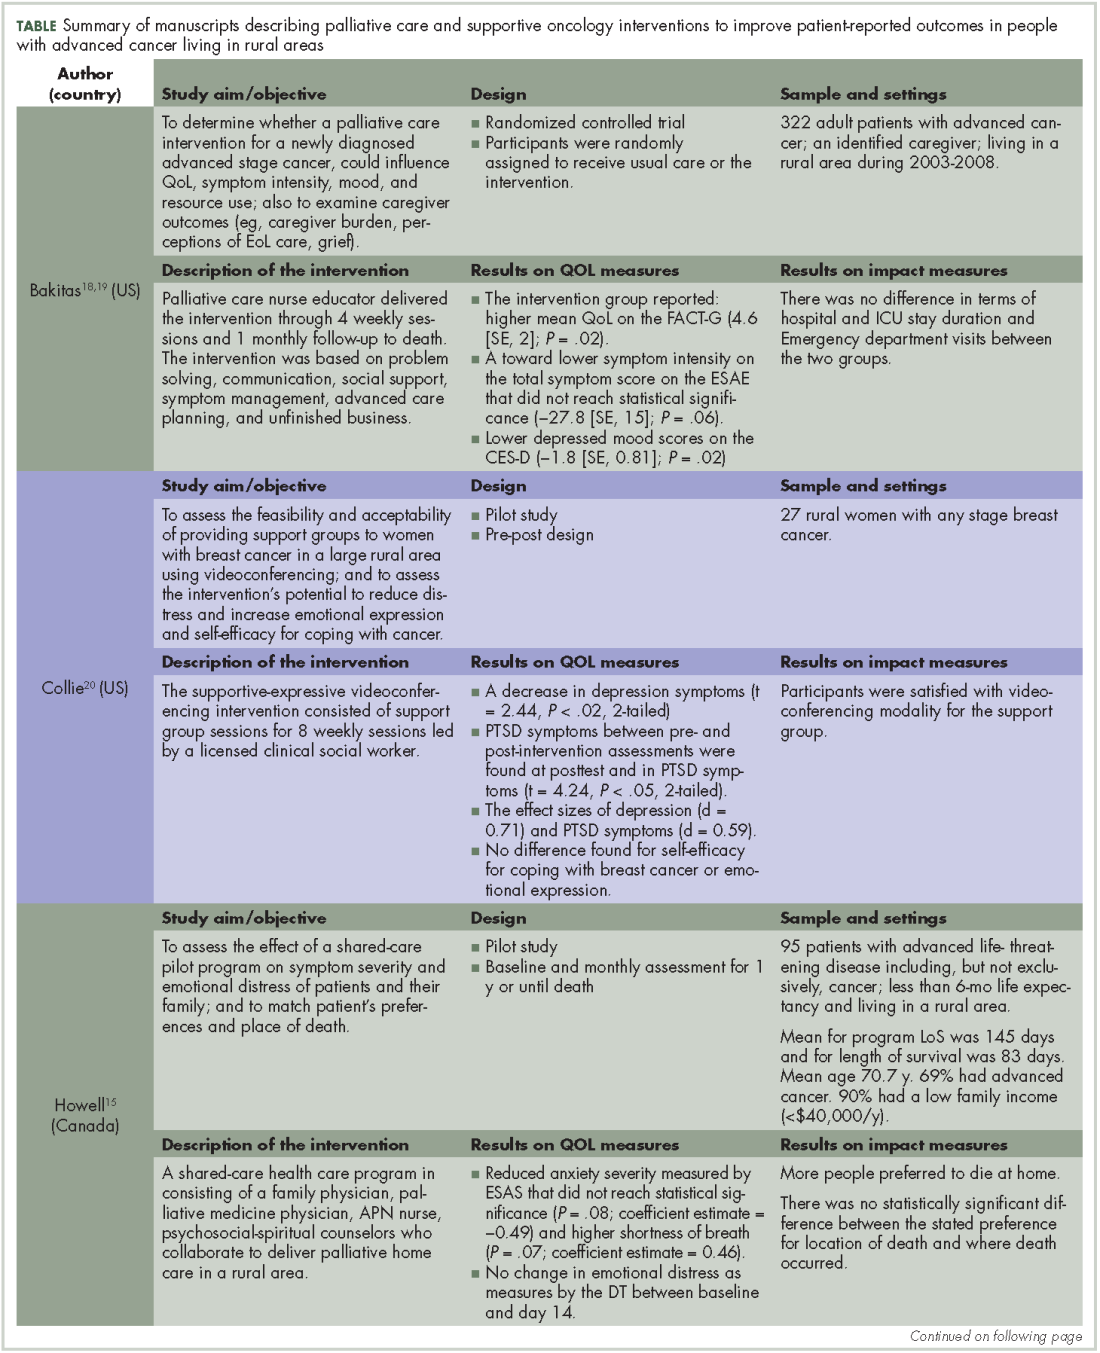
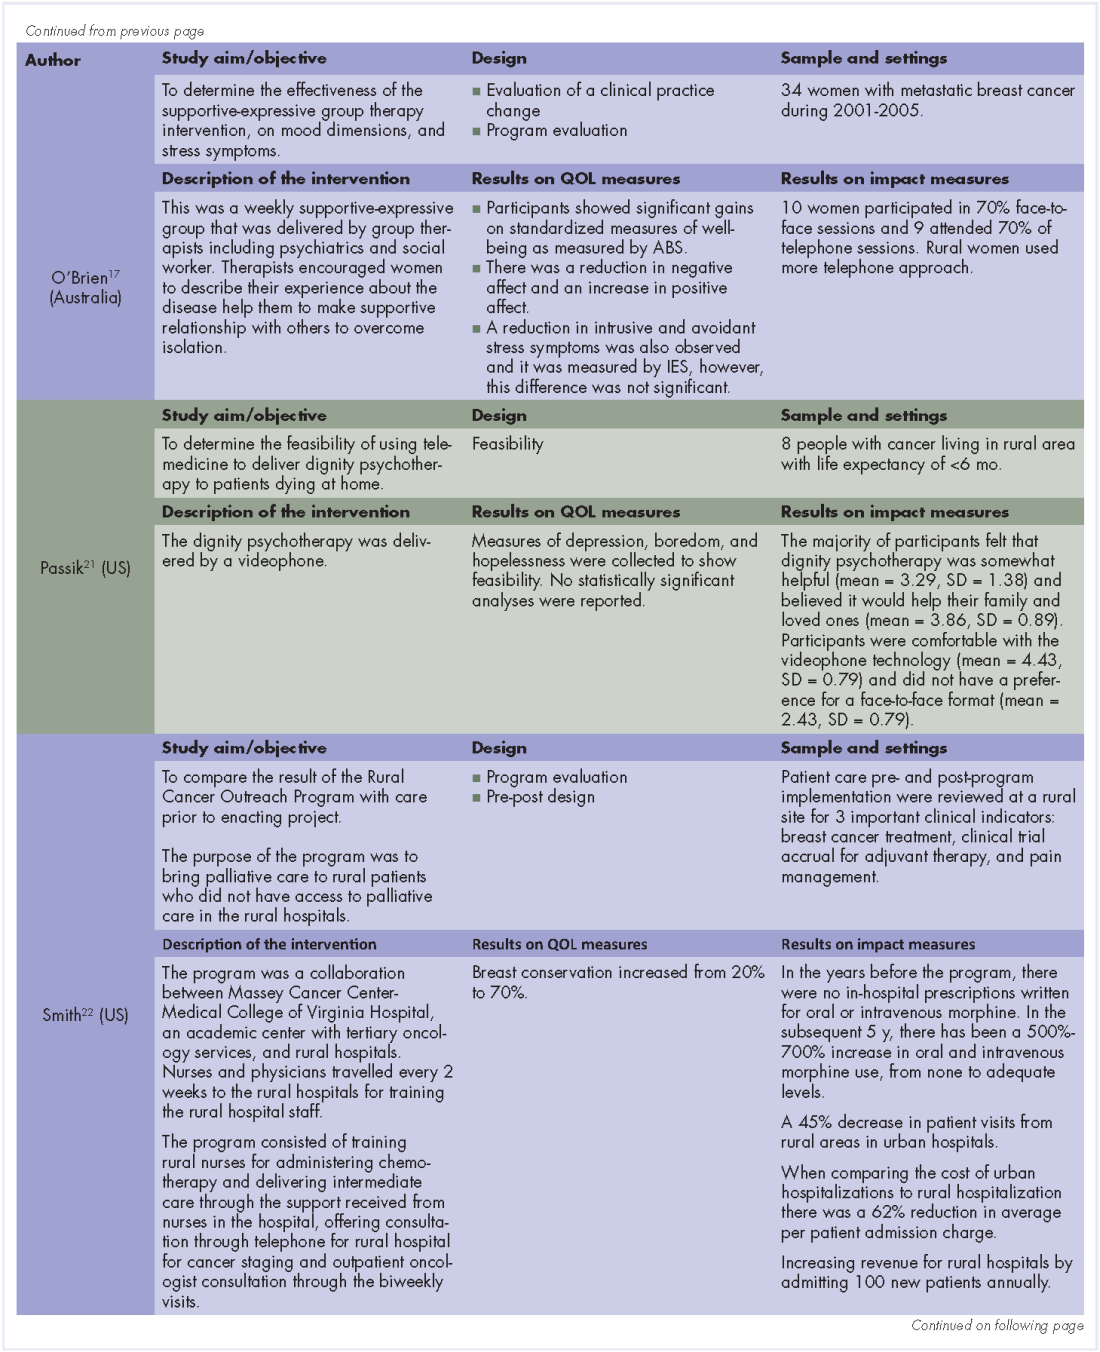
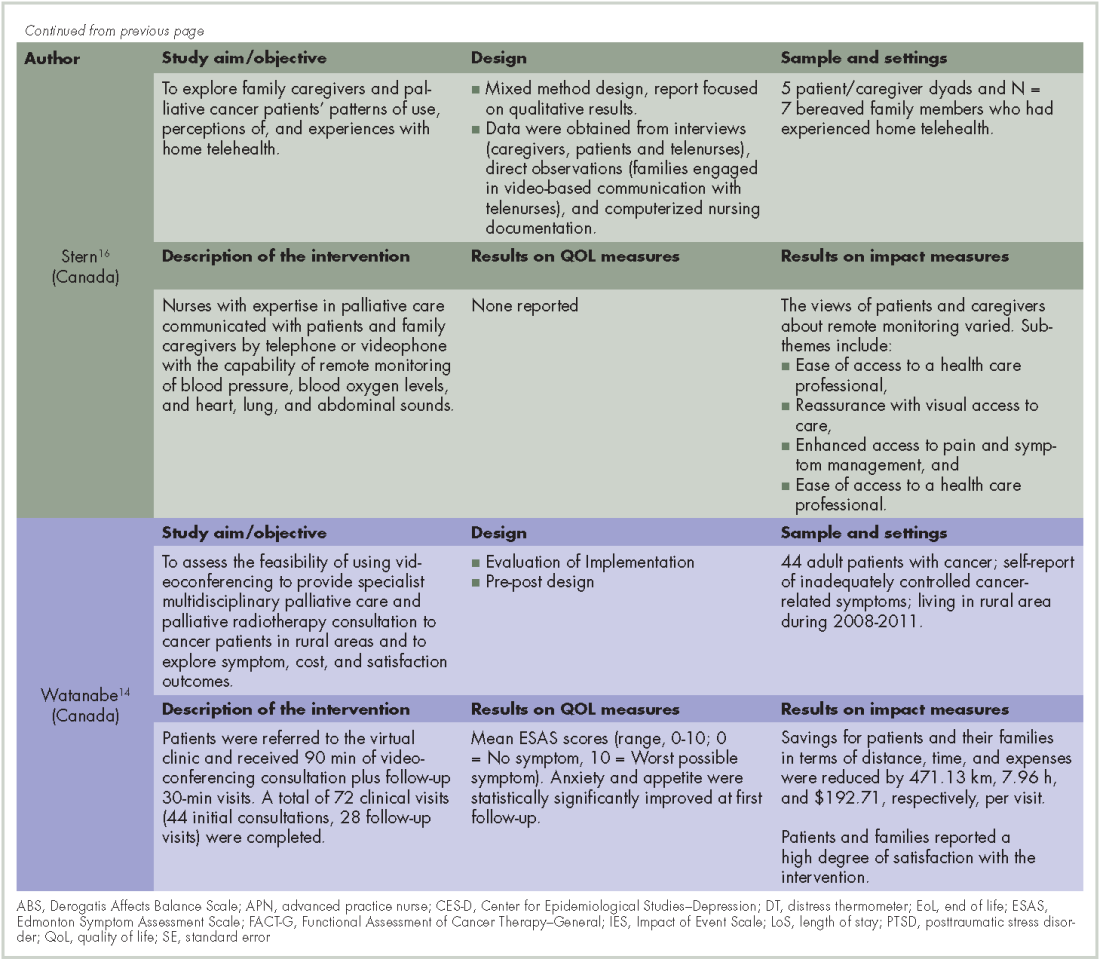
A total of 807 patients participated across the 9 articles. Participants’ age ranged from 20 to 88 years. The average ages for participants ranged from 50.4 to 70.7 years. Overall, there were slightly more men (55%) than women (45%) when all the demographic data were combined across the 9 articles; however, 2 articles exclusively had women as part of the sample.17,20 The cancer types that participants had included: gastrointestinal, genitourinary, breast, lung, brain, kidney, and hematological. Finally, the articles had inconsistent reporting of race/ethnicity data with only 4 studies reporting this information; of the 4 studies, 91% of participants self-identified as white.
The projects targeted multiple PROs, including physical symptoms and psychosocial issues (ie, stress management, grief, mood, emotional distress, coping, self-efficacy, dignity, joy, affection) domains. Publications dates ranged from 1996 to 2013. The sample sizes ranged from 8 to 322; 11.7%-100% of the study population had advanced cancer, and 20%-100% were living in rural area. The duration of the clinical intervention described was 30-120 minutes. The modes of delivery for the palliative intervention were videoconference/videophone (n = 3), telephone/teleconference (n = 3), and in person (n = 2). The interventions were delivered by nurses, psychiatrists, and social workers. In 5 of these studies, participants received palliative care on an individual basis and 2 studies delivered their intervention through groups. The individual basis studies focused on physical aspects of care and the group studies focused on emotional aspects of care.
Patient-reported outcomes
Cancer and its treatments are often associated with physical and emotional sequelae that can have a significant impact on patients and therefore PROs. The interventions reviewed in this article often reported data on the reduction of the physical and/or emotional symptom burden of cancer as well as overall QoL.
Reduction in physical symptoms. Three articles included physical symptoms as an outcome measure. Of those, 2 were pilot or feasibility studies, and 1 was a randomized control trial. Common physical symptoms included: shortness of breath, pain, fatigue, nausea, and appetite change. Across the articles, the Edmonton Symptom Assessment Scale (ESAS), a 10-item inventory of common cancer symptoms, was frequently used to measure of symptom scores in these interventions.14,15,19 The ESAS is an empirically validated measure that is used in palliative care research and clinical practice. Individuals are asked to rank 10 common symptoms on an ascending scale from 1 to 10 (0, the symptom is absent; 10, worst possible severity).23
The findings from these 3 research studies were encouraging. In a large randomized control trial of a supportive education program, researchers reported decreased physical symptom intensity after the intervention, however the change did not reach statistical significance.18 Similar findings were reported in a videoconferencing and a home health program to improve access of palliative and supportive oncology health care.14,15 Physical symptoms that had decreasing trends were pain, tiredness, and appetite, however, trends for shortness of breath found increasing severity.14,15 Although these trends were observed, it is important to note that scores on the ESAS did not reach statistical significance for physical symptoms in any of these studies.
Reduction in emotional symptom reduction. In addition to reducing physical symptoms, researchers also sought to understand the impact of programs on the emotional symptoms of cancer including: anxiety, depression, negative affect, and posttraumatic stress disorder (PTSD). Five articles included emotional symptoms as an outcome measure. Four were pilot or feasibility studies, and 1 was a randomized control trial.
Results across studies indicated an observable decrease in the severity of anxiety and depression for those exposed to an intervention program.14,15,18,19 Again, although trends were found, the results were not statistically significant. Only Watanabe and colleagues14 reported a statistically significant a decrease in anxiety in participants after the implementation of a rural palliative care videoconference consultation program. One report indicated that data on depression severity was collected but was not analyzed because of a small sample size.21
O’Brien and colleagues17 also collected data on negative affect and found that participants who participated in a supportive-expressive therapy group had a reduction in the negative affect as measured by the Derogatis Affects Balance Scale (ABS). Other researchers found no change in emotional distress.15
Finally, Collie and colleagues20 also measured the impact of a videoconference support group of PTSD symptomology for people with breast cancer in rural areas. Their results indicated a statistically significant decrease on the PTSD Checklist-Specific after intervention. Analysis of the data also found a medium effect size. Participants in the intervention group spoke about how participation in the support group allowed them to be generative and share information about breast cancer as well as build an emotional bond with other women with cancer.
Overall quality of life and well-being. Researchers have also looked into impact of intervention on overall QoL. Two articles included QoL or Well-being as an outcome measure. One was a pilot study and 1 was a randomized control trial.
Bakitas and colleagues18,19 found that those enrolled in the intervention arm of their study had higher QoL scores on the Functional Assessment of Cancer Therapy-General (FACT-G) compared with those in the control arm. These results were also found in an analysis of data from participants who subsequently died during the intervention. Improvements in overall well-being were also found by O’Brien and colleagues17 using ABS. They reported that a post hoc comparison of participants’ total positive affect score was significantly higher at the 12-month follow-up. In addition, the authors also noted qualitative improvements in well-being, including increased effort to be at the support group and the low attrition rates.
Overall impact of rural palliative care on individuals and society. In addition to reducing physical and emotional symptoms in patients, several of the articles also addressed other measures of the overall impact of the intervention or program on society as a whole. The authors evaluated patient satisfaction and quality of life, access to health care services, and financial impact on individuals and society at large.
Satisfaction with intervention. In 2 of the articles, individuals or their family members reported to be satisfied with the intervention14,20 and said they would recommend it to others as well.20 Both of those studies used teleconferencing to provide access to the intervention to people in rural communities.
Increasing access to the health care services and quality of care. Four of the articles evaluated the impact of intervention on patient’s access to the health care services.14,16,20,22 Specifically, after the interventions individuals had increased access to palliative care information in rural areas where it had previously been unavailable20 as well as actual delivery of clinical care in their home community, thus eliminating the need to travel to urban areas.14,20,22 This increase of access to health care services in rural area had significant effect on time and distance spent traveling. In 1 study, the amount of saving in terms of distance was 471.13 km and time in, 7.96 hours, for each visit.14
In addition, the quality of overall cancer care in rural area was increased. In an early clinical program, to increase access of palliative care in rural communities, the authors reported an increase in the breast conservation from 20% at the start of the program to 70% 2 years after the program was implemented.22 Breast conservation is not a typical outcome for palliative care studies, but the authors highlighted this practice change because of the improved QoL that is associated with the use of breast conservation therapies. In the same study, the authors reported an increased use of curative therapies for other cancers such as lymphoma as well as an increase use of pain management medication.
Financial impact. Two articles described the financial impact of cancer care costs on the patient and society.14,22 In a study by Watanabe and colleagues in Canada,14 the amount of savings after the intervention in terms of travel expenses was C$192.71 for each visit because patients had previously had to travel from their rural communities to urban tertiary hospitals to receive palliative care. For some patients in that study, the amount of saving for expenses was as high as C$500 a visit. In addition, some individuals were not able to travel and would not have received anything if the intervention had not been available remotely.14 In a study by Smith and colleagues in the United States, there was a 62% decrease in the cost to society for each patient, from US$10,233 to US$3,862.22 The factors contributing to that reduction included increasing outpatient services, engaging nurses and primary care providers instead of specialists, and the lower costs of living in rural areas. In addition, the rural hospitals saw an increase in revenue and profits because of higher admission rates ($500,00 for each hospital annually).22
Discussion
The articles identified in this review provide some evidence of the potential impact that palliative and supportive oncology interventions could have on PROs for rural residents with advanced cancer. Noteworthy results were seen for impact on reducing physical and emotional symptoms, increasing overall QoL and well-being, increasing satisfaction and access to palliative care, and reducing the overall cost of palliative care for individuals and society.14-18,20-22
Although statistical significance was not observed for most of the symptom assessment, trends toward improved symptom reports were observed. A likely explanation for this finding, is the small sample size or inadequate design to evaluate symptoms as an outcome measure. Three studies were pilot or feasibility projects15,20,21 that were not powered to detect the impact of the intervention on symptoms. In contrast, QoL stands out as an outcome that was positively affected by palliative care interventions. Further research is needed to determine if there are important mediating and moderating factors that contribute to improve QoL that are specific to rural residents. Significant outcomes were also reported for participant satisfaction with the interventions, the increase in access to services, and the decrease in costs.
Although there were not enough studies to determine the efficacy of these interventions, these results suggest that palliative and supportive interventions can have an impact on important patient-reported outcomes, such as symptoms and quality of life, and on health care system outcomes, such as cost. Evidence supporting the extent of the effectiveness of palliative care on various PROs in rural people is limited. None of the studies in this review evaluated the different aspects of palliative care specifically in rural residents.
It is interesting to note that all but one of the interventions used a telehealth approach to deliver the intervention. Telehealth interventions seem to be feasible, acceptable to people in rural areas, and show preliminary evidence that they can have an impact on PROs.
Limitations of this review include only inclusion of publications in English. In addition, some studies in this review include populations that were not exclusively rural residents, which makes it difficult for generalization.
Conclusion
Palliative and supportive interventions may improve various PROs in people with advanced cancer living in rural areas. Technologies that support remote access to people in rural areas, such as teleconferencing and videoconferencing, seem particularly promising delivery modalities with their potential to increase access to palliative and supportive interventions in underserved communities. Large-scale studies that are powered to test the impact of palliative care and support oncology interventions on PROs and other aspects of quality care among rural residents with advanced cancer are needed.
The authors thank Jennifer DeBerg, Health Science Librarian at the University of Iowa for her assistance in developing the literature search strategies.
1. Moy E, Garcia MC, Bastian B, et al. Leading causes of death in nonmetropolitan and metropolitan areas – United States, 1999-2014 [published correction at https://www.cdc.gov/mmwr/volumes/66/wr/mm6603a11.htm]. MMWR Surveillance Summaries [serial online]. https://www.cdc.gov/mmwr/volumes/66/ss/ss6601a1.htm?s_cid=ss6601a1_w. Published January 13, 2017. Accessed January 20, 2017.
2. Singh GK, Williams SD, Siahpush M, Mulhollen A. Socioeconomic, rural-urban, and racial inequalities in US Cancer Mortality: Part I – All cancers and lung cancer and Part II – Colorectal, prostate, breast, and cervical cancers. https://www.hindawi.com/journals/jce/2011/107497/. Published 2011. Accessed April 28, 2017.
3. Charlton M, Schlichting J, Chioreso C, Ward M, Vikas P. Challenges of rural cancer care in the United States. Oncology (Williston Park). 2015;29(9):633-640.
4. Weaver KE, Geiger AM, Lu L, Case LD. Rural‐urban disparities in health status among US cancer survivors. Cancer. 2013;119(5):1050-1057.
5. Fuchsia Howard A, Smillie K, Turnbull K, et al. Access to medical and supportive care for rural and remote cancer survivors in northern British Columbia. J Rural Health. 2014;30(3):311-321.
6. Bottomley A, Aaronson NK. International perspective on health-related quality-of-life research in cancer clinical trials: the European Organisation for Research and Treatment of Cancer experience. J Clin Oncol. 2007;25(32):5082-5086.
7. Smith TJ, Temin S, Alesi ER, et al. American Society of Clinical Oncology provisional clinical opinion: the integration of palliative care into standard oncology care. J Clin Oncol. 2012;30(8):880-887.
8. Baldwin LM, Cai Y, Larson EH, et al. Access to cancer services for rural colorectal cancer patients. J Rural Health. 2008;24(4):390-399.
9. Temel JS, Greer JA, Muzikansky A, et al. Early palliative care for patients with metastatic non-small-cell lung cancer. N Engl J Med. 2010;363(8):733-742.
10. McCorkle R, Jeon S, Ercolano E, et al. An advanced practice nurse coordinated multidisciplinary intervention for patients with late-stage cancer: a cluster randomized trial. J Palliat Med. 2015;18(11):962-969.
11. Zimmermann C, Swami N, Krzyzanowska M, et al. Early palliative care for patients with advanced cancer: a cluster-randomised controlled trial. Lancet. 2014;383(9930):1721-1730.
12. Regn R, Robinson W, Robinson WR. Differences in palliative care needs among cancer survivors in an inner city academic facility versus a suburban community facility. J Clin Oncol. 2015;33(29_suppl):61.
13. Moher D, Liberati A, Tetzlaff J, Altman DG. Preferred reporting items for systematic reviews and meta-analyses: the PRISMA statement. Ann Intern Med. 2009;339:b2535.
14. Watanabe SM, Fairchild A, Pituskin E, Borgersen P, Hanson J, Fassbender K. Improving access to specialist multidisciplinary palliative care consultation for rural cancer patients by videoconferencing: report of a pilot project. Support Care Cancer. 2013;21(4):1201-1207.
15. Howell D, Marshall D, Brazil K, et al. A shared care model pilot for palliative home care in a rural area: impact on symptoms, distress, and place of death. J Pain Symptom Manage. 2011;42(1):60-75.
16. Stern A, Valaitis R, Weir R, Jadad AR. Use of home telehealth in palliative cancer care: a case study. J Telemed Telecare. 2012;18(5):297-300.
17. O’Brien M, Harris J, King R, O’Brien T. Supportive-expressive group therapy for women with metastatic breast cancer: Improving access for Australian women through use of teleconference. Counselling Psychother Res. 2008;8(1):28-35.
18. Bakitas M, Lyons KD, Hegel MT, et al. The project ENABLE II randomized controlled trial to improve palliative care for rural patients with advanced cancer: baseline findings, methodological challenges, and solutions. Palliat Supportive Care. 2009;7(1):75-86.
19. Bakitas M, Lyons KD, Hegel MT, et al. Effects of a palliative care intervention on clinical outcomes in patients with advanced cancer: the Project ENABLE II randomized controlled trial. JAMA. 2009;302(7):741-749.
20. Collie K, Kreshka MA, Ferrier S, et al. Videoconferencing for delivery of breast cancer support groups to women living in rural communities: a pilot study. Psychooncology. 200
21. Passik SD, Kirsh KL, Leibee S, et al. A feasibility study of dignity psychotherapy delivered via telemedicine. Palliat Support Care. 2004;2(2):149-155.
22. Smith TJ, Desch CE, Grasso MA, et al. The Rural Cancer Outreach Program: clinical and financial analysis of palliative and curative care for an underserved population. Cancer Treat Rev. 1996;22(Suppl A):97-101.
23. Bruera E, Kuehn N, Miller MJ, Selmser P, Macmillan K. The Edmonton Symptom Assessment System (ESAS): a simple method for the assessment of palliative care patients. J Palliat Care. 1991;7(2):6-9.
People in rural areas have increased rates of advanced cancer and mortality compared with those who live in more affluent and urban areas.1,2 Indeed, a recent report from the Center for Disease Control found that rural residents have higher mortality rates from 5 leading causes of death, including cancer, compared with their urban counterparts.1 Significant challenges facing rural residents are due largely to not having easy access to cancer care and supportive care services.3 In addition, living in a rural area is associated with: a lower socioeconomic status, inadequate health insurance coverage, and less flexible employment that in turn decreases the ability to obtain the full range of supportive oncology services.4 The closest available specialists may be several hours away. Individuals may be unwilling or unable to travel hundreds of miles or more to see a specialist.3 Traveling places financial burdens on patients because of the cost of traveling and loss of work, which can compound the stress and fatigue associated with cancer treatment. People living in rural areas also may have less social support in commuting between their place of living and hospitals.5
Background
Typically, the primary goals of treatment for individuals with advanced cancer are to control the spread of the disease; maintain important patient-reported outcomes (PROs) such as physical, mental, and psychosocial function; and optimize quality of life (QoL). Health-related QoL (ie, the physical and mental health perceptions) are increasingly being used to assess effectiveness of cancer treatment.6 Palliative care and supportive oncology focus on managing physical, social, psychological, and spiritual needs of patients and have been recommended by the American Society of Clinical Oncology to be integrated into standard oncology care.7
People living in rural areas are less likely to get their care within a single health system. Often, their care is divided across multiple facilities and providers, which increases the chances of miscommunication between providers and can lead to inferior clinical outcomes and decreased patient QoL.8 There is a growing body of research describing the impact of palliative care on people with advanced cancer. Specifically, palliative care has been shown to reduce symptoms, improve QoL, and increase survival.9-11 Differences have been observed in the palliative care needs between people with cancer living in urban and suburban areas.12 It is likely that palliative care needs as well as the impact of palliative care services for people with advanced cancer in rural areas differs from those of their urban and suburban counterparts. Despite the known differences in access to care and impact of cancer between rural and nonrural residents, the impact of palliative care on people with advanced cancer living in rural areas has not been well described in the literature.
The purpose of this systematic review is to examine effect of palliative care and supportive oncology interventions on QoL in people with advanced cancer living in rural areas.
Methods
This systematic review was developed using the Preferred Reporting Items for Systematic Reviews and Meta-Analyses (PRISMA) guidelines.13
Eligibility criteria
To achieve the objective of a systemic review of studies describing supportive oncology and palliative care interventions in rural communities articles had to meet 4 inclusion criteria:
All research methods were eligible, including mixed-methods and program evaluations, as long as the article met the 4 inclusion criteria. Review articles were ineligible for inclusion as only original research was considered.
Search process
Search terms were developed by the research team with consultation from a medical librarian. Four main search terms were developed and included: palliative care, supportive oncology, rural, and cancer. Synonyms and terms closely related to the main terms were included in the search using the OR command. Examples of closely related search terms include: Palliative care: palliative; Rural: remote; Cancer: neoplasms (Table).
We systematically searched PyschINFO, PubMed, CINHAL, and Scopus for articles that had been published during 1991-2016 and written in English. Databases were chosen to reflect the different subfields that encompass palliative care and supportive oncology: PyschINFO to capture the psychological perspective, CINHAL to capture the nursing perspective, and PubMed to capture the medical perspective. Finally, Scopus was searched to ensure that articles not indexed by the other databases would be included. The search was limited to the past 25 years to capture the most up-to-date literature.
Selection process
In accordance with PRISMA guidelines, articles underwent an initial screening and an eligibility screening for inclusion in the final review.13 After duplicates were removed, 2 research team members reviewed all abstracts to screen for initial eligibility. Articles that successfully passed the screening process were reviewed in full by 4 research team members. Each member made an independent inclusion decision based on the stated inclusion criteria. Disagreements across team members were resolved through discussion and consensus.
Analysis
The articles that met the inclusion criteria were heterogeneous in design and analytic approach. The set of manuscripts identified, therefore, did not meet the statistical assumptions for meta-analytic data analysis. The analytic plan for this review consisted of sorting the results described in the identified articles into meaningful categories, identifying cross cutting themes, and presenting the results of these themes in narrative forms.
Results
Study selection
The search strategy resulted in 886 articles across the 4 databases. The breakdown for each database is as follows: PsychINFO (n = 286), PubMed (n = 194), CINHAL (n = 334), Scopus (n = 72). After duplicates were removed, 864 articles were left and were initially screened resulting in 844 articles being excluded. The remaining 20 articles were reviewed and 12 articles failed to meet the inclusion criteria. Reasons for exclusion included: the population was not rural; no advanced cancer in sample; intervention was not specifically palliative care or supportive oncology. Nine articles representing 8 projects (one project published 2 manuscripts included in this review) were included in the final review (Figure).
After reviewing the articles, 2 clear themes arose: PROs, and overall impact of rural palliative care for people and society. The PRO theme included articles that provided information on how an intervention or program improved the personal lives experience of rural cancer patients. PROs, such as decreased symptomology, were often reported. The “overall impact of rural palliative care for people and society” theme included articles that provided information on how an intervention or program improved the lives of rural people and society as a larger group. An example would include results indicating how a program increased access to supportive oncology care in a rural area.
Study characteristics
Nine publications, describing 8 projects were included in this review (Table). These projects were conducted in Canada (n = 3)14-16 Australia (n = 1)17 and the United States (n = 5).18-22 All of the the projects used a quantitative approach for the analysis, except 1 that used mixed-methods.16 The studies designs were: 4 feasibilities/pilot studies, 1 randomized control trials (RCT), and 3 program evaluations.
A total of 807 patients participated across the 9 articles. Participants’ age ranged from 20 to 88 years. The average ages for participants ranged from 50.4 to 70.7 years. Overall, there were slightly more men (55%) than women (45%) when all the demographic data were combined across the 9 articles; however, 2 articles exclusively had women as part of the sample.17,20 The cancer types that participants had included: gastrointestinal, genitourinary, breast, lung, brain, kidney, and hematological. Finally, the articles had inconsistent reporting of race/ethnicity data with only 4 studies reporting this information; of the 4 studies, 91% of participants self-identified as white.
The projects targeted multiple PROs, including physical symptoms and psychosocial issues (ie, stress management, grief, mood, emotional distress, coping, self-efficacy, dignity, joy, affection) domains. Publications dates ranged from 1996 to 2013. The sample sizes ranged from 8 to 322; 11.7%-100% of the study population had advanced cancer, and 20%-100% were living in rural area. The duration of the clinical intervention described was 30-120 minutes. The modes of delivery for the palliative intervention were videoconference/videophone (n = 3), telephone/teleconference (n = 3), and in person (n = 2). The interventions were delivered by nurses, psychiatrists, and social workers. In 5 of these studies, participants received palliative care on an individual basis and 2 studies delivered their intervention through groups. The individual basis studies focused on physical aspects of care and the group studies focused on emotional aspects of care.
Patient-reported outcomes
Cancer and its treatments are often associated with physical and emotional sequelae that can have a significant impact on patients and therefore PROs. The interventions reviewed in this article often reported data on the reduction of the physical and/or emotional symptom burden of cancer as well as overall QoL.
Reduction in physical symptoms. Three articles included physical symptoms as an outcome measure. Of those, 2 were pilot or feasibility studies, and 1 was a randomized control trial. Common physical symptoms included: shortness of breath, pain, fatigue, nausea, and appetite change. Across the articles, the Edmonton Symptom Assessment Scale (ESAS), a 10-item inventory of common cancer symptoms, was frequently used to measure of symptom scores in these interventions.14,15,19 The ESAS is an empirically validated measure that is used in palliative care research and clinical practice. Individuals are asked to rank 10 common symptoms on an ascending scale from 1 to 10 (0, the symptom is absent; 10, worst possible severity).23
The findings from these 3 research studies were encouraging. In a large randomized control trial of a supportive education program, researchers reported decreased physical symptom intensity after the intervention, however the change did not reach statistical significance.18 Similar findings were reported in a videoconferencing and a home health program to improve access of palliative and supportive oncology health care.14,15 Physical symptoms that had decreasing trends were pain, tiredness, and appetite, however, trends for shortness of breath found increasing severity.14,15 Although these trends were observed, it is important to note that scores on the ESAS did not reach statistical significance for physical symptoms in any of these studies.
Reduction in emotional symptom reduction. In addition to reducing physical symptoms, researchers also sought to understand the impact of programs on the emotional symptoms of cancer including: anxiety, depression, negative affect, and posttraumatic stress disorder (PTSD). Five articles included emotional symptoms as an outcome measure. Four were pilot or feasibility studies, and 1 was a randomized control trial.
Results across studies indicated an observable decrease in the severity of anxiety and depression for those exposed to an intervention program.14,15,18,19 Again, although trends were found, the results were not statistically significant. Only Watanabe and colleagues14 reported a statistically significant a decrease in anxiety in participants after the implementation of a rural palliative care videoconference consultation program. One report indicated that data on depression severity was collected but was not analyzed because of a small sample size.21
O’Brien and colleagues17 also collected data on negative affect and found that participants who participated in a supportive-expressive therapy group had a reduction in the negative affect as measured by the Derogatis Affects Balance Scale (ABS). Other researchers found no change in emotional distress.15
Finally, Collie and colleagues20 also measured the impact of a videoconference support group of PTSD symptomology for people with breast cancer in rural areas. Their results indicated a statistically significant decrease on the PTSD Checklist-Specific after intervention. Analysis of the data also found a medium effect size. Participants in the intervention group spoke about how participation in the support group allowed them to be generative and share information about breast cancer as well as build an emotional bond with other women with cancer.
Overall quality of life and well-being. Researchers have also looked into impact of intervention on overall QoL. Two articles included QoL or Well-being as an outcome measure. One was a pilot study and 1 was a randomized control trial.
Bakitas and colleagues18,19 found that those enrolled in the intervention arm of their study had higher QoL scores on the Functional Assessment of Cancer Therapy-General (FACT-G) compared with those in the control arm. These results were also found in an analysis of data from participants who subsequently died during the intervention. Improvements in overall well-being were also found by O’Brien and colleagues17 using ABS. They reported that a post hoc comparison of participants’ total positive affect score was significantly higher at the 12-month follow-up. In addition, the authors also noted qualitative improvements in well-being, including increased effort to be at the support group and the low attrition rates.
Overall impact of rural palliative care on individuals and society. In addition to reducing physical and emotional symptoms in patients, several of the articles also addressed other measures of the overall impact of the intervention or program on society as a whole. The authors evaluated patient satisfaction and quality of life, access to health care services, and financial impact on individuals and society at large.
Satisfaction with intervention. In 2 of the articles, individuals or their family members reported to be satisfied with the intervention14,20 and said they would recommend it to others as well.20 Both of those studies used teleconferencing to provide access to the intervention to people in rural communities.
Increasing access to the health care services and quality of care. Four of the articles evaluated the impact of intervention on patient’s access to the health care services.14,16,20,22 Specifically, after the interventions individuals had increased access to palliative care information in rural areas where it had previously been unavailable20 as well as actual delivery of clinical care in their home community, thus eliminating the need to travel to urban areas.14,20,22 This increase of access to health care services in rural area had significant effect on time and distance spent traveling. In 1 study, the amount of saving in terms of distance was 471.13 km and time in, 7.96 hours, for each visit.14
In addition, the quality of overall cancer care in rural area was increased. In an early clinical program, to increase access of palliative care in rural communities, the authors reported an increase in the breast conservation from 20% at the start of the program to 70% 2 years after the program was implemented.22 Breast conservation is not a typical outcome for palliative care studies, but the authors highlighted this practice change because of the improved QoL that is associated with the use of breast conservation therapies. In the same study, the authors reported an increased use of curative therapies for other cancers such as lymphoma as well as an increase use of pain management medication.
Financial impact. Two articles described the financial impact of cancer care costs on the patient and society.14,22 In a study by Watanabe and colleagues in Canada,14 the amount of savings after the intervention in terms of travel expenses was C$192.71 for each visit because patients had previously had to travel from their rural communities to urban tertiary hospitals to receive palliative care. For some patients in that study, the amount of saving for expenses was as high as C$500 a visit. In addition, some individuals were not able to travel and would not have received anything if the intervention had not been available remotely.14 In a study by Smith and colleagues in the United States, there was a 62% decrease in the cost to society for each patient, from US$10,233 to US$3,862.22 The factors contributing to that reduction included increasing outpatient services, engaging nurses and primary care providers instead of specialists, and the lower costs of living in rural areas. In addition, the rural hospitals saw an increase in revenue and profits because of higher admission rates ($500,00 for each hospital annually).22
Discussion
The articles identified in this review provide some evidence of the potential impact that palliative and supportive oncology interventions could have on PROs for rural residents with advanced cancer. Noteworthy results were seen for impact on reducing physical and emotional symptoms, increasing overall QoL and well-being, increasing satisfaction and access to palliative care, and reducing the overall cost of palliative care for individuals and society.14-18,20-22
Although statistical significance was not observed for most of the symptom assessment, trends toward improved symptom reports were observed. A likely explanation for this finding, is the small sample size or inadequate design to evaluate symptoms as an outcome measure. Three studies were pilot or feasibility projects15,20,21 that were not powered to detect the impact of the intervention on symptoms. In contrast, QoL stands out as an outcome that was positively affected by palliative care interventions. Further research is needed to determine if there are important mediating and moderating factors that contribute to improve QoL that are specific to rural residents. Significant outcomes were also reported for participant satisfaction with the interventions, the increase in access to services, and the decrease in costs.
Although there were not enough studies to determine the efficacy of these interventions, these results suggest that palliative and supportive interventions can have an impact on important patient-reported outcomes, such as symptoms and quality of life, and on health care system outcomes, such as cost. Evidence supporting the extent of the effectiveness of palliative care on various PROs in rural people is limited. None of the studies in this review evaluated the different aspects of palliative care specifically in rural residents.
It is interesting to note that all but one of the interventions used a telehealth approach to deliver the intervention. Telehealth interventions seem to be feasible, acceptable to people in rural areas, and show preliminary evidence that they can have an impact on PROs.
Limitations of this review include only inclusion of publications in English. In addition, some studies in this review include populations that were not exclusively rural residents, which makes it difficult for generalization.
Conclusion
Palliative and supportive interventions may improve various PROs in people with advanced cancer living in rural areas. Technologies that support remote access to people in rural areas, such as teleconferencing and videoconferencing, seem particularly promising delivery modalities with their potential to increase access to palliative and supportive interventions in underserved communities. Large-scale studies that are powered to test the impact of palliative care and support oncology interventions on PROs and other aspects of quality care among rural residents with advanced cancer are needed.
The authors thank Jennifer DeBerg, Health Science Librarian at the University of Iowa for her assistance in developing the literature search strategies.
People in rural areas have increased rates of advanced cancer and mortality compared with those who live in more affluent and urban areas.1,2 Indeed, a recent report from the Center for Disease Control found that rural residents have higher mortality rates from 5 leading causes of death, including cancer, compared with their urban counterparts.1 Significant challenges facing rural residents are due largely to not having easy access to cancer care and supportive care services.3 In addition, living in a rural area is associated with: a lower socioeconomic status, inadequate health insurance coverage, and less flexible employment that in turn decreases the ability to obtain the full range of supportive oncology services.4 The closest available specialists may be several hours away. Individuals may be unwilling or unable to travel hundreds of miles or more to see a specialist.3 Traveling places financial burdens on patients because of the cost of traveling and loss of work, which can compound the stress and fatigue associated with cancer treatment. People living in rural areas also may have less social support in commuting between their place of living and hospitals.5
Background
Typically, the primary goals of treatment for individuals with advanced cancer are to control the spread of the disease; maintain important patient-reported outcomes (PROs) such as physical, mental, and psychosocial function; and optimize quality of life (QoL). Health-related QoL (ie, the physical and mental health perceptions) are increasingly being used to assess effectiveness of cancer treatment.6 Palliative care and supportive oncology focus on managing physical, social, psychological, and spiritual needs of patients and have been recommended by the American Society of Clinical Oncology to be integrated into standard oncology care.7
People living in rural areas are less likely to get their care within a single health system. Often, their care is divided across multiple facilities and providers, which increases the chances of miscommunication between providers and can lead to inferior clinical outcomes and decreased patient QoL.8 There is a growing body of research describing the impact of palliative care on people with advanced cancer. Specifically, palliative care has been shown to reduce symptoms, improve QoL, and increase survival.9-11 Differences have been observed in the palliative care needs between people with cancer living in urban and suburban areas.12 It is likely that palliative care needs as well as the impact of palliative care services for people with advanced cancer in rural areas differs from those of their urban and suburban counterparts. Despite the known differences in access to care and impact of cancer between rural and nonrural residents, the impact of palliative care on people with advanced cancer living in rural areas has not been well described in the literature.
The purpose of this systematic review is to examine effect of palliative care and supportive oncology interventions on QoL in people with advanced cancer living in rural areas.
Methods
This systematic review was developed using the Preferred Reporting Items for Systematic Reviews and Meta-Analyses (PRISMA) guidelines.13
Eligibility criteria
To achieve the objective of a systemic review of studies describing supportive oncology and palliative care interventions in rural communities articles had to meet 4 inclusion criteria:
All research methods were eligible, including mixed-methods and program evaluations, as long as the article met the 4 inclusion criteria. Review articles were ineligible for inclusion as only original research was considered.
Search process
Search terms were developed by the research team with consultation from a medical librarian. Four main search terms were developed and included: palliative care, supportive oncology, rural, and cancer. Synonyms and terms closely related to the main terms were included in the search using the OR command. Examples of closely related search terms include: Palliative care: palliative; Rural: remote; Cancer: neoplasms (Table).
We systematically searched PyschINFO, PubMed, CINHAL, and Scopus for articles that had been published during 1991-2016 and written in English. Databases were chosen to reflect the different subfields that encompass palliative care and supportive oncology: PyschINFO to capture the psychological perspective, CINHAL to capture the nursing perspective, and PubMed to capture the medical perspective. Finally, Scopus was searched to ensure that articles not indexed by the other databases would be included. The search was limited to the past 25 years to capture the most up-to-date literature.
Selection process
In accordance with PRISMA guidelines, articles underwent an initial screening and an eligibility screening for inclusion in the final review.13 After duplicates were removed, 2 research team members reviewed all abstracts to screen for initial eligibility. Articles that successfully passed the screening process were reviewed in full by 4 research team members. Each member made an independent inclusion decision based on the stated inclusion criteria. Disagreements across team members were resolved through discussion and consensus.
Analysis
The articles that met the inclusion criteria were heterogeneous in design and analytic approach. The set of manuscripts identified, therefore, did not meet the statistical assumptions for meta-analytic data analysis. The analytic plan for this review consisted of sorting the results described in the identified articles into meaningful categories, identifying cross cutting themes, and presenting the results of these themes in narrative forms.
Results
Study selection
The search strategy resulted in 886 articles across the 4 databases. The breakdown for each database is as follows: PsychINFO (n = 286), PubMed (n = 194), CINHAL (n = 334), Scopus (n = 72). After duplicates were removed, 864 articles were left and were initially screened resulting in 844 articles being excluded. The remaining 20 articles were reviewed and 12 articles failed to meet the inclusion criteria. Reasons for exclusion included: the population was not rural; no advanced cancer in sample; intervention was not specifically palliative care or supportive oncology. Nine articles representing 8 projects (one project published 2 manuscripts included in this review) were included in the final review (Figure).
After reviewing the articles, 2 clear themes arose: PROs, and overall impact of rural palliative care for people and society. The PRO theme included articles that provided information on how an intervention or program improved the personal lives experience of rural cancer patients. PROs, such as decreased symptomology, were often reported. The “overall impact of rural palliative care for people and society” theme included articles that provided information on how an intervention or program improved the lives of rural people and society as a larger group. An example would include results indicating how a program increased access to supportive oncology care in a rural area.
Study characteristics
Nine publications, describing 8 projects were included in this review (Table). These projects were conducted in Canada (n = 3)14-16 Australia (n = 1)17 and the United States (n = 5).18-22 All of the the projects used a quantitative approach for the analysis, except 1 that used mixed-methods.16 The studies designs were: 4 feasibilities/pilot studies, 1 randomized control trials (RCT), and 3 program evaluations.
A total of 807 patients participated across the 9 articles. Participants’ age ranged from 20 to 88 years. The average ages for participants ranged from 50.4 to 70.7 years. Overall, there were slightly more men (55%) than women (45%) when all the demographic data were combined across the 9 articles; however, 2 articles exclusively had women as part of the sample.17,20 The cancer types that participants had included: gastrointestinal, genitourinary, breast, lung, brain, kidney, and hematological. Finally, the articles had inconsistent reporting of race/ethnicity data with only 4 studies reporting this information; of the 4 studies, 91% of participants self-identified as white.
The projects targeted multiple PROs, including physical symptoms and psychosocial issues (ie, stress management, grief, mood, emotional distress, coping, self-efficacy, dignity, joy, affection) domains. Publications dates ranged from 1996 to 2013. The sample sizes ranged from 8 to 322; 11.7%-100% of the study population had advanced cancer, and 20%-100% were living in rural area. The duration of the clinical intervention described was 30-120 minutes. The modes of delivery for the palliative intervention were videoconference/videophone (n = 3), telephone/teleconference (n = 3), and in person (n = 2). The interventions were delivered by nurses, psychiatrists, and social workers. In 5 of these studies, participants received palliative care on an individual basis and 2 studies delivered their intervention through groups. The individual basis studies focused on physical aspects of care and the group studies focused on emotional aspects of care.
Patient-reported outcomes
Cancer and its treatments are often associated with physical and emotional sequelae that can have a significant impact on patients and therefore PROs. The interventions reviewed in this article often reported data on the reduction of the physical and/or emotional symptom burden of cancer as well as overall QoL.
Reduction in physical symptoms. Three articles included physical symptoms as an outcome measure. Of those, 2 were pilot or feasibility studies, and 1 was a randomized control trial. Common physical symptoms included: shortness of breath, pain, fatigue, nausea, and appetite change. Across the articles, the Edmonton Symptom Assessment Scale (ESAS), a 10-item inventory of common cancer symptoms, was frequently used to measure of symptom scores in these interventions.14,15,19 The ESAS is an empirically validated measure that is used in palliative care research and clinical practice. Individuals are asked to rank 10 common symptoms on an ascending scale from 1 to 10 (0, the symptom is absent; 10, worst possible severity).23
The findings from these 3 research studies were encouraging. In a large randomized control trial of a supportive education program, researchers reported decreased physical symptom intensity after the intervention, however the change did not reach statistical significance.18 Similar findings were reported in a videoconferencing and a home health program to improve access of palliative and supportive oncology health care.14,15 Physical symptoms that had decreasing trends were pain, tiredness, and appetite, however, trends for shortness of breath found increasing severity.14,15 Although these trends were observed, it is important to note that scores on the ESAS did not reach statistical significance for physical symptoms in any of these studies.
Reduction in emotional symptom reduction. In addition to reducing physical symptoms, researchers also sought to understand the impact of programs on the emotional symptoms of cancer including: anxiety, depression, negative affect, and posttraumatic stress disorder (PTSD). Five articles included emotional symptoms as an outcome measure. Four were pilot or feasibility studies, and 1 was a randomized control trial.
Results across studies indicated an observable decrease in the severity of anxiety and depression for those exposed to an intervention program.14,15,18,19 Again, although trends were found, the results were not statistically significant. Only Watanabe and colleagues14 reported a statistically significant a decrease in anxiety in participants after the implementation of a rural palliative care videoconference consultation program. One report indicated that data on depression severity was collected but was not analyzed because of a small sample size.21
O’Brien and colleagues17 also collected data on negative affect and found that participants who participated in a supportive-expressive therapy group had a reduction in the negative affect as measured by the Derogatis Affects Balance Scale (ABS). Other researchers found no change in emotional distress.15
Finally, Collie and colleagues20 also measured the impact of a videoconference support group of PTSD symptomology for people with breast cancer in rural areas. Their results indicated a statistically significant decrease on the PTSD Checklist-Specific after intervention. Analysis of the data also found a medium effect size. Participants in the intervention group spoke about how participation in the support group allowed them to be generative and share information about breast cancer as well as build an emotional bond with other women with cancer.
Overall quality of life and well-being. Researchers have also looked into impact of intervention on overall QoL. Two articles included QoL or Well-being as an outcome measure. One was a pilot study and 1 was a randomized control trial.
Bakitas and colleagues18,19 found that those enrolled in the intervention arm of their study had higher QoL scores on the Functional Assessment of Cancer Therapy-General (FACT-G) compared with those in the control arm. These results were also found in an analysis of data from participants who subsequently died during the intervention. Improvements in overall well-being were also found by O’Brien and colleagues17 using ABS. They reported that a post hoc comparison of participants’ total positive affect score was significantly higher at the 12-month follow-up. In addition, the authors also noted qualitative improvements in well-being, including increased effort to be at the support group and the low attrition rates.
Overall impact of rural palliative care on individuals and society. In addition to reducing physical and emotional symptoms in patients, several of the articles also addressed other measures of the overall impact of the intervention or program on society as a whole. The authors evaluated patient satisfaction and quality of life, access to health care services, and financial impact on individuals and society at large.
Satisfaction with intervention. In 2 of the articles, individuals or their family members reported to be satisfied with the intervention14,20 and said they would recommend it to others as well.20 Both of those studies used teleconferencing to provide access to the intervention to people in rural communities.
Increasing access to the health care services and quality of care. Four of the articles evaluated the impact of intervention on patient’s access to the health care services.14,16,20,22 Specifically, after the interventions individuals had increased access to palliative care information in rural areas where it had previously been unavailable20 as well as actual delivery of clinical care in their home community, thus eliminating the need to travel to urban areas.14,20,22 This increase of access to health care services in rural area had significant effect on time and distance spent traveling. In 1 study, the amount of saving in terms of distance was 471.13 km and time in, 7.96 hours, for each visit.14
In addition, the quality of overall cancer care in rural area was increased. In an early clinical program, to increase access of palliative care in rural communities, the authors reported an increase in the breast conservation from 20% at the start of the program to 70% 2 years after the program was implemented.22 Breast conservation is not a typical outcome for palliative care studies, but the authors highlighted this practice change because of the improved QoL that is associated with the use of breast conservation therapies. In the same study, the authors reported an increased use of curative therapies for other cancers such as lymphoma as well as an increase use of pain management medication.
Financial impact. Two articles described the financial impact of cancer care costs on the patient and society.14,22 In a study by Watanabe and colleagues in Canada,14 the amount of savings after the intervention in terms of travel expenses was C$192.71 for each visit because patients had previously had to travel from their rural communities to urban tertiary hospitals to receive palliative care. For some patients in that study, the amount of saving for expenses was as high as C$500 a visit. In addition, some individuals were not able to travel and would not have received anything if the intervention had not been available remotely.14 In a study by Smith and colleagues in the United States, there was a 62% decrease in the cost to society for each patient, from US$10,233 to US$3,862.22 The factors contributing to that reduction included increasing outpatient services, engaging nurses and primary care providers instead of specialists, and the lower costs of living in rural areas. In addition, the rural hospitals saw an increase in revenue and profits because of higher admission rates ($500,00 for each hospital annually).22
Discussion
The articles identified in this review provide some evidence of the potential impact that palliative and supportive oncology interventions could have on PROs for rural residents with advanced cancer. Noteworthy results were seen for impact on reducing physical and emotional symptoms, increasing overall QoL and well-being, increasing satisfaction and access to palliative care, and reducing the overall cost of palliative care for individuals and society.14-18,20-22
Although statistical significance was not observed for most of the symptom assessment, trends toward improved symptom reports were observed. A likely explanation for this finding, is the small sample size or inadequate design to evaluate symptoms as an outcome measure. Three studies were pilot or feasibility projects15,20,21 that were not powered to detect the impact of the intervention on symptoms. In contrast, QoL stands out as an outcome that was positively affected by palliative care interventions. Further research is needed to determine if there are important mediating and moderating factors that contribute to improve QoL that are specific to rural residents. Significant outcomes were also reported for participant satisfaction with the interventions, the increase in access to services, and the decrease in costs.
Although there were not enough studies to determine the efficacy of these interventions, these results suggest that palliative and supportive interventions can have an impact on important patient-reported outcomes, such as symptoms and quality of life, and on health care system outcomes, such as cost. Evidence supporting the extent of the effectiveness of palliative care on various PROs in rural people is limited. None of the studies in this review evaluated the different aspects of palliative care specifically in rural residents.
It is interesting to note that all but one of the interventions used a telehealth approach to deliver the intervention. Telehealth interventions seem to be feasible, acceptable to people in rural areas, and show preliminary evidence that they can have an impact on PROs.
Limitations of this review include only inclusion of publications in English. In addition, some studies in this review include populations that were not exclusively rural residents, which makes it difficult for generalization.
Conclusion
Palliative and supportive interventions may improve various PROs in people with advanced cancer living in rural areas. Technologies that support remote access to people in rural areas, such as teleconferencing and videoconferencing, seem particularly promising delivery modalities with their potential to increase access to palliative and supportive interventions in underserved communities. Large-scale studies that are powered to test the impact of palliative care and support oncology interventions on PROs and other aspects of quality care among rural residents with advanced cancer are needed.
The authors thank Jennifer DeBerg, Health Science Librarian at the University of Iowa for her assistance in developing the literature search strategies.
1. Moy E, Garcia MC, Bastian B, et al. Leading causes of death in nonmetropolitan and metropolitan areas – United States, 1999-2014 [published correction at https://www.cdc.gov/mmwr/volumes/66/wr/mm6603a11.htm]. MMWR Surveillance Summaries [serial online]. https://www.cdc.gov/mmwr/volumes/66/ss/ss6601a1.htm?s_cid=ss6601a1_w. Published January 13, 2017. Accessed January 20, 2017.
2. Singh GK, Williams SD, Siahpush M, Mulhollen A. Socioeconomic, rural-urban, and racial inequalities in US Cancer Mortality: Part I – All cancers and lung cancer and Part II – Colorectal, prostate, breast, and cervical cancers. https://www.hindawi.com/journals/jce/2011/107497/. Published 2011. Accessed April 28, 2017.
3. Charlton M, Schlichting J, Chioreso C, Ward M, Vikas P. Challenges of rural cancer care in the United States. Oncology (Williston Park). 2015;29(9):633-640.
4. Weaver KE, Geiger AM, Lu L, Case LD. Rural‐urban disparities in health status among US cancer survivors. Cancer. 2013;119(5):1050-1057.
5. Fuchsia Howard A, Smillie K, Turnbull K, et al. Access to medical and supportive care for rural and remote cancer survivors in northern British Columbia. J Rural Health. 2014;30(3):311-321.
6. Bottomley A, Aaronson NK. International perspective on health-related quality-of-life research in cancer clinical trials: the European Organisation for Research and Treatment of Cancer experience. J Clin Oncol. 2007;25(32):5082-5086.
7. Smith TJ, Temin S, Alesi ER, et al. American Society of Clinical Oncology provisional clinical opinion: the integration of palliative care into standard oncology care. J Clin Oncol. 2012;30(8):880-887.
8. Baldwin LM, Cai Y, Larson EH, et al. Access to cancer services for rural colorectal cancer patients. J Rural Health. 2008;24(4):390-399.
9. Temel JS, Greer JA, Muzikansky A, et al. Early palliative care for patients with metastatic non-small-cell lung cancer. N Engl J Med. 2010;363(8):733-742.
10. McCorkle R, Jeon S, Ercolano E, et al. An advanced practice nurse coordinated multidisciplinary intervention for patients with late-stage cancer: a cluster randomized trial. J Palliat Med. 2015;18(11):962-969.
11. Zimmermann C, Swami N, Krzyzanowska M, et al. Early palliative care for patients with advanced cancer: a cluster-randomised controlled trial. Lancet. 2014;383(9930):1721-1730.
12. Regn R, Robinson W, Robinson WR. Differences in palliative care needs among cancer survivors in an inner city academic facility versus a suburban community facility. J Clin Oncol. 2015;33(29_suppl):61.
13. Moher D, Liberati A, Tetzlaff J, Altman DG. Preferred reporting items for systematic reviews and meta-analyses: the PRISMA statement. Ann Intern Med. 2009;339:b2535.
14. Watanabe SM, Fairchild A, Pituskin E, Borgersen P, Hanson J, Fassbender K. Improving access to specialist multidisciplinary palliative care consultation for rural cancer patients by videoconferencing: report of a pilot project. Support Care Cancer. 2013;21(4):1201-1207.
15. Howell D, Marshall D, Brazil K, et al. A shared care model pilot for palliative home care in a rural area: impact on symptoms, distress, and place of death. J Pain Symptom Manage. 2011;42(1):60-75.
16. Stern A, Valaitis R, Weir R, Jadad AR. Use of home telehealth in palliative cancer care: a case study. J Telemed Telecare. 2012;18(5):297-300.
17. O’Brien M, Harris J, King R, O’Brien T. Supportive-expressive group therapy for women with metastatic breast cancer: Improving access for Australian women through use of teleconference. Counselling Psychother Res. 2008;8(1):28-35.
18. Bakitas M, Lyons KD, Hegel MT, et al. The project ENABLE II randomized controlled trial to improve palliative care for rural patients with advanced cancer: baseline findings, methodological challenges, and solutions. Palliat Supportive Care. 2009;7(1):75-86.
19. Bakitas M, Lyons KD, Hegel MT, et al. Effects of a palliative care intervention on clinical outcomes in patients with advanced cancer: the Project ENABLE II randomized controlled trial. JAMA. 2009;302(7):741-749.
20. Collie K, Kreshka MA, Ferrier S, et al. Videoconferencing for delivery of breast cancer support groups to women living in rural communities: a pilot study. Psychooncology. 200
21. Passik SD, Kirsh KL, Leibee S, et al. A feasibility study of dignity psychotherapy delivered via telemedicine. Palliat Support Care. 2004;2(2):149-155.
22. Smith TJ, Desch CE, Grasso MA, et al. The Rural Cancer Outreach Program: clinical and financial analysis of palliative and curative care for an underserved population. Cancer Treat Rev. 1996;22(Suppl A):97-101.
23. Bruera E, Kuehn N, Miller MJ, Selmser P, Macmillan K. The Edmonton Symptom Assessment System (ESAS): a simple method for the assessment of palliative care patients. J Palliat Care. 1991;7(2):6-9.
1. Moy E, Garcia MC, Bastian B, et al. Leading causes of death in nonmetropolitan and metropolitan areas – United States, 1999-2014 [published correction at https://www.cdc.gov/mmwr/volumes/66/wr/mm6603a11.htm]. MMWR Surveillance Summaries [serial online]. https://www.cdc.gov/mmwr/volumes/66/ss/ss6601a1.htm?s_cid=ss6601a1_w. Published January 13, 2017. Accessed January 20, 2017.
2. Singh GK, Williams SD, Siahpush M, Mulhollen A. Socioeconomic, rural-urban, and racial inequalities in US Cancer Mortality: Part I – All cancers and lung cancer and Part II – Colorectal, prostate, breast, and cervical cancers. https://www.hindawi.com/journals/jce/2011/107497/. Published 2011. Accessed April 28, 2017.
3. Charlton M, Schlichting J, Chioreso C, Ward M, Vikas P. Challenges of rural cancer care in the United States. Oncology (Williston Park). 2015;29(9):633-640.
4. Weaver KE, Geiger AM, Lu L, Case LD. Rural‐urban disparities in health status among US cancer survivors. Cancer. 2013;119(5):1050-1057.
5. Fuchsia Howard A, Smillie K, Turnbull K, et al. Access to medical and supportive care for rural and remote cancer survivors in northern British Columbia. J Rural Health. 2014;30(3):311-321.
6. Bottomley A, Aaronson NK. International perspective on health-related quality-of-life research in cancer clinical trials: the European Organisation for Research and Treatment of Cancer experience. J Clin Oncol. 2007;25(32):5082-5086.
7. Smith TJ, Temin S, Alesi ER, et al. American Society of Clinical Oncology provisional clinical opinion: the integration of palliative care into standard oncology care. J Clin Oncol. 2012;30(8):880-887.
8. Baldwin LM, Cai Y, Larson EH, et al. Access to cancer services for rural colorectal cancer patients. J Rural Health. 2008;24(4):390-399.
9. Temel JS, Greer JA, Muzikansky A, et al. Early palliative care for patients with metastatic non-small-cell lung cancer. N Engl J Med. 2010;363(8):733-742.
10. McCorkle R, Jeon S, Ercolano E, et al. An advanced practice nurse coordinated multidisciplinary intervention for patients with late-stage cancer: a cluster randomized trial. J Palliat Med. 2015;18(11):962-969.
11. Zimmermann C, Swami N, Krzyzanowska M, et al. Early palliative care for patients with advanced cancer: a cluster-randomised controlled trial. Lancet. 2014;383(9930):1721-1730.
12. Regn R, Robinson W, Robinson WR. Differences in palliative care needs among cancer survivors in an inner city academic facility versus a suburban community facility. J Clin Oncol. 2015;33(29_suppl):61.
13. Moher D, Liberati A, Tetzlaff J, Altman DG. Preferred reporting items for systematic reviews and meta-analyses: the PRISMA statement. Ann Intern Med. 2009;339:b2535.
14. Watanabe SM, Fairchild A, Pituskin E, Borgersen P, Hanson J, Fassbender K. Improving access to specialist multidisciplinary palliative care consultation for rural cancer patients by videoconferencing: report of a pilot project. Support Care Cancer. 2013;21(4):1201-1207.
15. Howell D, Marshall D, Brazil K, et al. A shared care model pilot for palliative home care in a rural area: impact on symptoms, distress, and place of death. J Pain Symptom Manage. 2011;42(1):60-75.
16. Stern A, Valaitis R, Weir R, Jadad AR. Use of home telehealth in palliative cancer care: a case study. J Telemed Telecare. 2012;18(5):297-300.
17. O’Brien M, Harris J, King R, O’Brien T. Supportive-expressive group therapy for women with metastatic breast cancer: Improving access for Australian women through use of teleconference. Counselling Psychother Res. 2008;8(1):28-35.
18. Bakitas M, Lyons KD, Hegel MT, et al. The project ENABLE II randomized controlled trial to improve palliative care for rural patients with advanced cancer: baseline findings, methodological challenges, and solutions. Palliat Supportive Care. 2009;7(1):75-86.
19. Bakitas M, Lyons KD, Hegel MT, et al. Effects of a palliative care intervention on clinical outcomes in patients with advanced cancer: the Project ENABLE II randomized controlled trial. JAMA. 2009;302(7):741-749.
20. Collie K, Kreshka MA, Ferrier S, et al. Videoconferencing for delivery of breast cancer support groups to women living in rural communities: a pilot study. Psychooncology. 200
21. Passik SD, Kirsh KL, Leibee S, et al. A feasibility study of dignity psychotherapy delivered via telemedicine. Palliat Support Care. 2004;2(2):149-155.
22. Smith TJ, Desch CE, Grasso MA, et al. The Rural Cancer Outreach Program: clinical and financial analysis of palliative and curative care for an underserved population. Cancer Treat Rev. 1996;22(Suppl A):97-101.
23. Bruera E, Kuehn N, Miller MJ, Selmser P, Macmillan K. The Edmonton Symptom Assessment System (ESAS): a simple method for the assessment of palliative care patients. J Palliat Care. 1991;7(2):6-9.
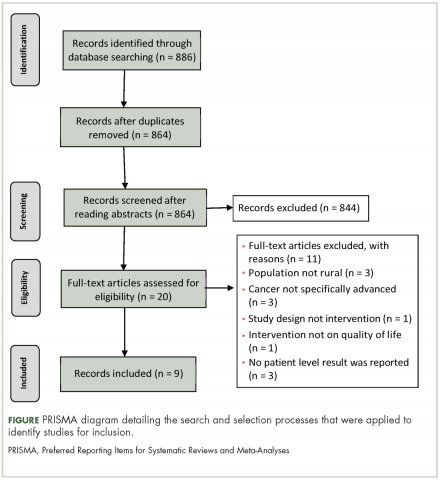
Improving Handoffs: Teaching beyond “Watch One, Do One”
In this issue of the Journal of Hospital Medicine, Lee et al.1
Lee’s team trained 4 groups of residents in handoffs using 4 different hour-long sessions, each with a different focus and educational format. A control group received a 1-hour didactic, which they had already heard; an I-PASS–based training group included role plays; and Policy Mandate and PDSA (Plan, Do, Study, Act) groups included group discussions. The prioritization of content in the sessions varied considerably among the groups, and the results should be interpreted within the context of the variation in both delivery and content.
Consistent with the focus of each intervention, the I-PASS–based training group had the greatest improvement in transfer of patient information, the policy mandate training group (focused on specific tasks) had the greatest improvement in task accountability, and the PDSA-training group (focused on intern-driven improvements) had the greatest improvement in personal responsibility. The control 60-minute didactic group did not show significant improvement in any domains. The lack of improvement in the control group doesn’t imply that the content wasn’t valuable, just that repetition didn’t add anything to baseline. One takeaway from the primary results of this study is that residents are likely to practice and improve what they are taught, and therefore, faculty should teach them purposefully. If residents aren’t taught handoff skills, they are unlikely to master them.
The interventions used in this study are neither mutually exclusive nor duplicative. In the final conclusions, the authors described the potential for a curriculum that includes elements from all 3 interventions. One could certainly imagine a handoff training program that includes elements of the I-PASS handoff bundle including role plays, additional emphasis on personal responsibility for specific tasks, as well as a focus on PDSA cycles of improvement for handoff processes. This likely could be accomplished with efficiency and might add only an hour to the 1-hour trainings. Evidence from the I-PASS study5 suggests that improving handoffs can decrease medical errors by 21% and adverse events by 30%; this certainly seems worth the time.
Checklist-based observation tools can provide valuable data to assess handoffs.6 Lee’s study used a checklist based on TJC recommendations, and the 17 checklist elements overlapped somewhat with the SHM guidelines,2 providing some evidence for content validity. The dependent variable was total number of checklist items included in handoffs, a methodology that assumes that all handoff elements are equally important (eg, gender is weighted equally to if-then plans). This checklist also has a large proportion of items related to 2-way and closed-loop communication and therefore, places heavy weight on this component of handoffs. Adapting this checklist into an assessment tool would require additional validity evidence but could make it a very useful tool for completing handoff assessments and providing meaningful feedback.
The ideal data collection instrument would also include outcome measures, in addition to process measures. Improvements in outcome measures such as medical errors and adverse events, are more difficult to document but also provide more valuable data about the impact of curricula. In designing new hybrid curricula, it will be extremely important to focus on those outcomes that reflect the greatest impact on patient safety.
Finally, this study reminds us that the delivery modes of curricula are important factors in learning. The control group received an exclusively didactic presentation that they had heard before, while the other 3 groups had interactive components including role plays and group discussions. The improvements in different domains with different training formats provide evidence for the complementary nature. Interactive curricula involving role plays, simulations, and small-group discussions are more resource-intense than simple didactics, but they are also likely to be more impactful.
Teaching and assessing the quality of handoffs is critical to the safe practice of medicine. New ACGME duty hour requirements, which began in July, will allow for increased flexibility allowing longer shifts with shorter breaks.7 Regardless of the shift/call schedules programs design for their trainees, safe handoffs are essential. The strategies described here may be useful for helping institutions improve patient safety through better handoffs. This study adds to the bulk of data demonstrating that handoffs are a skill that should be both taught and assessed during residency training.
1. Lee SH, Terndrup C, Phan PH, et al. A Randomized Cohort Controlled Trial to Compare Intern Sign-Out Training Interventions. J Hosp Med. 2017;12(12):979-983.
2. Arora VM, Manjarrez E, Dressler DD, Basaviah P, Halasyamani L, Kripalani S. Hospitalist handoffs: a systematic review and task force recommendations. J Hosp Med. 2009;4(7):433-440. PubMed
3. Accreditation Council for Graduate Medical Education. Common Program Requirements. 2017. https://www.acgmecommon.org/2017_requirements Accessed November 10, 2017.
4. The Joint Commission. Improving Transitions of Care: Hand-off Communications. 2013; http://www.centerfortransforminghealthcare.org/tst_hoc.aspx. Accessed November 10, 2017.
5. Starmer AJ, Spector ND, Srivastava R, et al. Changes in medical errors after implementation of a handoff program. N Engl J Med. 2014;371(19):1803-1812. PubMed
6. Feraco AM, Starmer AJ, Sectish TC, Spector ND, West DC, Landrigan CP. Reliability of Verbal Handoff Assessment and Handoff Quality Before and After Implementation of a Resident Handoff Bundle. Acad Pediatr. 2016;16(6):524-531. PubMed
7. Accreditation Council for Continuing Medical Education. Common Program Requirements. 2017; https://www.acgmecommon.org/2017_requirements. Accessed on June 12, 2017.
In this issue of the Journal of Hospital Medicine, Lee et al.1
Lee’s team trained 4 groups of residents in handoffs using 4 different hour-long sessions, each with a different focus and educational format. A control group received a 1-hour didactic, which they had already heard; an I-PASS–based training group included role plays; and Policy Mandate and PDSA (Plan, Do, Study, Act) groups included group discussions. The prioritization of content in the sessions varied considerably among the groups, and the results should be interpreted within the context of the variation in both delivery and content.
Consistent with the focus of each intervention, the I-PASS–based training group had the greatest improvement in transfer of patient information, the policy mandate training group (focused on specific tasks) had the greatest improvement in task accountability, and the PDSA-training group (focused on intern-driven improvements) had the greatest improvement in personal responsibility. The control 60-minute didactic group did not show significant improvement in any domains. The lack of improvement in the control group doesn’t imply that the content wasn’t valuable, just that repetition didn’t add anything to baseline. One takeaway from the primary results of this study is that residents are likely to practice and improve what they are taught, and therefore, faculty should teach them purposefully. If residents aren’t taught handoff skills, they are unlikely to master them.
The interventions used in this study are neither mutually exclusive nor duplicative. In the final conclusions, the authors described the potential for a curriculum that includes elements from all 3 interventions. One could certainly imagine a handoff training program that includes elements of the I-PASS handoff bundle including role plays, additional emphasis on personal responsibility for specific tasks, as well as a focus on PDSA cycles of improvement for handoff processes. This likely could be accomplished with efficiency and might add only an hour to the 1-hour trainings. Evidence from the I-PASS study5 suggests that improving handoffs can decrease medical errors by 21% and adverse events by 30%; this certainly seems worth the time.
Checklist-based observation tools can provide valuable data to assess handoffs.6 Lee’s study used a checklist based on TJC recommendations, and the 17 checklist elements overlapped somewhat with the SHM guidelines,2 providing some evidence for content validity. The dependent variable was total number of checklist items included in handoffs, a methodology that assumes that all handoff elements are equally important (eg, gender is weighted equally to if-then plans). This checklist also has a large proportion of items related to 2-way and closed-loop communication and therefore, places heavy weight on this component of handoffs. Adapting this checklist into an assessment tool would require additional validity evidence but could make it a very useful tool for completing handoff assessments and providing meaningful feedback.
The ideal data collection instrument would also include outcome measures, in addition to process measures. Improvements in outcome measures such as medical errors and adverse events, are more difficult to document but also provide more valuable data about the impact of curricula. In designing new hybrid curricula, it will be extremely important to focus on those outcomes that reflect the greatest impact on patient safety.
Finally, this study reminds us that the delivery modes of curricula are important factors in learning. The control group received an exclusively didactic presentation that they had heard before, while the other 3 groups had interactive components including role plays and group discussions. The improvements in different domains with different training formats provide evidence for the complementary nature. Interactive curricula involving role plays, simulations, and small-group discussions are more resource-intense than simple didactics, but they are also likely to be more impactful.
Teaching and assessing the quality of handoffs is critical to the safe practice of medicine. New ACGME duty hour requirements, which began in July, will allow for increased flexibility allowing longer shifts with shorter breaks.7 Regardless of the shift/call schedules programs design for their trainees, safe handoffs are essential. The strategies described here may be useful for helping institutions improve patient safety through better handoffs. This study adds to the bulk of data demonstrating that handoffs are a skill that should be both taught and assessed during residency training.
In this issue of the Journal of Hospital Medicine, Lee et al.1
Lee’s team trained 4 groups of residents in handoffs using 4 different hour-long sessions, each with a different focus and educational format. A control group received a 1-hour didactic, which they had already heard; an I-PASS–based training group included role plays; and Policy Mandate and PDSA (Plan, Do, Study, Act) groups included group discussions. The prioritization of content in the sessions varied considerably among the groups, and the results should be interpreted within the context of the variation in both delivery and content.
Consistent with the focus of each intervention, the I-PASS–based training group had the greatest improvement in transfer of patient information, the policy mandate training group (focused on specific tasks) had the greatest improvement in task accountability, and the PDSA-training group (focused on intern-driven improvements) had the greatest improvement in personal responsibility. The control 60-minute didactic group did not show significant improvement in any domains. The lack of improvement in the control group doesn’t imply that the content wasn’t valuable, just that repetition didn’t add anything to baseline. One takeaway from the primary results of this study is that residents are likely to practice and improve what they are taught, and therefore, faculty should teach them purposefully. If residents aren’t taught handoff skills, they are unlikely to master them.
The interventions used in this study are neither mutually exclusive nor duplicative. In the final conclusions, the authors described the potential for a curriculum that includes elements from all 3 interventions. One could certainly imagine a handoff training program that includes elements of the I-PASS handoff bundle including role plays, additional emphasis on personal responsibility for specific tasks, as well as a focus on PDSA cycles of improvement for handoff processes. This likely could be accomplished with efficiency and might add only an hour to the 1-hour trainings. Evidence from the I-PASS study5 suggests that improving handoffs can decrease medical errors by 21% and adverse events by 30%; this certainly seems worth the time.
Checklist-based observation tools can provide valuable data to assess handoffs.6 Lee’s study used a checklist based on TJC recommendations, and the 17 checklist elements overlapped somewhat with the SHM guidelines,2 providing some evidence for content validity. The dependent variable was total number of checklist items included in handoffs, a methodology that assumes that all handoff elements are equally important (eg, gender is weighted equally to if-then plans). This checklist also has a large proportion of items related to 2-way and closed-loop communication and therefore, places heavy weight on this component of handoffs. Adapting this checklist into an assessment tool would require additional validity evidence but could make it a very useful tool for completing handoff assessments and providing meaningful feedback.
The ideal data collection instrument would also include outcome measures, in addition to process measures. Improvements in outcome measures such as medical errors and adverse events, are more difficult to document but also provide more valuable data about the impact of curricula. In designing new hybrid curricula, it will be extremely important to focus on those outcomes that reflect the greatest impact on patient safety.
Finally, this study reminds us that the delivery modes of curricula are important factors in learning. The control group received an exclusively didactic presentation that they had heard before, while the other 3 groups had interactive components including role plays and group discussions. The improvements in different domains with different training formats provide evidence for the complementary nature. Interactive curricula involving role plays, simulations, and small-group discussions are more resource-intense than simple didactics, but they are also likely to be more impactful.
Teaching and assessing the quality of handoffs is critical to the safe practice of medicine. New ACGME duty hour requirements, which began in July, will allow for increased flexibility allowing longer shifts with shorter breaks.7 Regardless of the shift/call schedules programs design for their trainees, safe handoffs are essential. The strategies described here may be useful for helping institutions improve patient safety through better handoffs. This study adds to the bulk of data demonstrating that handoffs are a skill that should be both taught and assessed during residency training.
1. Lee SH, Terndrup C, Phan PH, et al. A Randomized Cohort Controlled Trial to Compare Intern Sign-Out Training Interventions. J Hosp Med. 2017;12(12):979-983.
2. Arora VM, Manjarrez E, Dressler DD, Basaviah P, Halasyamani L, Kripalani S. Hospitalist handoffs: a systematic review and task force recommendations. J Hosp Med. 2009;4(7):433-440. PubMed
3. Accreditation Council for Graduate Medical Education. Common Program Requirements. 2017. https://www.acgmecommon.org/2017_requirements Accessed November 10, 2017.
4. The Joint Commission. Improving Transitions of Care: Hand-off Communications. 2013; http://www.centerfortransforminghealthcare.org/tst_hoc.aspx. Accessed November 10, 2017.
5. Starmer AJ, Spector ND, Srivastava R, et al. Changes in medical errors after implementation of a handoff program. N Engl J Med. 2014;371(19):1803-1812. PubMed
6. Feraco AM, Starmer AJ, Sectish TC, Spector ND, West DC, Landrigan CP. Reliability of Verbal Handoff Assessment and Handoff Quality Before and After Implementation of a Resident Handoff Bundle. Acad Pediatr. 2016;16(6):524-531. PubMed
7. Accreditation Council for Continuing Medical Education. Common Program Requirements. 2017; https://www.acgmecommon.org/2017_requirements. Accessed on June 12, 2017.
1. Lee SH, Terndrup C, Phan PH, et al. A Randomized Cohort Controlled Trial to Compare Intern Sign-Out Training Interventions. J Hosp Med. 2017;12(12):979-983.
2. Arora VM, Manjarrez E, Dressler DD, Basaviah P, Halasyamani L, Kripalani S. Hospitalist handoffs: a systematic review and task force recommendations. J Hosp Med. 2009;4(7):433-440. PubMed
3. Accreditation Council for Graduate Medical Education. Common Program Requirements. 2017. https://www.acgmecommon.org/2017_requirements Accessed November 10, 2017.
4. The Joint Commission. Improving Transitions of Care: Hand-off Communications. 2013; http://www.centerfortransforminghealthcare.org/tst_hoc.aspx. Accessed November 10, 2017.
5. Starmer AJ, Spector ND, Srivastava R, et al. Changes in medical errors after implementation of a handoff program. N Engl J Med. 2014;371(19):1803-1812. PubMed
6. Feraco AM, Starmer AJ, Sectish TC, Spector ND, West DC, Landrigan CP. Reliability of Verbal Handoff Assessment and Handoff Quality Before and After Implementation of a Resident Handoff Bundle. Acad Pediatr. 2016;16(6):524-531. PubMed
7. Accreditation Council for Continuing Medical Education. Common Program Requirements. 2017; https://www.acgmecommon.org/2017_requirements. Accessed on June 12, 2017.
© 2017 Society of Hospital Medicine
Keeping It Simple in Sepsis Measures
“I didn’t have time to write a short letter, so I wrote a long one instead.”
-Mark Twain
Sepsis is a logical target for quality measures. Specifically, sepsis represents the perfect storm of immense public health burden1-3 combined with unexplained practice4-6 and outcomes7 variation. Thus, it is not surprising that in October 2015, the Centers of Medicare and Medicaid Services (CMS) adopted a sepsis quality measure.8 More surprising were the complex contents of the CMS Sepsis Core Measure “SEP-1” quality measure.9 CMS had written a “long letter.”
The multiple processes targeted with the CMS SEP-1 quality measure can best be understood with a brief account of history. SEP-1 arose from the National Quality Forum’s (NQF) project #0500: “Severe Sepsis and Septic Shock: Management Bundle,” a measure based upon Rivers et al.’s10 single-center, randomized, controlled trial of early goal-directed therapy (EGDT) for severe sepsis. EGDT was an intervention that consisted of fluid resuscitation and hemodynamic management based upon fulfilling specific targets of central venous pressure, superior vena cava oxygen saturation (or lactic acid), and hemoglobin and mean arterial pressures.11 The large mortality benefits, physiological rationale, and algorithmic responses to a variety of abnormal clinical values provided an appealing protocol to critical care and emergency physicians trained to normalize measured values, as well as policy makers looking for quality measures. Observational studies consistently showed associations between adoption of guideline-based “sepsis bundles” and improved patient outcomes,12-14 setting the stage for the transition of NQF #0500 into SEP-1.
However, the transition from EGDT-based NQF #0500 to SEP-1 has been tumultuous. Soon after adoption of SEP-1, the consensus definitions of sepsis changed markedly. Sepsis went from being defined as the presence of infection with concomitant systemic inflammatory response syndrome (sepsis), organ dysfunction (severe sepsis), and/or shock,15 to being defined as a dysregulated response to infection resulting in life-threatening organ dysfunction (sepsis) and/or fluid-resistant hypotension requiring vasopressors and lactate greater than 2 mmol/L.16 As the study by Barbash et al.17
In addition to its unprecedented complexity, SEP-1 received criticism for the weak evidence base of its individual components. The general concepts behind SEP-1 are well-accepted tenets of sepsis management: rapid recognition, assessment and treatment of underlying infection, and institution of intravenous fluids and vasopressor support for septic shock. However, the “all or none” prescriptive nature of the SEP-1 bundle was based on a somewhat arbitrary set of measures and targets. For example, patients with septic shock must receive 30 cc/kg of intravenous fluids to be “SEP-1 compliant.” The value “30 cc/kg” was taken from the average volume of fluids reported in prior sepsis trials, essentially based on a very low level of evidence.20 The strict 30 cc/kg cutoff did not take into account that “the median isn’t the message”21 in fluid management: optimal resuscitation targets are unclear,22 and selecting the median as a target ignores the fact that 50% of patients enrolled in international trials of EGDT received less than 30 cc/kg of initial fluid resuscitation (the interquartile range was 16-42 cc/kg).18 Thus, most participants in trials upon which the SEP-1 fluid measure was based would ironically not have met the SEP-1 measure. Mandates for physical exam and physiological measures were based on similarly low levels of evidence.
Into this context, Barbash et al. use a representative sample of US hospitals to explore the opinions of hospital quality leaders regarding the SEP-1 measure. First, the qualitative methods used by Barbash et al. warrant some explanation. Much of biomedical research is characterized by hypothesis-driven, deductive reasoning: theories are tested using observations. In contrast, the methods of Barbash et al. use inductive reasoning: observations are used to develop theories within a systematic approach called “grounded theory” that explores common themes emerging from structured interviews.23 Inductive reasoning can later inform deductive reasoning, feeding theories into testable hypotheses. However, qualitative, inductive research is not meant to test hypotheses and is not subject to typical notions of “power and sample size” often expected of quantitative statistical analyses. Qualitative studies reach sufficient sample size when no further themes emerge, a situation called “thematic saturation”; the sample size here of 29 participants rests comfortably in the range of participants commonly needed for thematic saturation.23
Barbash et al. identified common themes in opinions of quality leaders regarding SEP-1. Namely, the complexity of SEP-1 necessitated a major resource investment into sepsis care and data collection. The major infrastructure investments needed to comply with SEP-1 also bred frustration regarding lack of perceived fairness around the “all or none” nature of the measure and raised multiple additional challenges including lack of clinician buy-in and resistance to protocolized care. Prior qualitative studies evaluating hospital quality leaders’ opinions on performance measures identified similar concerns about lack of “fairness,”24 but the implementation of SEP-1 has raised additional concern regarding the large burdens of instituting major infrastructure changes to monitor processes of care required to report on this measure. Despite the major challenges of responding to SEP-1, quality leaders expressed optimism that increased attention to sepsis would ultimately lead to better patient outcomes.
How might future sepsis quality measures achieve the adequate balance between focusing attention on improving care processes for high-impact diseases, without imposing additional burdens on the healthcare system? Lessons from Barbash et al. help us move forward. First, rather than taxing hospitals with administratively complex process measures, initial attempts at quality measures should start simply. Policy makers should consider moving forward into new areas of quality measurement in 2 ways: (1) pursue 1 or 2 processes with strong etiological links to important patient outcomes (eg, timely antibiotics in septic shock),25-28 and/or (2) use risk-adjusted outcomes and allow individual hospitals to adopt processes that improve local patient outcomes. Evidence suggests that the introduction of a quality measure may result in improved outcomes regardless of adoption of specific target processes,29 although results are mixed.30,31 In either case, complex “all or none” measures based upon weak evidence run a high risk of inciting clinician resentment and paradoxically perpetuating poor quality by increasing healthcare costs (decreased efficiency) without gains in safety, effectiveness, timeliness, or equity.32 It has been estimated that hospitals spend on average $2 million to implement SEP-1,33 with unclear return on the investment. The experience of SEP-1 is a reminder that, as evidence evolves, quality measures must adapt lest they become irrelevant. However, it is also a reminder that quality measures should not sit precariously on the edge of evidence. Withdrawal of process-based measures due to a changing evidence landscape breeds mistrust and impairs future attempts to improve quality.
Sepsis quality measures face additional challenges. If recent experience with interpretation of sepsis definitions can serve as a guide, variable uptake of newer sepsis definitions between/across hospitals will impair the ability to risk-adjust outcome measures and increase bias in identifying outlier hospitals.34 In addition, recent studies have already raised skepticism regarding the effectiveness of individual SEP-1 bundle components, confirming suspicions that the 30 cc/kg fluid bolus is not a magic quality target. Rather, the effectiveness of prior sepsis bundles has likely been driven by improved time to antibiotics, a process unstudied in sepsis trials, but driven by increased attention to the importance of early sepsis recognition and timely management.28 Timeliness of antibiotics can act as an effect modifier for more complex sepsis therapies, with quicker time to antibiotics associated with reversal of previously described effectiveness of activated protein C,35 and EGDT.28
Sepsis has a legacy in which improving simple processes (ie, time to antibiotics) obviates the need for more complex interventions (eg, activated protein C, EGDT). To the extent that CMS remains committed to using process-based measures of quality, those focused on sepsis are likely to be most effective when pared down to the simplest and strongest evidence base—improved recognition36 and timely antibiotics (for patients with infection-induced organ dysfunction and shock). Taking the time to start simply may best serve our current patients and preserve stakeholder buy-in for quality initiatives likely to benefit our future patients.
Disclosure
Dr. Lindenauer reports that he received support from the Centers for Medicare and Medicaid Services to develop and maintain hospital outcome measures for pneumonia and COPD. Dr. Lindenauer is supported by grant K24HL132008 from the National Heart, Lung, and Blood Institute. Dr. Walkey was supported by grants K01-HL116768 and R01-HL139751 from the National Heart, Lung, and Blood Institute.
1. Elixhauser A, Friedman B, Stranges E. Septicemia in U.S. Hospitals, 2009. HCUP. Statistical Brief #122. Rockville MD: Agency for Healthcare Research and Quality; 2011; p 1-13. PubMed
2. Liu V, Lei X, Prescott HC, Kipnis P, Iwashyna TJ, Escobar GJ. Hospital readmission and healthcare utilization following sepsis in community settings. J Hosp Med. 2014;9(8):502-507. PubMed
3. Liu V, Escobar GJ, Greene JD, et al. Hospital deaths in patients with sepsis from 2 independent cohorts. JAMA. 2014;312(1):90-92. PubMed
4. Peltan ID, Mitchell KH, Rudd KE, et al. Physician Variation in Time to Antimicrobial Treatment for Septic Patients Presenting to the Emergency Department. Crit Care Med. 2017;45(6):1011-1018. PubMed
5. Marik PE, Linde-Zwirble WT, Bittner EA, Sahatjian J, Hansell D. Fluid administration in severe sepsis and septic shock, patterns and outcomes: an analysis of a large national database. Intensive Care Med. 2017;43(5):625-632. PubMed
6. Lagu T, Rothberg MB, Nathanson BH, Pekow PS, Steingrub JS, Lindenauer PK. Variation in the care of septic shock: the impact of patient and hospital characteristics. J Crit Care. 2012;27(4):329-336. PubMed
7. Wang HE, Donnelly JP, Shapiro NI, Hohmann SF, Levitan EB. Hospital variations in severe sepsis mortality. Am J Med Qual. 2015;30(4):328-336. PubMed
8. Centers for Medicare & Medicaid Services. CMS Measures Inventory. https://www.cms.gov/Medicare/Quality-Initiatives-Patient-Assessment-Instruments/QualityMeasures/CMS-Measures-Inventory.html. Accessed June 8, 2017.
9. QualityNet. Specifications Manual, Version 5.0b, Section 2.2. Severe Sepsis and Septic Shock. https://www.qualitynet.org/dcs/ContentServer?c=Page&pagename=QnetPublic%2FPage%2FQnetTier4&cid=1228774725171. Accessed June 8, 2017.
10. National Quality Forum. 0500 Severe sepsis and septic shock management bundle. http://www.qualityforum.org. Accessed June 8, 2017.
11. Rivers E, Nguyen B, Havstad S, et al. Early Goal-Directed Therapy in the Treatment of Severe Sepsis and Septic Shock. N Engl J Med. 2001;345:1368-1377. PubMed
12. Levy MM, Dellinger RP, Townsend SR, et al. The Surviving Sepsis Campaign: results of an international guideline-based performance improvement program targeting severe sepsis. Crit Care Med. 2010;38(2):367-374. PubMed
13. Levy MM, Artigas A, Phillips GS, et al. Outcomes of the Surviving Sepsis Campaign in intensive care units in the USA and Europe: a prospective cohort study. Lancet Infect Dis. 2012;12(12):919-924. PubMed
14. Ferrer R, Artigas A, Levy MM, et al. Improvement in process of care and outcome after a multicenter severe sepsis educational program in Spain. JAMA. 2008;299(19):2294-2303. PubMed
15. Bone RC, Balk RA, Cerra FB, et al. Definitions for sepsis and organ failure and guidelines for the use of innovative therapies in sepsis. The ACCP/SCCM Consensus Conference Committee. American College of Chest Physicians/Society of Critical Care Medicine. Chest. 1992;101(6):1644-1655. PubMed
16. Singer M, Deutschman CS, Seymour CW, et al. The Third International Consensus Definitions for Sepsis and Septic Shock (Sepsis-3). JAMA. 2016;315(8):801-810. PubMed
17. Barbash IJ, Rak KJ, Kuza CC, Kahn JM. Hospital Perceptions of Medicare’s Sepsis Quality Reporting Initiative. J Hosp Med. 2017;12(12):963-967.
18. The PRISM Investigators. Early, Goal-Directed Therapy for Septic Shock — A Patient-Level Meta-Analysis. N Engl J Med. 2017;376:2223-2234. PubMed
19. National Quality Forum. NQF Revises Sepsis Measure. http://www.qualityforum.org/NQF_Revises_Sepsis_Measure.aspx. Accessed June 8, 2017.
20. Rhodes A, Evans LE, Alhazzani W, et al. Surviving Sepsis Campaign: International Guidelines for Management of Sepsis and Septic Shock: 2016. Intensive Care Med. 2017;43(3):304-377. PubMed
21. Gould SJ. The median isn’t the message. Discover. 1985;6:40-42. PubMed
22. Hernandez G, Teboul JL. Fourth Surviving Sepsis Campaign’s hemodynamic recommendations: a step forward or a return to chaos? Crit Care. 2017;21(1):133. PubMed
23. Fugard AJ, Potts HW. Supporting thinking on sample sizes for thematic analyses. Int J Soc Res Methodol. 2015;18(6):669-684.
24. Goff SL, Lagu T, Pekow PS, et al. A qualitative analysis of hospital leaders’ opinions about publicly reported measures of health care quality. Jt Comm J Qual Patient Saf. 2015;41(4):169-176. PubMed
25. Kumar A, Haery C, Paladugu B, et al. The duration of hypotension before the initiation of antibiotic treatment is a critical determinant of survival in a murine model of Escherichia coli septic shock: association with serum lactate and inflammatory cytokine levels. J Infect Dis. 2006;193(2):251-258.
PubMed
26. Liu VX, Fielding-Singh V, Greene JD, et al. The Timing of Early Antibiotics and Hospital Mortality in Sepsis. Am J Respir Crit Care Med. 2017. [Epub ahead of print]. PubMed
27. Seymour CW, Gesten F, Prescott HC, et al. Time to Treatment and Mortality during Mandated Emergency Care for Sepsis. N Engl J Med. 2017;376:2235-2244. PubMed
28. Kalil AC, Johnson DW, Lisco SJ, Sun J. Early Goal-Directed Therapy for Sepsis: A Novel Solution for Discordant Survival Outcomes in Clinical Trials. Crit Care Med. 2017;45(4):607-614. PubMed
29. Tu JV, Donovan LR, Lee DS, et al. Effectiveness of public report cards for improving the quality of cardiac care: the EFFECT study: a randomized trial. JAMA. 2009;302(21):2330-2337. PubMed
30. Joynt KE, Blumenthal DM, Orav EJ, Resnic FS, Jha AK. Association of public reporting for percutaneous coronary intervention with utilization and outcomes among Medicare beneficiaries with acute myocardial infarction. JAMA. 2012;308(14):1460-1468. PubMed
31. Osborne NH, Nicholas LH, Ryan AM, Thumma JR, Dimick JB. Association of hospital participation in a quality reporting program with surgical outcomes and expenditures for Medicare beneficiaries. JAMA. 2015;313(5):496-504. PubMed
32. Institute of Medicine (US) Committee on Quality of Health Care in America. Crossing the Quality Chasm: A New Health System for the 21st Century. Washington (DC): National Academies Press (US); 2001. PubMed
33. 2015;12(11):1676-1684.Ann Am Thorac Soc36. Kramer RD, Cooke CR, Liu V, Miller RR 3rd, Iwashyna TJ. Variation in the Contents of Sepsis Bundles and Quality Measures. A Systematic Review. PubMed
34. 2012;40(11):2974-2981.Crit Care Med35. Rimmer E, Kumar A, Doucette S, et al. Activated protein C and septic shock: a propensity-matched cohort study*. PubMed
35. 2014;160(6):380-388.Ann Intern Med34. Rothberg MB, Pekow PS, Priya A, Lindenauer PK. Variation in diagnostic coding of patients with pneumonia and its association with hospital risk-standardized mortality rates: a cross-sectional analysis. PubMed
36. 2015;12(11):1597-1599. Ann Am Thorac Soc33. Wall MJ, Howell MD. Variation and Cost-effectiveness of Quality Measurement Programs. The Case of Sepsis Bundles. PubMed
“I didn’t have time to write a short letter, so I wrote a long one instead.”
-Mark Twain
Sepsis is a logical target for quality measures. Specifically, sepsis represents the perfect storm of immense public health burden1-3 combined with unexplained practice4-6 and outcomes7 variation. Thus, it is not surprising that in October 2015, the Centers of Medicare and Medicaid Services (CMS) adopted a sepsis quality measure.8 More surprising were the complex contents of the CMS Sepsis Core Measure “SEP-1” quality measure.9 CMS had written a “long letter.”
The multiple processes targeted with the CMS SEP-1 quality measure can best be understood with a brief account of history. SEP-1 arose from the National Quality Forum’s (NQF) project #0500: “Severe Sepsis and Septic Shock: Management Bundle,” a measure based upon Rivers et al.’s10 single-center, randomized, controlled trial of early goal-directed therapy (EGDT) for severe sepsis. EGDT was an intervention that consisted of fluid resuscitation and hemodynamic management based upon fulfilling specific targets of central venous pressure, superior vena cava oxygen saturation (or lactic acid), and hemoglobin and mean arterial pressures.11 The large mortality benefits, physiological rationale, and algorithmic responses to a variety of abnormal clinical values provided an appealing protocol to critical care and emergency physicians trained to normalize measured values, as well as policy makers looking for quality measures. Observational studies consistently showed associations between adoption of guideline-based “sepsis bundles” and improved patient outcomes,12-14 setting the stage for the transition of NQF #0500 into SEP-1.
However, the transition from EGDT-based NQF #0500 to SEP-1 has been tumultuous. Soon after adoption of SEP-1, the consensus definitions of sepsis changed markedly. Sepsis went from being defined as the presence of infection with concomitant systemic inflammatory response syndrome (sepsis), organ dysfunction (severe sepsis), and/or shock,15 to being defined as a dysregulated response to infection resulting in life-threatening organ dysfunction (sepsis) and/or fluid-resistant hypotension requiring vasopressors and lactate greater than 2 mmol/L.16 As the study by Barbash et al.17
In addition to its unprecedented complexity, SEP-1 received criticism for the weak evidence base of its individual components. The general concepts behind SEP-1 are well-accepted tenets of sepsis management: rapid recognition, assessment and treatment of underlying infection, and institution of intravenous fluids and vasopressor support for septic shock. However, the “all or none” prescriptive nature of the SEP-1 bundle was based on a somewhat arbitrary set of measures and targets. For example, patients with septic shock must receive 30 cc/kg of intravenous fluids to be “SEP-1 compliant.” The value “30 cc/kg” was taken from the average volume of fluids reported in prior sepsis trials, essentially based on a very low level of evidence.20 The strict 30 cc/kg cutoff did not take into account that “the median isn’t the message”21 in fluid management: optimal resuscitation targets are unclear,22 and selecting the median as a target ignores the fact that 50% of patients enrolled in international trials of EGDT received less than 30 cc/kg of initial fluid resuscitation (the interquartile range was 16-42 cc/kg).18 Thus, most participants in trials upon which the SEP-1 fluid measure was based would ironically not have met the SEP-1 measure. Mandates for physical exam and physiological measures were based on similarly low levels of evidence.
Into this context, Barbash et al. use a representative sample of US hospitals to explore the opinions of hospital quality leaders regarding the SEP-1 measure. First, the qualitative methods used by Barbash et al. warrant some explanation. Much of biomedical research is characterized by hypothesis-driven, deductive reasoning: theories are tested using observations. In contrast, the methods of Barbash et al. use inductive reasoning: observations are used to develop theories within a systematic approach called “grounded theory” that explores common themes emerging from structured interviews.23 Inductive reasoning can later inform deductive reasoning, feeding theories into testable hypotheses. However, qualitative, inductive research is not meant to test hypotheses and is not subject to typical notions of “power and sample size” often expected of quantitative statistical analyses. Qualitative studies reach sufficient sample size when no further themes emerge, a situation called “thematic saturation”; the sample size here of 29 participants rests comfortably in the range of participants commonly needed for thematic saturation.23
Barbash et al. identified common themes in opinions of quality leaders regarding SEP-1. Namely, the complexity of SEP-1 necessitated a major resource investment into sepsis care and data collection. The major infrastructure investments needed to comply with SEP-1 also bred frustration regarding lack of perceived fairness around the “all or none” nature of the measure and raised multiple additional challenges including lack of clinician buy-in and resistance to protocolized care. Prior qualitative studies evaluating hospital quality leaders’ opinions on performance measures identified similar concerns about lack of “fairness,”24 but the implementation of SEP-1 has raised additional concern regarding the large burdens of instituting major infrastructure changes to monitor processes of care required to report on this measure. Despite the major challenges of responding to SEP-1, quality leaders expressed optimism that increased attention to sepsis would ultimately lead to better patient outcomes.
How might future sepsis quality measures achieve the adequate balance between focusing attention on improving care processes for high-impact diseases, without imposing additional burdens on the healthcare system? Lessons from Barbash et al. help us move forward. First, rather than taxing hospitals with administratively complex process measures, initial attempts at quality measures should start simply. Policy makers should consider moving forward into new areas of quality measurement in 2 ways: (1) pursue 1 or 2 processes with strong etiological links to important patient outcomes (eg, timely antibiotics in septic shock),25-28 and/or (2) use risk-adjusted outcomes and allow individual hospitals to adopt processes that improve local patient outcomes. Evidence suggests that the introduction of a quality measure may result in improved outcomes regardless of adoption of specific target processes,29 although results are mixed.30,31 In either case, complex “all or none” measures based upon weak evidence run a high risk of inciting clinician resentment and paradoxically perpetuating poor quality by increasing healthcare costs (decreased efficiency) without gains in safety, effectiveness, timeliness, or equity.32 It has been estimated that hospitals spend on average $2 million to implement SEP-1,33 with unclear return on the investment. The experience of SEP-1 is a reminder that, as evidence evolves, quality measures must adapt lest they become irrelevant. However, it is also a reminder that quality measures should not sit precariously on the edge of evidence. Withdrawal of process-based measures due to a changing evidence landscape breeds mistrust and impairs future attempts to improve quality.
Sepsis quality measures face additional challenges. If recent experience with interpretation of sepsis definitions can serve as a guide, variable uptake of newer sepsis definitions between/across hospitals will impair the ability to risk-adjust outcome measures and increase bias in identifying outlier hospitals.34 In addition, recent studies have already raised skepticism regarding the effectiveness of individual SEP-1 bundle components, confirming suspicions that the 30 cc/kg fluid bolus is not a magic quality target. Rather, the effectiveness of prior sepsis bundles has likely been driven by improved time to antibiotics, a process unstudied in sepsis trials, but driven by increased attention to the importance of early sepsis recognition and timely management.28 Timeliness of antibiotics can act as an effect modifier for more complex sepsis therapies, with quicker time to antibiotics associated with reversal of previously described effectiveness of activated protein C,35 and EGDT.28
Sepsis has a legacy in which improving simple processes (ie, time to antibiotics) obviates the need for more complex interventions (eg, activated protein C, EGDT). To the extent that CMS remains committed to using process-based measures of quality, those focused on sepsis are likely to be most effective when pared down to the simplest and strongest evidence base—improved recognition36 and timely antibiotics (for patients with infection-induced organ dysfunction and shock). Taking the time to start simply may best serve our current patients and preserve stakeholder buy-in for quality initiatives likely to benefit our future patients.
Disclosure
Dr. Lindenauer reports that he received support from the Centers for Medicare and Medicaid Services to develop and maintain hospital outcome measures for pneumonia and COPD. Dr. Lindenauer is supported by grant K24HL132008 from the National Heart, Lung, and Blood Institute. Dr. Walkey was supported by grants K01-HL116768 and R01-HL139751 from the National Heart, Lung, and Blood Institute.
“I didn’t have time to write a short letter, so I wrote a long one instead.”
-Mark Twain
Sepsis is a logical target for quality measures. Specifically, sepsis represents the perfect storm of immense public health burden1-3 combined with unexplained practice4-6 and outcomes7 variation. Thus, it is not surprising that in October 2015, the Centers of Medicare and Medicaid Services (CMS) adopted a sepsis quality measure.8 More surprising were the complex contents of the CMS Sepsis Core Measure “SEP-1” quality measure.9 CMS had written a “long letter.”
The multiple processes targeted with the CMS SEP-1 quality measure can best be understood with a brief account of history. SEP-1 arose from the National Quality Forum’s (NQF) project #0500: “Severe Sepsis and Septic Shock: Management Bundle,” a measure based upon Rivers et al.’s10 single-center, randomized, controlled trial of early goal-directed therapy (EGDT) for severe sepsis. EGDT was an intervention that consisted of fluid resuscitation and hemodynamic management based upon fulfilling specific targets of central venous pressure, superior vena cava oxygen saturation (or lactic acid), and hemoglobin and mean arterial pressures.11 The large mortality benefits, physiological rationale, and algorithmic responses to a variety of abnormal clinical values provided an appealing protocol to critical care and emergency physicians trained to normalize measured values, as well as policy makers looking for quality measures. Observational studies consistently showed associations between adoption of guideline-based “sepsis bundles” and improved patient outcomes,12-14 setting the stage for the transition of NQF #0500 into SEP-1.
However, the transition from EGDT-based NQF #0500 to SEP-1 has been tumultuous. Soon after adoption of SEP-1, the consensus definitions of sepsis changed markedly. Sepsis went from being defined as the presence of infection with concomitant systemic inflammatory response syndrome (sepsis), organ dysfunction (severe sepsis), and/or shock,15 to being defined as a dysregulated response to infection resulting in life-threatening organ dysfunction (sepsis) and/or fluid-resistant hypotension requiring vasopressors and lactate greater than 2 mmol/L.16 As the study by Barbash et al.17
In addition to its unprecedented complexity, SEP-1 received criticism for the weak evidence base of its individual components. The general concepts behind SEP-1 are well-accepted tenets of sepsis management: rapid recognition, assessment and treatment of underlying infection, and institution of intravenous fluids and vasopressor support for septic shock. However, the “all or none” prescriptive nature of the SEP-1 bundle was based on a somewhat arbitrary set of measures and targets. For example, patients with septic shock must receive 30 cc/kg of intravenous fluids to be “SEP-1 compliant.” The value “30 cc/kg” was taken from the average volume of fluids reported in prior sepsis trials, essentially based on a very low level of evidence.20 The strict 30 cc/kg cutoff did not take into account that “the median isn’t the message”21 in fluid management: optimal resuscitation targets are unclear,22 and selecting the median as a target ignores the fact that 50% of patients enrolled in international trials of EGDT received less than 30 cc/kg of initial fluid resuscitation (the interquartile range was 16-42 cc/kg).18 Thus, most participants in trials upon which the SEP-1 fluid measure was based would ironically not have met the SEP-1 measure. Mandates for physical exam and physiological measures were based on similarly low levels of evidence.
Into this context, Barbash et al. use a representative sample of US hospitals to explore the opinions of hospital quality leaders regarding the SEP-1 measure. First, the qualitative methods used by Barbash et al. warrant some explanation. Much of biomedical research is characterized by hypothesis-driven, deductive reasoning: theories are tested using observations. In contrast, the methods of Barbash et al. use inductive reasoning: observations are used to develop theories within a systematic approach called “grounded theory” that explores common themes emerging from structured interviews.23 Inductive reasoning can later inform deductive reasoning, feeding theories into testable hypotheses. However, qualitative, inductive research is not meant to test hypotheses and is not subject to typical notions of “power and sample size” often expected of quantitative statistical analyses. Qualitative studies reach sufficient sample size when no further themes emerge, a situation called “thematic saturation”; the sample size here of 29 participants rests comfortably in the range of participants commonly needed for thematic saturation.23
Barbash et al. identified common themes in opinions of quality leaders regarding SEP-1. Namely, the complexity of SEP-1 necessitated a major resource investment into sepsis care and data collection. The major infrastructure investments needed to comply with SEP-1 also bred frustration regarding lack of perceived fairness around the “all or none” nature of the measure and raised multiple additional challenges including lack of clinician buy-in and resistance to protocolized care. Prior qualitative studies evaluating hospital quality leaders’ opinions on performance measures identified similar concerns about lack of “fairness,”24 but the implementation of SEP-1 has raised additional concern regarding the large burdens of instituting major infrastructure changes to monitor processes of care required to report on this measure. Despite the major challenges of responding to SEP-1, quality leaders expressed optimism that increased attention to sepsis would ultimately lead to better patient outcomes.
How might future sepsis quality measures achieve the adequate balance between focusing attention on improving care processes for high-impact diseases, without imposing additional burdens on the healthcare system? Lessons from Barbash et al. help us move forward. First, rather than taxing hospitals with administratively complex process measures, initial attempts at quality measures should start simply. Policy makers should consider moving forward into new areas of quality measurement in 2 ways: (1) pursue 1 or 2 processes with strong etiological links to important patient outcomes (eg, timely antibiotics in septic shock),25-28 and/or (2) use risk-adjusted outcomes and allow individual hospitals to adopt processes that improve local patient outcomes. Evidence suggests that the introduction of a quality measure may result in improved outcomes regardless of adoption of specific target processes,29 although results are mixed.30,31 In either case, complex “all or none” measures based upon weak evidence run a high risk of inciting clinician resentment and paradoxically perpetuating poor quality by increasing healthcare costs (decreased efficiency) without gains in safety, effectiveness, timeliness, or equity.32 It has been estimated that hospitals spend on average $2 million to implement SEP-1,33 with unclear return on the investment. The experience of SEP-1 is a reminder that, as evidence evolves, quality measures must adapt lest they become irrelevant. However, it is also a reminder that quality measures should not sit precariously on the edge of evidence. Withdrawal of process-based measures due to a changing evidence landscape breeds mistrust and impairs future attempts to improve quality.
Sepsis quality measures face additional challenges. If recent experience with interpretation of sepsis definitions can serve as a guide, variable uptake of newer sepsis definitions between/across hospitals will impair the ability to risk-adjust outcome measures and increase bias in identifying outlier hospitals.34 In addition, recent studies have already raised skepticism regarding the effectiveness of individual SEP-1 bundle components, confirming suspicions that the 30 cc/kg fluid bolus is not a magic quality target. Rather, the effectiveness of prior sepsis bundles has likely been driven by improved time to antibiotics, a process unstudied in sepsis trials, but driven by increased attention to the importance of early sepsis recognition and timely management.28 Timeliness of antibiotics can act as an effect modifier for more complex sepsis therapies, with quicker time to antibiotics associated with reversal of previously described effectiveness of activated protein C,35 and EGDT.28
Sepsis has a legacy in which improving simple processes (ie, time to antibiotics) obviates the need for more complex interventions (eg, activated protein C, EGDT). To the extent that CMS remains committed to using process-based measures of quality, those focused on sepsis are likely to be most effective when pared down to the simplest and strongest evidence base—improved recognition36 and timely antibiotics (for patients with infection-induced organ dysfunction and shock). Taking the time to start simply may best serve our current patients and preserve stakeholder buy-in for quality initiatives likely to benefit our future patients.
Disclosure
Dr. Lindenauer reports that he received support from the Centers for Medicare and Medicaid Services to develop and maintain hospital outcome measures for pneumonia and COPD. Dr. Lindenauer is supported by grant K24HL132008 from the National Heart, Lung, and Blood Institute. Dr. Walkey was supported by grants K01-HL116768 and R01-HL139751 from the National Heart, Lung, and Blood Institute.
1. Elixhauser A, Friedman B, Stranges E. Septicemia in U.S. Hospitals, 2009. HCUP. Statistical Brief #122. Rockville MD: Agency for Healthcare Research and Quality; 2011; p 1-13. PubMed
2. Liu V, Lei X, Prescott HC, Kipnis P, Iwashyna TJ, Escobar GJ. Hospital readmission and healthcare utilization following sepsis in community settings. J Hosp Med. 2014;9(8):502-507. PubMed
3. Liu V, Escobar GJ, Greene JD, et al. Hospital deaths in patients with sepsis from 2 independent cohorts. JAMA. 2014;312(1):90-92. PubMed
4. Peltan ID, Mitchell KH, Rudd KE, et al. Physician Variation in Time to Antimicrobial Treatment for Septic Patients Presenting to the Emergency Department. Crit Care Med. 2017;45(6):1011-1018. PubMed
5. Marik PE, Linde-Zwirble WT, Bittner EA, Sahatjian J, Hansell D. Fluid administration in severe sepsis and septic shock, patterns and outcomes: an analysis of a large national database. Intensive Care Med. 2017;43(5):625-632. PubMed
6. Lagu T, Rothberg MB, Nathanson BH, Pekow PS, Steingrub JS, Lindenauer PK. Variation in the care of septic shock: the impact of patient and hospital characteristics. J Crit Care. 2012;27(4):329-336. PubMed
7. Wang HE, Donnelly JP, Shapiro NI, Hohmann SF, Levitan EB. Hospital variations in severe sepsis mortality. Am J Med Qual. 2015;30(4):328-336. PubMed
8. Centers for Medicare & Medicaid Services. CMS Measures Inventory. https://www.cms.gov/Medicare/Quality-Initiatives-Patient-Assessment-Instruments/QualityMeasures/CMS-Measures-Inventory.html. Accessed June 8, 2017.
9. QualityNet. Specifications Manual, Version 5.0b, Section 2.2. Severe Sepsis and Septic Shock. https://www.qualitynet.org/dcs/ContentServer?c=Page&pagename=QnetPublic%2FPage%2FQnetTier4&cid=1228774725171. Accessed June 8, 2017.
10. National Quality Forum. 0500 Severe sepsis and septic shock management bundle. http://www.qualityforum.org. Accessed June 8, 2017.
11. Rivers E, Nguyen B, Havstad S, et al. Early Goal-Directed Therapy in the Treatment of Severe Sepsis and Septic Shock. N Engl J Med. 2001;345:1368-1377. PubMed
12. Levy MM, Dellinger RP, Townsend SR, et al. The Surviving Sepsis Campaign: results of an international guideline-based performance improvement program targeting severe sepsis. Crit Care Med. 2010;38(2):367-374. PubMed
13. Levy MM, Artigas A, Phillips GS, et al. Outcomes of the Surviving Sepsis Campaign in intensive care units in the USA and Europe: a prospective cohort study. Lancet Infect Dis. 2012;12(12):919-924. PubMed
14. Ferrer R, Artigas A, Levy MM, et al. Improvement in process of care and outcome after a multicenter severe sepsis educational program in Spain. JAMA. 2008;299(19):2294-2303. PubMed
15. Bone RC, Balk RA, Cerra FB, et al. Definitions for sepsis and organ failure and guidelines for the use of innovative therapies in sepsis. The ACCP/SCCM Consensus Conference Committee. American College of Chest Physicians/Society of Critical Care Medicine. Chest. 1992;101(6):1644-1655. PubMed
16. Singer M, Deutschman CS, Seymour CW, et al. The Third International Consensus Definitions for Sepsis and Septic Shock (Sepsis-3). JAMA. 2016;315(8):801-810. PubMed
17. Barbash IJ, Rak KJ, Kuza CC, Kahn JM. Hospital Perceptions of Medicare’s Sepsis Quality Reporting Initiative. J Hosp Med. 2017;12(12):963-967.
18. The PRISM Investigators. Early, Goal-Directed Therapy for Septic Shock — A Patient-Level Meta-Analysis. N Engl J Med. 2017;376:2223-2234. PubMed
19. National Quality Forum. NQF Revises Sepsis Measure. http://www.qualityforum.org/NQF_Revises_Sepsis_Measure.aspx. Accessed June 8, 2017.
20. Rhodes A, Evans LE, Alhazzani W, et al. Surviving Sepsis Campaign: International Guidelines for Management of Sepsis and Septic Shock: 2016. Intensive Care Med. 2017;43(3):304-377. PubMed
21. Gould SJ. The median isn’t the message. Discover. 1985;6:40-42. PubMed
22. Hernandez G, Teboul JL. Fourth Surviving Sepsis Campaign’s hemodynamic recommendations: a step forward or a return to chaos? Crit Care. 2017;21(1):133. PubMed
23. Fugard AJ, Potts HW. Supporting thinking on sample sizes for thematic analyses. Int J Soc Res Methodol. 2015;18(6):669-684.
24. Goff SL, Lagu T, Pekow PS, et al. A qualitative analysis of hospital leaders’ opinions about publicly reported measures of health care quality. Jt Comm J Qual Patient Saf. 2015;41(4):169-176. PubMed
25. Kumar A, Haery C, Paladugu B, et al. The duration of hypotension before the initiation of antibiotic treatment is a critical determinant of survival in a murine model of Escherichia coli septic shock: association with serum lactate and inflammatory cytokine levels. J Infect Dis. 2006;193(2):251-258.
PubMed
26. Liu VX, Fielding-Singh V, Greene JD, et al. The Timing of Early Antibiotics and Hospital Mortality in Sepsis. Am J Respir Crit Care Med. 2017. [Epub ahead of print]. PubMed
27. Seymour CW, Gesten F, Prescott HC, et al. Time to Treatment and Mortality during Mandated Emergency Care for Sepsis. N Engl J Med. 2017;376:2235-2244. PubMed
28. Kalil AC, Johnson DW, Lisco SJ, Sun J. Early Goal-Directed Therapy for Sepsis: A Novel Solution for Discordant Survival Outcomes in Clinical Trials. Crit Care Med. 2017;45(4):607-614. PubMed
29. Tu JV, Donovan LR, Lee DS, et al. Effectiveness of public report cards for improving the quality of cardiac care: the EFFECT study: a randomized trial. JAMA. 2009;302(21):2330-2337. PubMed
30. Joynt KE, Blumenthal DM, Orav EJ, Resnic FS, Jha AK. Association of public reporting for percutaneous coronary intervention with utilization and outcomes among Medicare beneficiaries with acute myocardial infarction. JAMA. 2012;308(14):1460-1468. PubMed
31. Osborne NH, Nicholas LH, Ryan AM, Thumma JR, Dimick JB. Association of hospital participation in a quality reporting program with surgical outcomes and expenditures for Medicare beneficiaries. JAMA. 2015;313(5):496-504. PubMed
32. Institute of Medicine (US) Committee on Quality of Health Care in America. Crossing the Quality Chasm: A New Health System for the 21st Century. Washington (DC): National Academies Press (US); 2001. PubMed
33. 2015;12(11):1676-1684.Ann Am Thorac Soc36. Kramer RD, Cooke CR, Liu V, Miller RR 3rd, Iwashyna TJ. Variation in the Contents of Sepsis Bundles and Quality Measures. A Systematic Review. PubMed
34. 2012;40(11):2974-2981.Crit Care Med35. Rimmer E, Kumar A, Doucette S, et al. Activated protein C and septic shock: a propensity-matched cohort study*. PubMed
35. 2014;160(6):380-388.Ann Intern Med34. Rothberg MB, Pekow PS, Priya A, Lindenauer PK. Variation in diagnostic coding of patients with pneumonia and its association with hospital risk-standardized mortality rates: a cross-sectional analysis. PubMed
36. 2015;12(11):1597-1599. Ann Am Thorac Soc33. Wall MJ, Howell MD. Variation and Cost-effectiveness of Quality Measurement Programs. The Case of Sepsis Bundles. PubMed
1. Elixhauser A, Friedman B, Stranges E. Septicemia in U.S. Hospitals, 2009. HCUP. Statistical Brief #122. Rockville MD: Agency for Healthcare Research and Quality; 2011; p 1-13. PubMed
2. Liu V, Lei X, Prescott HC, Kipnis P, Iwashyna TJ, Escobar GJ. Hospital readmission and healthcare utilization following sepsis in community settings. J Hosp Med. 2014;9(8):502-507. PubMed
3. Liu V, Escobar GJ, Greene JD, et al. Hospital deaths in patients with sepsis from 2 independent cohorts. JAMA. 2014;312(1):90-92. PubMed
4. Peltan ID, Mitchell KH, Rudd KE, et al. Physician Variation in Time to Antimicrobial Treatment for Septic Patients Presenting to the Emergency Department. Crit Care Med. 2017;45(6):1011-1018. PubMed
5. Marik PE, Linde-Zwirble WT, Bittner EA, Sahatjian J, Hansell D. Fluid administration in severe sepsis and septic shock, patterns and outcomes: an analysis of a large national database. Intensive Care Med. 2017;43(5):625-632. PubMed
6. Lagu T, Rothberg MB, Nathanson BH, Pekow PS, Steingrub JS, Lindenauer PK. Variation in the care of septic shock: the impact of patient and hospital characteristics. J Crit Care. 2012;27(4):329-336. PubMed
7. Wang HE, Donnelly JP, Shapiro NI, Hohmann SF, Levitan EB. Hospital variations in severe sepsis mortality. Am J Med Qual. 2015;30(4):328-336. PubMed
8. Centers for Medicare & Medicaid Services. CMS Measures Inventory. https://www.cms.gov/Medicare/Quality-Initiatives-Patient-Assessment-Instruments/QualityMeasures/CMS-Measures-Inventory.html. Accessed June 8, 2017.
9. QualityNet. Specifications Manual, Version 5.0b, Section 2.2. Severe Sepsis and Septic Shock. https://www.qualitynet.org/dcs/ContentServer?c=Page&pagename=QnetPublic%2FPage%2FQnetTier4&cid=1228774725171. Accessed June 8, 2017.
10. National Quality Forum. 0500 Severe sepsis and septic shock management bundle. http://www.qualityforum.org. Accessed June 8, 2017.
11. Rivers E, Nguyen B, Havstad S, et al. Early Goal-Directed Therapy in the Treatment of Severe Sepsis and Septic Shock. N Engl J Med. 2001;345:1368-1377. PubMed
12. Levy MM, Dellinger RP, Townsend SR, et al. The Surviving Sepsis Campaign: results of an international guideline-based performance improvement program targeting severe sepsis. Crit Care Med. 2010;38(2):367-374. PubMed
13. Levy MM, Artigas A, Phillips GS, et al. Outcomes of the Surviving Sepsis Campaign in intensive care units in the USA and Europe: a prospective cohort study. Lancet Infect Dis. 2012;12(12):919-924. PubMed
14. Ferrer R, Artigas A, Levy MM, et al. Improvement in process of care and outcome after a multicenter severe sepsis educational program in Spain. JAMA. 2008;299(19):2294-2303. PubMed
15. Bone RC, Balk RA, Cerra FB, et al. Definitions for sepsis and organ failure and guidelines for the use of innovative therapies in sepsis. The ACCP/SCCM Consensus Conference Committee. American College of Chest Physicians/Society of Critical Care Medicine. Chest. 1992;101(6):1644-1655. PubMed
16. Singer M, Deutschman CS, Seymour CW, et al. The Third International Consensus Definitions for Sepsis and Septic Shock (Sepsis-3). JAMA. 2016;315(8):801-810. PubMed
17. Barbash IJ, Rak KJ, Kuza CC, Kahn JM. Hospital Perceptions of Medicare’s Sepsis Quality Reporting Initiative. J Hosp Med. 2017;12(12):963-967.
18. The PRISM Investigators. Early, Goal-Directed Therapy for Septic Shock — A Patient-Level Meta-Analysis. N Engl J Med. 2017;376:2223-2234. PubMed
19. National Quality Forum. NQF Revises Sepsis Measure. http://www.qualityforum.org/NQF_Revises_Sepsis_Measure.aspx. Accessed June 8, 2017.
20. Rhodes A, Evans LE, Alhazzani W, et al. Surviving Sepsis Campaign: International Guidelines for Management of Sepsis and Septic Shock: 2016. Intensive Care Med. 2017;43(3):304-377. PubMed
21. Gould SJ. The median isn’t the message. Discover. 1985;6:40-42. PubMed
22. Hernandez G, Teboul JL. Fourth Surviving Sepsis Campaign’s hemodynamic recommendations: a step forward or a return to chaos? Crit Care. 2017;21(1):133. PubMed
23. Fugard AJ, Potts HW. Supporting thinking on sample sizes for thematic analyses. Int J Soc Res Methodol. 2015;18(6):669-684.
24. Goff SL, Lagu T, Pekow PS, et al. A qualitative analysis of hospital leaders’ opinions about publicly reported measures of health care quality. Jt Comm J Qual Patient Saf. 2015;41(4):169-176. PubMed
25. Kumar A, Haery C, Paladugu B, et al. The duration of hypotension before the initiation of antibiotic treatment is a critical determinant of survival in a murine model of Escherichia coli septic shock: association with serum lactate and inflammatory cytokine levels. J Infect Dis. 2006;193(2):251-258.
PubMed
26. Liu VX, Fielding-Singh V, Greene JD, et al. The Timing of Early Antibiotics and Hospital Mortality in Sepsis. Am J Respir Crit Care Med. 2017. [Epub ahead of print]. PubMed
27. Seymour CW, Gesten F, Prescott HC, et al. Time to Treatment and Mortality during Mandated Emergency Care for Sepsis. N Engl J Med. 2017;376:2235-2244. PubMed
28. Kalil AC, Johnson DW, Lisco SJ, Sun J. Early Goal-Directed Therapy for Sepsis: A Novel Solution for Discordant Survival Outcomes in Clinical Trials. Crit Care Med. 2017;45(4):607-614. PubMed
29. Tu JV, Donovan LR, Lee DS, et al. Effectiveness of public report cards for improving the quality of cardiac care: the EFFECT study: a randomized trial. JAMA. 2009;302(21):2330-2337. PubMed
30. Joynt KE, Blumenthal DM, Orav EJ, Resnic FS, Jha AK. Association of public reporting for percutaneous coronary intervention with utilization and outcomes among Medicare beneficiaries with acute myocardial infarction. JAMA. 2012;308(14):1460-1468. PubMed
31. Osborne NH, Nicholas LH, Ryan AM, Thumma JR, Dimick JB. Association of hospital participation in a quality reporting program with surgical outcomes and expenditures for Medicare beneficiaries. JAMA. 2015;313(5):496-504. PubMed
32. Institute of Medicine (US) Committee on Quality of Health Care in America. Crossing the Quality Chasm: A New Health System for the 21st Century. Washington (DC): National Academies Press (US); 2001. PubMed
33. 2015;12(11):1676-1684.Ann Am Thorac Soc36. Kramer RD, Cooke CR, Liu V, Miller RR 3rd, Iwashyna TJ. Variation in the Contents of Sepsis Bundles and Quality Measures. A Systematic Review. PubMed
34. 2012;40(11):2974-2981.Crit Care Med35. Rimmer E, Kumar A, Doucette S, et al. Activated protein C and septic shock: a propensity-matched cohort study*. PubMed
35. 2014;160(6):380-388.Ann Intern Med34. Rothberg MB, Pekow PS, Priya A, Lindenauer PK. Variation in diagnostic coding of patients with pneumonia and its association with hospital risk-standardized mortality rates: a cross-sectional analysis. PubMed
36. 2015;12(11):1597-1599. Ann Am Thorac Soc33. Wall MJ, Howell MD. Variation and Cost-effectiveness of Quality Measurement Programs. The Case of Sepsis Bundles. PubMed
©2017 Society of Hospital Medicine
Cardiac Biomarkers—Are We Testing Wisely?
Cardiac biomarker testing, along with a thorough patient history, physical exam, and an electrocardiogram, is required for the diagnosis of patients with suspected acute coronary syndrome (ACS). For nearly 3 decades, 2 cardiac biomarkers, troponin (I or T) and creatine kinase-MB fraction (CK-MB), have been ordered together to evaluate ACS patients out of concern that utilizing a single biomarker might be less diagnostically accurate than using 2 biomarkers. However, subsequent studies have shown that troponin is far more sensitive and specific for myocardial injury than CK-MB.1,2 Troponin testing offers important prognostic information irrespective of whether the CK-MB is normal or abnormal.3,4 In 2015, the American Society of Clinical Pathology released a Choosing Wisely® recommendation against ordering CK-MB (or myoglobin) for the diagnosis of acute myocardial infarction (AMI).5 This reflects an emerging consensus that CK-MB testing represents low-value care while troponin testing alone is the appropriate diagnostic strategy for ACS patients.
Remarkably, we know very little about patterns of cardiac biomarker utilization in clinical practice. In this issue of the Journal of Hospital Medicine, Prochaska et al.6 provide a valuable snapshot of troponin and CK-MB utilization at 91 U.S. academic medical centers (AMCs) for 18 months prior to and following the release of the 2015 Choosing Wisely® recommendation. From a retrospective review of 106,954 inpatient discharges with a principal diagnosis of AMI, they report a 29.2% rate of troponin-only testing in 2013 with a gradual increase over 3 years to 53.5% in 2016. Interestingly, the study’s baseline troponin-only utilization rate is consistent with a 2013 College of American Pathologists survey, which estimated that 23% of U.S. clinical laboratories no longer process CK-MB (and therefore run troponins alone).7
Did the 2015 Choosing Wisely® recommendation have an impact on providers choosing cardiac biomarkers wisely? The authors answer this question in a novel way by stratifying hospitals into performance tertiles for each study quarter and then further classifying them into groups that were consistently high, middle, and low performers throughout the study period. Using an interrupted time series design, they identify 26 hospitals who improved their troponin-only testing performance tertile during the study period and examine their average quarterly rate of change. As illustrated in Figure 3, they report a sharp increase in the rate of change of troponin-only testing shortly after the release of the 2015 Choosing Wisely® recommendation. The authors reasonably conclude that the Choosing Wisely® campaign “appeared to facilitate accelerated adoption of troponin-only testing” among these hospitals.
However, we should interpret these results with caution. The authors highlight several limitations, including the absence of causality common in observational studies and insufficient time to follow-up to capture the full (or transient) impact of the intervention. There are factors external to the Choosing Wisely® campaign that may have influenced cardiac biomarker testing patterns observed. Examples include variation in hospital leadership, financial drivers, and local culture that promote high-value care. We also note that (1) there are several published interventions to improve troponin-only ordering that predate the Choosing Wisely® campaign8,9; (2) a prominent cardiology guideline endorsed the use of troponin as a preferred cardiac biomarker in 201210; and (3) a widely cited opinion by prominent researchers called for the elimination of CK-MB from clinical practice in 2008.11 These publications suggest there was already an awareness of and efforts underway to improve cardiac enzyme testing contributing to the results described by Prochaska et al.
Limitations notwithstanding, we commend Prochaska et al. for conducting the first-known description of patient-level trend rates of troponin and CK-MB testing. Finally, it is worth noting that where there is accomplishment, there is also opportunity. At the end of the study period, nearly 50% of institutions had yet to adopt a troponin-only strategy. While there has been an overall trend towards improvement, this number remains high. We may conjecture as to possible explanations: Providers may be unconvinced that a single troponin is sufficient in the diagnosis of ACS (ie, lack of knowledge or debate over the interpretation of available science), stakeholders may be slow to de-adopt practices using appropriate systems levers (eg, laboratories delisting CK-MB processing), and incentives may be lacking to motivate AMCs. The results of this study should be used as a burning platform to those who wish to “test wisely” in cardiac biomarker use.
Disclosure
The authors report no conflicts of interest or financial disclosures.
1. Katus HA, Remppis A, Neumann FJ, et al. Diagnostic efficiency of troponin T measurements in acute myocardial infarction. Circulation. 1991;83:902-912. PubMed
2. Adams JE III, Bodor GS, Dávila-Román VG, et al. Cardiac troponin I. A marker with high specificity for cardiac injury. Circulation. 1993;88:101-106. PubMed
3. Newby LK, Roe MT, Chen AY, et al. Frequency and clinical implications of discordant creatine kinase-MB and troponin measurements in acute coronary syndromes. J Am Coll Cardiol. 2006;47:312-318. PubMed
4. Goodman SG, Steg PG, Eagle KA, et al. The diagnostic and prognostic impact of the redefinition of acute myocardial infarction: lessons from the Global Registry of Acute Coronary Events (GRACE). Am Heart J. 2006;151:654-660. PubMed
5. American Society of Clinical Pathology - Choosing Wisely recommendations; http://www.choosingwisely.org/clinicianlists/#parentSociety=American_Society_for_Clinical_Pathology. Released February 2015. Accessed June 12, 2017.
6. Prochaska MT, Hohmann SF, Modes M, Arora VM. Trends in Troponin-Only Testing for AMI in Academic Teaching Hospitals and the Impact of Choosing Wisely®. J Hosp
7. Singh G, Baweja PS. CK-MB: Journey to Obsolescence. Am J Clin Pathol. 2014;141(3):415-419. PubMed
8. Larochelle MR, Knight AM, Pantle H, Riedel S, Trost JC. Reducing excess biomarker use at an academic medical center. J Gen Intern Med. 2014;29(11):1468-1474. PubMed
9. Baron JM, Lewandrowski KB, Kamis IK, Singh B, Belkziz SM, Dighe AS. A novel strategy for evaluating the effects of an electronic test ordering alert message: optimizing cardiac marker use. J Pathol Inform. 2012;3:3. PubMed
10. Thygesen K, Alpert JS, Jaffe AS, et al. Third Universal Definition of Myocardial Infarction. Circulation. 2012;126:2020-2035. PubMed
11. Saenger AK, Jaffe AS. Requiem for a Heavyweight: The Demise of CK-MB. Circulation. 2008;118(21):2200-2206. PubMed
Cardiac biomarker testing, along with a thorough patient history, physical exam, and an electrocardiogram, is required for the diagnosis of patients with suspected acute coronary syndrome (ACS). For nearly 3 decades, 2 cardiac biomarkers, troponin (I or T) and creatine kinase-MB fraction (CK-MB), have been ordered together to evaluate ACS patients out of concern that utilizing a single biomarker might be less diagnostically accurate than using 2 biomarkers. However, subsequent studies have shown that troponin is far more sensitive and specific for myocardial injury than CK-MB.1,2 Troponin testing offers important prognostic information irrespective of whether the CK-MB is normal or abnormal.3,4 In 2015, the American Society of Clinical Pathology released a Choosing Wisely® recommendation against ordering CK-MB (or myoglobin) for the diagnosis of acute myocardial infarction (AMI).5 This reflects an emerging consensus that CK-MB testing represents low-value care while troponin testing alone is the appropriate diagnostic strategy for ACS patients.
Remarkably, we know very little about patterns of cardiac biomarker utilization in clinical practice. In this issue of the Journal of Hospital Medicine, Prochaska et al.6 provide a valuable snapshot of troponin and CK-MB utilization at 91 U.S. academic medical centers (AMCs) for 18 months prior to and following the release of the 2015 Choosing Wisely® recommendation. From a retrospective review of 106,954 inpatient discharges with a principal diagnosis of AMI, they report a 29.2% rate of troponin-only testing in 2013 with a gradual increase over 3 years to 53.5% in 2016. Interestingly, the study’s baseline troponin-only utilization rate is consistent with a 2013 College of American Pathologists survey, which estimated that 23% of U.S. clinical laboratories no longer process CK-MB (and therefore run troponins alone).7
Did the 2015 Choosing Wisely® recommendation have an impact on providers choosing cardiac biomarkers wisely? The authors answer this question in a novel way by stratifying hospitals into performance tertiles for each study quarter and then further classifying them into groups that were consistently high, middle, and low performers throughout the study period. Using an interrupted time series design, they identify 26 hospitals who improved their troponin-only testing performance tertile during the study period and examine their average quarterly rate of change. As illustrated in Figure 3, they report a sharp increase in the rate of change of troponin-only testing shortly after the release of the 2015 Choosing Wisely® recommendation. The authors reasonably conclude that the Choosing Wisely® campaign “appeared to facilitate accelerated adoption of troponin-only testing” among these hospitals.
However, we should interpret these results with caution. The authors highlight several limitations, including the absence of causality common in observational studies and insufficient time to follow-up to capture the full (or transient) impact of the intervention. There are factors external to the Choosing Wisely® campaign that may have influenced cardiac biomarker testing patterns observed. Examples include variation in hospital leadership, financial drivers, and local culture that promote high-value care. We also note that (1) there are several published interventions to improve troponin-only ordering that predate the Choosing Wisely® campaign8,9; (2) a prominent cardiology guideline endorsed the use of troponin as a preferred cardiac biomarker in 201210; and (3) a widely cited opinion by prominent researchers called for the elimination of CK-MB from clinical practice in 2008.11 These publications suggest there was already an awareness of and efforts underway to improve cardiac enzyme testing contributing to the results described by Prochaska et al.
Limitations notwithstanding, we commend Prochaska et al. for conducting the first-known description of patient-level trend rates of troponin and CK-MB testing. Finally, it is worth noting that where there is accomplishment, there is also opportunity. At the end of the study period, nearly 50% of institutions had yet to adopt a troponin-only strategy. While there has been an overall trend towards improvement, this number remains high. We may conjecture as to possible explanations: Providers may be unconvinced that a single troponin is sufficient in the diagnosis of ACS (ie, lack of knowledge or debate over the interpretation of available science), stakeholders may be slow to de-adopt practices using appropriate systems levers (eg, laboratories delisting CK-MB processing), and incentives may be lacking to motivate AMCs. The results of this study should be used as a burning platform to those who wish to “test wisely” in cardiac biomarker use.
Disclosure
The authors report no conflicts of interest or financial disclosures.
Cardiac biomarker testing, along with a thorough patient history, physical exam, and an electrocardiogram, is required for the diagnosis of patients with suspected acute coronary syndrome (ACS). For nearly 3 decades, 2 cardiac biomarkers, troponin (I or T) and creatine kinase-MB fraction (CK-MB), have been ordered together to evaluate ACS patients out of concern that utilizing a single biomarker might be less diagnostically accurate than using 2 biomarkers. However, subsequent studies have shown that troponin is far more sensitive and specific for myocardial injury than CK-MB.1,2 Troponin testing offers important prognostic information irrespective of whether the CK-MB is normal or abnormal.3,4 In 2015, the American Society of Clinical Pathology released a Choosing Wisely® recommendation against ordering CK-MB (or myoglobin) for the diagnosis of acute myocardial infarction (AMI).5 This reflects an emerging consensus that CK-MB testing represents low-value care while troponin testing alone is the appropriate diagnostic strategy for ACS patients.
Remarkably, we know very little about patterns of cardiac biomarker utilization in clinical practice. In this issue of the Journal of Hospital Medicine, Prochaska et al.6 provide a valuable snapshot of troponin and CK-MB utilization at 91 U.S. academic medical centers (AMCs) for 18 months prior to and following the release of the 2015 Choosing Wisely® recommendation. From a retrospective review of 106,954 inpatient discharges with a principal diagnosis of AMI, they report a 29.2% rate of troponin-only testing in 2013 with a gradual increase over 3 years to 53.5% in 2016. Interestingly, the study’s baseline troponin-only utilization rate is consistent with a 2013 College of American Pathologists survey, which estimated that 23% of U.S. clinical laboratories no longer process CK-MB (and therefore run troponins alone).7
Did the 2015 Choosing Wisely® recommendation have an impact on providers choosing cardiac biomarkers wisely? The authors answer this question in a novel way by stratifying hospitals into performance tertiles for each study quarter and then further classifying them into groups that were consistently high, middle, and low performers throughout the study period. Using an interrupted time series design, they identify 26 hospitals who improved their troponin-only testing performance tertile during the study period and examine their average quarterly rate of change. As illustrated in Figure 3, they report a sharp increase in the rate of change of troponin-only testing shortly after the release of the 2015 Choosing Wisely® recommendation. The authors reasonably conclude that the Choosing Wisely® campaign “appeared to facilitate accelerated adoption of troponin-only testing” among these hospitals.
However, we should interpret these results with caution. The authors highlight several limitations, including the absence of causality common in observational studies and insufficient time to follow-up to capture the full (or transient) impact of the intervention. There are factors external to the Choosing Wisely® campaign that may have influenced cardiac biomarker testing patterns observed. Examples include variation in hospital leadership, financial drivers, and local culture that promote high-value care. We also note that (1) there are several published interventions to improve troponin-only ordering that predate the Choosing Wisely® campaign8,9; (2) a prominent cardiology guideline endorsed the use of troponin as a preferred cardiac biomarker in 201210; and (3) a widely cited opinion by prominent researchers called for the elimination of CK-MB from clinical practice in 2008.11 These publications suggest there was already an awareness of and efforts underway to improve cardiac enzyme testing contributing to the results described by Prochaska et al.
Limitations notwithstanding, we commend Prochaska et al. for conducting the first-known description of patient-level trend rates of troponin and CK-MB testing. Finally, it is worth noting that where there is accomplishment, there is also opportunity. At the end of the study period, nearly 50% of institutions had yet to adopt a troponin-only strategy. While there has been an overall trend towards improvement, this number remains high. We may conjecture as to possible explanations: Providers may be unconvinced that a single troponin is sufficient in the diagnosis of ACS (ie, lack of knowledge or debate over the interpretation of available science), stakeholders may be slow to de-adopt practices using appropriate systems levers (eg, laboratories delisting CK-MB processing), and incentives may be lacking to motivate AMCs. The results of this study should be used as a burning platform to those who wish to “test wisely” in cardiac biomarker use.
Disclosure
The authors report no conflicts of interest or financial disclosures.
1. Katus HA, Remppis A, Neumann FJ, et al. Diagnostic efficiency of troponin T measurements in acute myocardial infarction. Circulation. 1991;83:902-912. PubMed
2. Adams JE III, Bodor GS, Dávila-Román VG, et al. Cardiac troponin I. A marker with high specificity for cardiac injury. Circulation. 1993;88:101-106. PubMed
3. Newby LK, Roe MT, Chen AY, et al. Frequency and clinical implications of discordant creatine kinase-MB and troponin measurements in acute coronary syndromes. J Am Coll Cardiol. 2006;47:312-318. PubMed
4. Goodman SG, Steg PG, Eagle KA, et al. The diagnostic and prognostic impact of the redefinition of acute myocardial infarction: lessons from the Global Registry of Acute Coronary Events (GRACE). Am Heart J. 2006;151:654-660. PubMed
5. American Society of Clinical Pathology - Choosing Wisely recommendations; http://www.choosingwisely.org/clinicianlists/#parentSociety=American_Society_for_Clinical_Pathology. Released February 2015. Accessed June 12, 2017.
6. Prochaska MT, Hohmann SF, Modes M, Arora VM. Trends in Troponin-Only Testing for AMI in Academic Teaching Hospitals and the Impact of Choosing Wisely®. J Hosp
7. Singh G, Baweja PS. CK-MB: Journey to Obsolescence. Am J Clin Pathol. 2014;141(3):415-419. PubMed
8. Larochelle MR, Knight AM, Pantle H, Riedel S, Trost JC. Reducing excess biomarker use at an academic medical center. J Gen Intern Med. 2014;29(11):1468-1474. PubMed
9. Baron JM, Lewandrowski KB, Kamis IK, Singh B, Belkziz SM, Dighe AS. A novel strategy for evaluating the effects of an electronic test ordering alert message: optimizing cardiac marker use. J Pathol Inform. 2012;3:3. PubMed
10. Thygesen K, Alpert JS, Jaffe AS, et al. Third Universal Definition of Myocardial Infarction. Circulation. 2012;126:2020-2035. PubMed
11. Saenger AK, Jaffe AS. Requiem for a Heavyweight: The Demise of CK-MB. Circulation. 2008;118(21):2200-2206. PubMed
1. Katus HA, Remppis A, Neumann FJ, et al. Diagnostic efficiency of troponin T measurements in acute myocardial infarction. Circulation. 1991;83:902-912. PubMed
2. Adams JE III, Bodor GS, Dávila-Román VG, et al. Cardiac troponin I. A marker with high specificity for cardiac injury. Circulation. 1993;88:101-106. PubMed
3. Newby LK, Roe MT, Chen AY, et al. Frequency and clinical implications of discordant creatine kinase-MB and troponin measurements in acute coronary syndromes. J Am Coll Cardiol. 2006;47:312-318. PubMed
4. Goodman SG, Steg PG, Eagle KA, et al. The diagnostic and prognostic impact of the redefinition of acute myocardial infarction: lessons from the Global Registry of Acute Coronary Events (GRACE). Am Heart J. 2006;151:654-660. PubMed
5. American Society of Clinical Pathology - Choosing Wisely recommendations; http://www.choosingwisely.org/clinicianlists/#parentSociety=American_Society_for_Clinical_Pathology. Released February 2015. Accessed June 12, 2017.
6. Prochaska MT, Hohmann SF, Modes M, Arora VM. Trends in Troponin-Only Testing for AMI in Academic Teaching Hospitals and the Impact of Choosing Wisely®. J Hosp
7. Singh G, Baweja PS. CK-MB: Journey to Obsolescence. Am J Clin Pathol. 2014;141(3):415-419. PubMed
8. Larochelle MR, Knight AM, Pantle H, Riedel S, Trost JC. Reducing excess biomarker use at an academic medical center. J Gen Intern Med. 2014;29(11):1468-1474. PubMed
9. Baron JM, Lewandrowski KB, Kamis IK, Singh B, Belkziz SM, Dighe AS. A novel strategy for evaluating the effects of an electronic test ordering alert message: optimizing cardiac marker use. J Pathol Inform. 2012;3:3. PubMed
10. Thygesen K, Alpert JS, Jaffe AS, et al. Third Universal Definition of Myocardial Infarction. Circulation. 2012;126:2020-2035. PubMed
11. Saenger AK, Jaffe AS. Requiem for a Heavyweight: The Demise of CK-MB. Circulation. 2008;118(21):2200-2206. PubMed
© 2017 Society of Hospital Medicine
Opportunities and Challenges for Improving the Patient Experience in the Acute and Post–Acute Care Setting Using Patient Portals: The Patient’s Perspective
To realize the vision of patient-centered care, efforts are focusing on engaging patients and “care partners,” often a family caregiver, by using patient-facing technologies.1-4 Web-based patient portals linked to the electronic health record (EHR) provide patients and care partners with the ability to access personal health information online and to communicate with clinicians. In recent years, institutions have been increasing patient portal offerings to improve the patient experience, promote safety, and optimize healthcare delivery.5-7
DRIVERS OF ADOPTION
The adoption of patient portals has been driven by federal incentive programs (Meaningful Use), efforts by the Center for Medicare and Medicaid Services, and the Office of the National Coordinator for Health Information Technology to improve patient outcomes and the transition toward value-based reimbursement.2,8,9 The vast majority of use has been in ambulatory settings; use for acute care is nascent at best.10 Among hospitalized patients, few bring an internet-enabled computer or mobile device to access personal health records online.11 However, evidence suggests that care partners will use portals on behalf of acutely ill patients.4 As the Caregiver Advise, Record, Enable Act is implemented, hospitals will be required to identify patients’ care partners during hospitalization, inform them when the patient is ready for discharge, and provide self-management instructions during the transition home.12 In this context, understanding how best to leverage acute care patient portals will be important to institutions, clinicians, and vendors.
CURRENT KNOWLEDGE
The literature regarding acute care patient portals is rapidly growing.4,10 Hospitalized patients have unmet information and communication needs, and hospital-based clinicians struggle to meet these needs in a timely manner.13-15 In general, patients feel that using a mobile device to access personal health records has the potential to improve their experience.11 Early studies suggest that acute care patient portals can promote patient-centered communication and collaboration during hospitalization, including in intensive care settings.4,16,17 Furthermore, the use of acute care patient portals can improve perception of safety and quality, decrease anxiety, and increase understanding of health conditions.3,14 Although early evidence is promising, considerable knowledge gaps exist regarding patient outcomes over the acute episode of care.10,18
OUTSTANDING QUESTIONS
A clear area of interest is accessing acute care patient portals via mobile technology to engage patients during recovery from hospitalization.4,11 Although we do not yet know whether use during care transitions will favorably impact outcomes, given the high rate of harm after discharge, this seems likely.19 The few studies evaluating the effect on validated measures of engagement (Patient Activation Measure) and hospital readmissions have not shown demonstrable improvement to date.20,21 Clearly, optimizing acute care patient portals with regard to patient-clinician communication, as well as the type, timing, and format of information delivered, will be necessary to maximize value.4,22
From the patient’s perspective, there is much we can learn.23 Is the information that is presented pertinent, timely, and easy to understand? Will the use of portals detract from face-to-face interactions? Does greater transparency foster more accountability? Achieving an appropriate balance of digital health-information sharing for hospitalized patients is challenging given the sensitivity of patient data when diagnoses are uncertain and treatments are in flux.4,24 These questions must be answered as hospitals implement acute care patient portals.
ACUTE CARE PATIENT PORTAL TASK FORCE
To start addressing knowledge gaps, we established a task force of 21 leading researchers, informatics and policy experts, and clinical leaders. The Acute Care Patient Portal Task Force was a subgroup of the Libretto Consortium, a collaboration of 4 academic medical centers established by the Gordon and Betty Moore Foundation to design, develop, and implement technologies to engage patients, care partners, and providers in preventing harm in hospital settings. Initially, we were challenged with assessing stakeholders’ perspectives from early adopter institutions. We learned that acute care patient portals must offer an integrated experience across care settings, humanize the patient-clinician relationship, enable equitable access, and align with institutional strategy to promote sustainability.19

Cognitive Support
The opportunities identified include acclimatizing and assimilating to the hospital environment (reviewing policies and patient rights) and facilitating self-education and preparation by linking to personal health information and providing structured guidance at transitions.4 For example, a care partner of an incapacitated patient may watch a video to orient to the intensive care unit, navigate educational content linked to the patient’s admission diagnosis (pneumonia) entered in the EHR, view the timing of an upcoming imaging study (chest computed tomography scan), and complete a standardized checklist prior to discharge.
The main challenges we identified include ensuring accuracy of hospital-, unit-, and patient-level information, addressing information overload, configuring notification and display settings to optimize the user experience, presenting information at an appropriate health literacy level,4,21 and addressing security and privacy concerns when expanding access to family members.24
Respect and Boundaries
Opportunities identified include supporting individual learning styles by using interactive features of mobile devices to improve comprehension for visual, auditory, and tactile learners and reinforcing learning through the use of various types of digital media.25-27 For example, a visual learner may view a video tutorial for a newly prescribed medication. A tactile learner may prefer to use interactive graphical displays that exploit multidimensional touch capabilities of mobile devices to learn about active conditions or an upcoming procedure. An auditory learner may choose to use intelligent personal assistants to navigate their plan of care (“Hey Siri, what is my schedule for today?”). By addressing the learning preferences of patients and time constraints of clinicians, institutions can use acute care patient portals to promote more respectful interactions and collaborative decision-making during important care processes, such as obtaining surgical consent.28,29
We also identified opportunities to facilitate personalization by tailoring educational content and by enabling the use of patient-generated health data collected from wearable devices. For example, patients may prefer to interact with a virtual advocate to review discharge instructions (“Louis” in Project Re-Engineered Discharge) when personalized to their demographics and health literacy level.30-32 Patients may choose to upload step counts from wearable devices so that clinicians can monitor activity goals in preparation for discharge and while recovering afterwards. When supported in these ways, acute care patient portals allow patients to have more meaningful interactions with clinicians about diagnoses, treatments, prognosis, and goals for recovery.
The main challenges we identified include balancing interactions with technology and clinicians, ensuring clinicians understand how patients from different socioeconomic backgrounds use existing and newer technology to enhance self-management, assessing health and technology literacy, and understanding individual preferences for sharing patient-generated health data. Importantly, we must remain vigilant that patients will express concern about overdependence on technology, especially if it detracts from in-person interaction; our panelists emphasized that technology should never replace “human touch.”
Patient and Family Empowerment
The opportunities identified include promoting patient-centered communication by supporting a real-time and asynchronous dialogue among patients, care partners, and care team members (including ambulatory clinicians) while minimizing conversational silos4,33; displaying names, roles, and pictures of all care team members4,34; fostering transparency by sharing clinician documentation in progress notes and sign-outs35; ensuring accountability for a single plan of care spanning shift changes and handoffs, and providing a mechanism to enable real-time feedback.
Hospitalization can be a vulnerable and isolating experience, perpetuated by a lack of timely and coordinated communication with the care team. We identified opportunities to mitigate anxiety by promoting shared understanding when questions require input from multiple clinicians, when team members change, or when patients wish to communicate with their longitudinal ambulatory providers.4,34 For example, inviting patients to review clinicians’ progress notes should stimulate more open and meaningful communication.35 Furthermore, requesting that patients state their wishes, preferences, and goals could improve overall concordance with care team members.36,37 Empowering patients and care partners to voice their concerns, particularly those related to miscommunication, may mitigate harm propagated by handoffs, shift work, and weekend coverage.38,39 While reporting safety concerns represents a novel mechanism to augment medical-error reporting by clinicians alone,23,40 this strategy will be most effective when aligned with standardized communication initiatives (I-PASS) that have been proven to reduce medical errors and preventable adverse events and are being implemented nationally.41 Finally, by leveraging tools that facilitate instantaneous feedback, patients can be empowered to react to their plan (ranking skilled nursing facility options) as it is developed.
The main challenges we identified include managing expectations regarding the use of communication tools, accurately and reliably identifying care team members in the EHR,34 acknowledging patients as equal partners, ensuring patients receive a consistent message about diagnoses and therapies during handoffs and when multiple consultants have conflicting opinions about the plan,37 and addressing patient concerns fairly and respectfully.
RECOMMENDATIONS AND CONCLUSIONS
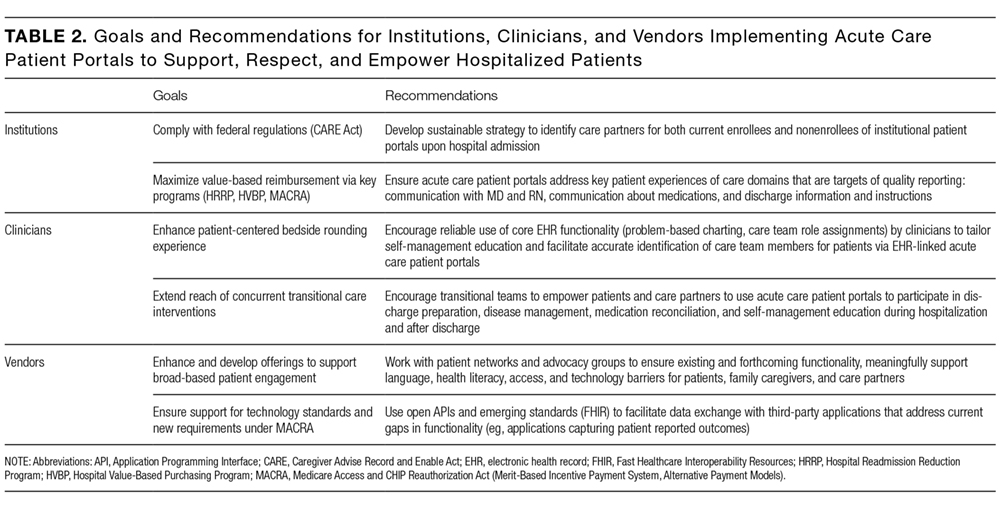
In summary, the patient-centered themes we identified serve as guiding principles for institutions, clinicians, and vendors who wish to use patient portals to improve the acute and postacute care patient experience. One central message resonates: Patients do not simply want access to their health information and the ability to communicate with the clinicians who furnish this information; they want to feel supported, respected, and empowered when doing so. It is only through partnership with patients and their advocates that we can fully realize the impact of digital technologies when patients are in their most vulnerable state.
Acknowledgments
The authors thank their colleagues and the patient and family advocates who contributed to this body of work as part of the Acute Care Patient Portal Task Force and conference: Brittany Couture; Ronen Rozenblum, PhD, MPH; Jennifer Prey, MPhil, MS, PhD; Kristin O’Reilly, RN, BSN, MPH; Patricia Q. Bourie, RN, MS, Cindy Dwyer, RN, BSN,S; Ryan Greysen, MD, MHS, MA; Jeffery Smith, MPP; Michael Gropper, MD, PhD; Patricia Dykes, RN, PhD; Martha B. Carnie; Jeffrey W. Mello; and Jane Webster.
Disclosure
Anuj K. Dalal, MD, David W. Bates, MD, MSc, and Sarah Collins, RN, PhD, are responsible for the conception or design of the work; acquisition, analysis, or interpretation of data; drafting the work or revising it critically for important intellectual content; and final approval of the version to be published. The authors agree to be accountable for all aspects of the work and to ensure that questions related to the accuracy or integrity of the work are appropriately investigated and resolved. This work was supported by a grant from the Gordon and Betty Moore Foundation ([GBMF] #4993). GBMF had no role in the design or conduct of the study; the collection, analysis, or interpretation of data; or preparation or review of the manuscript. The findings and conclusions in this report are those of the authors and do not necessarily represent the official position of GBMF. The authors report no conflicts of interest.
1. Sarkar U, Bates DW. Care partners and online patient portals. JAMA. 2014;311(4):357-358. PubMed
2. Grando MA, Rozenblum R, Bates DW, eds. Information Technology for Patient Empowerment in Healthcare, 1st Edition. Berlin: Walter de Gruyter Inc.; 2015.
3. Kelly MM, Hoonakker PLT, Dean SM. Using an inpatient portal to engage families in pediatric hospital care. J Am Med Inform Assoc. 2016;24(1):153-161. PubMed
4. Dalal AK, Dykes PC, Collins S, et al. A web-based, patient-centered toolkit to engage patients and caregivers in the acute care setting: A preliminary evaluation. J Am Med Inform Assoc. 2016;23(1):80-87. PubMed
5. Prey JE, Restaino S, Vawdrey DK. Providing hospital patients with access to their medical records. AMIA Annu Symp Proc. 2014;2014:1884-1893. PubMed
6. Herrin J, Harris KG, Kenward K, Hines S, Joshi MS, Frosch DL. Patient and family engagement: A survey of US hospital practices. BMJ Qual Saf. 2016;25(3):182-189. PubMed
7. Tom JO, Mangione-Smith R, Solomon C, Grossman DC. Integrated personal health record use: Association with parent-reported care experiences. Pediatrics. 2012;130(1):e183-e190. PubMed
8. Centers for Medicare & Medicaid Services (CMS), HHS. Medicare and Medicaid Programs; Electronic Health Record Incentive Program-Stage 2. Federal Register Final Rule. Sect. 170; 2012. https://www.federalregister.gov/documents/2012/03/07/2012-4443/medicare-and-medicaid-programs-electronic-health-record-incentive-program-stage-2. Accessed March 1, 2017.
9. Centers for Medicare & Medicaid Services (CMS), HHS. Medicare program; merit-based incentive payment system (MIPS) and alternative payment model (APM) incentive under the physician fee schedule, and criteria for physician-focused payment models. Final rule with comment period. Fed Regist. 2016;81(214):77008-77831. PubMed
10. Prey JE, Woollen J, Wilcox L, et al. Patient engagement in the inpatient setting: A systematic review. J Am Med Informat Assoc. 2014;21(4):742-750. PubMed
11. Ludwin S, Greysen SR. Use of smartphones and mobile devices in hospitalized patients: Untapped opportunities for inpatient engagement. J Hosp Med. 2015;10(7):459-461. PubMed
12. Coleman EA. Family caregivers as partners in care transitions: The caregiver advise record and enable act. J Hosp Med. 2016;11(12):883-885. PubMed
13. Kaziunas E, Hanauer DA, Ackerman MS, Choi SW. Identifying unmet informational needs in the inpatient setting to increase patient and caregiver engagement in the context of pediatric hematopoietic stem cell transplantation. J Am Med Inform Assoc. 2016;23(1):94-104. PubMed
14. Woollen J, Prey J, Wilcox L, et al. Patient experiences using an inpatient personal health record. Appl Clin Inform. 2016;7(2):446-460. PubMed
15. Irizarry T, DeVito Dabbs A, Curran CR. Patient portals and patient engagement: A state of the science review. J Med Internet Res. 2015;17(6):e148. doi:10.2196/jmir.4255. PubMed
16. Vawdrey DK, Wilcox LG, Collins SA, et al. A tablet computer application for patients to participate in their hospital care. AMIA Annu Symp Proc. 2011;2011:1428-1435. PubMed
17. Collins SA, Rozenblum R, Leung WY, et al. Acute care patient portals: A qualitative study of stakeholder perspectives on current practices. J Am Med Inform Assoc. 2016;24(e1):e9-e17. PubMed
18. Berger Z, Flickinger TE, Pfoh E, Martinez KA, Dy SM. Promoting engagement by patients and families to reduce adverse events in acute care settings: A systematic review. BMJ Qual Saf. 2014;23(7):548-555. PubMed
19. Forster AJ, Murff HJ, Peterson JF, Gandhi TK, Bates DW. The incidence and severity of adverse events affecting patients after discharge from the hospital. Ann Intern Med. 2003;138(3):161-167. PubMed
20. Griffin A, Skinner A, Thornhill J, Weinberger M. Patient Portals: Who uses them? What features do they use? And do they reduce hospital readmissions? Appl Clin Inform. 2016;7(2):489-501. PubMed
21. O’Leary KJ, Lohman ME, Culver E, Killarney A, Randy Smith G Jr, Liebovitz DM. The effect of tablet computers with a mobile patient portal application on hospitalized patients’ knowledge and activation. J Am Med Inform Assoc. 2016;23(1):159-165. PubMed
22. O’Leary KJ, Sharma RK, Killarney A, et al. Patients’ and Healthcare Providers’ Perceptions of a Mobile Portal Application for Hospitalized Patients. BMC Med Inform Decis Mak. 2016;16(1):123. PubMed
23. Pell JM, Mancuso M, Limon S, Oman K, Lin CT. Patient access to electronic health records during hospitalization. JAMA Intern Med. 2015;175(5):856-858. PubMed
24. Brown SM, Aboumatar HJ, Francis L, et al. Balancing digital information-sharing and patient privacy when engaging families in the intensive care unit. J Am Med Inform Assoc. 2016;23(5):995-1000. PubMed
25. Krishna S, Francisco BD, Balas EA, et al. Internet-enabled interactive multimedia asthma education program: A randomized trial. Pediatrics. 2003;111(3):503-510. PubMed
26. Fox MP. A systematic review of the literature reporting on studies that examined the impact of interactive, computer-based patient education programs. Patient Educ Couns. 2009;77(1):6-13. PubMed
27. Morgan ER, Laing K, McCarthy J, McCrate F, Seal MD. Using tablet-based technology in patient education about systemic therapy options for early-stage breast cancer: A pilot study. Curr Oncol. 2015;22(5):e364-e369. PubMed
28. Nehme J, El-Khani U, Chow A, Hakky S, Ahmed AR, Purkayastha S. The use of multimedia consent programs for surgical procedures: A systematic review. Surg Innov. 2013;20(1):13-23. PubMed
29. Waller A, Forshaw K, Carey M, et al. Optimizing patient preparation and surgical experience using eHealth technology. JMIR Med Inform. 2015;3(3):e29. PubMed
30. Abbott MB, Shaw P. Virtual nursing avatars: Nurse roles and evolving concepts of care. Online J Issues Nurs. 2016;21(3):7. PubMed
31. Cawthon C, Walia S, Osborn CY, Niesner KJ, Schnipper JL, Kripalani S. Improving care transitions: The patient perspective. J Health Commun. 2012;17 Suppl 3:312-324. PubMed
32. Bickmore TW, Pfeifer LM, Byron D, et al. Usability of conversational agents by patients with inadequate health literacy: Evidence from two clinical trials. J Health Commun. 2010;15 Suppl 2:197-210. PubMed
33. 2017;376(20):1905-1907. N Engl J Med.42. Mandl KD, Kohane IS. A 21st-century health IT system—creating a real-world information economy. PubMed
34. 2014;371(19):1803-1812.N Engl J Med41. Starmer AJ, Spector ND, Srivastava R, et al. Changes in medical errors after implementation of a handoff program. PubMed
35. 2016;24(1):153-161.J Am Med Inform Assoc.40. Kelly MM, Hoonakker PLT, Dean SM. Using an inpatient portal to engage families in pediatric hospital care. PubMed
36. 2017;171(4):372-381.JAMA Pediatr.39. Khan A, Coffey M, Litterer KP, et al. Families as partners in hospital error and adverse event surveillance. PubMed
37. 2017;17(4):389-402.Acad Pediatr.38. Khan A, Baird J, Rogers JE, et al. Parent and provider experience and shared understanding after a family-centered nighttime communication intervention. PubMed
38. 2016;6(6):319-329.Hosp Pediatr. 37. Khan A, Rogers JE, Forster CS, Furtak SL, Schuster MA, Landrigan CP. Communication and shared understanding between parents and resident-physicians at night. PubMed
39. 2016;11(9):615-619.J Hosp Med36. Figueroa JF, Schnipper JL, McNally K, Stade D, Lipsitz SR, Dalal AK. How often are hospitalized patients and providers on the same page with regard to the patient’s primary recovery goal for hospitalization? PubMed
40. 2013;8(7):414-417.J Hosp Med.35. Feldman HJ, Walker J, Li J, Delbanco T. OpenNotes: Hospitalists’ challenge and opportunity. PubMed
41. 2016;11(5):381-385.J Hosp Med.34. Dalal AK, Schnipper JL. Care team identification in the electronic health record: A critical first step for patient-centered communication.PubMed
42. 2016;24(e1):e178-e184.J Am Med Inform Assoc.33. Dalal AK, Schnipper J, Massaro A, et al. A web-based and mobile patient-centered “microblog” messaging platform to improve care team communication in acute care. PubMed
To realize the vision of patient-centered care, efforts are focusing on engaging patients and “care partners,” often a family caregiver, by using patient-facing technologies.1-4 Web-based patient portals linked to the electronic health record (EHR) provide patients and care partners with the ability to access personal health information online and to communicate with clinicians. In recent years, institutions have been increasing patient portal offerings to improve the patient experience, promote safety, and optimize healthcare delivery.5-7
DRIVERS OF ADOPTION
The adoption of patient portals has been driven by federal incentive programs (Meaningful Use), efforts by the Center for Medicare and Medicaid Services, and the Office of the National Coordinator for Health Information Technology to improve patient outcomes and the transition toward value-based reimbursement.2,8,9 The vast majority of use has been in ambulatory settings; use for acute care is nascent at best.10 Among hospitalized patients, few bring an internet-enabled computer or mobile device to access personal health records online.11 However, evidence suggests that care partners will use portals on behalf of acutely ill patients.4 As the Caregiver Advise, Record, Enable Act is implemented, hospitals will be required to identify patients’ care partners during hospitalization, inform them when the patient is ready for discharge, and provide self-management instructions during the transition home.12 In this context, understanding how best to leverage acute care patient portals will be important to institutions, clinicians, and vendors.
CURRENT KNOWLEDGE
The literature regarding acute care patient portals is rapidly growing.4,10 Hospitalized patients have unmet information and communication needs, and hospital-based clinicians struggle to meet these needs in a timely manner.13-15 In general, patients feel that using a mobile device to access personal health records has the potential to improve their experience.11 Early studies suggest that acute care patient portals can promote patient-centered communication and collaboration during hospitalization, including in intensive care settings.4,16,17 Furthermore, the use of acute care patient portals can improve perception of safety and quality, decrease anxiety, and increase understanding of health conditions.3,14 Although early evidence is promising, considerable knowledge gaps exist regarding patient outcomes over the acute episode of care.10,18
OUTSTANDING QUESTIONS
A clear area of interest is accessing acute care patient portals via mobile technology to engage patients during recovery from hospitalization.4,11 Although we do not yet know whether use during care transitions will favorably impact outcomes, given the high rate of harm after discharge, this seems likely.19 The few studies evaluating the effect on validated measures of engagement (Patient Activation Measure) and hospital readmissions have not shown demonstrable improvement to date.20,21 Clearly, optimizing acute care patient portals with regard to patient-clinician communication, as well as the type, timing, and format of information delivered, will be necessary to maximize value.4,22
From the patient’s perspective, there is much we can learn.23 Is the information that is presented pertinent, timely, and easy to understand? Will the use of portals detract from face-to-face interactions? Does greater transparency foster more accountability? Achieving an appropriate balance of digital health-information sharing for hospitalized patients is challenging given the sensitivity of patient data when diagnoses are uncertain and treatments are in flux.4,24 These questions must be answered as hospitals implement acute care patient portals.
ACUTE CARE PATIENT PORTAL TASK FORCE
To start addressing knowledge gaps, we established a task force of 21 leading researchers, informatics and policy experts, and clinical leaders. The Acute Care Patient Portal Task Force was a subgroup of the Libretto Consortium, a collaboration of 4 academic medical centers established by the Gordon and Betty Moore Foundation to design, develop, and implement technologies to engage patients, care partners, and providers in preventing harm in hospital settings. Initially, we were challenged with assessing stakeholders’ perspectives from early adopter institutions. We learned that acute care patient portals must offer an integrated experience across care settings, humanize the patient-clinician relationship, enable equitable access, and align with institutional strategy to promote sustainability.19
Cognitive Support
The opportunities identified include acclimatizing and assimilating to the hospital environment (reviewing policies and patient rights) and facilitating self-education and preparation by linking to personal health information and providing structured guidance at transitions.4 For example, a care partner of an incapacitated patient may watch a video to orient to the intensive care unit, navigate educational content linked to the patient’s admission diagnosis (pneumonia) entered in the EHR, view the timing of an upcoming imaging study (chest computed tomography scan), and complete a standardized checklist prior to discharge.
The main challenges we identified include ensuring accuracy of hospital-, unit-, and patient-level information, addressing information overload, configuring notification and display settings to optimize the user experience, presenting information at an appropriate health literacy level,4,21 and addressing security and privacy concerns when expanding access to family members.24
Respect and Boundaries
Opportunities identified include supporting individual learning styles by using interactive features of mobile devices to improve comprehension for visual, auditory, and tactile learners and reinforcing learning through the use of various types of digital media.25-27 For example, a visual learner may view a video tutorial for a newly prescribed medication. A tactile learner may prefer to use interactive graphical displays that exploit multidimensional touch capabilities of mobile devices to learn about active conditions or an upcoming procedure. An auditory learner may choose to use intelligent personal assistants to navigate their plan of care (“Hey Siri, what is my schedule for today?”). By addressing the learning preferences of patients and time constraints of clinicians, institutions can use acute care patient portals to promote more respectful interactions and collaborative decision-making during important care processes, such as obtaining surgical consent.28,29
We also identified opportunities to facilitate personalization by tailoring educational content and by enabling the use of patient-generated health data collected from wearable devices. For example, patients may prefer to interact with a virtual advocate to review discharge instructions (“Louis” in Project Re-Engineered Discharge) when personalized to their demographics and health literacy level.30-32 Patients may choose to upload step counts from wearable devices so that clinicians can monitor activity goals in preparation for discharge and while recovering afterwards. When supported in these ways, acute care patient portals allow patients to have more meaningful interactions with clinicians about diagnoses, treatments, prognosis, and goals for recovery.
The main challenges we identified include balancing interactions with technology and clinicians, ensuring clinicians understand how patients from different socioeconomic backgrounds use existing and newer technology to enhance self-management, assessing health and technology literacy, and understanding individual preferences for sharing patient-generated health data. Importantly, we must remain vigilant that patients will express concern about overdependence on technology, especially if it detracts from in-person interaction; our panelists emphasized that technology should never replace “human touch.”
Patient and Family Empowerment
The opportunities identified include promoting patient-centered communication by supporting a real-time and asynchronous dialogue among patients, care partners, and care team members (including ambulatory clinicians) while minimizing conversational silos4,33; displaying names, roles, and pictures of all care team members4,34; fostering transparency by sharing clinician documentation in progress notes and sign-outs35; ensuring accountability for a single plan of care spanning shift changes and handoffs, and providing a mechanism to enable real-time feedback.
Hospitalization can be a vulnerable and isolating experience, perpetuated by a lack of timely and coordinated communication with the care team. We identified opportunities to mitigate anxiety by promoting shared understanding when questions require input from multiple clinicians, when team members change, or when patients wish to communicate with their longitudinal ambulatory providers.4,34 For example, inviting patients to review clinicians’ progress notes should stimulate more open and meaningful communication.35 Furthermore, requesting that patients state their wishes, preferences, and goals could improve overall concordance with care team members.36,37 Empowering patients and care partners to voice their concerns, particularly those related to miscommunication, may mitigate harm propagated by handoffs, shift work, and weekend coverage.38,39 While reporting safety concerns represents a novel mechanism to augment medical-error reporting by clinicians alone,23,40 this strategy will be most effective when aligned with standardized communication initiatives (I-PASS) that have been proven to reduce medical errors and preventable adverse events and are being implemented nationally.41 Finally, by leveraging tools that facilitate instantaneous feedback, patients can be empowered to react to their plan (ranking skilled nursing facility options) as it is developed.
The main challenges we identified include managing expectations regarding the use of communication tools, accurately and reliably identifying care team members in the EHR,34 acknowledging patients as equal partners, ensuring patients receive a consistent message about diagnoses and therapies during handoffs and when multiple consultants have conflicting opinions about the plan,37 and addressing patient concerns fairly and respectfully.
RECOMMENDATIONS AND CONCLUSIONS
In summary, the patient-centered themes we identified serve as guiding principles for institutions, clinicians, and vendors who wish to use patient portals to improve the acute and postacute care patient experience. One central message resonates: Patients do not simply want access to their health information and the ability to communicate with the clinicians who furnish this information; they want to feel supported, respected, and empowered when doing so. It is only through partnership with patients and their advocates that we can fully realize the impact of digital technologies when patients are in their most vulnerable state.
Acknowledgments
The authors thank their colleagues and the patient and family advocates who contributed to this body of work as part of the Acute Care Patient Portal Task Force and conference: Brittany Couture; Ronen Rozenblum, PhD, MPH; Jennifer Prey, MPhil, MS, PhD; Kristin O’Reilly, RN, BSN, MPH; Patricia Q. Bourie, RN, MS, Cindy Dwyer, RN, BSN,S; Ryan Greysen, MD, MHS, MA; Jeffery Smith, MPP; Michael Gropper, MD, PhD; Patricia Dykes, RN, PhD; Martha B. Carnie; Jeffrey W. Mello; and Jane Webster.
Disclosure
Anuj K. Dalal, MD, David W. Bates, MD, MSc, and Sarah Collins, RN, PhD, are responsible for the conception or design of the work; acquisition, analysis, or interpretation of data; drafting the work or revising it critically for important intellectual content; and final approval of the version to be published. The authors agree to be accountable for all aspects of the work and to ensure that questions related to the accuracy or integrity of the work are appropriately investigated and resolved. This work was supported by a grant from the Gordon and Betty Moore Foundation ([GBMF] #4993). GBMF had no role in the design or conduct of the study; the collection, analysis, or interpretation of data; or preparation or review of the manuscript. The findings and conclusions in this report are those of the authors and do not necessarily represent the official position of GBMF. The authors report no conflicts of interest.
To realize the vision of patient-centered care, efforts are focusing on engaging patients and “care partners,” often a family caregiver, by using patient-facing technologies.1-4 Web-based patient portals linked to the electronic health record (EHR) provide patients and care partners with the ability to access personal health information online and to communicate with clinicians. In recent years, institutions have been increasing patient portal offerings to improve the patient experience, promote safety, and optimize healthcare delivery.5-7
DRIVERS OF ADOPTION
The adoption of patient portals has been driven by federal incentive programs (Meaningful Use), efforts by the Center for Medicare and Medicaid Services, and the Office of the National Coordinator for Health Information Technology to improve patient outcomes and the transition toward value-based reimbursement.2,8,9 The vast majority of use has been in ambulatory settings; use for acute care is nascent at best.10 Among hospitalized patients, few bring an internet-enabled computer or mobile device to access personal health records online.11 However, evidence suggests that care partners will use portals on behalf of acutely ill patients.4 As the Caregiver Advise, Record, Enable Act is implemented, hospitals will be required to identify patients’ care partners during hospitalization, inform them when the patient is ready for discharge, and provide self-management instructions during the transition home.12 In this context, understanding how best to leverage acute care patient portals will be important to institutions, clinicians, and vendors.
CURRENT KNOWLEDGE
The literature regarding acute care patient portals is rapidly growing.4,10 Hospitalized patients have unmet information and communication needs, and hospital-based clinicians struggle to meet these needs in a timely manner.13-15 In general, patients feel that using a mobile device to access personal health records has the potential to improve their experience.11 Early studies suggest that acute care patient portals can promote patient-centered communication and collaboration during hospitalization, including in intensive care settings.4,16,17 Furthermore, the use of acute care patient portals can improve perception of safety and quality, decrease anxiety, and increase understanding of health conditions.3,14 Although early evidence is promising, considerable knowledge gaps exist regarding patient outcomes over the acute episode of care.10,18
OUTSTANDING QUESTIONS
A clear area of interest is accessing acute care patient portals via mobile technology to engage patients during recovery from hospitalization.4,11 Although we do not yet know whether use during care transitions will favorably impact outcomes, given the high rate of harm after discharge, this seems likely.19 The few studies evaluating the effect on validated measures of engagement (Patient Activation Measure) and hospital readmissions have not shown demonstrable improvement to date.20,21 Clearly, optimizing acute care patient portals with regard to patient-clinician communication, as well as the type, timing, and format of information delivered, will be necessary to maximize value.4,22
From the patient’s perspective, there is much we can learn.23 Is the information that is presented pertinent, timely, and easy to understand? Will the use of portals detract from face-to-face interactions? Does greater transparency foster more accountability? Achieving an appropriate balance of digital health-information sharing for hospitalized patients is challenging given the sensitivity of patient data when diagnoses are uncertain and treatments are in flux.4,24 These questions must be answered as hospitals implement acute care patient portals.
ACUTE CARE PATIENT PORTAL TASK FORCE
To start addressing knowledge gaps, we established a task force of 21 leading researchers, informatics and policy experts, and clinical leaders. The Acute Care Patient Portal Task Force was a subgroup of the Libretto Consortium, a collaboration of 4 academic medical centers established by the Gordon and Betty Moore Foundation to design, develop, and implement technologies to engage patients, care partners, and providers in preventing harm in hospital settings. Initially, we were challenged with assessing stakeholders’ perspectives from early adopter institutions. We learned that acute care patient portals must offer an integrated experience across care settings, humanize the patient-clinician relationship, enable equitable access, and align with institutional strategy to promote sustainability.19
Cognitive Support
The opportunities identified include acclimatizing and assimilating to the hospital environment (reviewing policies and patient rights) and facilitating self-education and preparation by linking to personal health information and providing structured guidance at transitions.4 For example, a care partner of an incapacitated patient may watch a video to orient to the intensive care unit, navigate educational content linked to the patient’s admission diagnosis (pneumonia) entered in the EHR, view the timing of an upcoming imaging study (chest computed tomography scan), and complete a standardized checklist prior to discharge.
The main challenges we identified include ensuring accuracy of hospital-, unit-, and patient-level information, addressing information overload, configuring notification and display settings to optimize the user experience, presenting information at an appropriate health literacy level,4,21 and addressing security and privacy concerns when expanding access to family members.24
Respect and Boundaries
Opportunities identified include supporting individual learning styles by using interactive features of mobile devices to improve comprehension for visual, auditory, and tactile learners and reinforcing learning through the use of various types of digital media.25-27 For example, a visual learner may view a video tutorial for a newly prescribed medication. A tactile learner may prefer to use interactive graphical displays that exploit multidimensional touch capabilities of mobile devices to learn about active conditions or an upcoming procedure. An auditory learner may choose to use intelligent personal assistants to navigate their plan of care (“Hey Siri, what is my schedule for today?”). By addressing the learning preferences of patients and time constraints of clinicians, institutions can use acute care patient portals to promote more respectful interactions and collaborative decision-making during important care processes, such as obtaining surgical consent.28,29
We also identified opportunities to facilitate personalization by tailoring educational content and by enabling the use of patient-generated health data collected from wearable devices. For example, patients may prefer to interact with a virtual advocate to review discharge instructions (“Louis” in Project Re-Engineered Discharge) when personalized to their demographics and health literacy level.30-32 Patients may choose to upload step counts from wearable devices so that clinicians can monitor activity goals in preparation for discharge and while recovering afterwards. When supported in these ways, acute care patient portals allow patients to have more meaningful interactions with clinicians about diagnoses, treatments, prognosis, and goals for recovery.
The main challenges we identified include balancing interactions with technology and clinicians, ensuring clinicians understand how patients from different socioeconomic backgrounds use existing and newer technology to enhance self-management, assessing health and technology literacy, and understanding individual preferences for sharing patient-generated health data. Importantly, we must remain vigilant that patients will express concern about overdependence on technology, especially if it detracts from in-person interaction; our panelists emphasized that technology should never replace “human touch.”
Patient and Family Empowerment
The opportunities identified include promoting patient-centered communication by supporting a real-time and asynchronous dialogue among patients, care partners, and care team members (including ambulatory clinicians) while minimizing conversational silos4,33; displaying names, roles, and pictures of all care team members4,34; fostering transparency by sharing clinician documentation in progress notes and sign-outs35; ensuring accountability for a single plan of care spanning shift changes and handoffs, and providing a mechanism to enable real-time feedback.
Hospitalization can be a vulnerable and isolating experience, perpetuated by a lack of timely and coordinated communication with the care team. We identified opportunities to mitigate anxiety by promoting shared understanding when questions require input from multiple clinicians, when team members change, or when patients wish to communicate with their longitudinal ambulatory providers.4,34 For example, inviting patients to review clinicians’ progress notes should stimulate more open and meaningful communication.35 Furthermore, requesting that patients state their wishes, preferences, and goals could improve overall concordance with care team members.36,37 Empowering patients and care partners to voice their concerns, particularly those related to miscommunication, may mitigate harm propagated by handoffs, shift work, and weekend coverage.38,39 While reporting safety concerns represents a novel mechanism to augment medical-error reporting by clinicians alone,23,40 this strategy will be most effective when aligned with standardized communication initiatives (I-PASS) that have been proven to reduce medical errors and preventable adverse events and are being implemented nationally.41 Finally, by leveraging tools that facilitate instantaneous feedback, patients can be empowered to react to their plan (ranking skilled nursing facility options) as it is developed.
The main challenges we identified include managing expectations regarding the use of communication tools, accurately and reliably identifying care team members in the EHR,34 acknowledging patients as equal partners, ensuring patients receive a consistent message about diagnoses and therapies during handoffs and when multiple consultants have conflicting opinions about the plan,37 and addressing patient concerns fairly and respectfully.
RECOMMENDATIONS AND CONCLUSIONS
In summary, the patient-centered themes we identified serve as guiding principles for institutions, clinicians, and vendors who wish to use patient portals to improve the acute and postacute care patient experience. One central message resonates: Patients do not simply want access to their health information and the ability to communicate with the clinicians who furnish this information; they want to feel supported, respected, and empowered when doing so. It is only through partnership with patients and their advocates that we can fully realize the impact of digital technologies when patients are in their most vulnerable state.
Acknowledgments
The authors thank their colleagues and the patient and family advocates who contributed to this body of work as part of the Acute Care Patient Portal Task Force and conference: Brittany Couture; Ronen Rozenblum, PhD, MPH; Jennifer Prey, MPhil, MS, PhD; Kristin O’Reilly, RN, BSN, MPH; Patricia Q. Bourie, RN, MS, Cindy Dwyer, RN, BSN,S; Ryan Greysen, MD, MHS, MA; Jeffery Smith, MPP; Michael Gropper, MD, PhD; Patricia Dykes, RN, PhD; Martha B. Carnie; Jeffrey W. Mello; and Jane Webster.
Disclosure
Anuj K. Dalal, MD, David W. Bates, MD, MSc, and Sarah Collins, RN, PhD, are responsible for the conception or design of the work; acquisition, analysis, or interpretation of data; drafting the work or revising it critically for important intellectual content; and final approval of the version to be published. The authors agree to be accountable for all aspects of the work and to ensure that questions related to the accuracy or integrity of the work are appropriately investigated and resolved. This work was supported by a grant from the Gordon and Betty Moore Foundation ([GBMF] #4993). GBMF had no role in the design or conduct of the study; the collection, analysis, or interpretation of data; or preparation or review of the manuscript. The findings and conclusions in this report are those of the authors and do not necessarily represent the official position of GBMF. The authors report no conflicts of interest.
1. Sarkar U, Bates DW. Care partners and online patient portals. JAMA. 2014;311(4):357-358. PubMed
2. Grando MA, Rozenblum R, Bates DW, eds. Information Technology for Patient Empowerment in Healthcare, 1st Edition. Berlin: Walter de Gruyter Inc.; 2015.
3. Kelly MM, Hoonakker PLT, Dean SM. Using an inpatient portal to engage families in pediatric hospital care. J Am Med Inform Assoc. 2016;24(1):153-161. PubMed
4. Dalal AK, Dykes PC, Collins S, et al. A web-based, patient-centered toolkit to engage patients and caregivers in the acute care setting: A preliminary evaluation. J Am Med Inform Assoc. 2016;23(1):80-87. PubMed
5. Prey JE, Restaino S, Vawdrey DK. Providing hospital patients with access to their medical records. AMIA Annu Symp Proc. 2014;2014:1884-1893. PubMed
6. Herrin J, Harris KG, Kenward K, Hines S, Joshi MS, Frosch DL. Patient and family engagement: A survey of US hospital practices. BMJ Qual Saf. 2016;25(3):182-189. PubMed
7. Tom JO, Mangione-Smith R, Solomon C, Grossman DC. Integrated personal health record use: Association with parent-reported care experiences. Pediatrics. 2012;130(1):e183-e190. PubMed
8. Centers for Medicare & Medicaid Services (CMS), HHS. Medicare and Medicaid Programs; Electronic Health Record Incentive Program-Stage 2. Federal Register Final Rule. Sect. 170; 2012. https://www.federalregister.gov/documents/2012/03/07/2012-4443/medicare-and-medicaid-programs-electronic-health-record-incentive-program-stage-2. Accessed March 1, 2017.
9. Centers for Medicare & Medicaid Services (CMS), HHS. Medicare program; merit-based incentive payment system (MIPS) and alternative payment model (APM) incentive under the physician fee schedule, and criteria for physician-focused payment models. Final rule with comment period. Fed Regist. 2016;81(214):77008-77831. PubMed
10. Prey JE, Woollen J, Wilcox L, et al. Patient engagement in the inpatient setting: A systematic review. J Am Med Informat Assoc. 2014;21(4):742-750. PubMed
11. Ludwin S, Greysen SR. Use of smartphones and mobile devices in hospitalized patients: Untapped opportunities for inpatient engagement. J Hosp Med. 2015;10(7):459-461. PubMed
12. Coleman EA. Family caregivers as partners in care transitions: The caregiver advise record and enable act. J Hosp Med. 2016;11(12):883-885. PubMed
13. Kaziunas E, Hanauer DA, Ackerman MS, Choi SW. Identifying unmet informational needs in the inpatient setting to increase patient and caregiver engagement in the context of pediatric hematopoietic stem cell transplantation. J Am Med Inform Assoc. 2016;23(1):94-104. PubMed
14. Woollen J, Prey J, Wilcox L, et al. Patient experiences using an inpatient personal health record. Appl Clin Inform. 2016;7(2):446-460. PubMed
15. Irizarry T, DeVito Dabbs A, Curran CR. Patient portals and patient engagement: A state of the science review. J Med Internet Res. 2015;17(6):e148. doi:10.2196/jmir.4255. PubMed
16. Vawdrey DK, Wilcox LG, Collins SA, et al. A tablet computer application for patients to participate in their hospital care. AMIA Annu Symp Proc. 2011;2011:1428-1435. PubMed
17. Collins SA, Rozenblum R, Leung WY, et al. Acute care patient portals: A qualitative study of stakeholder perspectives on current practices. J Am Med Inform Assoc. 2016;24(e1):e9-e17. PubMed
18. Berger Z, Flickinger TE, Pfoh E, Martinez KA, Dy SM. Promoting engagement by patients and families to reduce adverse events in acute care settings: A systematic review. BMJ Qual Saf. 2014;23(7):548-555. PubMed
19. Forster AJ, Murff HJ, Peterson JF, Gandhi TK, Bates DW. The incidence and severity of adverse events affecting patients after discharge from the hospital. Ann Intern Med. 2003;138(3):161-167. PubMed
20. Griffin A, Skinner A, Thornhill J, Weinberger M. Patient Portals: Who uses them? What features do they use? And do they reduce hospital readmissions? Appl Clin Inform. 2016;7(2):489-501. PubMed
21. O’Leary KJ, Lohman ME, Culver E, Killarney A, Randy Smith G Jr, Liebovitz DM. The effect of tablet computers with a mobile patient portal application on hospitalized patients’ knowledge and activation. J Am Med Inform Assoc. 2016;23(1):159-165. PubMed
22. O’Leary KJ, Sharma RK, Killarney A, et al. Patients’ and Healthcare Providers’ Perceptions of a Mobile Portal Application for Hospitalized Patients. BMC Med Inform Decis Mak. 2016;16(1):123. PubMed
23. Pell JM, Mancuso M, Limon S, Oman K, Lin CT. Patient access to electronic health records during hospitalization. JAMA Intern Med. 2015;175(5):856-858. PubMed
24. Brown SM, Aboumatar HJ, Francis L, et al. Balancing digital information-sharing and patient privacy when engaging families in the intensive care unit. J Am Med Inform Assoc. 2016;23(5):995-1000. PubMed
25. Krishna S, Francisco BD, Balas EA, et al. Internet-enabled interactive multimedia asthma education program: A randomized trial. Pediatrics. 2003;111(3):503-510. PubMed
26. Fox MP. A systematic review of the literature reporting on studies that examined the impact of interactive, computer-based patient education programs. Patient Educ Couns. 2009;77(1):6-13. PubMed
27. Morgan ER, Laing K, McCarthy J, McCrate F, Seal MD. Using tablet-based technology in patient education about systemic therapy options for early-stage breast cancer: A pilot study. Curr Oncol. 2015;22(5):e364-e369. PubMed
28. Nehme J, El-Khani U, Chow A, Hakky S, Ahmed AR, Purkayastha S. The use of multimedia consent programs for surgical procedures: A systematic review. Surg Innov. 2013;20(1):13-23. PubMed
29. Waller A, Forshaw K, Carey M, et al. Optimizing patient preparation and surgical experience using eHealth technology. JMIR Med Inform. 2015;3(3):e29. PubMed
30. Abbott MB, Shaw P. Virtual nursing avatars: Nurse roles and evolving concepts of care. Online J Issues Nurs. 2016;21(3):7. PubMed
31. Cawthon C, Walia S, Osborn CY, Niesner KJ, Schnipper JL, Kripalani S. Improving care transitions: The patient perspective. J Health Commun. 2012;17 Suppl 3:312-324. PubMed
32. Bickmore TW, Pfeifer LM, Byron D, et al. Usability of conversational agents by patients with inadequate health literacy: Evidence from two clinical trials. J Health Commun. 2010;15 Suppl 2:197-210. PubMed
33. 2017;376(20):1905-1907. N Engl J Med.42. Mandl KD, Kohane IS. A 21st-century health IT system—creating a real-world information economy. PubMed
34. 2014;371(19):1803-1812.N Engl J Med41. Starmer AJ, Spector ND, Srivastava R, et al. Changes in medical errors after implementation of a handoff program. PubMed
35. 2016;24(1):153-161.J Am Med Inform Assoc.40. Kelly MM, Hoonakker PLT, Dean SM. Using an inpatient portal to engage families in pediatric hospital care. PubMed
36. 2017;171(4):372-381.JAMA Pediatr.39. Khan A, Coffey M, Litterer KP, et al. Families as partners in hospital error and adverse event surveillance. PubMed
37. 2017;17(4):389-402.Acad Pediatr.38. Khan A, Baird J, Rogers JE, et al. Parent and provider experience and shared understanding after a family-centered nighttime communication intervention. PubMed
38. 2016;6(6):319-329.Hosp Pediatr. 37. Khan A, Rogers JE, Forster CS, Furtak SL, Schuster MA, Landrigan CP. Communication and shared understanding between parents and resident-physicians at night. PubMed
39. 2016;11(9):615-619.J Hosp Med36. Figueroa JF, Schnipper JL, McNally K, Stade D, Lipsitz SR, Dalal AK. How often are hospitalized patients and providers on the same page with regard to the patient’s primary recovery goal for hospitalization? PubMed
40. 2013;8(7):414-417.J Hosp Med.35. Feldman HJ, Walker J, Li J, Delbanco T. OpenNotes: Hospitalists’ challenge and opportunity. PubMed
41. 2016;11(5):381-385.J Hosp Med.34. Dalal AK, Schnipper JL. Care team identification in the electronic health record: A critical first step for patient-centered communication.PubMed
42. 2016;24(e1):e178-e184.J Am Med Inform Assoc.33. Dalal AK, Schnipper J, Massaro A, et al. A web-based and mobile patient-centered “microblog” messaging platform to improve care team communication in acute care. PubMed
1. Sarkar U, Bates DW. Care partners and online patient portals. JAMA. 2014;311(4):357-358. PubMed
2. Grando MA, Rozenblum R, Bates DW, eds. Information Technology for Patient Empowerment in Healthcare, 1st Edition. Berlin: Walter de Gruyter Inc.; 2015.
3. Kelly MM, Hoonakker PLT, Dean SM. Using an inpatient portal to engage families in pediatric hospital care. J Am Med Inform Assoc. 2016;24(1):153-161. PubMed
4. Dalal AK, Dykes PC, Collins S, et al. A web-based, patient-centered toolkit to engage patients and caregivers in the acute care setting: A preliminary evaluation. J Am Med Inform Assoc. 2016;23(1):80-87. PubMed
5. Prey JE, Restaino S, Vawdrey DK. Providing hospital patients with access to their medical records. AMIA Annu Symp Proc. 2014;2014:1884-1893. PubMed
6. Herrin J, Harris KG, Kenward K, Hines S, Joshi MS, Frosch DL. Patient and family engagement: A survey of US hospital practices. BMJ Qual Saf. 2016;25(3):182-189. PubMed
7. Tom JO, Mangione-Smith R, Solomon C, Grossman DC. Integrated personal health record use: Association with parent-reported care experiences. Pediatrics. 2012;130(1):e183-e190. PubMed
8. Centers for Medicare & Medicaid Services (CMS), HHS. Medicare and Medicaid Programs; Electronic Health Record Incentive Program-Stage 2. Federal Register Final Rule. Sect. 170; 2012. https://www.federalregister.gov/documents/2012/03/07/2012-4443/medicare-and-medicaid-programs-electronic-health-record-incentive-program-stage-2. Accessed March 1, 2017.
9. Centers for Medicare & Medicaid Services (CMS), HHS. Medicare program; merit-based incentive payment system (MIPS) and alternative payment model (APM) incentive under the physician fee schedule, and criteria for physician-focused payment models. Final rule with comment period. Fed Regist. 2016;81(214):77008-77831. PubMed
10. Prey JE, Woollen J, Wilcox L, et al. Patient engagement in the inpatient setting: A systematic review. J Am Med Informat Assoc. 2014;21(4):742-750. PubMed
11. Ludwin S, Greysen SR. Use of smartphones and mobile devices in hospitalized patients: Untapped opportunities for inpatient engagement. J Hosp Med. 2015;10(7):459-461. PubMed
12. Coleman EA. Family caregivers as partners in care transitions: The caregiver advise record and enable act. J Hosp Med. 2016;11(12):883-885. PubMed
13. Kaziunas E, Hanauer DA, Ackerman MS, Choi SW. Identifying unmet informational needs in the inpatient setting to increase patient and caregiver engagement in the context of pediatric hematopoietic stem cell transplantation. J Am Med Inform Assoc. 2016;23(1):94-104. PubMed
14. Woollen J, Prey J, Wilcox L, et al. Patient experiences using an inpatient personal health record. Appl Clin Inform. 2016;7(2):446-460. PubMed
15. Irizarry T, DeVito Dabbs A, Curran CR. Patient portals and patient engagement: A state of the science review. J Med Internet Res. 2015;17(6):e148. doi:10.2196/jmir.4255. PubMed
16. Vawdrey DK, Wilcox LG, Collins SA, et al. A tablet computer application for patients to participate in their hospital care. AMIA Annu Symp Proc. 2011;2011:1428-1435. PubMed
17. Collins SA, Rozenblum R, Leung WY, et al. Acute care patient portals: A qualitative study of stakeholder perspectives on current practices. J Am Med Inform Assoc. 2016;24(e1):e9-e17. PubMed
18. Berger Z, Flickinger TE, Pfoh E, Martinez KA, Dy SM. Promoting engagement by patients and families to reduce adverse events in acute care settings: A systematic review. BMJ Qual Saf. 2014;23(7):548-555. PubMed
19. Forster AJ, Murff HJ, Peterson JF, Gandhi TK, Bates DW. The incidence and severity of adverse events affecting patients after discharge from the hospital. Ann Intern Med. 2003;138(3):161-167. PubMed
20. Griffin A, Skinner A, Thornhill J, Weinberger M. Patient Portals: Who uses them? What features do they use? And do they reduce hospital readmissions? Appl Clin Inform. 2016;7(2):489-501. PubMed
21. O’Leary KJ, Lohman ME, Culver E, Killarney A, Randy Smith G Jr, Liebovitz DM. The effect of tablet computers with a mobile patient portal application on hospitalized patients’ knowledge and activation. J Am Med Inform Assoc. 2016;23(1):159-165. PubMed
22. O’Leary KJ, Sharma RK, Killarney A, et al. Patients’ and Healthcare Providers’ Perceptions of a Mobile Portal Application for Hospitalized Patients. BMC Med Inform Decis Mak. 2016;16(1):123. PubMed
23. Pell JM, Mancuso M, Limon S, Oman K, Lin CT. Patient access to electronic health records during hospitalization. JAMA Intern Med. 2015;175(5):856-858. PubMed
24. Brown SM, Aboumatar HJ, Francis L, et al. Balancing digital information-sharing and patient privacy when engaging families in the intensive care unit. J Am Med Inform Assoc. 2016;23(5):995-1000. PubMed
25. Krishna S, Francisco BD, Balas EA, et al. Internet-enabled interactive multimedia asthma education program: A randomized trial. Pediatrics. 2003;111(3):503-510. PubMed
26. Fox MP. A systematic review of the literature reporting on studies that examined the impact of interactive, computer-based patient education programs. Patient Educ Couns. 2009;77(1):6-13. PubMed
27. Morgan ER, Laing K, McCarthy J, McCrate F, Seal MD. Using tablet-based technology in patient education about systemic therapy options for early-stage breast cancer: A pilot study. Curr Oncol. 2015;22(5):e364-e369. PubMed
28. Nehme J, El-Khani U, Chow A, Hakky S, Ahmed AR, Purkayastha S. The use of multimedia consent programs for surgical procedures: A systematic review. Surg Innov. 2013;20(1):13-23. PubMed
29. Waller A, Forshaw K, Carey M, et al. Optimizing patient preparation and surgical experience using eHealth technology. JMIR Med Inform. 2015;3(3):e29. PubMed
30. Abbott MB, Shaw P. Virtual nursing avatars: Nurse roles and evolving concepts of care. Online J Issues Nurs. 2016;21(3):7. PubMed
31. Cawthon C, Walia S, Osborn CY, Niesner KJ, Schnipper JL, Kripalani S. Improving care transitions: The patient perspective. J Health Commun. 2012;17 Suppl 3:312-324. PubMed
32. Bickmore TW, Pfeifer LM, Byron D, et al. Usability of conversational agents by patients with inadequate health literacy: Evidence from two clinical trials. J Health Commun. 2010;15 Suppl 2:197-210. PubMed
33. 2017;376(20):1905-1907. N Engl J Med.42. Mandl KD, Kohane IS. A 21st-century health IT system—creating a real-world information economy. PubMed
34. 2014;371(19):1803-1812.N Engl J Med41. Starmer AJ, Spector ND, Srivastava R, et al. Changes in medical errors after implementation of a handoff program. PubMed
35. 2016;24(1):153-161.J Am Med Inform Assoc.40. Kelly MM, Hoonakker PLT, Dean SM. Using an inpatient portal to engage families in pediatric hospital care. PubMed
36. 2017;171(4):372-381.JAMA Pediatr.39. Khan A, Coffey M, Litterer KP, et al. Families as partners in hospital error and adverse event surveillance. PubMed
37. 2017;17(4):389-402.Acad Pediatr.38. Khan A, Baird J, Rogers JE, et al. Parent and provider experience and shared understanding after a family-centered nighttime communication intervention. PubMed
38. 2016;6(6):319-329.Hosp Pediatr. 37. Khan A, Rogers JE, Forster CS, Furtak SL, Schuster MA, Landrigan CP. Communication and shared understanding between parents and resident-physicians at night. PubMed
39. 2016;11(9):615-619.J Hosp Med36. Figueroa JF, Schnipper JL, McNally K, Stade D, Lipsitz SR, Dalal AK. How often are hospitalized patients and providers on the same page with regard to the patient’s primary recovery goal for hospitalization? PubMed
40. 2013;8(7):414-417.J Hosp Med.35. Feldman HJ, Walker J, Li J, Delbanco T. OpenNotes: Hospitalists’ challenge and opportunity. PubMed
41. 2016;11(5):381-385.J Hosp Med.34. Dalal AK, Schnipper JL. Care team identification in the electronic health record: A critical first step for patient-centered communication.PubMed
42. 2016;24(e1):e178-e184.J Am Med Inform Assoc.33. Dalal AK, Schnipper J, Massaro A, et al. A web-based and mobile patient-centered “microblog” messaging platform to improve care team communication in acute care. PubMed
© 2017 Society of Hospital Medicine
Reconsidering Hospital Readmission Measures
Hospital readmission rates are a consequential and contentious measure of hospital quality. Readmissions within 30 days of hospital discharge are part of the Centers for Medicare & Medicaid Services (CMS) Value-Based Purchasing Program and are publicly reported. Hospital-wide readmissions and condition-specific readmissions are heavily weighted by US News & World Report in its hospital rankings and in the new CMS Five-Star Quality Rating System.1 However, clinicians and researchers question the construct validity of current readmission measures.2,3
The focus on readmissions began in 2009 when Jencks et al.4 reported that 20% of Medicare patients were readmitted within 30 days after hospital discharge. Policy makers embraced readmission reduction, assuming that a hospital readmission so soon after discharge reflected poor quality of hospital care and that, with focused efforts, hospitals could reduce readmissions and save CMS money. In 2010, the Affordable Care Act introduced an initiative to reduce readmissions and, in 2012, the Hospital Readmission Reduction Program was implemented, financially penalizing hospitals with higher-than-expected readmission rates for patients hospitalized with principal diagnoses of heart failure, myocardial infarction, and pneumonia.5 Readmission measures have since proliferated and now include pay-for-performance metrics for hospitalizations for chronic obstructive pulmonary disease (COPD), coronary artery bypass grafting, and total hip or knee arthroplasty. Measures are also reported for stroke patients and for “hospital-wide readmissions,” a catch-all measure intended to capture readmission rates across most diagnoses, with various exclusions intended to prevent counting planned readmissions (eg, hospitalization for cholecystectomy following a hospitalization for cholecystitis). These measures use claims data to construct hierarchical regression models at the patient and hospital levels, assuming that variation among readmission rates are due to hospital quality effects. The goal of this approach is to level the playing field to avoid penalizing hospitals for caring for sicker patients who are at higher risk for readmission for reasons unrelated to hospital care. Yet hospital readmissions are influenced by a complex set of variables that go well beyond hospital care, some of which may be better captured by existing models than others. Below we review several potential biases in the hospital readmission measures and offer policy recommendations to improve the accuracy of these measures.
Variation in a quality measure is influenced by the quality of the underlying data, the mix of patients served, bias in the performance measure, and the degree of systemic or random error.6 Hospital readmission rates are subject to multiple sources of variation, and true differences in the quality of care are often a much smaller source of this variation. A recent analysis of patient readmissions following general surgery found that the majority were unrelated to suboptimal medical care.7 Consider 3 scenarios in which a patient with COPD is readmitted 22 days after discharge. In hospital 1, the patient was discharged without a prescription for a steroid inhaler. In hospital 2, the patient was discharged on a steroid inhaler, filled the prescription, and elected not to use it. In hospital 3, the patient was discharged on a steroid inhaler and was provided medical assistance to fill the prescription but still could not afford the $15 copay. In all 3 scenarios, the hospital would be equally culpable under the current readmission measures, suffering financial and reputational penalties.
Yet the hospitals in these scenarios are not equally culpable. Variation in the mix of patients and bias in the measure impacted performance. Hospital 1 should clearly be held accountable for the readmission. In the cases of hospitals 2 and 3, the situations are more nuanced. More education about COPD, financial investment by the hospital to cover a copay, or a different transitional care approach may have increased the likelihood of patient compliance, but, ultimately, hospitals 2 and 3 were impacted by personal health behaviors and access to public health services and financial assistance, and the readmissions were less within their control.8
To be valid, hospital readmission measures would need to ensure that all hospitals are similar in patient characteristics and in the need for an availability of public health services. Yet these factors vary among hospitals and cannot be accounted for by models that rely exclusively on patient-level variables, such as the nature and severity of illness. As a result, the existing readmission measures are biased against certain types of hospitals. Hospitals that treat a greater proportion of patients who are socioeconomically disadvantaged; who lack access to primary care, medical assistance, or public health programs; and who have substance abuse and mental health issues will have higher readmission rates. Hospitals that care for patients who fail initial treatments and require referral for complex care will also have higher readmission rates. These types of patients are not randomly distributed throughout our healthcare system. They are clustered at rural hospitals in underserved areas, certain urban health systems, safety net hospitals, and academic health centers. It is not surprising that readmission penalties have most severely impacted large academic hospitals that care for disadvantaged populations.2 These penalties may have unintended consequences, reducing a hospital’s willingness to care for disadvantaged populations.
While these biases may unfairly harm hospitals caring for disadvantaged patients, the readmission measures may also indirectly harm patients. Low hospital readmission rates are not associated with reduced mortality and, in some instances, track with higher mortality.9-11 This may result from measurement factors (patients who die cannot be readmitted), from neighborhood socioeconomic status (SES) factors that may impact readmissions more,12 or from actual patient harm (some patients need acute care following discharge and may have worse outcomes if that care is delayed).11 Doctors have long recognized this potential risk; empiric evidence now supports them. While mortality measures may also be impacted by sociodemographic variables,13 whether to adjust for SES should be defined by the purpose of the measure. If the measure is meant to evaluate hospital quality (or utilization in the case of readmissions), adjusting for SES is appropriate because it is unrealistic to expect a health system to reduce income inequality and provide safe housing. Failure to adjust for SES, which has a large impact on outcomes, may mask a quality of care issue. Conversely, if the purpose of a measure is for a community to improve population health, then it should not be adjusted for SES because the community could adjust for income inequality.
Despite the complex ethical challenges created by the efforts to reduce readmissions, there has been virtually no public dialogue with patients, physicians, and policy makers regarding how to balance the trade-offs between reducing readmission and maintaining safety. Patients would likely value increased survival more than reduced readmissions, yet the current CMS Five-Star Rating System for hospital quality weighs readmissions equally with mortality in its hospital rankings, potentially misinforming patients. For example, many well-known academic medical centers score well (4 or 5 stars) on mortality and poorly (1 or 2 stars) on readmissions, resulting in a low or average overall score, calling into question face validity and confounding consumers struggling to make decisions about where to seek care. The Medicare Payment Advisory Commission’s Report to the Congress14 highlights the multiple significant systematic and random errors with the hospital readmission data.
Revisiting the Hospital Readmission Measures
Given significant bias in the hospital readmission measures and the ethical challenges imposed by reducing readmissions, potentially at the expense of survival, we believe CMS needs to take action to remedy the problem. First, CMS should drop hospital readmissions as a quality measure from its hospital rankings. Other hospital-rating groups and insurers should do the same. When included in payment schemes, readmissions should not be construed as a quality measure but as a utilization measure, like length of stay.
Second, the Department of Health & Human Services (HHS) should invest in maturing the hospital readmission measures to ensure construct, content, and criterion validity and reliability. No doubt the risk adjustment is complex and may be inherently limited using Medicare claims data. In the case of SES adjustment, for example, limited numbers of SES measures can be constructed from current data sources.8,13 There are other approaches to address this recommendation. For example, HHS could define a preventable readmission as one linked to some process or outcome of hospital care, such as whether the patient was discharged on an inhaler. The National Quality Forum used this approach to define a preventable venous thromboembolic event as one occurring when a patient did not receive appropriate prophylaxis. In this way, only hospital 1 in the 3 scenarios for the patient with COPD would be penalized. However, we recognize that it is not always simple to define specific process measures (eg, prescribing an inhaler) that link to readmission outcomes and that there may be other important yet hard-to-measure interventions (eg, patient and family education) that are important components of patient-centered care and readmission prevention. This is why readmissions are so challenging as a quality measure. If experts cannot define clinician behaviors that have a strong theory of change or are causally related to reduced readmissions, it is hard to call readmissions a modifiable quality measure. Another potential strategy to level the playing field would be to compare readmission rates across peer institutions only. For instance, tertiary-care safety net hospitals would be compared to one another and rural community hospitals would be compared to one another.14 Lastly, new data sources could be added to account for the social, community-level, public health, and personal health factors that heavily influence a patient’s risk for readmission, in addition to hospital-level factors. Appropriate methods will be needed to develop statistical models for risk adjustment; however, this is a complex topic and beyond the scope of the current paper.
Third, HHS could continue to use the current readmission measures as population health measures while supporting multistakeholder teams to better understand how people and their communities, public health agencies, insurers, and healthcare providers can collaborate to help patients thrive and avoid readmissions by addressing true defects in care and care coordination.
While it is understandable why policy makers chose to focus on hospital readmissions, and while we recognize that concerns about the measures were unknown when they were created, emerging evidence demonstrates that the current readmission measures (particularly when used as a quality metric) lack construct validity, contain significant bias and systematic errors, and create ethical tension by rewarding hospitals both financially and reputationally for turning away sick and socially disadvantaged patients who may, consequently, have adverse outcomes. Current readmission measures need to be reconsidered.
Acknowledgments
The authors thank Christine G. Holzmueller, BLA, with the Armstrong Institute for Patient Safety and Quality, Johns Hopkins Medicine, for her assistance in editing the manuscript and preparing it for journal submission.
Disclosure
Dr. Pronovost errs on the side of full disclosure and reports receiving grant or contract support from the Agency for Healthcare Research and Quality, the Gordon and Betty Moore Foundation (research related to patient safety and quality of care), the National Institutes of Health (acute lung injury research), and the American Medical Association Inc. (improve blood pressure control); honoraria from various healthcare organizations for speaking on patient safety and quality (the Leigh Bureau manages engagements); book royalties from the Penguin Group for his book Safe Patients, Smart Hospitals; and was receiving stock and fees to serve as a director for Cantel Medical up until 24 months ago. Dr. Pronovost is a founder of Patient Doctor Technologies, a startup company that seeks to enhance the partnership between patients and clinicians with an application called Doctella. Dr. Brotman, Dr. Hoyer, and Ms. Deutschendorf report no relevant conflicts of interest.
1. Centers for Medicare & Medicaid Services. Five-star quality rating system. https://www.cms.gov/medicare/provider-enrollment-and-certification/certificationandcomplianc/fsqrs.html. Accessed October 11, 2016.
2. Joynt KE, Jha AK. Characteristics of hospitals receiving penalties under the Hospital Readmissions Reduction Program. JAMA. 2013;309(4):342-343. PubMed
3. Boozary AS, Manchin J, 3rd, Wicker RF. The Medicare Hospital Readmissions Reduction Program: time for reform. JAMA. 2015;314(4):347-348. PubMed
4. Jencks SF, Williams MV, Coleman EA. Rehospitalizations among patients in the Medicare fee-for-service program. N Engl J Med. 2009;360(14):1418-1428. PubMed
5. Centers for Medicare & Medicaid Services. Readmissions Reduction Program (HRRP). https://www.cms.gov/medicare/medicare-fee-for-service-payment/acuteinpatientpps/readmissions-reduction-program.html. Accessed April 12, 2017.
6. Parker C, Schwamm LH, Fonarow GC, Smith EE, Reeves MJ. Stroke quality metrics: systematic reviews of the relationships to patient-centered outcomes and impact of public reporting. Stroke. 2012;43(1):155-162. PubMed
7. McIntyre LK, Arbabi S, Robinson EF, Maier RV. Analysis of risk factors for patient readmission 30 days following discharge from general surgery. JAMA Surg. 2016;151(9):855-861. PubMed
8. Sheingold SH, Zuckerman R, Shartzer A. Understanding Medicare hospital readmission rates and differing penalties between safety-net and other hospitals. Health Aff (Millwood). 2016;35(1):124-131. PubMed
9. Brotman DJ, Hoyer EH, Leung C, Lepley D, Deutschendorf A. Associations between hospital-wide readmission rates and mortality measures at the hospital level: are hospital-wide readmissions a measure of quality? J Hosp Med. 2016;11(9):650-651. PubMed
10. Krumholz HM, Lin Z, Keenan PS, et al. Relationship between hospital readmission and mortality rates for patients hospitalized with acute myocardial infarction, heart failure, or pneumonia. JAMA. 2013;309(6):587-593. PubMed
11. Fan VS, Gaziano JM, Lew R, et al. A comprehensive care management program to prevent chronic obstructive pulmonary disease hospitalizations: a randomized, controlled trial. Ann Intern Med. 2012;156(10):673-683. PubMed
12. Bikdeli B, Wayda B, Bao H, et al. Place of residence and outcomes of patients with heart failure: analysis from the Telemonitoring to Improve Heart Failure Outcomes Trial. Circ Cardiovasc Qual Outcomes. 2014;7(5):749-756. PubMed
13. Bernheim SM, Parzynski CS, Horwitz L, et al. Accounting for patients’ socioeconomic status does not change hospital readmission rates. Health Aff (Millwood). 2016;35(8):1461-1470. PubMed
14. Medicare Payment Advisory Commission. Refining the Hospital Readmissions Reduction Program. In: Report to the Congress: Medicare and the Health Care Delivery System, Chapter 4. June 2013. PubMed
Hospital readmission rates are a consequential and contentious measure of hospital quality. Readmissions within 30 days of hospital discharge are part of the Centers for Medicare & Medicaid Services (CMS) Value-Based Purchasing Program and are publicly reported. Hospital-wide readmissions and condition-specific readmissions are heavily weighted by US News & World Report in its hospital rankings and in the new CMS Five-Star Quality Rating System.1 However, clinicians and researchers question the construct validity of current readmission measures.2,3
The focus on readmissions began in 2009 when Jencks et al.4 reported that 20% of Medicare patients were readmitted within 30 days after hospital discharge. Policy makers embraced readmission reduction, assuming that a hospital readmission so soon after discharge reflected poor quality of hospital care and that, with focused efforts, hospitals could reduce readmissions and save CMS money. In 2010, the Affordable Care Act introduced an initiative to reduce readmissions and, in 2012, the Hospital Readmission Reduction Program was implemented, financially penalizing hospitals with higher-than-expected readmission rates for patients hospitalized with principal diagnoses of heart failure, myocardial infarction, and pneumonia.5 Readmission measures have since proliferated and now include pay-for-performance metrics for hospitalizations for chronic obstructive pulmonary disease (COPD), coronary artery bypass grafting, and total hip or knee arthroplasty. Measures are also reported for stroke patients and for “hospital-wide readmissions,” a catch-all measure intended to capture readmission rates across most diagnoses, with various exclusions intended to prevent counting planned readmissions (eg, hospitalization for cholecystectomy following a hospitalization for cholecystitis). These measures use claims data to construct hierarchical regression models at the patient and hospital levels, assuming that variation among readmission rates are due to hospital quality effects. The goal of this approach is to level the playing field to avoid penalizing hospitals for caring for sicker patients who are at higher risk for readmission for reasons unrelated to hospital care. Yet hospital readmissions are influenced by a complex set of variables that go well beyond hospital care, some of which may be better captured by existing models than others. Below we review several potential biases in the hospital readmission measures and offer policy recommendations to improve the accuracy of these measures.
Variation in a quality measure is influenced by the quality of the underlying data, the mix of patients served, bias in the performance measure, and the degree of systemic or random error.6 Hospital readmission rates are subject to multiple sources of variation, and true differences in the quality of care are often a much smaller source of this variation. A recent analysis of patient readmissions following general surgery found that the majority were unrelated to suboptimal medical care.7 Consider 3 scenarios in which a patient with COPD is readmitted 22 days after discharge. In hospital 1, the patient was discharged without a prescription for a steroid inhaler. In hospital 2, the patient was discharged on a steroid inhaler, filled the prescription, and elected not to use it. In hospital 3, the patient was discharged on a steroid inhaler and was provided medical assistance to fill the prescription but still could not afford the $15 copay. In all 3 scenarios, the hospital would be equally culpable under the current readmission measures, suffering financial and reputational penalties.
Yet the hospitals in these scenarios are not equally culpable. Variation in the mix of patients and bias in the measure impacted performance. Hospital 1 should clearly be held accountable for the readmission. In the cases of hospitals 2 and 3, the situations are more nuanced. More education about COPD, financial investment by the hospital to cover a copay, or a different transitional care approach may have increased the likelihood of patient compliance, but, ultimately, hospitals 2 and 3 were impacted by personal health behaviors and access to public health services and financial assistance, and the readmissions were less within their control.8
To be valid, hospital readmission measures would need to ensure that all hospitals are similar in patient characteristics and in the need for an availability of public health services. Yet these factors vary among hospitals and cannot be accounted for by models that rely exclusively on patient-level variables, such as the nature and severity of illness. As a result, the existing readmission measures are biased against certain types of hospitals. Hospitals that treat a greater proportion of patients who are socioeconomically disadvantaged; who lack access to primary care, medical assistance, or public health programs; and who have substance abuse and mental health issues will have higher readmission rates. Hospitals that care for patients who fail initial treatments and require referral for complex care will also have higher readmission rates. These types of patients are not randomly distributed throughout our healthcare system. They are clustered at rural hospitals in underserved areas, certain urban health systems, safety net hospitals, and academic health centers. It is not surprising that readmission penalties have most severely impacted large academic hospitals that care for disadvantaged populations.2 These penalties may have unintended consequences, reducing a hospital’s willingness to care for disadvantaged populations.
While these biases may unfairly harm hospitals caring for disadvantaged patients, the readmission measures may also indirectly harm patients. Low hospital readmission rates are not associated with reduced mortality and, in some instances, track with higher mortality.9-11 This may result from measurement factors (patients who die cannot be readmitted), from neighborhood socioeconomic status (SES) factors that may impact readmissions more,12 or from actual patient harm (some patients need acute care following discharge and may have worse outcomes if that care is delayed).11 Doctors have long recognized this potential risk; empiric evidence now supports them. While mortality measures may also be impacted by sociodemographic variables,13 whether to adjust for SES should be defined by the purpose of the measure. If the measure is meant to evaluate hospital quality (or utilization in the case of readmissions), adjusting for SES is appropriate because it is unrealistic to expect a health system to reduce income inequality and provide safe housing. Failure to adjust for SES, which has a large impact on outcomes, may mask a quality of care issue. Conversely, if the purpose of a measure is for a community to improve population health, then it should not be adjusted for SES because the community could adjust for income inequality.
Despite the complex ethical challenges created by the efforts to reduce readmissions, there has been virtually no public dialogue with patients, physicians, and policy makers regarding how to balance the trade-offs between reducing readmission and maintaining safety. Patients would likely value increased survival more than reduced readmissions, yet the current CMS Five-Star Rating System for hospital quality weighs readmissions equally with mortality in its hospital rankings, potentially misinforming patients. For example, many well-known academic medical centers score well (4 or 5 stars) on mortality and poorly (1 or 2 stars) on readmissions, resulting in a low or average overall score, calling into question face validity and confounding consumers struggling to make decisions about where to seek care. The Medicare Payment Advisory Commission’s Report to the Congress14 highlights the multiple significant systematic and random errors with the hospital readmission data.
Revisiting the Hospital Readmission Measures
Given significant bias in the hospital readmission measures and the ethical challenges imposed by reducing readmissions, potentially at the expense of survival, we believe CMS needs to take action to remedy the problem. First, CMS should drop hospital readmissions as a quality measure from its hospital rankings. Other hospital-rating groups and insurers should do the same. When included in payment schemes, readmissions should not be construed as a quality measure but as a utilization measure, like length of stay.
Second, the Department of Health & Human Services (HHS) should invest in maturing the hospital readmission measures to ensure construct, content, and criterion validity and reliability. No doubt the risk adjustment is complex and may be inherently limited using Medicare claims data. In the case of SES adjustment, for example, limited numbers of SES measures can be constructed from current data sources.8,13 There are other approaches to address this recommendation. For example, HHS could define a preventable readmission as one linked to some process or outcome of hospital care, such as whether the patient was discharged on an inhaler. The National Quality Forum used this approach to define a preventable venous thromboembolic event as one occurring when a patient did not receive appropriate prophylaxis. In this way, only hospital 1 in the 3 scenarios for the patient with COPD would be penalized. However, we recognize that it is not always simple to define specific process measures (eg, prescribing an inhaler) that link to readmission outcomes and that there may be other important yet hard-to-measure interventions (eg, patient and family education) that are important components of patient-centered care and readmission prevention. This is why readmissions are so challenging as a quality measure. If experts cannot define clinician behaviors that have a strong theory of change or are causally related to reduced readmissions, it is hard to call readmissions a modifiable quality measure. Another potential strategy to level the playing field would be to compare readmission rates across peer institutions only. For instance, tertiary-care safety net hospitals would be compared to one another and rural community hospitals would be compared to one another.14 Lastly, new data sources could be added to account for the social, community-level, public health, and personal health factors that heavily influence a patient’s risk for readmission, in addition to hospital-level factors. Appropriate methods will be needed to develop statistical models for risk adjustment; however, this is a complex topic and beyond the scope of the current paper.
Third, HHS could continue to use the current readmission measures as population health measures while supporting multistakeholder teams to better understand how people and their communities, public health agencies, insurers, and healthcare providers can collaborate to help patients thrive and avoid readmissions by addressing true defects in care and care coordination.
While it is understandable why policy makers chose to focus on hospital readmissions, and while we recognize that concerns about the measures were unknown when they were created, emerging evidence demonstrates that the current readmission measures (particularly when used as a quality metric) lack construct validity, contain significant bias and systematic errors, and create ethical tension by rewarding hospitals both financially and reputationally for turning away sick and socially disadvantaged patients who may, consequently, have adverse outcomes. Current readmission measures need to be reconsidered.
Acknowledgments
The authors thank Christine G. Holzmueller, BLA, with the Armstrong Institute for Patient Safety and Quality, Johns Hopkins Medicine, for her assistance in editing the manuscript and preparing it for journal submission.
Disclosure
Dr. Pronovost errs on the side of full disclosure and reports receiving grant or contract support from the Agency for Healthcare Research and Quality, the Gordon and Betty Moore Foundation (research related to patient safety and quality of care), the National Institutes of Health (acute lung injury research), and the American Medical Association Inc. (improve blood pressure control); honoraria from various healthcare organizations for speaking on patient safety and quality (the Leigh Bureau manages engagements); book royalties from the Penguin Group for his book Safe Patients, Smart Hospitals; and was receiving stock and fees to serve as a director for Cantel Medical up until 24 months ago. Dr. Pronovost is a founder of Patient Doctor Technologies, a startup company that seeks to enhance the partnership between patients and clinicians with an application called Doctella. Dr. Brotman, Dr. Hoyer, and Ms. Deutschendorf report no relevant conflicts of interest.
Hospital readmission rates are a consequential and contentious measure of hospital quality. Readmissions within 30 days of hospital discharge are part of the Centers for Medicare & Medicaid Services (CMS) Value-Based Purchasing Program and are publicly reported. Hospital-wide readmissions and condition-specific readmissions are heavily weighted by US News & World Report in its hospital rankings and in the new CMS Five-Star Quality Rating System.1 However, clinicians and researchers question the construct validity of current readmission measures.2,3
The focus on readmissions began in 2009 when Jencks et al.4 reported that 20% of Medicare patients were readmitted within 30 days after hospital discharge. Policy makers embraced readmission reduction, assuming that a hospital readmission so soon after discharge reflected poor quality of hospital care and that, with focused efforts, hospitals could reduce readmissions and save CMS money. In 2010, the Affordable Care Act introduced an initiative to reduce readmissions and, in 2012, the Hospital Readmission Reduction Program was implemented, financially penalizing hospitals with higher-than-expected readmission rates for patients hospitalized with principal diagnoses of heart failure, myocardial infarction, and pneumonia.5 Readmission measures have since proliferated and now include pay-for-performance metrics for hospitalizations for chronic obstructive pulmonary disease (COPD), coronary artery bypass grafting, and total hip or knee arthroplasty. Measures are also reported for stroke patients and for “hospital-wide readmissions,” a catch-all measure intended to capture readmission rates across most diagnoses, with various exclusions intended to prevent counting planned readmissions (eg, hospitalization for cholecystectomy following a hospitalization for cholecystitis). These measures use claims data to construct hierarchical regression models at the patient and hospital levels, assuming that variation among readmission rates are due to hospital quality effects. The goal of this approach is to level the playing field to avoid penalizing hospitals for caring for sicker patients who are at higher risk for readmission for reasons unrelated to hospital care. Yet hospital readmissions are influenced by a complex set of variables that go well beyond hospital care, some of which may be better captured by existing models than others. Below we review several potential biases in the hospital readmission measures and offer policy recommendations to improve the accuracy of these measures.
Variation in a quality measure is influenced by the quality of the underlying data, the mix of patients served, bias in the performance measure, and the degree of systemic or random error.6 Hospital readmission rates are subject to multiple sources of variation, and true differences in the quality of care are often a much smaller source of this variation. A recent analysis of patient readmissions following general surgery found that the majority were unrelated to suboptimal medical care.7 Consider 3 scenarios in which a patient with COPD is readmitted 22 days after discharge. In hospital 1, the patient was discharged without a prescription for a steroid inhaler. In hospital 2, the patient was discharged on a steroid inhaler, filled the prescription, and elected not to use it. In hospital 3, the patient was discharged on a steroid inhaler and was provided medical assistance to fill the prescription but still could not afford the $15 copay. In all 3 scenarios, the hospital would be equally culpable under the current readmission measures, suffering financial and reputational penalties.
Yet the hospitals in these scenarios are not equally culpable. Variation in the mix of patients and bias in the measure impacted performance. Hospital 1 should clearly be held accountable for the readmission. In the cases of hospitals 2 and 3, the situations are more nuanced. More education about COPD, financial investment by the hospital to cover a copay, or a different transitional care approach may have increased the likelihood of patient compliance, but, ultimately, hospitals 2 and 3 were impacted by personal health behaviors and access to public health services and financial assistance, and the readmissions were less within their control.8
To be valid, hospital readmission measures would need to ensure that all hospitals are similar in patient characteristics and in the need for an availability of public health services. Yet these factors vary among hospitals and cannot be accounted for by models that rely exclusively on patient-level variables, such as the nature and severity of illness. As a result, the existing readmission measures are biased against certain types of hospitals. Hospitals that treat a greater proportion of patients who are socioeconomically disadvantaged; who lack access to primary care, medical assistance, or public health programs; and who have substance abuse and mental health issues will have higher readmission rates. Hospitals that care for patients who fail initial treatments and require referral for complex care will also have higher readmission rates. These types of patients are not randomly distributed throughout our healthcare system. They are clustered at rural hospitals in underserved areas, certain urban health systems, safety net hospitals, and academic health centers. It is not surprising that readmission penalties have most severely impacted large academic hospitals that care for disadvantaged populations.2 These penalties may have unintended consequences, reducing a hospital’s willingness to care for disadvantaged populations.
While these biases may unfairly harm hospitals caring for disadvantaged patients, the readmission measures may also indirectly harm patients. Low hospital readmission rates are not associated with reduced mortality and, in some instances, track with higher mortality.9-11 This may result from measurement factors (patients who die cannot be readmitted), from neighborhood socioeconomic status (SES) factors that may impact readmissions more,12 or from actual patient harm (some patients need acute care following discharge and may have worse outcomes if that care is delayed).11 Doctors have long recognized this potential risk; empiric evidence now supports them. While mortality measures may also be impacted by sociodemographic variables,13 whether to adjust for SES should be defined by the purpose of the measure. If the measure is meant to evaluate hospital quality (or utilization in the case of readmissions), adjusting for SES is appropriate because it is unrealistic to expect a health system to reduce income inequality and provide safe housing. Failure to adjust for SES, which has a large impact on outcomes, may mask a quality of care issue. Conversely, if the purpose of a measure is for a community to improve population health, then it should not be adjusted for SES because the community could adjust for income inequality.
Despite the complex ethical challenges created by the efforts to reduce readmissions, there has been virtually no public dialogue with patients, physicians, and policy makers regarding how to balance the trade-offs between reducing readmission and maintaining safety. Patients would likely value increased survival more than reduced readmissions, yet the current CMS Five-Star Rating System for hospital quality weighs readmissions equally with mortality in its hospital rankings, potentially misinforming patients. For example, many well-known academic medical centers score well (4 or 5 stars) on mortality and poorly (1 or 2 stars) on readmissions, resulting in a low or average overall score, calling into question face validity and confounding consumers struggling to make decisions about where to seek care. The Medicare Payment Advisory Commission’s Report to the Congress14 highlights the multiple significant systematic and random errors with the hospital readmission data.
Revisiting the Hospital Readmission Measures
Given significant bias in the hospital readmission measures and the ethical challenges imposed by reducing readmissions, potentially at the expense of survival, we believe CMS needs to take action to remedy the problem. First, CMS should drop hospital readmissions as a quality measure from its hospital rankings. Other hospital-rating groups and insurers should do the same. When included in payment schemes, readmissions should not be construed as a quality measure but as a utilization measure, like length of stay.
Second, the Department of Health & Human Services (HHS) should invest in maturing the hospital readmission measures to ensure construct, content, and criterion validity and reliability. No doubt the risk adjustment is complex and may be inherently limited using Medicare claims data. In the case of SES adjustment, for example, limited numbers of SES measures can be constructed from current data sources.8,13 There are other approaches to address this recommendation. For example, HHS could define a preventable readmission as one linked to some process or outcome of hospital care, such as whether the patient was discharged on an inhaler. The National Quality Forum used this approach to define a preventable venous thromboembolic event as one occurring when a patient did not receive appropriate prophylaxis. In this way, only hospital 1 in the 3 scenarios for the patient with COPD would be penalized. However, we recognize that it is not always simple to define specific process measures (eg, prescribing an inhaler) that link to readmission outcomes and that there may be other important yet hard-to-measure interventions (eg, patient and family education) that are important components of patient-centered care and readmission prevention. This is why readmissions are so challenging as a quality measure. If experts cannot define clinician behaviors that have a strong theory of change or are causally related to reduced readmissions, it is hard to call readmissions a modifiable quality measure. Another potential strategy to level the playing field would be to compare readmission rates across peer institutions only. For instance, tertiary-care safety net hospitals would be compared to one another and rural community hospitals would be compared to one another.14 Lastly, new data sources could be added to account for the social, community-level, public health, and personal health factors that heavily influence a patient’s risk for readmission, in addition to hospital-level factors. Appropriate methods will be needed to develop statistical models for risk adjustment; however, this is a complex topic and beyond the scope of the current paper.
Third, HHS could continue to use the current readmission measures as population health measures while supporting multistakeholder teams to better understand how people and their communities, public health agencies, insurers, and healthcare providers can collaborate to help patients thrive and avoid readmissions by addressing true defects in care and care coordination.
While it is understandable why policy makers chose to focus on hospital readmissions, and while we recognize that concerns about the measures were unknown when they were created, emerging evidence demonstrates that the current readmission measures (particularly when used as a quality metric) lack construct validity, contain significant bias and systematic errors, and create ethical tension by rewarding hospitals both financially and reputationally for turning away sick and socially disadvantaged patients who may, consequently, have adverse outcomes. Current readmission measures need to be reconsidered.
Acknowledgments
The authors thank Christine G. Holzmueller, BLA, with the Armstrong Institute for Patient Safety and Quality, Johns Hopkins Medicine, for her assistance in editing the manuscript and preparing it for journal submission.
Disclosure
Dr. Pronovost errs on the side of full disclosure and reports receiving grant or contract support from the Agency for Healthcare Research and Quality, the Gordon and Betty Moore Foundation (research related to patient safety and quality of care), the National Institutes of Health (acute lung injury research), and the American Medical Association Inc. (improve blood pressure control); honoraria from various healthcare organizations for speaking on patient safety and quality (the Leigh Bureau manages engagements); book royalties from the Penguin Group for his book Safe Patients, Smart Hospitals; and was receiving stock and fees to serve as a director for Cantel Medical up until 24 months ago. Dr. Pronovost is a founder of Patient Doctor Technologies, a startup company that seeks to enhance the partnership between patients and clinicians with an application called Doctella. Dr. Brotman, Dr. Hoyer, and Ms. Deutschendorf report no relevant conflicts of interest.
1. Centers for Medicare & Medicaid Services. Five-star quality rating system. https://www.cms.gov/medicare/provider-enrollment-and-certification/certificationandcomplianc/fsqrs.html. Accessed October 11, 2016.
2. Joynt KE, Jha AK. Characteristics of hospitals receiving penalties under the Hospital Readmissions Reduction Program. JAMA. 2013;309(4):342-343. PubMed
3. Boozary AS, Manchin J, 3rd, Wicker RF. The Medicare Hospital Readmissions Reduction Program: time for reform. JAMA. 2015;314(4):347-348. PubMed
4. Jencks SF, Williams MV, Coleman EA. Rehospitalizations among patients in the Medicare fee-for-service program. N Engl J Med. 2009;360(14):1418-1428. PubMed
5. Centers for Medicare & Medicaid Services. Readmissions Reduction Program (HRRP). https://www.cms.gov/medicare/medicare-fee-for-service-payment/acuteinpatientpps/readmissions-reduction-program.html. Accessed April 12, 2017.
6. Parker C, Schwamm LH, Fonarow GC, Smith EE, Reeves MJ. Stroke quality metrics: systematic reviews of the relationships to patient-centered outcomes and impact of public reporting. Stroke. 2012;43(1):155-162. PubMed
7. McIntyre LK, Arbabi S, Robinson EF, Maier RV. Analysis of risk factors for patient readmission 30 days following discharge from general surgery. JAMA Surg. 2016;151(9):855-861. PubMed
8. Sheingold SH, Zuckerman R, Shartzer A. Understanding Medicare hospital readmission rates and differing penalties between safety-net and other hospitals. Health Aff (Millwood). 2016;35(1):124-131. PubMed
9. Brotman DJ, Hoyer EH, Leung C, Lepley D, Deutschendorf A. Associations between hospital-wide readmission rates and mortality measures at the hospital level: are hospital-wide readmissions a measure of quality? J Hosp Med. 2016;11(9):650-651. PubMed
10. Krumholz HM, Lin Z, Keenan PS, et al. Relationship between hospital readmission and mortality rates for patients hospitalized with acute myocardial infarction, heart failure, or pneumonia. JAMA. 2013;309(6):587-593. PubMed
11. Fan VS, Gaziano JM, Lew R, et al. A comprehensive care management program to prevent chronic obstructive pulmonary disease hospitalizations: a randomized, controlled trial. Ann Intern Med. 2012;156(10):673-683. PubMed
12. Bikdeli B, Wayda B, Bao H, et al. Place of residence and outcomes of patients with heart failure: analysis from the Telemonitoring to Improve Heart Failure Outcomes Trial. Circ Cardiovasc Qual Outcomes. 2014;7(5):749-756. PubMed
13. Bernheim SM, Parzynski CS, Horwitz L, et al. Accounting for patients’ socioeconomic status does not change hospital readmission rates. Health Aff (Millwood). 2016;35(8):1461-1470. PubMed
14. Medicare Payment Advisory Commission. Refining the Hospital Readmissions Reduction Program. In: Report to the Congress: Medicare and the Health Care Delivery System, Chapter 4. June 2013. PubMed
1. Centers for Medicare & Medicaid Services. Five-star quality rating system. https://www.cms.gov/medicare/provider-enrollment-and-certification/certificationandcomplianc/fsqrs.html. Accessed October 11, 2016.
2. Joynt KE, Jha AK. Characteristics of hospitals receiving penalties under the Hospital Readmissions Reduction Program. JAMA. 2013;309(4):342-343. PubMed
3. Boozary AS, Manchin J, 3rd, Wicker RF. The Medicare Hospital Readmissions Reduction Program: time for reform. JAMA. 2015;314(4):347-348. PubMed
4. Jencks SF, Williams MV, Coleman EA. Rehospitalizations among patients in the Medicare fee-for-service program. N Engl J Med. 2009;360(14):1418-1428. PubMed
5. Centers for Medicare & Medicaid Services. Readmissions Reduction Program (HRRP). https://www.cms.gov/medicare/medicare-fee-for-service-payment/acuteinpatientpps/readmissions-reduction-program.html. Accessed April 12, 2017.
6. Parker C, Schwamm LH, Fonarow GC, Smith EE, Reeves MJ. Stroke quality metrics: systematic reviews of the relationships to patient-centered outcomes and impact of public reporting. Stroke. 2012;43(1):155-162. PubMed
7. McIntyre LK, Arbabi S, Robinson EF, Maier RV. Analysis of risk factors for patient readmission 30 days following discharge from general surgery. JAMA Surg. 2016;151(9):855-861. PubMed
8. Sheingold SH, Zuckerman R, Shartzer A. Understanding Medicare hospital readmission rates and differing penalties between safety-net and other hospitals. Health Aff (Millwood). 2016;35(1):124-131. PubMed
9. Brotman DJ, Hoyer EH, Leung C, Lepley D, Deutschendorf A. Associations between hospital-wide readmission rates and mortality measures at the hospital level: are hospital-wide readmissions a measure of quality? J Hosp Med. 2016;11(9):650-651. PubMed
10. Krumholz HM, Lin Z, Keenan PS, et al. Relationship between hospital readmission and mortality rates for patients hospitalized with acute myocardial infarction, heart failure, or pneumonia. JAMA. 2013;309(6):587-593. PubMed
11. Fan VS, Gaziano JM, Lew R, et al. A comprehensive care management program to prevent chronic obstructive pulmonary disease hospitalizations: a randomized, controlled trial. Ann Intern Med. 2012;156(10):673-683. PubMed
12. Bikdeli B, Wayda B, Bao H, et al. Place of residence and outcomes of patients with heart failure: analysis from the Telemonitoring to Improve Heart Failure Outcomes Trial. Circ Cardiovasc Qual Outcomes. 2014;7(5):749-756. PubMed
13. Bernheim SM, Parzynski CS, Horwitz L, et al. Accounting for patients’ socioeconomic status does not change hospital readmission rates. Health Aff (Millwood). 2016;35(8):1461-1470. PubMed
14. Medicare Payment Advisory Commission. Refining the Hospital Readmissions Reduction Program. In: Report to the Congress: Medicare and the Health Care Delivery System, Chapter 4. June 2013. PubMed
© 2017 Society of Hospital Medicine