User login
Impact of Displaying Inpatient Pharmaceutical Costs at the Time of Order Entry: Lessons From a Tertiary Care Center
Secondary to rising healthcare costs in the United States, broad efforts are underway to identify and reduce waste in the health system.1,2 A recent systematic review exhibited that many physicians inaccurately estimate the cost of medications.3 Raising awareness of medication costs among prescribers is one potential way to promote high-value care.
Some evidence suggests that cost transparency may help prescribers understand how medication orders drive costs. In a previous study carried out at the Johns Hopkins Hospital, fee data were displayed to providers for diagnostic laboratory tests.4 An 8.6% decrease (95% confidence interval [CI], –8.99% to –8.19%) in test ordering was observed when costs were displayed vs a 5.6% increase (95% CI, 4.90% to 6.39%) in ordering when costs were not displayed during a 6-month intervention period (P < 0.001). Conversely, a similar study that investigated the impact of cost transparency on inpatient imaging utilization did not demonstrate a significant influence of cost display.5 This suggests that cost transparency may work in some areas of care but not in others. A systematic review that investigated price-display interventions for imaging, laboratory studies, and medications reported 10 studies that demonstrated a statistically significant decrease in expenditures without an effect on patient safety.6
Informing prescribers of institution-specific medication costs within and between drug classes may enable the selection of less expensive, therapeutically equivalent drugs. Prior studies investigating the effect of medication cost display were conducted in a variety of patient care settings, including ambulatory clinics,7 urgent care centers,8 and operating rooms,9,10 with some yielding positive results in terms of ordering and cost11,12 and others having no impact.13,14 Currently, there is little evidence specifically addressing the effect of cost display for medications in the inpatient setting.
As part of an institutional initiative to control pharmaceutical expenditures, informational messaging for several high-cost drugs was initiated at our tertiary care hospital in April 2015. The goal of our study was to assess the effect of these medication cost messages on ordering practices. We hypothesized that the display of inpatient pharmaceutical costs at the time of order entry would result in a reduction in ordering.
METHODS
Setting, Intervention, and Participants
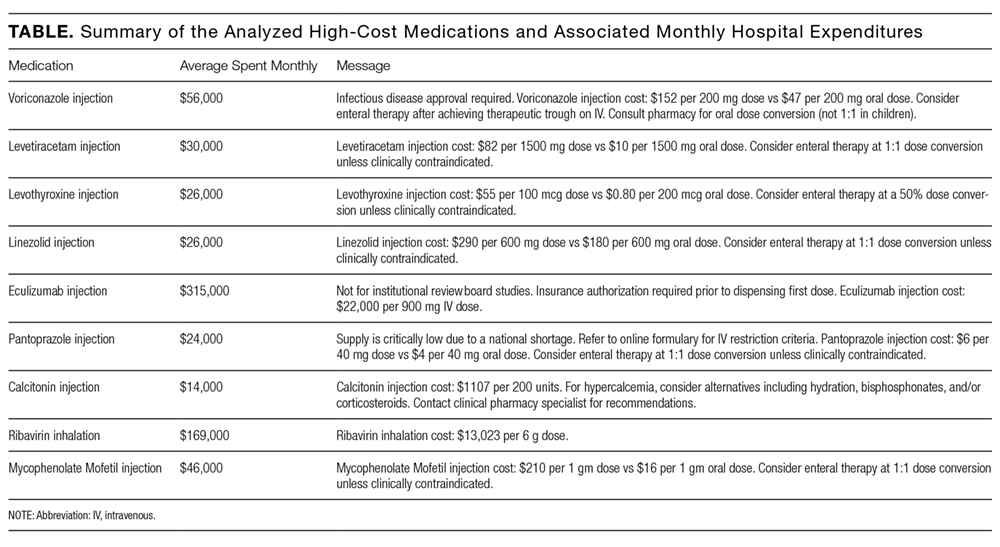
As part of an effort to educate prescribers about the high cost of medications, 9 intravenous (IV) medications were selected by the Johns Hopkins Hospital Pharmacy and Therapeutics Committee as targets for drug cost messaging. The intention of the committee was to implement a rapid, low-cost, proof-of-concept, quality-improvement project that was not designed as prospective research. Representatives from the pharmacy and clinicians from relevant clinical areas participated in preimplementation discussions to help identify medications that were subjectively felt to be overused at our institution and potentially modifiable through provider education. The criteria for selecting drug targets included a variety of factors, such as medications infrequently ordered but representing a significant cost per dose (eg, eculizumab and ribavirin), frequently ordered medications with less expensive substitutes (eg, linezolid and voriconazole), and high-cost medications without direct therapeutic alternatives (eg, calcitonin). From April 10, 2015, to October 5, 2015, the computerized Provider Order Entry System (cPOE), Sunrise Clinical Manager (Allscripts Corporation, Chicago, IL), displayed the cost for targeted medications. Seven of the medication alerts also included a reasonable therapeutic alternative and its cost. There were no restrictions placed on ordering; prescribers were able to choose the high-cost medications at their discretion.
Despite the fact that this initiative was not designed as a research project, we felt it was important to formally evaluate the impact of the drug cost messaging effort to inform future quality-improvement interventions. Each medication was compared to its preintervention baseline utilization dating back to January 1, 2013. For the 7 medications with alternatives offered, we also analyzed use of the suggested alternative during these time periods.
Data Sources and Measurement
Our study utilized data obtained from the pharmacy order verification system and the cPOE database. Data were collected over a period of 143 weeks from January 1, 2013, to October 5, 2015, to allow for a baseline period (January 1, 2013, to April 9, 2015) and an intervention period (April 10, 2015, to October 5, 2015). Data elements extracted included drug characteristics (dosage form, route, cost, strength, name, and quantity), patient characteristics (race, gender, and age), clinical setting (facility location, inpatient or outpatient), and billing information (provider name, doses dispensed from pharmacy, order number, revenue or procedure code, record number, date of service, and unique billing number) for each admission. Using these elements, we generated the following 8 variables to use in our analyses: week, month, period identifier, drug name, dosage form, weekly orders, weekly patient days, and number of weekly orders per 10,000 patient days. Average wholesale price (AWP), referred to as medication cost in this manuscript, was used to report all drug costs in all associated cost calculations. While the actual cost of acquisition and price charged to the patient may vary based on several factors, including manufacturer and payer, we chose to use AWP as a generalizable estimate of the cost of acquisition of the drug for the hospital.
Variables
“Week” and “month” were defined as the week and month of our study, respectively. The “period identifier” was a binary variable that identified the time period before and after the intervention. “Weekly orders” was defined as the total number of new orders placed per week for each specified drug included in our study. For example, if a patient received 2 discrete, new orders for a medication in a given week, 2 orders would be counted toward the “weekly orders” variable. “Patient days,” defined as the total number of patients treated at our facility, was summated for each week of our study to yield “weekly patient days.” To derive the “number of weekly orders per 10,000 patient days,” we divided weekly orders by weekly patient days and multiplied the resultant figure by 10,000.
Statistical Analysis

Segmented regression, a form of interrupted time series analysis, is a quasi-experimental design that was used to determine the immediate and sustained effects of the drug cost messages on the rate of medication ordering.15-17 The model enabled the use of comparison groups (alternative medications, as described above) to enhance internal validity.
In time series data, outcomes may not be independent over time. Autocorrelation of the error terms can arise when outcomes are more similar at time points closer together than outcomes at time points further apart. Failure to account for autocorrelation of the error terms may lead to underestimated standard errors. The presence of autocorrelation, assessed by calculating the Durbin-Watson statistic, was significant among our data. To adjust for this, we employed a Prais-Winsten estimation to adjust the error term (εt) calculated in our models.
Two segmented linear regression models were used to estimate trends in ordering before and after the intervention. The presence or absence of a comparator drug determined which model was to be used. When only single medications were under study, as in the case of eculizumab and calcitonin, our regression model was as follows:
Yt = (β0) + (β1)(Timet) + (β2)(Interventiont) + (β3)(Post-Intervention Timet) + (εt)
In our single-drug model, Yt denoted the number of orders per 10,000 patient days at week “t”; Timet was a continuous variable that indicated the number of weeks prior to or after the study intervention (April 10, 2015) and ranged from –116 to 27 weeks. Post-Intervention Timet was a continuous variable that denoted the number of weeks since the start of the intervention and is coded as zero for all time periods prior to the intervention. β0 was the estimated baseline number of orders per 10,000 patient days at the beginning of the study. β1 is the trend of orders per 10,000 patient days per week during the preintervention period; β2 represents an estimate of the change in the number of orders per 10,000 patient days immediately after the intervention; β3 denotes the difference between preintervention and postintervention slopes; and εt is the “error term,” which represents autocorrelation and random variability of the data.
As mentioned previously, alternative dosage forms of 7 medications included in our study were utilized as comparison groups. In these instances (when multiple drugs were included in our analyses), the following regression model was applied:
Y t = ( β 0 ) + ( β 1 )(Time t ) + ( β 2 )(Intervention t ) + ( β 3 )(Post-Intervention Time t ) + ( β 4 )(Cohort) + ( β 5 )(Cohort)(Time t ) + ( β 6 )(Cohort)(Intervention t ) + ( β 7 )(Cohort)(Post-Intervention Time t ) + ( ε t )
Here, 3 coefficients were added (β4-β7) to describe an additional cohort of orders. Cohort, a binary indicator variable, held a value of either 0 or 1 when the model was used to describe the treatment or comparison group, respectively. The coefficients β4-β7 described the treatment group, and β0-β3 described the comparison group. β4 was the difference in the number of baseline orders per 10,000 patient days between treatment and comparison groups; Β5 represented the difference between the estimated ordering trends of treatment and comparison groups; and Β6 indicated the difference in immediate changes in the number of orders per 10,000 patient days in the 2 groups following the intervention.
The number of orders per week was recorded for each medicine, which enabled a large number of data points to be included in our analyses. This allowed for more accurate and stable estimates to be made in our regression model. A total of 143 data points were collected for each study group, 116 before and 27 following each intervention.
All analyses were conducted by using STATA version 13.1 (StataCorp LP, College Station, TX).
RESULTS

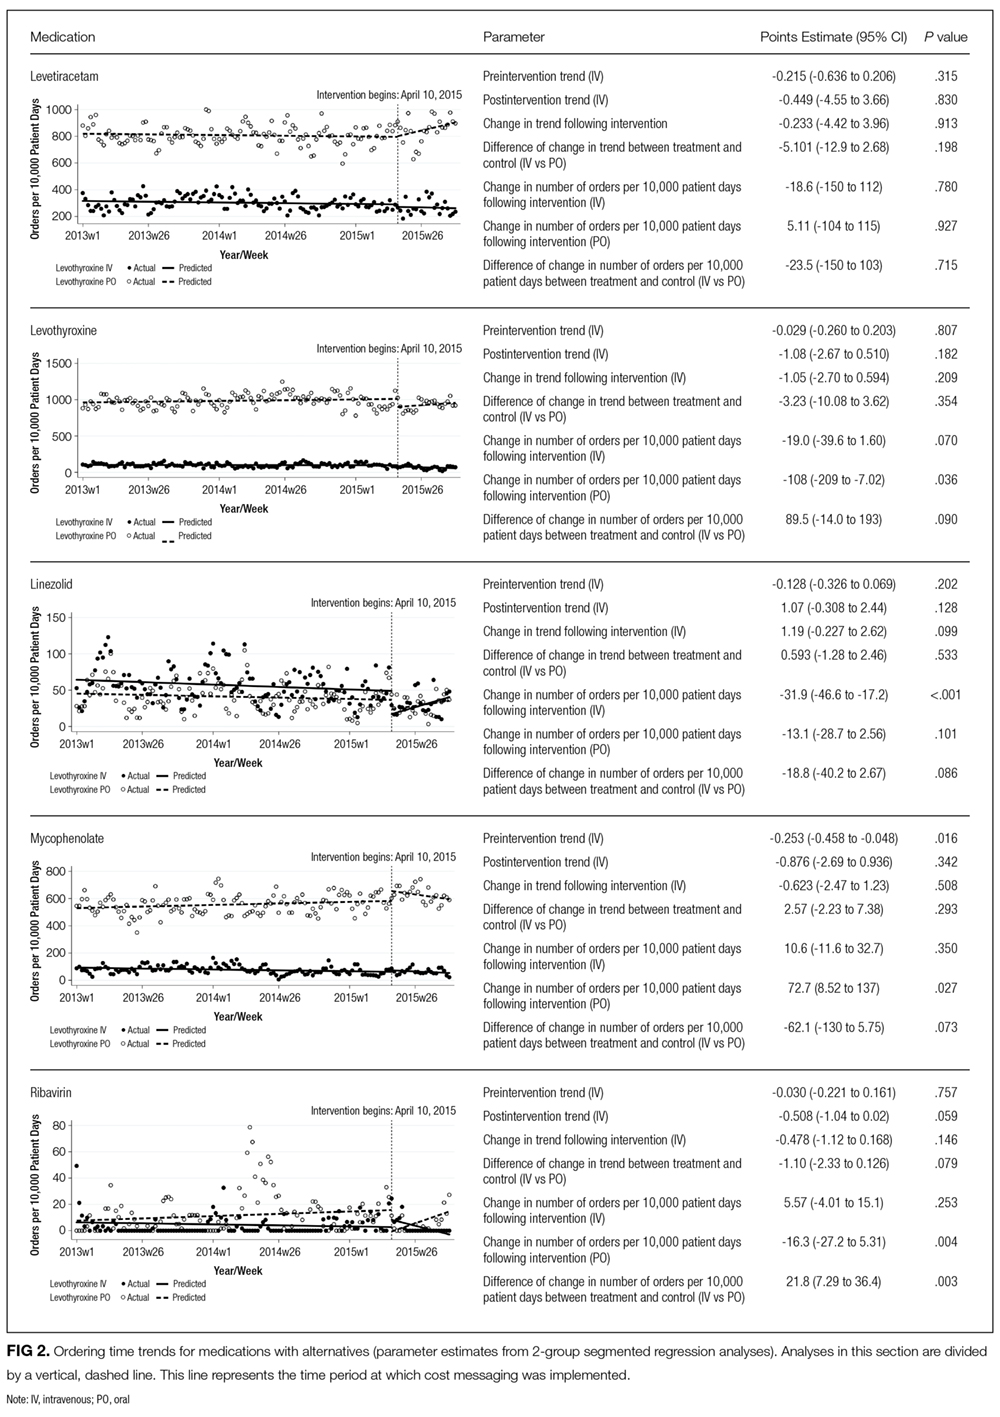
Initial results pertaining to 9 IV medications were examined (Table). Following the implementation of cost messaging, no significant changes were observed in order frequency or trend for IV formulations of eculizumab, calcitonin, levetiracetam, linezolid, mycophenolate, ribavirin, voriconazole, and levothyroxine (Figures 1 and 2). However, a significant decrease in the number of oral ribavirin orders (Figure 2), the control group for the IV form, was observed (–16.3 orders per 10,000 patient days; P = .004; 95% CI, –27.2 to –5.31).
DISCUSSION
Our results suggest that the passive strategy of displaying cost alone was not effective in altering prescriber ordering patterns for the selected medications. This may be due to a lack of awareness regarding direct financial impact on the patient, importance of costs in medical decision-making, or a perceived lack of alternatives or suitability of recommended alternatives. These results may prove valuable to hospital and pharmacy leadership as they develop strategies to curb medication expense.
Changes observed in IV pantoprazole ordering are instructive. Due to a national shortage, the IV form of this medication underwent a restriction, which required approval by the pharmacy prior to dispensing. This restriction was instituted independently of our study and led to a 73% decrease from usage rates prior to policy implementation (Figure 3). Ordering was restricted according to defined criteria for IV use. The restriction did not apply to oral pantoprazole, and no significant change in ordering of the oral formulation was noted during the evaluated period (Figure 3).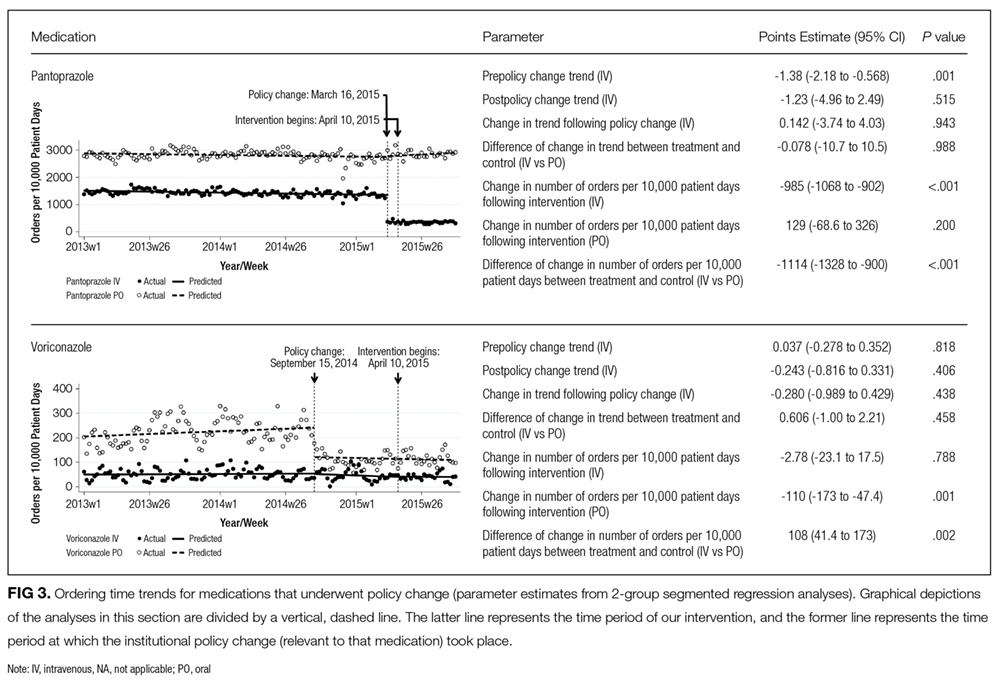
The dramatic effect of policy changes, as observed with pantoprazole and voriconazole, suggests that a more active strategy may have a greater impact on prescriber behavior when it comes to medication ordering in the inpatient setting. It also highlights several potential sources of confounding that may introduce bias to cost-transparency studies.
This study has multiple limitations. First, as with all observational study designs, causation cannot be drawn with certainty from our results. While we were able to compare medications to their preintervention baselines, the data could have been impacted by longitudinal or seasonal trends in medication ordering, which may have been impacted by seasonal variability in disease prevalence, changes in resistance patterns, and annual cycling of house staff in an academic medical center. While there appear to be potential seasonal patterns regarding prescribing patterns for some of the medications included in this analysis, we also believe the linear regressions capture the overall trends in prescribing adequately. Nonstationarity, or trends in the mean and variance of the outcome that are not related to the intervention, may introduce bias in the interpretation of our findings. However, we believe the parameters included in our models, namely the immediate change in the intercept following the intervention and the change in the trend of the rate of prescribing over time from pre- to postintervention, provide substantial protections from faulty interpretation. Our models are limited to the extent that these parameters do not account for nonstationarity. Additionally, we did not collect data on dosing frequency or duration of treatment, which would have been dependent on factors that are not readily quantified, such as indication, clinical rationale, or patient response. Thus, we were not able to evaluate the impact of the intervention on these factors.
Although intended to enhance internal validity, comparison groups were also subject to external influence. For example, we observed a significant, short-lived rise in oral ribavirin (a control medication) ordering during the preintervention baseline period that appeared to be independent of our intervention and may speak to the unaccounted-for longitudinal variability detailed above.
Finally, the clinical indication and setting may be important. Previous studies performed at the same hospital with price displays showed a reduction in laboratory ordering but no change in imaging.18,19 One might speculate that ordering fewer laboratory tests is viewed by providers as eliminating waste rather than choosing a less expensive option to accomplish the same diagnostic task at hand. Therapeutics may be more similar to radiology tests, because patients presumably need the treatment and often do not have the option of simply not ordering without a concerted effort to reevaluate the treatment plan. Additionally, in a tertiary care teaching center such as ours, a junior clinician, oftentimes at the behest of a more senior colleague, enters most orders. In an environment in which the ordering prescriber has more autonomy or when the order is driven by a junior practitioner rather than an attending (such as daily laboratories), results may be different. Additionally, institutions that incentivize prescribers directly to practice cost-conscious care may experience different results from similar interventions.
We conclude that, in the case of medication cost messaging, a strategy of displaying cost information alone was insufficient to affect prescriber ordering behavior. Coupling cost transparency with educational interventions and active stewardship to impact clinical practice is worthy of further study.
Disclosures: The authors state that there were no external sponsors for this work. The Johns Hopkins Hospital and University “funded” this work by paying the salaries of the authors. The author team maintained independence and made all decisions regarding the study design, data collection, data analysis, interpretation of results, writing of the research report, and decision to submit it for publication. Dr. Shermock had full access to all the study data and takes responsibility for the integrity of the data and accuracy of the data analysis.
1. Berwick DM, Hackbarth AD. Eliminating Waste in US Health Care. JAMA. 2012;307(14):1513-1516. PubMed
2. PricewaterhouseCoopers’ Health Research Institute. The Price of Excess: Identifying Waste in Healthcare Spending. http://www.pwc.com/us/en/healthcare/publications/the-price-of-excess.html. Accessed June 17, 2015.
3. Allan GM, Lexchin J, Wiebe N. Physician awareness of drug cost: a systematic review. PLoS Med. 2007;4(9):e283. PubMed
4. Feldman LS, Shihab HM, Thiemann D, et al. Impact of providing fee data on laboratory test ordering: a controlled clinical trial. JAMA Intern Med. 2013;173(10):903-908. PubMed
5. Durand DJ, Feldman LS, Lewin JS, Brotman DJ. Provider cost transparency alone has no impact on inpatient imaging utilization. J Am Coll Radiol. 2013;10(2):108-113. PubMed
6. Silvestri MT, Bongiovanni TR, Glover JG, Gross CP. Impact of price display on provider ordering: A systematic review. J Hosp Med. 2016;11(1):65-76. PubMed
7. Ornstein SM, MacFarlane LL, Jenkins RG, Pan Q, Wager KA. Medication cost information in a computer-based patient record system. Impact on prescribing in a family medicine clinical practice. Arch Fam Med. 1999;8(2):118-121. PubMed
8. Guterman JJ, Chernof BA, Mares B, Gross-Schulman SG, Gan PG, Thomas D. Modifying provider behavior: A low-tech approach to pharmaceutical ordering. J Gen Intern Med. 2002;17(10):792-796. PubMed
9. McNitt JD, Bode ET, Nelson RE. Long-term pharmaceutical cost reduction using a data management system. Anesth Analg. 1998;87(4):837-842. PubMed
10. Horrow JC, Rosenberg H. Price stickers do not alter drug usage. Can J Anaesth. 1994;41(11):1047-1052. PubMed
11. Guterman JJ, Chernof BA, Mares B, Gross-Schulman SG, Gan PG, Thomas D. Modifying provider behavior: A low-tech approach to pharmaceutical ordering. J Gen Intern Med. 2002;17(10):792-796. PubMed
12. McNitt JD, Bode ET, Nelson RE. Long-term pharmaceutical cost reduction using a data management system. Anesth Analg. 1998;87(4):837-842. PubMed
13. Ornstein SM, MacFarlane LL, Jenkins RG, Pan Q, Wager KA. Medication cost information in a computer-based patient record system. Impact on prescribing in a family medicine clinical practice. Arch Fam Med. 1999;8(2):118-121. PubMed
14. Horrow JC, Rosenberg H. Price stickers do not alter drug usage. Can J Anaesth. 1994;41(11):1047-1052. PubMed
15. Jandoc R, Burden AM, Mamdani M, Levesque LE, Cadarette SM. Interrupted time series analysis in drug utilization research is increasing: Systematic review and recommendations. J Clin Epidemiol. 2015;68(8):950-56. PubMed
16. Linden A. Conducting interrupted time-series analysis for single- and multiple-group comparisons. Stata J. 2015;15(2):480-500.
17. Linden A, Adams JL. Applying a propensity score-based weighting model to interrupted time series data: improving causal inference in programme evaluation. J Eval Clin Pract. 2011;17(6):1231-1238. PubMed
18. Feldman LS, Shihab HM, Thiemann D, et al. Impact of providing fee data on laboratory test ordering: a controlled clinical trial. JAMA Intern Med. 2013;173(10):903-908. PubMed
19. Durand DJ, Feldman LS, Lewin JS, Brotman DJ. Provider cost transparency alone has no impact on inpatient imaging utilization. J Am Coll Radiol. 2013;10(2):108-113. PubMed
Secondary to rising healthcare costs in the United States, broad efforts are underway to identify and reduce waste in the health system.1,2 A recent systematic review exhibited that many physicians inaccurately estimate the cost of medications.3 Raising awareness of medication costs among prescribers is one potential way to promote high-value care.
Some evidence suggests that cost transparency may help prescribers understand how medication orders drive costs. In a previous study carried out at the Johns Hopkins Hospital, fee data were displayed to providers for diagnostic laboratory tests.4 An 8.6% decrease (95% confidence interval [CI], –8.99% to –8.19%) in test ordering was observed when costs were displayed vs a 5.6% increase (95% CI, 4.90% to 6.39%) in ordering when costs were not displayed during a 6-month intervention period (P < 0.001). Conversely, a similar study that investigated the impact of cost transparency on inpatient imaging utilization did not demonstrate a significant influence of cost display.5 This suggests that cost transparency may work in some areas of care but not in others. A systematic review that investigated price-display interventions for imaging, laboratory studies, and medications reported 10 studies that demonstrated a statistically significant decrease in expenditures without an effect on patient safety.6
Informing prescribers of institution-specific medication costs within and between drug classes may enable the selection of less expensive, therapeutically equivalent drugs. Prior studies investigating the effect of medication cost display were conducted in a variety of patient care settings, including ambulatory clinics,7 urgent care centers,8 and operating rooms,9,10 with some yielding positive results in terms of ordering and cost11,12 and others having no impact.13,14 Currently, there is little evidence specifically addressing the effect of cost display for medications in the inpatient setting.
As part of an institutional initiative to control pharmaceutical expenditures, informational messaging for several high-cost drugs was initiated at our tertiary care hospital in April 2015. The goal of our study was to assess the effect of these medication cost messages on ordering practices. We hypothesized that the display of inpatient pharmaceutical costs at the time of order entry would result in a reduction in ordering.
METHODS
Setting, Intervention, and Participants
As part of an effort to educate prescribers about the high cost of medications, 9 intravenous (IV) medications were selected by the Johns Hopkins Hospital Pharmacy and Therapeutics Committee as targets for drug cost messaging. The intention of the committee was to implement a rapid, low-cost, proof-of-concept, quality-improvement project that was not designed as prospective research. Representatives from the pharmacy and clinicians from relevant clinical areas participated in preimplementation discussions to help identify medications that were subjectively felt to be overused at our institution and potentially modifiable through provider education. The criteria for selecting drug targets included a variety of factors, such as medications infrequently ordered but representing a significant cost per dose (eg, eculizumab and ribavirin), frequently ordered medications with less expensive substitutes (eg, linezolid and voriconazole), and high-cost medications without direct therapeutic alternatives (eg, calcitonin). From April 10, 2015, to October 5, 2015, the computerized Provider Order Entry System (cPOE), Sunrise Clinical Manager (Allscripts Corporation, Chicago, IL), displayed the cost for targeted medications. Seven of the medication alerts also included a reasonable therapeutic alternative and its cost. There were no restrictions placed on ordering; prescribers were able to choose the high-cost medications at their discretion.
Despite the fact that this initiative was not designed as a research project, we felt it was important to formally evaluate the impact of the drug cost messaging effort to inform future quality-improvement interventions. Each medication was compared to its preintervention baseline utilization dating back to January 1, 2013. For the 7 medications with alternatives offered, we also analyzed use of the suggested alternative during these time periods.
Data Sources and Measurement
Our study utilized data obtained from the pharmacy order verification system and the cPOE database. Data were collected over a period of 143 weeks from January 1, 2013, to October 5, 2015, to allow for a baseline period (January 1, 2013, to April 9, 2015) and an intervention period (April 10, 2015, to October 5, 2015). Data elements extracted included drug characteristics (dosage form, route, cost, strength, name, and quantity), patient characteristics (race, gender, and age), clinical setting (facility location, inpatient or outpatient), and billing information (provider name, doses dispensed from pharmacy, order number, revenue or procedure code, record number, date of service, and unique billing number) for each admission. Using these elements, we generated the following 8 variables to use in our analyses: week, month, period identifier, drug name, dosage form, weekly orders, weekly patient days, and number of weekly orders per 10,000 patient days. Average wholesale price (AWP), referred to as medication cost in this manuscript, was used to report all drug costs in all associated cost calculations. While the actual cost of acquisition and price charged to the patient may vary based on several factors, including manufacturer and payer, we chose to use AWP as a generalizable estimate of the cost of acquisition of the drug for the hospital.
Variables
“Week” and “month” were defined as the week and month of our study, respectively. The “period identifier” was a binary variable that identified the time period before and after the intervention. “Weekly orders” was defined as the total number of new orders placed per week for each specified drug included in our study. For example, if a patient received 2 discrete, new orders for a medication in a given week, 2 orders would be counted toward the “weekly orders” variable. “Patient days,” defined as the total number of patients treated at our facility, was summated for each week of our study to yield “weekly patient days.” To derive the “number of weekly orders per 10,000 patient days,” we divided weekly orders by weekly patient days and multiplied the resultant figure by 10,000.
Statistical Analysis
Segmented regression, a form of interrupted time series analysis, is a quasi-experimental design that was used to determine the immediate and sustained effects of the drug cost messages on the rate of medication ordering.15-17 The model enabled the use of comparison groups (alternative medications, as described above) to enhance internal validity.
In time series data, outcomes may not be independent over time. Autocorrelation of the error terms can arise when outcomes are more similar at time points closer together than outcomes at time points further apart. Failure to account for autocorrelation of the error terms may lead to underestimated standard errors. The presence of autocorrelation, assessed by calculating the Durbin-Watson statistic, was significant among our data. To adjust for this, we employed a Prais-Winsten estimation to adjust the error term (εt) calculated in our models.
Two segmented linear regression models were used to estimate trends in ordering before and after the intervention. The presence or absence of a comparator drug determined which model was to be used. When only single medications were under study, as in the case of eculizumab and calcitonin, our regression model was as follows:
Yt = (β0) + (β1)(Timet) + (β2)(Interventiont) + (β3)(Post-Intervention Timet) + (εt)
In our single-drug model, Yt denoted the number of orders per 10,000 patient days at week “t”; Timet was a continuous variable that indicated the number of weeks prior to or after the study intervention (April 10, 2015) and ranged from –116 to 27 weeks. Post-Intervention Timet was a continuous variable that denoted the number of weeks since the start of the intervention and is coded as zero for all time periods prior to the intervention. β0 was the estimated baseline number of orders per 10,000 patient days at the beginning of the study. β1 is the trend of orders per 10,000 patient days per week during the preintervention period; β2 represents an estimate of the change in the number of orders per 10,000 patient days immediately after the intervention; β3 denotes the difference between preintervention and postintervention slopes; and εt is the “error term,” which represents autocorrelation and random variability of the data.
As mentioned previously, alternative dosage forms of 7 medications included in our study were utilized as comparison groups. In these instances (when multiple drugs were included in our analyses), the following regression model was applied:
Y t = ( β 0 ) + ( β 1 )(Time t ) + ( β 2 )(Intervention t ) + ( β 3 )(Post-Intervention Time t ) + ( β 4 )(Cohort) + ( β 5 )(Cohort)(Time t ) + ( β 6 )(Cohort)(Intervention t ) + ( β 7 )(Cohort)(Post-Intervention Time t ) + ( ε t )
Here, 3 coefficients were added (β4-β7) to describe an additional cohort of orders. Cohort, a binary indicator variable, held a value of either 0 or 1 when the model was used to describe the treatment or comparison group, respectively. The coefficients β4-β7 described the treatment group, and β0-β3 described the comparison group. β4 was the difference in the number of baseline orders per 10,000 patient days between treatment and comparison groups; Β5 represented the difference between the estimated ordering trends of treatment and comparison groups; and Β6 indicated the difference in immediate changes in the number of orders per 10,000 patient days in the 2 groups following the intervention.
The number of orders per week was recorded for each medicine, which enabled a large number of data points to be included in our analyses. This allowed for more accurate and stable estimates to be made in our regression model. A total of 143 data points were collected for each study group, 116 before and 27 following each intervention.
All analyses were conducted by using STATA version 13.1 (StataCorp LP, College Station, TX).
RESULTS
Initial results pertaining to 9 IV medications were examined (Table). Following the implementation of cost messaging, no significant changes were observed in order frequency or trend for IV formulations of eculizumab, calcitonin, levetiracetam, linezolid, mycophenolate, ribavirin, voriconazole, and levothyroxine (Figures 1 and 2). However, a significant decrease in the number of oral ribavirin orders (Figure 2), the control group for the IV form, was observed (–16.3 orders per 10,000 patient days; P = .004; 95% CI, –27.2 to –5.31).
DISCUSSION
Our results suggest that the passive strategy of displaying cost alone was not effective in altering prescriber ordering patterns for the selected medications. This may be due to a lack of awareness regarding direct financial impact on the patient, importance of costs in medical decision-making, or a perceived lack of alternatives or suitability of recommended alternatives. These results may prove valuable to hospital and pharmacy leadership as they develop strategies to curb medication expense.
Changes observed in IV pantoprazole ordering are instructive. Due to a national shortage, the IV form of this medication underwent a restriction, which required approval by the pharmacy prior to dispensing. This restriction was instituted independently of our study and led to a 73% decrease from usage rates prior to policy implementation (Figure 3). Ordering was restricted according to defined criteria for IV use. The restriction did not apply to oral pantoprazole, and no significant change in ordering of the oral formulation was noted during the evaluated period (Figure 3).
The dramatic effect of policy changes, as observed with pantoprazole and voriconazole, suggests that a more active strategy may have a greater impact on prescriber behavior when it comes to medication ordering in the inpatient setting. It also highlights several potential sources of confounding that may introduce bias to cost-transparency studies.
This study has multiple limitations. First, as with all observational study designs, causation cannot be drawn with certainty from our results. While we were able to compare medications to their preintervention baselines, the data could have been impacted by longitudinal or seasonal trends in medication ordering, which may have been impacted by seasonal variability in disease prevalence, changes in resistance patterns, and annual cycling of house staff in an academic medical center. While there appear to be potential seasonal patterns regarding prescribing patterns for some of the medications included in this analysis, we also believe the linear regressions capture the overall trends in prescribing adequately. Nonstationarity, or trends in the mean and variance of the outcome that are not related to the intervention, may introduce bias in the interpretation of our findings. However, we believe the parameters included in our models, namely the immediate change in the intercept following the intervention and the change in the trend of the rate of prescribing over time from pre- to postintervention, provide substantial protections from faulty interpretation. Our models are limited to the extent that these parameters do not account for nonstationarity. Additionally, we did not collect data on dosing frequency or duration of treatment, which would have been dependent on factors that are not readily quantified, such as indication, clinical rationale, or patient response. Thus, we were not able to evaluate the impact of the intervention on these factors.
Although intended to enhance internal validity, comparison groups were also subject to external influence. For example, we observed a significant, short-lived rise in oral ribavirin (a control medication) ordering during the preintervention baseline period that appeared to be independent of our intervention and may speak to the unaccounted-for longitudinal variability detailed above.
Finally, the clinical indication and setting may be important. Previous studies performed at the same hospital with price displays showed a reduction in laboratory ordering but no change in imaging.18,19 One might speculate that ordering fewer laboratory tests is viewed by providers as eliminating waste rather than choosing a less expensive option to accomplish the same diagnostic task at hand. Therapeutics may be more similar to radiology tests, because patients presumably need the treatment and often do not have the option of simply not ordering without a concerted effort to reevaluate the treatment plan. Additionally, in a tertiary care teaching center such as ours, a junior clinician, oftentimes at the behest of a more senior colleague, enters most orders. In an environment in which the ordering prescriber has more autonomy or when the order is driven by a junior practitioner rather than an attending (such as daily laboratories), results may be different. Additionally, institutions that incentivize prescribers directly to practice cost-conscious care may experience different results from similar interventions.
We conclude that, in the case of medication cost messaging, a strategy of displaying cost information alone was insufficient to affect prescriber ordering behavior. Coupling cost transparency with educational interventions and active stewardship to impact clinical practice is worthy of further study.
Disclosures: The authors state that there were no external sponsors for this work. The Johns Hopkins Hospital and University “funded” this work by paying the salaries of the authors. The author team maintained independence and made all decisions regarding the study design, data collection, data analysis, interpretation of results, writing of the research report, and decision to submit it for publication. Dr. Shermock had full access to all the study data and takes responsibility for the integrity of the data and accuracy of the data analysis.
1. Berwick DM, Hackbarth AD. Eliminating Waste in US Health Care. JAMA. 2012;307(14):1513-1516. PubMed
2. PricewaterhouseCoopers’ Health Research Institute. The Price of Excess: Identifying Waste in Healthcare Spending. http://www.pwc.com/us/en/healthcare/publications/the-price-of-excess.html. Accessed June 17, 2015.
3. Allan GM, Lexchin J, Wiebe N. Physician awareness of drug cost: a systematic review. PLoS Med. 2007;4(9):e283. PubMed
4. Feldman LS, Shihab HM, Thiemann D, et al. Impact of providing fee data on laboratory test ordering: a controlled clinical trial. JAMA Intern Med. 2013;173(10):903-908. PubMed
5. Durand DJ, Feldman LS, Lewin JS, Brotman DJ. Provider cost transparency alone has no impact on inpatient imaging utilization. J Am Coll Radiol. 2013;10(2):108-113. PubMed
6. Silvestri MT, Bongiovanni TR, Glover JG, Gross CP. Impact of price display on provider ordering: A systematic review. J Hosp Med. 2016;11(1):65-76. PubMed
7. Ornstein SM, MacFarlane LL, Jenkins RG, Pan Q, Wager KA. Medication cost information in a computer-based patient record system. Impact on prescribing in a family medicine clinical practice. Arch Fam Med. 1999;8(2):118-121. PubMed
8. Guterman JJ, Chernof BA, Mares B, Gross-Schulman SG, Gan PG, Thomas D. Modifying provider behavior: A low-tech approach to pharmaceutical ordering. J Gen Intern Med. 2002;17(10):792-796. PubMed
9. McNitt JD, Bode ET, Nelson RE. Long-term pharmaceutical cost reduction using a data management system. Anesth Analg. 1998;87(4):837-842. PubMed
10. Horrow JC, Rosenberg H. Price stickers do not alter drug usage. Can J Anaesth. 1994;41(11):1047-1052. PubMed
11. Guterman JJ, Chernof BA, Mares B, Gross-Schulman SG, Gan PG, Thomas D. Modifying provider behavior: A low-tech approach to pharmaceutical ordering. J Gen Intern Med. 2002;17(10):792-796. PubMed
12. McNitt JD, Bode ET, Nelson RE. Long-term pharmaceutical cost reduction using a data management system. Anesth Analg. 1998;87(4):837-842. PubMed
13. Ornstein SM, MacFarlane LL, Jenkins RG, Pan Q, Wager KA. Medication cost information in a computer-based patient record system. Impact on prescribing in a family medicine clinical practice. Arch Fam Med. 1999;8(2):118-121. PubMed
14. Horrow JC, Rosenberg H. Price stickers do not alter drug usage. Can J Anaesth. 1994;41(11):1047-1052. PubMed
15. Jandoc R, Burden AM, Mamdani M, Levesque LE, Cadarette SM. Interrupted time series analysis in drug utilization research is increasing: Systematic review and recommendations. J Clin Epidemiol. 2015;68(8):950-56. PubMed
16. Linden A. Conducting interrupted time-series analysis for single- and multiple-group comparisons. Stata J. 2015;15(2):480-500.
17. Linden A, Adams JL. Applying a propensity score-based weighting model to interrupted time series data: improving causal inference in programme evaluation. J Eval Clin Pract. 2011;17(6):1231-1238. PubMed
18. Feldman LS, Shihab HM, Thiemann D, et al. Impact of providing fee data on laboratory test ordering: a controlled clinical trial. JAMA Intern Med. 2013;173(10):903-908. PubMed
19. Durand DJ, Feldman LS, Lewin JS, Brotman DJ. Provider cost transparency alone has no impact on inpatient imaging utilization. J Am Coll Radiol. 2013;10(2):108-113. PubMed
© 2017 Society of Hospital Medicine
This Month in CHEST: Editor’s picks

Giants in Chest Medicine:
Steven E. Weinberger, MD, FCCP
By Dr. J. Mandel
Editorial
Precision Medicine Urgency: The Case of Inhaled Corticosteroids in COPD By Drs. S. Suissa and P. Ernst
Original Research
Physician Assessment of Pretest Probability of Malignancy and Adherence With Guidelines for Pulmonary Nodule Evaluation By Dr. N. T. Tanner, et al.
The Long-Term Effect of Bacille Calmette-Guérin Vaccination on Tuberculin Skin Testing: A 55-Year Follow-Up Study By Dr. J. D. Mancuso, et al.
Clinical Characteristics of Pertussis-Associated Cough in Adults and Children: A Diagnostic Systematic Review and Meta-Analysis By Dr. A. Moore, et al.

CHEST Membership News
Introducing CHEST Participation Points
Everyday, you commit your time to helping patients. We recognize your dedication not only to your profession but to the CHEST community.
We’re happy to introduce CHEST Participation Points, designed to increase member recognition and reward you for participating and contributing to our diverse community. Wherever you are in your career, you can earn points for the things you do within the CHEST community.
Once you receive 50, 100, or 150 points, you can redeem your points for CHEST-branded apparel or discounts on courses and products.
Point accrual started on July 5, so you’ve already been earning points. If you are an FCCP, you began with 30 points awarded for becoming FCCP—that’s only 20 points away from the first tier of prizes. To accrue or redeem points, you must be an active member and current with your dues.
Log in to your CHEST account, and access Participation Points in the left column to see your points.
Start earning more points today! Learn more at chestnet.org/participationpoints.
CHEST ® journal — new online home
We are excited to share that the journal CHEST® has a new website with improved navigation, better search capabilities, alert sign-ups, and more multimedia elements. We are asking members to take a few minutes to activate their new account.
In order to maintain continuous access to the online journal, members will have to register for a free account and claim their subscription. If you go to chestjournal.org, CHEST members can then complete a 1- to 2-minute registration process.
CHEST members should have received an email with step-by-step instructions. Still have questions or need help? Contact Online Journal Support at 800/654-2452 (US and Canada) or +44 (0) 1865-843177 (Europe).
New Tools in Campaign to Fight Asthma
The Allergy & Asthma NetWork, the nation’s leading patient education and advocacy organization for people with allergy and asthma, has once again joined forces with the CHEST Foundation in an effort to empower patients suffering from severe asthma.
The campaign’s focus is to educate health-care providers, patients, parents of asthmatics, and the public about the most current treatment options for asthma, highlight the importance of referring to specialists to improve patient outcomes, and bring to light the role of the entire health-care team in the care of a patient with severe or difficult-to-control asthma.
Severity Assessment Tool
Available online and in print, the severity assessment tool was designed to help a patient, and the clinician, understand the severity of their asthma. Not only does the tool evaluate the severity of their condition, but it also helps the patient become more aware of their symptoms. The seven-question assessment includes questions on usage of quick-relief or rescue inhalers, visits to the ED/hospital, physical activity, controller medication, and quality of sleep.
Patient and Caregiver Testimonials
The campaign features several patient and caregiver testimonials that tell the stories of patients and parents of children with severe asthma.
“What we want people to understand, is that at the time of Ben’s passing, he was on a preventive med. He was going to the doctor routinely. We had actually just been to the asthma doctor. We were seeing somebody, had an action plan, and everybody knew what they had to do. Even with all of that, it still came to this. Benjamin still lost his life, and we never knew this was something that could happen,” stated Cristin Buckley, mother of Benjamin Buckley who was 7 years old at the time of his death. These testimonial videos will be used to raise awareness of the condition, and the importance of managing and monitoring symptoms.
Shared Decision Making Tool

Thank You to Our Supporters
The CHEST Foundation and Allergy and Asthma Network would like to thank our generous supporters, AstraZeneca, Boehringer Ingelheim, GlaxoSmithKline, and Novartis for making this campaign possible. It is through supporters, who are active participants in helping grow this campaign, that these important materials are able to have an impact on patient outcomes and create long-lasting social change.
To view the campaign materials, visit us at asthma.chestnet.org.
The Allergy & Asthma NetWork, the nation’s leading patient education and advocacy organization for people with allergy and asthma, has once again joined forces with the CHEST Foundation in an effort to empower patients suffering from severe asthma.
The campaign’s focus is to educate health-care providers, patients, parents of asthmatics, and the public about the most current treatment options for asthma, highlight the importance of referring to specialists to improve patient outcomes, and bring to light the role of the entire health-care team in the care of a patient with severe or difficult-to-control asthma.
Severity Assessment Tool
Available online and in print, the severity assessment tool was designed to help a patient, and the clinician, understand the severity of their asthma. Not only does the tool evaluate the severity of their condition, but it also helps the patient become more aware of their symptoms. The seven-question assessment includes questions on usage of quick-relief or rescue inhalers, visits to the ED/hospital, physical activity, controller medication, and quality of sleep.
Patient and Caregiver Testimonials
The campaign features several patient and caregiver testimonials that tell the stories of patients and parents of children with severe asthma.
“What we want people to understand, is that at the time of Ben’s passing, he was on a preventive med. He was going to the doctor routinely. We had actually just been to the asthma doctor. We were seeing somebody, had an action plan, and everybody knew what they had to do. Even with all of that, it still came to this. Benjamin still lost his life, and we never knew this was something that could happen,” stated Cristin Buckley, mother of Benjamin Buckley who was 7 years old at the time of his death. These testimonial videos will be used to raise awareness of the condition, and the importance of managing and monitoring symptoms.
Shared Decision Making Tool
Thank You to Our Supporters
The CHEST Foundation and Allergy and Asthma Network would like to thank our generous supporters, AstraZeneca, Boehringer Ingelheim, GlaxoSmithKline, and Novartis for making this campaign possible. It is through supporters, who are active participants in helping grow this campaign, that these important materials are able to have an impact on patient outcomes and create long-lasting social change.
To view the campaign materials, visit us at asthma.chestnet.org.
CHEST Joint Congress in Basel, Switzerland
Members of CHEST leadership, faculty, and staff traveled to Basel, Switzerland, in June, to participate in the CHEST Joint Congress, which was co-hosted with the Swiss Respiratory Society, Schweizersche Gesellschaft Fur Pneumologie (SPG). Overall, there were approximately 1,100 total attendees, representing over 40 countries, who enjoyed the scientific program and gained valuable chest medicine knowledge.

The CHEST Joint Congress in Basel represented the second collaborative scientific conference endeavor with a third party, the first being the CHEST Conference held in Amsterdam May 6-9, COPD: Current Excellence and Future Development.
Members of CHEST leadership, faculty, and staff traveled to Basel, Switzerland, in June, to participate in the CHEST Joint Congress, which was co-hosted with the Swiss Respiratory Society, Schweizersche Gesellschaft Fur Pneumologie (SPG). Overall, there were approximately 1,100 total attendees, representing over 40 countries, who enjoyed the scientific program and gained valuable chest medicine knowledge.
The CHEST Joint Congress in Basel represented the second collaborative scientific conference endeavor with a third party, the first being the CHEST Conference held in Amsterdam May 6-9, COPD: Current Excellence and Future Development.
PHM17 session summary: Demonstrating teaching excellence with an educator’s portfolio
NASHVILLE, TENN. – Development of a medical educator’s portfolio is a necessary, but daunting, task for clinician educators when they enter the promotion process, according to an expert panel at Pediatric Hospital Medicine 2017, sponsored by the Society of Hospital Medicine, the American Academy of Pediatrics, and the Academic Pediatric Association.
Session
Promote yourself: Demonstrating teaching excellence with an educator’s portfolio
Presenters
Michael Ryan, MD, MEHP; Ashlie Tseng, MD; Jocelyn Schiller, MD; Rebecca Tenney-Soeiro, MD, MEd; Michele Long, MD; Corki Lehmann, MD, MEd; Amy Fleming, MD; and H. Barrett Fromme, MD, MHPE
Session summary
Development of an educator’s portfolio is a necessary, but daunting, task for clinician educators when they enter the promotion process. Each institution has its own specific requirements for the educator’s portfolio, but there are several general themes that should be considered for inclusion:
1. Develop an educational philosophy. This is a personal statement that frames the rest of the portfolio and describes how this philosophy is used by the educator in his/her approach to education.
2. Teaching. Include teaching activities that are both formal (i.e. lectures) and sessions that encourage more active participation (i.e. small group discussions). This can be accomplished by generating a teaching activities report, which helps to categorize these activities. This will not only demonstrate the volume of teaching experience, but also help to demonstrate the diversity of an educator’s teaching activities. In this section, an educator also should include teaching awards received.
3. Learner evaluations. A qualitative summary of comments will provide a narrative of the educator’s teaching skills. This section also may include summaries of annual reviews of teaching.
4. Curriculum development. Demonstrate the educator’s active engagement in the development of a novel curriculum or the improvement of a pre-existing curriculum and the successful outcomes of those improvements.
5. Mentoring and advising. Generating a list of advisees and highlighting their accomplishments reflects on the ability of the educator to guide and promote success in his/her learners.
6. Educational leadership and administration. This is a description of the past and present leadership roles that the educator has held, including courses or clerkships directed. This should allow the educator the opportunity to provide a narrative description of his/her involvement beyond what is typically stated on the curriculum vitae.
7. Professional development. The educator should develop a list of activities, including formal degree programs, certificate programs, and educational workshops, in which he/she has participated as a learner and have enhanced his/her skills as an educator.
8. Products of educational scholarship. Generate a list of education-related peer-reviewed publications authored, other educational products (such as a syllabus or curriculum) developed, and educational workshops that the educator was invited to give.
For clinician educators interested in developing an educator’s portfolio, there are several resources available, including the Academic Pediatric Association’s website and several MedEdPORTAL publications.
Key takeaways for Pediatric HM
• While each institution has its own specific requirements, there are general themes to consider including in an educator’s portfolio.
• Resources such as the Academic Pediatric Association’s website can help guide an educator in the development of his/her portfolio.
Dr. Player is a pediatric hospitalist at Children’s Hospital of Wisconsin and assistant professor at the Medical College of Wisconsin, Milwaukee.
At PHM 2017
Study aims to validate AAD criteria for diagnosing AD and create usable form
CHICAGO – A streamlined set of diagnostic criteria from the American Academy of Dermatology’s most recent consensus criteria for diagnosing atopic dermatitis (AD) produced a specificity of more than 95%, and was also highly sensitive, a prospective analysis found.
“Atopic dermatitis typically presents in childhood and is associated with a worsened quality of life, with severe itch and lack of sleep, and substantial health care costs due to therapeutic management and increased hospitalizations,” study author Jeremy Udkoff said at the World Congress of Pediatric Dermatology. “We also know that in order to treat the disease and to learn more about it, we have to have a good tool for diagnosing it. When it comes to clinical studies and research, we require a systematic and refined set of criteria.”
The next set of commonly used criteria to appear were created by the U.K. working party, for which researchers used logistic regression to systematically create a minimum set of effective criteria for AD (Br J Dermatol. 1994;131[3]:383-96). For these guidelines, meeting a diagnosis of AD requires an itchy skin condition, followed by three or more of the following: a history of flexural involvement; a personal history of asthma or hay fever; a history of general dry skin in the last year; visible flexural eczema, and onset under the age of 2 years. “A subsequent validation trial found [the U.K. working party criteria] to have a low sensitivity, which as you can imagine, could be a very large problem,” he said (Arch Dermatol. 1999;135[5]:514-6).
In 2001, the AAD consensus conference created revised hierarchical criteria known as the AAD consensus criteria (J Am Acad Dermatol. 2003;49[6]:1088-95). “These were initially created for more of a gestalt-type picture of AD in the clinic, but because it flows so well, it’s currently being used in about one-third of clinical trials,” Mr. Udkoff said. “However, [the AAD criteria] have not been validated, so we didn’t know its sensitivity or specificity. In addition, we didn’t have a ‘checkbox’ form that tells us how many of each of the criteria are required to make the diagnosis. We didn’t know how many ‘essential,’ ‘important,’ or ‘associated’ features we need to make this diagnosis.”
For the current study, he and his associates set out to determine how many “essential,” “important,” and “associated” criteria are necessary to make the AAD consensus criteria work. They also set out to create a usable checkbox form, validate the criteria, and compare it to the Hanifin-Rajka (HR) and U.K. criteria. To accomplish this, they created a questionnaire comprised of HR, U.K., and AAD criteria, examined the criteria on 60 subjects with and without AD, and compared the diagnostic features of each of those criteria against a gold standard dermatology diagnosis from one of seven pediatric dermatologists. Next, they ranked all 56 possible AAD criterion combinations based on their overall sensitivity and specificity, and chose the most predictive combination. “Once we had the optimal set of criteria, we validated it on a new cohort to determine its sensitivity and specificity, and compared it with the classic HR and U.K. criteria,” Mr. Udkoff explained.
Overall, the researchers evaluated findings from 100 subjects: 58 with AD, and 42 controls. Those with AD were about 3 years younger, compared with controls (a mean age of 5 years vs. about 8 years, respectively). About 40% of patients were Hispanic and about 30% were white. Mr. Udkoff and his associates confirmed the hierarchical structure of the AAD criteria and found that individual “essential” AAD criteria of pruritus, typical AD pattern, and chronic/relapsing course each had a sensitivity that exceeded 96%. This was followed by the “important” criteria of early age of onset, atopy, and xerosis, which had a sensitivity that ranged between 88% and 95%, while the associated criteria had a sensitivity that ranged between 50% and 85%.
Next, the researchers systematically tested all combinations of the AAD criteria and found that three “essential” AAD criteria, two or more of the “important” criteria, and one or more of the “associated” criteria were optimal in diagnosing AD. Mr. Udkoff noted that the findings can be translated into a simple “3-2-1 rule” that “is both practical and pragmatic,” he said. Using this rule, sensitivity was 91.4% and specificity was 95.2%.
Currently, the researchers are working to validate this criteria in different subgroups of patients. To date, they have found that children younger than 1.5 years get one bonus “essential” criteria for being an infant, so for that population a 2-2-1 rule would apply.
Mr. Udkoff reported that the research was supported by a training grant from the National Institutes of Health. He reported having no financial disclosures.
AT WCPD 2017
Key clinical point:
Major finding: The “important” AD criteria of early age of onset, atopy, and xerosis had a sensitivity that ranged between 88% and 95%.
Data source: An analysis of optimal AAD criteria for AD that included 58 patients with AD and 42 controls.
Disclosures: Mr. Udkoff reported that the research was supported by a training grant from the National Institutes of Health. He reported having no financial disclosures.
ATO enables anthracycline reduction in pediatric APL

Consolidation therapy that includes arsenic trioxide (ATO) can decrease anthracycline dosing by about 40% in children and young adults with acute promyelocytic leukemia (APL), according to new research.
And it can accomplish this without compromising survival in standard-risk patients.
Outcomes for high-risk patients compared favorably to other pediatric APL trials, the research indicated.
Investigators compared ATO consolidation in the AAML0631 trial to the historic control trial AIDA0493 and reported the results in the Journal of Clinical Oncology.
The AAML0631 phase 3 trial, conducted by the Children’s Oncology Group, compared newly diagnosed pediatric APL patients receiving ATO consolidation to the benchmark of event-free survival (EFS) in standard-risk (SR) patients established by the AIDA0493 trial.
AIDA0493 enrolled patients between January 1993 and June 2000. The protocol involved treatment with all-trans retinoic acid (ATRA), anthracyclines, and high-dose cytarabine. The trial resulted in overall survival (OS) of approximately 90%.
AAML0631
AAML063 investigators defined SR as a white blood cell count (WBC) at presentation less than 10,000 cells/μL. They defined high risk (HR) as a WBC count of 10,000 cells/μL or more.
AAML0631 patients had to be at least 2 years old and younger than 22, and their de novo APL had to be confirmed by PML-RARα polymerase chain reaction.
The patients could have had no prior leukemia treatment, except for steroids, hydroxyurea, or leukapheresis.
AAML0631 did not exclude patients based on organ function or performance status. AIDA0493, however, excluded patients with performance status of 4 or liver function tests greater than 3 times the upper limit of normal.
Patients were excluded from AAML0631 if they had preexisting prolonged QT syndrome because of the risk of QT interval prolongation with ATO.
AAML0631 treatment protocol
All patients received ATRA during induction, each consolidation course, and maintenance.
Induction therapy consisted of ATRA and idarubicin.
All patients received 2 cycles of ATO during the first consolidation. SR patients received an additional 2 consolidation courses, and HR patients received 3 consolidation courses that included high-dose cytarabine and anthracycline.
Maintenance therapy consisted of ATRA, oral methotrexate, and 6-mercaptopurine for 2 years.
Patients also received prophylactic treatment with intrathecal cytarabine.
Patient demographics
Investigators enrolled 108 patients between March 2009 and November 2012, of which 101 (66 SR and 35 HR) were evaluable.
Patients were a median age of 15.04 years (range, 2.01 – 21.34), 56% were female, 80% were white, 10% black, 2% Native American, 3% Asian, and 5% unknown.
Three quarters of the patients had an ECOG score of 0 or 1, median WBC counts of 3.8 x 1000 cells/uL (range, 0.4 – 173.8), and median platelet counts of 21.5 x 1000/uL (range, 3 – 198).
Almost two-thirds of patients (63%) had the classic translocation (15;17), and 37% had an additional 1 or more cytogenetic abnormalities.
The SR patients in AAML0631 had similar characteristics to the patients in AIDA0493 except for the distribution of performance status scores and differences in racial/ethnic diversity.
Efficacy
After a median follow-up of 3.73 years (range, 0.003 – 5.97), the 3-year overall survival (OS) was 94% ± 5% and the 3-year EFS was 91% ± 6%.
For SR patients, the OS was 98% ± 3% and the EFS 95% ± 5%.
For HR patients, the OS was 86% ± 12% and the EFS was 83% ± 13%.
SR patients had a 2-year EFS of 97%. This compared with 91% for patients in the AIDA0493 trial, which means that therapy with ATO was not inferior to therapy in the historic comparator trial (P=0.93).
And these results were achieved with a cumulative anthracycline dosing of idarubicin at 51 mg/m2 (SR) and 61 mg/m2 (HR) and mitoxantrone at 20 mg/m2.
This compared with the AIDA0493 cumulative anthracycline dosing of 80 mg/m2 of idarubicin and 50 mg/m2 of mitoxantrone.
The cumulative daunorubicin equivalent in the AAML0631 trial was 335 mg/m2 (SR) and 385 mg/m2 (HR) compared with 600 mg/m2 in the AIDA 0493 trial.
Toxicity
The percentage of patients with adverse events varied according to treatment cycle and was highest during induction and high-dose cytarabine-containing courses.
The most common adverse events were fever/neutropenia and infection.
Differentiation syndrome occurred in 20% of patients during induction, 31% in HR patients and 13% in SR patients. ATRA was held for 15 of these patients during induction. It was subsequently re-started at a lower dose and increased to the full dose.
QTc interval prolongation of grade 1 or 2 occurred in 16% (n=15) and 12% (n=11) during the ATO cycles.
One patient experienced grade 3 QTc interval prolongation during ATO consolidation. There were no grade 4 or 5 events for this toxicity.
One event of grade 1 ventricular arrhythmia and 1 event of grade 1 left ventricular systolic dysfunction occurred during ATO consolidation.
Two off-therapy cardiac events have been reported: a grade 1 QTc interval prolongation and a grade 2 ventricular arrhythmia.
No cardiac deaths have occurred, and liver toxicity was minimal during ATO cycles.
The investigators believe the favorable results of this study provide a new benchmark for outcomes in pediatric APL.
The Children’s Oncology Group is currently accruing pediatric APL patients to further investigate similar treatment approaches. ![]()
Incontinentia Pigmenti: Do You Know the Signs?
IN THIS ARTICLE
- Presenting stages
- Diagnostic criteria
- Management of IP
A 21-year-old woman with type 1 diabetes is admitted for recurrent diabetic ketoacidosis. Physical exam reveals hypopigmented, linear, streaky patches on the medial aspects of the bilateral lower legs (Figure 1A). The patient denies tenderness, pruritus, or paresthesia. There is obvious symmetrical hair loss on the lateral aspects of the eyebrows, as well as slightly wooly male-pattern hair distribution with patchy alopecia on the vertex of the head (Figure 1B). She has very poor dentition with hypodontia and malformed teeth (Figure 1C). Her fingernails and toenails appear normal, with no visible atrophy (Figure 1D). What explains her condition?
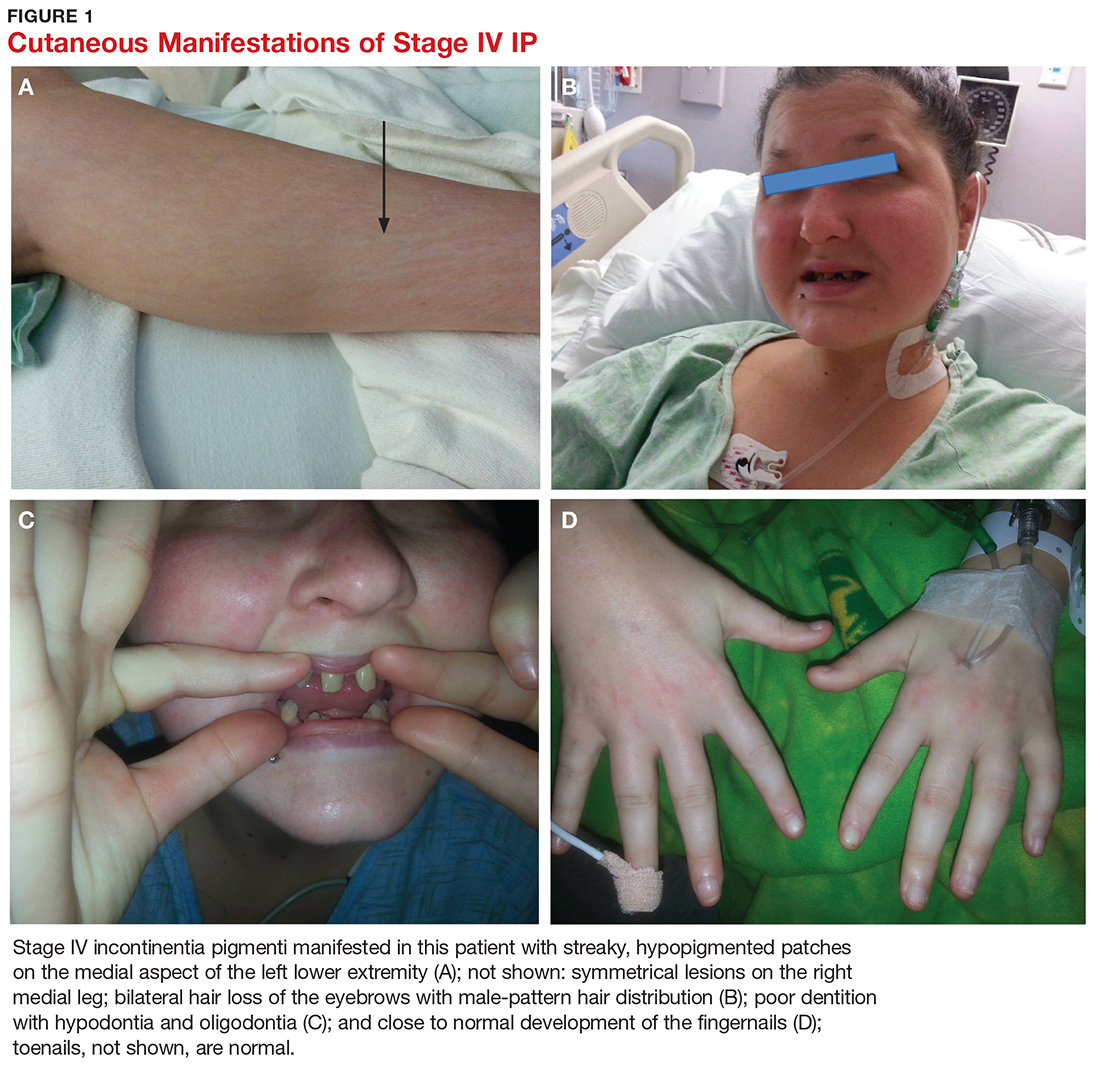
Incontinentia pigmenti (IP), also known as Bloch-Sulzberger syndrome, is a rare, X-linked dominant genodermatosis involving the cutaneous, ophthalmic, neurologic, and dental systems.1-3 It results from X-inactivation due to mutations in the NF-kappaB essential modulator (NEMO) gene with deletion of exons 4-10 in most cases. The NEMO gene encodes a regulatory component of the IkappaB kinase complex required to activate the NF-kappa B pathway, which is important for many immune, inflammatory, and apoptotic processes.4-6 This deletional mutation is typically lethal in normal 46,XY male karyotypes. Male fetuses with this mutation usually die in utero, making the reported cases predominantly female.4,7
The estimated incidence of IP is between 1/10,000 and 1/100,000.4 Due to the rarity of the condition, IP may be underrecognized and underdiagnosed.
CLINICAL PRESENTATION
Characteristic skin lesions of IP begin to develop at birth or in utero, in an evolving pattern that consists of four stages:
- The vesicular stage (stage I) is characterized by linear erythematous papules and blisters that manifest in newborns.
- The verrucous stage (stage II) begins as the blisters start to heal—usually after several weeks—and is distinguished by hyperkeratotic warty papules in linear or swirling distribution. This stage resolves on its own within months.
- The hyperpigmentation stage (stage III) is when swirling macules or patches develop. This hallmark stage of IP tends to remain static until adolescence.
- The hypopigmentation stage (stage IV) manifests with faded streaky patches, which may be subtly atrophic. This final stage usually develops in the second or third decade of life.2,3
All these cutaneous lesions follow Blaschko lines—invisible lines believed to result from embryonic cell migration that become visible with the manifestation of cutaneous or mucous lesions.6
Other associated cutaneous findings include patchy alopecia, nail dystrophy, and oral/dental anomalies such as hypodontia, oligodontia, and tooth deformities. In addition, ophthalmologic involvement can result in strabismus, cataracts, and retinal vascular changes that can lead to blindness. Central nervous system manifestations include seizures, cognitive impairment, and spastic paralysis.3
DIFFERENTIAL DIAGNOSIS
Because IP is uncommon, it may be easily overlooked or misdiagnosed as another, similar cutaneous manifestation. Cutaneous sarcoidosis, for example, is a skin lesion of noncaseating granuloma. It can present as patches, papules, ulcers, scars, ichthyosis, and alopecia. The development of cutaneous sarcoidosis can be idiopathic or iatrogenic, particularly in patients using anti-TNF therapy. The diagnosis is made clinically and can be confirmed pathologically.8
Stage I IP can also be confused with neonatal herpes simplex virus-1 (HSV-1) infection, given the similarities in vesicular morphology and linear distribution. The diagnosis of HSV-1 can be made based on history, physical exam, and pathology. Given the serious sequelae of neonatal HSV-1 infection, antiviral therapy should not be delayed until confirmation of the diagnosis in infants with vesicular eruptions.9
Erythema multiforme (EM) is another dermatologic condition frequently encountered in children and young adults. Its characteristic round target lesion usually has two rings surrounding the dusky-appearing central zone. Atypical lesions can be bullous or crusty, mimicking the appearance of stage I or II IP. EM is usually a self-limiting condition, but specific treatment may be required if the infectious agent is identified.10
Vitiligo, the development of white patches due to the loss of melanocytes, is another item in the differential. Although it most commonly involves the skin, the hair may also be affected. The diagnosis is made clinically and can be confirmed with skin biopsy if needed.11
DIAGNOSIS
Diagnostic criteria for IP have been proposed, with family history playing a role (see Table).2,3,12 Results of a case-study series indicate that 28% of patients with IP have a family history involving at least one first-degree female relative. IP was considered “sporadic” in 62% of cases studied.3
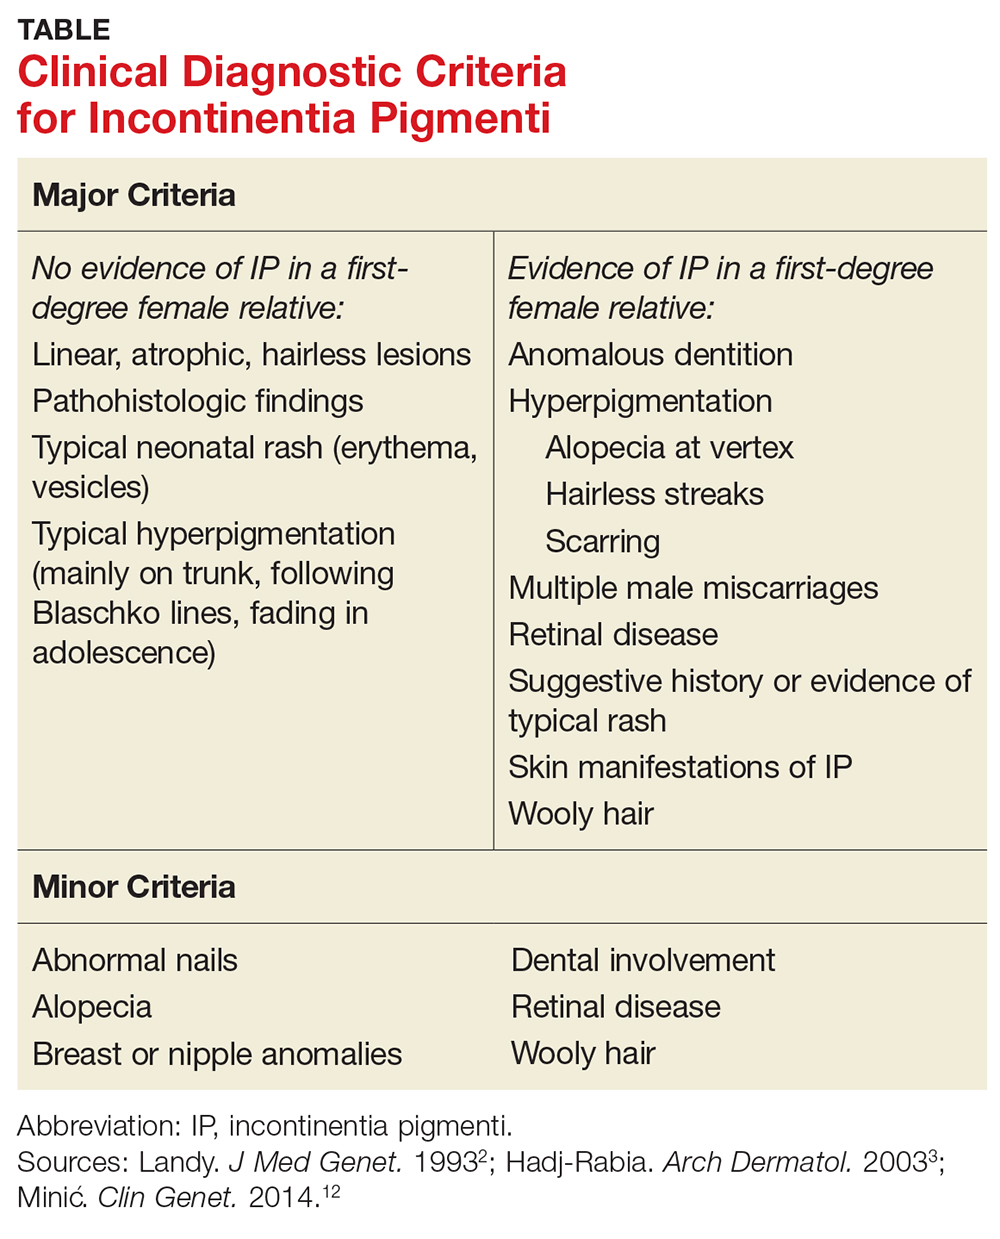
Without a family history of IP, at least one major criterion must be present to support the diagnosis. These include
- Neonatal rash (erythema, vesicles)
- Linear, atrophic, hairless lesions
- Hyperpigmentation (mainly on trunk, following Blaschko lines)
In a patient with a family history of IP, the presence of any major criterion strongly supports the diagnosis. These, as well as minor criteria, are outlined in the Table.2,3,12
In stages I and II of IP, pathologic features include spongiotic dermatitis with characteristic eosinophils and large dyskeratotic cells.3,13 In stage IV, skin biopsies may reveal slight atrophy and scattered apoptotic cells in the epidermis and epidermal hypopigmentation due to reduced melanocytes. The dermis typically appears thickened and is absent hair follicles and sweat glands.14 In a 2014 update, these pathologic features were proposed to be included in the major diagnostic criteria.12
TREATMENT/MANAGEMENT
Treatment of IP is centered on the involved organ systems. For cutaneous lesions, treatment is not usually necessary unless inflammation persists. In such cases, topical steroids or tacrolimus have been used with some success.15,16 In the vesicular stage, the patient should be monitored for bacterial infection, with appropriate prevention or treatment as necessary.
With other involved systems—such as dental, ophthalmologic, or neurologic (eg, seizures or other encephalopathy) anomalies—consultation and follow-up with the relevant specialist is warranted.
In this case, the patient denied family history of IP. She did have a history of infantile cataract and seizure. Her presenting signs were typical of stage IV IP: hypopigmented streaky patches on the skin of the lower legs, dental abnormalities, somewhat wooly hair, alopecia on the head, and loss of hair on the lateral aspects of the eyebrows. The uniqueness of this case is that the patient also had type 1 diabetes, a condition with a strong genetic predisposition. However, there is no evidence supporting an association between IP and either type of diabetes.
CONCLUSION
Although rare, when IP does occur, its manifestations are vast and severe enough to significantly reduce quality of life for patients; when it occurs in males, it is usually lethal. This genetic disorder can affect multiple body systems, making knowledge of its symptoms essential for proper diagnosis. Because its characteristic stages may be present at birth or in infancy, early identification and diagnosis of IP can help guide treatment intervention.
1. Roberts AP. Incontinentia pigmenti (Bloch-Sulzberger). Br Med. J. 1958;1(5079):1106-1107.
2. Landy SJ, Donnai D. Incontinentia pigmenti (Bloch-Sulzberger syndrome). J Med Genet. 1993;30(1):53-59.
3. Hadj-Rabia S, Froidevaux N, Bodak D, et al. Clinical study of 40 cases of incontinentia pigmenti. Arch Dermatol. 2003; 139(9):1163-1170.
4. Smahi A, Courtois G, Vabres P, et al. Genomic rearrangement in NEMO impairs NF-kappaB activation and is a cause of incontinentia pigmenti. Nature. 2000;405(6785):466-472.
5. Aradhya S, Courtois G, Rajkovic A, et al. Atypical forms of incontinentia pigmenti in male individuals result from mutations of a cytosine tract in exon 10 of NEMO (IKK-gamma). Am J Hum Genet. 2001;68(3):765-771.
6. Poziomczyk CS, Recuero JK, Bringhenti L, et al. Incontinentia pigmenti. An Bras Dermatol. 2014;89(1):26-36.
7. Kenwrick S, Woffendin H, Jakins T, et al. Survival of male patients with incontinentia pigmenti carrying a lethal mutation can be explained by somatic mosaicism or Klinefelter Syndrome. Am J Hum Genet. 2001;69(6):1210-1217.
8. Katta R. Cutaneous sarcoidosis: a dermatologic masquerader. Am Fam Physician. 2002;65(8):1581-1584.
9. Faloyin M, Levitt J, Bercowitz E, et al. All that is vesicular is not herpes: incontinentia pigmenti masquerading as herpes simplex virus in a newborn. Pediatrics. 2004;114(2):e270-272.
10. Siedner-Weintraub Y, Gross I, David A, et al. Paediatric erythema multiforme: epidemiological, clinical and laboratory characteristics. Acta Derm Venereol. 2016 Nov 10. doi: 10.2340/00015555-2569.
11. Gawkrodger DJ, Ormerod AD, Shaw L, et al. Guideline for the diagnosis and management of vitiligo. Br J Dermatol. 2008;159(5):1051-1076.
12. Minic´ S, Trpinac D, Obradovic´ M. Incontinentia pigmenti diagnostic criteria update. Clin Genet. 2014;85(6):536-542.
13. Jean-Baptiste S, O’Toole EA, Chen M, et al. Expression of eotaxin, an eosinophil-selective chemokine, parallels eosinophil accumulation in the vesiculobullous stage of incontinentia pigmenti. Clin Exp Immunol. 2002;127(3):470-478.
14. Hadj-Rabia S, Rimella A, Smahi A, et al. Clinical and histologic features of incontinentia pigmenti in adults with nuclear factor-κ B essential modulator gene mutations. J Am Acad Dermatol. 2011;64(3):508-515.
15. Kaya TI, Tursen U, Ikizoglu G. Therapeutic use of topical corticosteroids in the vesiculobullous lesions of incontinentia pigmenti. Clin Exp Dermatol. 2009;34(8):e611-613.
16. Jessup CJ, Morgan SC, Cohen LM, Viders DE. Incontinentia pigmenti: treatment of IP with topical tacrolimus. J Drugs Dermatol. 2009;8(10):944-946.
IN THIS ARTICLE
- Presenting stages
- Diagnostic criteria
- Management of IP
A 21-year-old woman with type 1 diabetes is admitted for recurrent diabetic ketoacidosis. Physical exam reveals hypopigmented, linear, streaky patches on the medial aspects of the bilateral lower legs (Figure 1A). The patient denies tenderness, pruritus, or paresthesia. There is obvious symmetrical hair loss on the lateral aspects of the eyebrows, as well as slightly wooly male-pattern hair distribution with patchy alopecia on the vertex of the head (Figure 1B). She has very poor dentition with hypodontia and malformed teeth (Figure 1C). Her fingernails and toenails appear normal, with no visible atrophy (Figure 1D). What explains her condition?
Incontinentia pigmenti (IP), also known as Bloch-Sulzberger syndrome, is a rare, X-linked dominant genodermatosis involving the cutaneous, ophthalmic, neurologic, and dental systems.1-3 It results from X-inactivation due to mutations in the NF-kappaB essential modulator (NEMO) gene with deletion of exons 4-10 in most cases. The NEMO gene encodes a regulatory component of the IkappaB kinase complex required to activate the NF-kappa B pathway, which is important for many immune, inflammatory, and apoptotic processes.4-6 This deletional mutation is typically lethal in normal 46,XY male karyotypes. Male fetuses with this mutation usually die in utero, making the reported cases predominantly female.4,7
The estimated incidence of IP is between 1/10,000 and 1/100,000.4 Due to the rarity of the condition, IP may be underrecognized and underdiagnosed.
CLINICAL PRESENTATION
Characteristic skin lesions of IP begin to develop at birth or in utero, in an evolving pattern that consists of four stages:
- The vesicular stage (stage I) is characterized by linear erythematous papules and blisters that manifest in newborns.
- The verrucous stage (stage II) begins as the blisters start to heal—usually after several weeks—and is distinguished by hyperkeratotic warty papules in linear or swirling distribution. This stage resolves on its own within months.
- The hyperpigmentation stage (stage III) is when swirling macules or patches develop. This hallmark stage of IP tends to remain static until adolescence.
- The hypopigmentation stage (stage IV) manifests with faded streaky patches, which may be subtly atrophic. This final stage usually develops in the second or third decade of life.2,3
All these cutaneous lesions follow Blaschko lines—invisible lines believed to result from embryonic cell migration that become visible with the manifestation of cutaneous or mucous lesions.6
Other associated cutaneous findings include patchy alopecia, nail dystrophy, and oral/dental anomalies such as hypodontia, oligodontia, and tooth deformities. In addition, ophthalmologic involvement can result in strabismus, cataracts, and retinal vascular changes that can lead to blindness. Central nervous system manifestations include seizures, cognitive impairment, and spastic paralysis.3
DIFFERENTIAL DIAGNOSIS
Because IP is uncommon, it may be easily overlooked or misdiagnosed as another, similar cutaneous manifestation. Cutaneous sarcoidosis, for example, is a skin lesion of noncaseating granuloma. It can present as patches, papules, ulcers, scars, ichthyosis, and alopecia. The development of cutaneous sarcoidosis can be idiopathic or iatrogenic, particularly in patients using anti-TNF therapy. The diagnosis is made clinically and can be confirmed pathologically.8
Stage I IP can also be confused with neonatal herpes simplex virus-1 (HSV-1) infection, given the similarities in vesicular morphology and linear distribution. The diagnosis of HSV-1 can be made based on history, physical exam, and pathology. Given the serious sequelae of neonatal HSV-1 infection, antiviral therapy should not be delayed until confirmation of the diagnosis in infants with vesicular eruptions.9
Erythema multiforme (EM) is another dermatologic condition frequently encountered in children and young adults. Its characteristic round target lesion usually has two rings surrounding the dusky-appearing central zone. Atypical lesions can be bullous or crusty, mimicking the appearance of stage I or II IP. EM is usually a self-limiting condition, but specific treatment may be required if the infectious agent is identified.10
Vitiligo, the development of white patches due to the loss of melanocytes, is another item in the differential. Although it most commonly involves the skin, the hair may also be affected. The diagnosis is made clinically and can be confirmed with skin biopsy if needed.11
DIAGNOSIS
Diagnostic criteria for IP have been proposed, with family history playing a role (see Table).2,3,12 Results of a case-study series indicate that 28% of patients with IP have a family history involving at least one first-degree female relative. IP was considered “sporadic” in 62% of cases studied.3
Without a family history of IP, at least one major criterion must be present to support the diagnosis. These include
- Neonatal rash (erythema, vesicles)
- Linear, atrophic, hairless lesions
- Hyperpigmentation (mainly on trunk, following Blaschko lines)
In a patient with a family history of IP, the presence of any major criterion strongly supports the diagnosis. These, as well as minor criteria, are outlined in the Table.2,3,12
In stages I and II of IP, pathologic features include spongiotic dermatitis with characteristic eosinophils and large dyskeratotic cells.3,13 In stage IV, skin biopsies may reveal slight atrophy and scattered apoptotic cells in the epidermis and epidermal hypopigmentation due to reduced melanocytes. The dermis typically appears thickened and is absent hair follicles and sweat glands.14 In a 2014 update, these pathologic features were proposed to be included in the major diagnostic criteria.12
TREATMENT/MANAGEMENT
Treatment of IP is centered on the involved organ systems. For cutaneous lesions, treatment is not usually necessary unless inflammation persists. In such cases, topical steroids or tacrolimus have been used with some success.15,16 In the vesicular stage, the patient should be monitored for bacterial infection, with appropriate prevention or treatment as necessary.
With other involved systems—such as dental, ophthalmologic, or neurologic (eg, seizures or other encephalopathy) anomalies—consultation and follow-up with the relevant specialist is warranted.
In this case, the patient denied family history of IP. She did have a history of infantile cataract and seizure. Her presenting signs were typical of stage IV IP: hypopigmented streaky patches on the skin of the lower legs, dental abnormalities, somewhat wooly hair, alopecia on the head, and loss of hair on the lateral aspects of the eyebrows. The uniqueness of this case is that the patient also had type 1 diabetes, a condition with a strong genetic predisposition. However, there is no evidence supporting an association between IP and either type of diabetes.
CONCLUSION
Although rare, when IP does occur, its manifestations are vast and severe enough to significantly reduce quality of life for patients; when it occurs in males, it is usually lethal. This genetic disorder can affect multiple body systems, making knowledge of its symptoms essential for proper diagnosis. Because its characteristic stages may be present at birth or in infancy, early identification and diagnosis of IP can help guide treatment intervention.
1. Roberts AP. Incontinentia pigmenti (Bloch-Sulzberger). Br Med. J. 1958;1(5079):1106-1107.
2. Landy SJ, Donnai D. Incontinentia pigmenti (Bloch-Sulzberger syndrome). J Med Genet. 1993;30(1):53-59.
3. Hadj-Rabia S, Froidevaux N, Bodak D, et al. Clinical study of 40 cases of incontinentia pigmenti. Arch Dermatol. 2003; 139(9):1163-1170.
4. Smahi A, Courtois G, Vabres P, et al. Genomic rearrangement in NEMO impairs NF-kappaB activation and is a cause of incontinentia pigmenti. Nature. 2000;405(6785):466-472.
5. Aradhya S, Courtois G, Rajkovic A, et al. Atypical forms of incontinentia pigmenti in male individuals result from mutations of a cytosine tract in exon 10 of NEMO (IKK-gamma). Am J Hum Genet. 2001;68(3):765-771.
6. Poziomczyk CS, Recuero JK, Bringhenti L, et al. Incontinentia pigmenti. An Bras Dermatol. 2014;89(1):26-36.
7. Kenwrick S, Woffendin H, Jakins T, et al. Survival of male patients with incontinentia pigmenti carrying a lethal mutation can be explained by somatic mosaicism or Klinefelter Syndrome. Am J Hum Genet. 2001;69(6):1210-1217.
8. Katta R. Cutaneous sarcoidosis: a dermatologic masquerader. Am Fam Physician. 2002;65(8):1581-1584.
9. Faloyin M, Levitt J, Bercowitz E, et al. All that is vesicular is not herpes: incontinentia pigmenti masquerading as herpes simplex virus in a newborn. Pediatrics. 2004;114(2):e270-272.
10. Siedner-Weintraub Y, Gross I, David A, et al. Paediatric erythema multiforme: epidemiological, clinical and laboratory characteristics. Acta Derm Venereol. 2016 Nov 10. doi: 10.2340/00015555-2569.
11. Gawkrodger DJ, Ormerod AD, Shaw L, et al. Guideline for the diagnosis and management of vitiligo. Br J Dermatol. 2008;159(5):1051-1076.
12. Minic´ S, Trpinac D, Obradovic´ M. Incontinentia pigmenti diagnostic criteria update. Clin Genet. 2014;85(6):536-542.
13. Jean-Baptiste S, O’Toole EA, Chen M, et al. Expression of eotaxin, an eosinophil-selective chemokine, parallels eosinophil accumulation in the vesiculobullous stage of incontinentia pigmenti. Clin Exp Immunol. 2002;127(3):470-478.
14. Hadj-Rabia S, Rimella A, Smahi A, et al. Clinical and histologic features of incontinentia pigmenti in adults with nuclear factor-κ B essential modulator gene mutations. J Am Acad Dermatol. 2011;64(3):508-515.
15. Kaya TI, Tursen U, Ikizoglu G. Therapeutic use of topical corticosteroids in the vesiculobullous lesions of incontinentia pigmenti. Clin Exp Dermatol. 2009;34(8):e611-613.
16. Jessup CJ, Morgan SC, Cohen LM, Viders DE. Incontinentia pigmenti: treatment of IP with topical tacrolimus. J Drugs Dermatol. 2009;8(10):944-946.