User login
Vaping-linked lung injury: 2,172 cases, 42 deaths
The Centers for Disease Control and Prevention has from 49 states (all except Alaska), the District of Columbia, and two U.S. territories (Puerto Rico and U.S. Virgin Islands). Forty-two deaths have been confirmed in 24 states and the District of Columbia, the CDC reported.

Laboratory test results of bronchoalveolar lavage fluid samples from 29 patients submitted to CDC from 10 states found vitamin E acetate in all of the samples. This is the first time a chemical of concern has been found in biologic samples from patients with EVALI. These findings provide direct evidence of vitamin E acetate at the primary site of injury within the lungs.
Tetrahydrocannabinol (THC) was identified in 82% of the samples and nicotine was identified in 62% of the samples. Testing continues for other chemicals including plant oils, petroleum distillates like mineral oil, medium-chain triglycerides oil, and terpenes, which are compounds commonly found in or added to THC products. None of these chemicals has been detected in the bronchoalveolar lavage fluid samples tested.
For more information and resources visit For the Public, For Healthcare Providers, and For State and Local Health Departments pages, as well as the CDC’s Publications and Resources page.
The Centers for Disease Control and Prevention has from 49 states (all except Alaska), the District of Columbia, and two U.S. territories (Puerto Rico and U.S. Virgin Islands). Forty-two deaths have been confirmed in 24 states and the District of Columbia, the CDC reported.
Laboratory test results of bronchoalveolar lavage fluid samples from 29 patients submitted to CDC from 10 states found vitamin E acetate in all of the samples. This is the first time a chemical of concern has been found in biologic samples from patients with EVALI. These findings provide direct evidence of vitamin E acetate at the primary site of injury within the lungs.
Tetrahydrocannabinol (THC) was identified in 82% of the samples and nicotine was identified in 62% of the samples. Testing continues for other chemicals including plant oils, petroleum distillates like mineral oil, medium-chain triglycerides oil, and terpenes, which are compounds commonly found in or added to THC products. None of these chemicals has been detected in the bronchoalveolar lavage fluid samples tested.
For more information and resources visit For the Public, For Healthcare Providers, and For State and Local Health Departments pages, as well as the CDC’s Publications and Resources page.
REPORTING FROM CDC
Transfusion-related lung injury is on the rise in elderly patients
SAN ANTONIO – Although there has been a general decline in transfusion-related anaphylaxis and acute infections over time among hospitalized older adults in the United States, incidence rates for both transfusion-related acute lung injury and transfusion-associated circulatory overload have risen over the last decade, according to researchers from the Food and Drug Administration.

Mikhail Menis, PharmD, an epidemiologist at the FDA Center for Biologics Evaluation and Research (CBER) and colleagues queried large Medicare databases to assess trends in transfusion-related adverse events among adults aged 65 years and older.
The investigators saw “substantially higher risk of all outcomes among immunocompromised beneficiaries, which could be related to higher blood use of all blood components, especially platelets, underlying conditions such as malignancies, and treatments such as chemotherapy or radiation, which need further investigation,” Dr. Menis said at the annual meeting of AABB, the group formerly known as the American Association of Blood Banks.
He reported data from a series of studies on four categories of transfusion-related events that may be life-threatening or fatal: transfusion-related anaphylaxis (TRA), transfusion-related acute lung injury (TRALI), transfusion-associated circulatory overload (TACO), and acute infection following transfusion (AIFT).
For each type of event, the researchers looked at overall incidence and the incidence by immune status, calendar year, blood components transfused, number of units transfused, age, sex, and race.
Anaphylaxis (TRA)
TRA may be caused by preformed immunoglobin E (IgE) antibodies to proteins in the plasma in transfused blood products or by preformed IgA antibodies in patients who are likely IgA deficient, Dr. Menis said.
The overall incidence of TRA among 8,833,817 inpatient transfusions stays for elderly beneficiaries from 2012 through 2018 was 7.1 per 100,000 stays. The rate was higher for immunocompromised patients, at 9.6, than it was among nonimmunocompromised patients, at 6.5.
The rates varied by every subgroup measured except immune status. Annual rates showed a downward trend, from 8.7 per 100,000 in 2012, to 5.1 in 2017 and 6.4 in 2018. The decline in occurrence may be caused by a decline in inpatient blood utilization during the study period, particularly among immunocompromised patients.
TRA rates increased with five or more units transfused. The risk was significantly reduced in the oldest group of patients versus the youngest (P less than .001), which supports the immune-based mechanism of action of anaphylaxis, Dr. Menis said.
They also found that TRA rates were substantially higher among patients who had received platelet and/or plasma transfusions, compared with patients who received only red blood cells (RBCs).
Additionally, risk for TRA was significantly higher among men than it was among women (9.3 vs. 5.4) and among white versus nonwhite patients (7.8 vs. 3.8).
The evidence suggested TRA cases are likely to be severe in this population, with inpatient mortality of 7.1%, and hospital stays of 7 days or longer in about 58% of cases, indicating the importance of TRA prevention, Dr. Menis said.
The investigators plan to perform multivariate regression analyses to assess potential risk factors, including underlying comorbidities and health histories for TRA occurrence for both the overall population and by immune status.
Acute lung injury (TRALI)
TRALI is a rare but serious adverse event, a clinical syndrome with onset within 6 hours of transfusion that presents as acute hypoxemia, respiratory distress, and noncardiogenic pulmonary edema.
Among 17,771,193 total inpatient transfusion stays, the overall incidence of TRALI was 33.2 per 100,000. The rate was 55.9 for immunocompromised patients versus 28.4 for nonimmunocompromised patients. The rate ratio was 2.0 (P less than .001).
The difference by immune status may be caused by higher blood utilizations with more units transfused per stay among immunocompromised patients, a higher incidence of prior transfusions among these patients, higher use of irradiated blood components that may lead to accumulation of proinflammatory mediators in blood products during storage, or underlying comorbidities.
The overall rate increased from 14.3 in 2007 to 56.4 in 2018. The rates increased proportionally among both immunocompromised and nonimmunocompromised patients.
As with TRA, the incidence of TRALI was higher in patients with five or more units transfused, while the incidence declined with age, likely caused by declining blood use and age-related changes in neutrophil function, Dr. Menis said.
TRALI rates were slightly higher among men than among women, as well as higher among white patients than among nonwhite patients.
Overall, TRALI rates were higher for patients who received platelets either alone or in combination with RBCs and/or plasma. The highest rates were among patients who received RBCs, plasma and platelets.
Dr. Menis called for studies to determine what effects the processing and storage of blood components may have on TRALI occurrence; he and his colleagues also are planning regression analyses to assess potential risk factors for this complication.
Circulatory overload (TACO)
TACO is one of the leading reported causes of transfusion-related fatalities in the U.S., with onset usually occurring within 6 hours of transfusion, presenting as acute respiratory distress with dyspnea, orthopnea, increased blood pressure, and cardiogenic pulmonary edema.
The overall incidence of TACO among hospitalized patients aged 65 years and older from 2011 through 2018 was 86.3 per 100,000 stays. The incidences were 128.3 in immunocompromised and 76.0 in nonimmunocompromised patients. The rate ratio for TACO in immunocompromised versus nonimmunocompromised patients was 1.70 (P less than .001).
Overall incidence rates of TACO rose from 62 per 100,000 stays in 2011 to 119.8 in 2018. As with other adverse events, incident rates rose with the number of units transfused.
Rates of TACO were significantly higher among women than they were among men (94.6 vs. 75.9 per 100,000; P less than .001), which could be caused by the higher mean age of women and/or a lower tolerance for increased blood volume from transfusion.
The study results also suggested that TACO and TRALI may coexist, based on evidence that 3.5% of all TACO stays also had diagnostic codes for TRALI. The frequency of co-occurrence of these two adverse events also increased over time, which may be caused by improved awareness, Dr. Menis said.
Infections (AIFT)
Acute infections following transfusion can lead to prolonged hospitalizations, sepsis, septic shock, and death. Those most at risk include elderly and immunocompromised patients because of high utilization of blood products, comorbidities, and decreased immune function.
Among 8,833,817 stays, the overall rate per 100,000 stays was 2.1. The rate for immunocompromised patients was 5.4, compared with 1.2 for nonimmunocompromised patients, for a rate ratio of 4.4 (P less than .001).
The incidence rate declined significantly (P = .03) over the study period, with the 3 latest years having the lowest rates.
Rates increased substantially among immunocompromised patients by the number of units transfused, but remained relatively stable among nonimmunocompromised patients.
Infection rates declined with age, from 2.7 per 100,000 stays for patients aged 65-68 years to 1.2 per 100,000 for those aged 85 years and older.
As with other adverse events, AIFT rates were likely related to the blood components transfused, with substantially higher rates for stays during which platelets were transfused either alone or with RBCs, compared with RBCs alone. This could be caused by the room-temperature storage of platelets and higher number of platelets units transfused, compared with RBCs alone, especially among immunocompromised patients.
In all, 51.9% of AIFT cases also had sepsis noted in the medical record, indicating high severity and emphasizing the importance of AIFT prevention, Dr. Menis said.
The studies were funded by the FDA, and Dr. Menis is an FDA employee. He reported having no conflicts of interest.
SAN ANTONIO – Although there has been a general decline in transfusion-related anaphylaxis and acute infections over time among hospitalized older adults in the United States, incidence rates for both transfusion-related acute lung injury and transfusion-associated circulatory overload have risen over the last decade, according to researchers from the Food and Drug Administration.
Mikhail Menis, PharmD, an epidemiologist at the FDA Center for Biologics Evaluation and Research (CBER) and colleagues queried large Medicare databases to assess trends in transfusion-related adverse events among adults aged 65 years and older.
The investigators saw “substantially higher risk of all outcomes among immunocompromised beneficiaries, which could be related to higher blood use of all blood components, especially platelets, underlying conditions such as malignancies, and treatments such as chemotherapy or radiation, which need further investigation,” Dr. Menis said at the annual meeting of AABB, the group formerly known as the American Association of Blood Banks.
He reported data from a series of studies on four categories of transfusion-related events that may be life-threatening or fatal: transfusion-related anaphylaxis (TRA), transfusion-related acute lung injury (TRALI), transfusion-associated circulatory overload (TACO), and acute infection following transfusion (AIFT).
For each type of event, the researchers looked at overall incidence and the incidence by immune status, calendar year, blood components transfused, number of units transfused, age, sex, and race.
Anaphylaxis (TRA)
TRA may be caused by preformed immunoglobin E (IgE) antibodies to proteins in the plasma in transfused blood products or by preformed IgA antibodies in patients who are likely IgA deficient, Dr. Menis said.
The overall incidence of TRA among 8,833,817 inpatient transfusions stays for elderly beneficiaries from 2012 through 2018 was 7.1 per 100,000 stays. The rate was higher for immunocompromised patients, at 9.6, than it was among nonimmunocompromised patients, at 6.5.
The rates varied by every subgroup measured except immune status. Annual rates showed a downward trend, from 8.7 per 100,000 in 2012, to 5.1 in 2017 and 6.4 in 2018. The decline in occurrence may be caused by a decline in inpatient blood utilization during the study period, particularly among immunocompromised patients.
TRA rates increased with five or more units transfused. The risk was significantly reduced in the oldest group of patients versus the youngest (P less than .001), which supports the immune-based mechanism of action of anaphylaxis, Dr. Menis said.
They also found that TRA rates were substantially higher among patients who had received platelet and/or plasma transfusions, compared with patients who received only red blood cells (RBCs).
Additionally, risk for TRA was significantly higher among men than it was among women (9.3 vs. 5.4) and among white versus nonwhite patients (7.8 vs. 3.8).
The evidence suggested TRA cases are likely to be severe in this population, with inpatient mortality of 7.1%, and hospital stays of 7 days or longer in about 58% of cases, indicating the importance of TRA prevention, Dr. Menis said.
The investigators plan to perform multivariate regression analyses to assess potential risk factors, including underlying comorbidities and health histories for TRA occurrence for both the overall population and by immune status.
Acute lung injury (TRALI)
TRALI is a rare but serious adverse event, a clinical syndrome with onset within 6 hours of transfusion that presents as acute hypoxemia, respiratory distress, and noncardiogenic pulmonary edema.
Among 17,771,193 total inpatient transfusion stays, the overall incidence of TRALI was 33.2 per 100,000. The rate was 55.9 for immunocompromised patients versus 28.4 for nonimmunocompromised patients. The rate ratio was 2.0 (P less than .001).
The difference by immune status may be caused by higher blood utilizations with more units transfused per stay among immunocompromised patients, a higher incidence of prior transfusions among these patients, higher use of irradiated blood components that may lead to accumulation of proinflammatory mediators in blood products during storage, or underlying comorbidities.
The overall rate increased from 14.3 in 2007 to 56.4 in 2018. The rates increased proportionally among both immunocompromised and nonimmunocompromised patients.
As with TRA, the incidence of TRALI was higher in patients with five or more units transfused, while the incidence declined with age, likely caused by declining blood use and age-related changes in neutrophil function, Dr. Menis said.
TRALI rates were slightly higher among men than among women, as well as higher among white patients than among nonwhite patients.
Overall, TRALI rates were higher for patients who received platelets either alone or in combination with RBCs and/or plasma. The highest rates were among patients who received RBCs, plasma and platelets.
Dr. Menis called for studies to determine what effects the processing and storage of blood components may have on TRALI occurrence; he and his colleagues also are planning regression analyses to assess potential risk factors for this complication.
Circulatory overload (TACO)
TACO is one of the leading reported causes of transfusion-related fatalities in the U.S., with onset usually occurring within 6 hours of transfusion, presenting as acute respiratory distress with dyspnea, orthopnea, increased blood pressure, and cardiogenic pulmonary edema.
The overall incidence of TACO among hospitalized patients aged 65 years and older from 2011 through 2018 was 86.3 per 100,000 stays. The incidences were 128.3 in immunocompromised and 76.0 in nonimmunocompromised patients. The rate ratio for TACO in immunocompromised versus nonimmunocompromised patients was 1.70 (P less than .001).
Overall incidence rates of TACO rose from 62 per 100,000 stays in 2011 to 119.8 in 2018. As with other adverse events, incident rates rose with the number of units transfused.
Rates of TACO were significantly higher among women than they were among men (94.6 vs. 75.9 per 100,000; P less than .001), which could be caused by the higher mean age of women and/or a lower tolerance for increased blood volume from transfusion.
The study results also suggested that TACO and TRALI may coexist, based on evidence that 3.5% of all TACO stays also had diagnostic codes for TRALI. The frequency of co-occurrence of these two adverse events also increased over time, which may be caused by improved awareness, Dr. Menis said.
Infections (AIFT)
Acute infections following transfusion can lead to prolonged hospitalizations, sepsis, septic shock, and death. Those most at risk include elderly and immunocompromised patients because of high utilization of blood products, comorbidities, and decreased immune function.
Among 8,833,817 stays, the overall rate per 100,000 stays was 2.1. The rate for immunocompromised patients was 5.4, compared with 1.2 for nonimmunocompromised patients, for a rate ratio of 4.4 (P less than .001).
The incidence rate declined significantly (P = .03) over the study period, with the 3 latest years having the lowest rates.
Rates increased substantially among immunocompromised patients by the number of units transfused, but remained relatively stable among nonimmunocompromised patients.
Infection rates declined with age, from 2.7 per 100,000 stays for patients aged 65-68 years to 1.2 per 100,000 for those aged 85 years and older.
As with other adverse events, AIFT rates were likely related to the blood components transfused, with substantially higher rates for stays during which platelets were transfused either alone or with RBCs, compared with RBCs alone. This could be caused by the room-temperature storage of platelets and higher number of platelets units transfused, compared with RBCs alone, especially among immunocompromised patients.
In all, 51.9% of AIFT cases also had sepsis noted in the medical record, indicating high severity and emphasizing the importance of AIFT prevention, Dr. Menis said.
The studies were funded by the FDA, and Dr. Menis is an FDA employee. He reported having no conflicts of interest.
REPORTING FROM AABB 2019
CDC releases update of 2013 Antibiotic Resistance Threats Report
“You and I are living in a time when some miracle drugs no longer perform miracles and families are being ripped apart by a microscopic enemy. The time for action is now and we can be part of the solution,” said Robert R. Redfield, MD, director of the Centers for Disease Control and Prevention in his foreword to the new CDC report on antibiotic resistance.
![]()
In this update of the previous 2013 report, The current report uses EHRs and other data sources obtained by the CDC for relevant infections extrapolated to develop national disease incidence. The report focuses on “the top 18 pathogens that require attention now,” advises specific steps be taken to address these pathogens, and puts into perspective the future of antibiotic development, their use and abuse, and the continuing threat of antibiotic resistance.
The CDC categorizes these 18 pathogens as either an urgent, serious, or concerning threat.
Urgent Threats
- Carbapenem-resistant Acinetobacter, which cause pneumonia and wound, bloodstream, and urinary tract infections; they tend to affect patients in ICUs. Of particular concern, some Acinetobacter are resistant to nearly all antibiotics, with few new drugs in development (8,500 hospital infections in 2017; 700 deaths).
- Candida auris, a drug-resistant fungus that was first identified in 2009 in Asia and has quickly become a cause of severe infections around the world; it is extremely difficult to eradicate from health care settings. It began spreading in the United States in 2015, with 323 cases reported in 2018 (90% resistant to at least one antifungal, and 30% resistant to at least two antifungals).
- Clostridioides difficile, which can cause life-threatening diarrhea, most often in people who have taken antibiotics for other conditions. It is the most common health care–associated infection, and although decreasing in the health care system, it has not decreased in community settings (223,900 hospital infections in 2017, and 12,800 estimated deaths).
- Carbapenem-resistant Enterobacteriaceae, which most frequently infect patients who require devices such as catheters and those taking long courses of some antibiotics. Of particular concern is the fact that these bacteria contain a transmissible plasmid that can transfer their drug resistance to other pathogens (13,100 hospital infections in 2017, and 1,100 estimated deaths).
- Drug-resistant Neisseria gonorrhoeae, which is a sexually transmitted disease that can result in life-threatening ectopic pregnancy, lead to infertility, and can increase the risk of getting and giving HIV; it can also cause cardiovascular and neurological problems. It is resistant to all but one class of antibiotics, and half of all infections are resistant to at least one antibiotic (550,000 drug-resistant infections yearly).
Serious Threats
- Drug-resistant Campylobacter.
- Drug-resistant Candida.
- Extended spectrum beta-lactamase–producing Enterobacteriaceae.
- Vancomycin-resistant Enterococci.
- Multidrug-resistant Pseudomonas aeruginosa.
- Drug-resistant nontyphoidal Salmonella.
- Drug-resistant Salmonella serotype Typhi.
- Drug-resistant Shigella.
- Methicillin-resistant Staphylococcus aureus (MRSA).
- Drug-resistant Streptococcus pneumoniae.
- Drug-resistant Tuberculosis.
Concerning Threats
These comprise erythromycin-resistant group A Streptococcus and clindamycin-resistant group B Streptococcus.
In addition, the CDC has established a Watch List of three pathogens to be wary of: azole-resistant Aspergillus fumigatus, drug-resistant Mycoplasma genitalium, and drug-resistant Bordetella pertussis.
Because antibiotic resistance is a global phenomenon caused by and affecting everyone, the CDC provided solutions to the problem of antibiotic resistance at every level of society. This “comprehensive and coordinated response implements the U.S. National Action Plan for Combating Antibiotic-Resistant Bacteria” and includes cooperation with the Department of Health and Human Services, Department of Veterans Affairs, Department of Defense, Department of State, and Department of Agriculture, according to the report.
The key components of this response include using data and new technologies to detect and track antibiotic resistance; infection prevention and containment, especially in terms of outbreak response; improving antibiotic use across populations (one successful example being a 16% decrease of outpatient antibiotic prescribing to children during 2011-2017); improvements in the identification and intervention in the environment including water and soil and in sanitation; and a significant investment in vaccines, diagnostics, and novel therapeutics (the CDC provided nearly $110 million to 96 institutions for work in these areas).
The report also details some hope in the development of new antibiotics. As of June 2019, there were 42 new antibiotics in development, including 4 with new drug applications submitted, 17 with the potential to treat serious gram negative bacteria, and 11 that could address the urgent threats of gonorrhea or C. difficile. Overall, a quarter of these new antibiotics represent a novel drug class or use a novel mechanism of action.
Furthermore, 84% of U.S. hospitals report a stewardship program meeting all seven of CDC’s Core Elements of Hospital Antibiotic Stewardship. Proper stewardship is at the core of preventing the development of new antibiotic resistant pathogen strains.
In addition, the CDC noted a 5% overall decline in antibiotic prescribing in outpatient settings during 2011-2016.
“The problem will get worse if we do not act now, but we can make a difference,” according to Dr. Redfield. “Simply, here’s what works. Preventing infections protects everyone. Improving antibiotic use in people and animals slows the threat and helps preserve today’s drugs and those yet to come. Detecting threats and implementing interventions to keep germs from becoming widespread saves lives.”
In response to the release of the report, the AMA issued a supporting statement and cited its collection of educational resources for physicians focused on antibiotic use, resistance, and stewardship.
Similarly, the Society for Healthcare Epidemiology of America (SHEA) stated that hospitals were “a bright spot” in the CDC report and offered tools and resources available to educate and inform health care professionals about best practices in infection prevention and control, as well as antibiotic stewardship.
SOURCE: CDC. Antibiotic Resistance Threats in the United States 2019.
Short Takes
E-cigarettes with behavioral support more effective than nicotine replacement for smoking cessation
A study of 886 randomized United Kingdom National Health Service stop-smoking service attendees showed better 1-year abstinence rates in the e-cigarette (18%) vs. nicotine replacement product (9%) group (risk ratio,1.83; 95% confidence interval, 1.30-2.58) when both groups received behavioral support.
Citation: Hajek P et al. A randomized trial of e-cigarettes versus nicotine-replacement therapy. N Eng J Med. 2019 Feb 14;380:629-37.
New scoring system more accurate in diagnosing sepsis than qSOFA
Using retrospective data from 2,759,529 ED patients in 49 urban hospitals, and a supervised machine-learning process, the authors developed a Risk of Sepsis score, which demonstrated significantly higher sensitivity for detecting sepsis than the qSOFA (Quick Sequential Organ Failure Assessment) score.
Citation: Delahanty R et al. Development and evaluation of a machine learning model for the early identification of patients at risk for sepsis. Ann Emerg Med. 2019 Apr;73(4):334-44.
Shared decision making may decrease risk of legal action
A randomized, controlled simulation experiment using a clinical vignette with an adverse outcome showed that when engaged in shared decision making, participants were less likely to consider taking legal action.
Citation: Schoenfeld EM et al. The effect of shared decision making on patients’ likelihood of filing a complaint or lawsuit: A simulation study. Ann Emerg Med. 2019 Jan 3. doi: 10.1016/j.annemergmed.2018.11.017.
ADA issues new inpatient diabetes care recommendations
The American Diabetes Association recommends that insulin therapy be initiated for a majority of inpatients who have persistent hyperglycemia greater than 180 mg/dL to target a blood glucose range of 140-180 mg/dL. They recommend the use of basal insulin or basal plus bolus insulin and discourage the sole use of sliding scale insulin.
Citation: American Diabetes Association. 15. Diabetes care in the hospital: Standards of Medical Care in Diabetes-2019. Diabetes Care. 2019;42(Suppl. 1):S173-81.

Beta-blocker use may reduce risk of COPD hospitalization

In a retrospective longitudinal study of 301,542 patients newly prescribed beta-blockers and 1,000,633 patients newly prescribed any other antihypertensive drug, patients who were treated with beta-blockers continuously for more than 6 months had a significantly lower risk of chronic obstructive pulmonary disease (COPD) hospitalization, all-cause mortality, and COPD death than did patients who received alternative antihypertensives. Patients with a history of COPD hospitalization were excluded from this study.
Citation: Nielsen AO et al. Beta-blocker therapy and risk of chronic obstructive pulmonary disease: A Danish nationwide study of 1.3 million individuals. EClinicalMedicine. 2019;7:21-6. doi: 10.1016/j.eclinm.2019.01.004.
E-cigarettes with behavioral support more effective than nicotine replacement for smoking cessation
A study of 886 randomized United Kingdom National Health Service stop-smoking service attendees showed better 1-year abstinence rates in the e-cigarette (18%) vs. nicotine replacement product (9%) group (risk ratio,1.83; 95% confidence interval, 1.30-2.58) when both groups received behavioral support.
Citation: Hajek P et al. A randomized trial of e-cigarettes versus nicotine-replacement therapy. N Eng J Med. 2019 Feb 14;380:629-37.
New scoring system more accurate in diagnosing sepsis than qSOFA
Using retrospective data from 2,759,529 ED patients in 49 urban hospitals, and a supervised machine-learning process, the authors developed a Risk of Sepsis score, which demonstrated significantly higher sensitivity for detecting sepsis than the qSOFA (Quick Sequential Organ Failure Assessment) score.
Citation: Delahanty R et al. Development and evaluation of a machine learning model for the early identification of patients at risk for sepsis. Ann Emerg Med. 2019 Apr;73(4):334-44.
Shared decision making may decrease risk of legal action
A randomized, controlled simulation experiment using a clinical vignette with an adverse outcome showed that when engaged in shared decision making, participants were less likely to consider taking legal action.
Citation: Schoenfeld EM et al. The effect of shared decision making on patients’ likelihood of filing a complaint or lawsuit: A simulation study. Ann Emerg Med. 2019 Jan 3. doi: 10.1016/j.annemergmed.2018.11.017.
ADA issues new inpatient diabetes care recommendations
The American Diabetes Association recommends that insulin therapy be initiated for a majority of inpatients who have persistent hyperglycemia greater than 180 mg/dL to target a blood glucose range of 140-180 mg/dL. They recommend the use of basal insulin or basal plus bolus insulin and discourage the sole use of sliding scale insulin.
Citation: American Diabetes Association. 15. Diabetes care in the hospital: Standards of Medical Care in Diabetes-2019. Diabetes Care. 2019;42(Suppl. 1):S173-81.
Beta-blocker use may reduce risk of COPD hospitalization
In a retrospective longitudinal study of 301,542 patients newly prescribed beta-blockers and 1,000,633 patients newly prescribed any other antihypertensive drug, patients who were treated with beta-blockers continuously for more than 6 months had a significantly lower risk of chronic obstructive pulmonary disease (COPD) hospitalization, all-cause mortality, and COPD death than did patients who received alternative antihypertensives. Patients with a history of COPD hospitalization were excluded from this study.
Citation: Nielsen AO et al. Beta-blocker therapy and risk of chronic obstructive pulmonary disease: A Danish nationwide study of 1.3 million individuals. EClinicalMedicine. 2019;7:21-6. doi: 10.1016/j.eclinm.2019.01.004.
Storytelling tool can assist elderly in the ICU
SAN FRANCISCO – A “Best Case/Worst Case” (BCWC) framework tool has been adapted for use with geriatric trauma patients in the ICU, where it can help track a patient’s progress and enable better communication with patients and loved ones. The tool relies on a combination of graphics and text that surgeons update daily during rounds, and creates a longitudinal view of a patient’s trajectory during their stay in the ICU.
– for example, after a complication has arisen.
“Each day during rounds, the ICU team records important events on the graphic aid that change the patient’s course. The team draws a star to represent the best case, and a line to represent prognostic uncertainty. The attending trauma surgeon then uses the geriatric trauma outcome score, their knowledge of the health state of the patient, and their own clinical experience to tell a story about treatments, recovery, and outcomes if everything goes as well as we might hope. This story is written down in the best-case scenario box,” Christopher Zimmerman, MD, a general surgery resident at the University of Wisconsin–Madison, said during a presentation about the BCWC tool at the annual clinical congress of the American College of Surgeons
“We often like to talk to patients and their families [about best- and worst-case scenarios] anyway, but [the research team] have tried to formalize it,” said Tam Pham, MD, professor of surgery at the University of Washington, in an interview. Dr. Pham comoderated the session where the research was presented.
“When we’re able to communicate where the uncertainty is and where the boundaries are around the course of care and possible outcomes, we can build an alliance with patients and families that will be helpful when there is a big decision to make, say about a laparotomy for a perforated viscus,” said Dr. Zimmerman.
Dr. Zimmerman gave an example of a patient who came into the ICU after suffering multiple fractures from falling down a set of stairs. The team created an initial BCWC with a hoped-for best-case scenario. Later, the patient developed hypoxemic respiratory failure and had to be intubated overnight. “This event is recorded on the graphic, and her star representing the best case has changed position, the line representing uncertainty has shortened, and the contents of her best-case scenario has changed. Each day in rounds, this process is repeated,” said Dr. Zimmerman.
Palliative care physicians, education experts, and surgeons at the University of Wisconsin–Madison developed the tool in an effort to reduce unwanted care at the end of life, in the context of high-risk surgeries. The researchers adapted the tool to the trauma setting by gathering six focus groups of trauma practitioners at the University of Wisconsin; University of Texas, Dallas; and Oregon Health & Science University, Portland. They modified the tool after incorporating comments, and then iteratively modified it through tasks carried out in the ICU as part of a qualitative improvement initiative at the University of Wisconsin–Madison. They generated a change to the tool, implemented it in the ICU during subsequent rounds, then collected observations and field notes, then revised and repeated the process, streamlining it to fit into the ICU environment, according to Dr. Zimmerman.
The back side of the tool is available for family members to write important details about their loved ones, leading insight into the patient’s personality and desires, such as favorite music or affection for a family pet.
The work was supported by the National Institutes of Health. Dr. Zimmerman and Dr. Pham have no relevant financial disclosures.
SOURCE: Zimmerman C et al. Clinical Congress 2019, Abstract.
REPORTING FROM CLINICAL CONGRESS 2019
Risk stratification of syncope patients can help determine duration of telemetry monitoring
Background: About half of ED patients with syncope of unknown etiology are admitted for telemetry monitoring. No consensus exists regarding the optimal duration of telemetry monitoring in these patients to detect underlying arrhythmia.
Study design: Prospective cohort study.
Setting: Six EDs in Canada during September 2010–March 2015.
Synopsis: Using the Canadian Syncope Risk Score, 5,581 adults who presented to the ED within 24 hours of a syncopal event were risk stratified as low, medium, or high risk for serious adverse events (arrhythmic vs. nonarrhythmic) and then followed for 30 days. Approximately half of arrhythmias were identified among low-risk patients within 2 hours of telemetry monitoring and within 6 hours of monitoring among medium- and high-risk patients. In the low-risk group, none experienced death or ventricular arrhythmia within 30 days. In the medium- and high-risk group, 91.7% of underlying arrhythmias were identified within 15 days. The study was limited by the lack of standardized approach in the use of outpatient cardiac rhythm monitoring, which may have resulted in arrhythmia underdetection.
Bottom line: Among ED patients with syncope of unknown etiology, approximately 47% of arrhythmias were detected after 2-6 hours of telemetry monitoring. Among medium- and high-risk patients, the majority of serious arrhythmias were identified within 15 days. Based on these results, the authors recommend the use of 15-day outpatient cardiac monitoring for medium- and high-risk patients.
Citation: Thiruganasambandamoorthy V et al. Duration of electrocardiographic monitoring of emergency department patients with syncope. Circulation. 2019 Mar 12;139(11):1396-406.
Dr. Roy is a hospitalist at Beth Israel Deaconess Medical Center and instructor in medicine at Harvard Medical School.
Fentanyl-related deaths show strong regional pattern
Fentanyl was involved in more overdose deaths than any other drug in 2017, and the death rate in New England was 15 times higher than in regions of the Midwest and West, according to the National Center for Health Statistics.
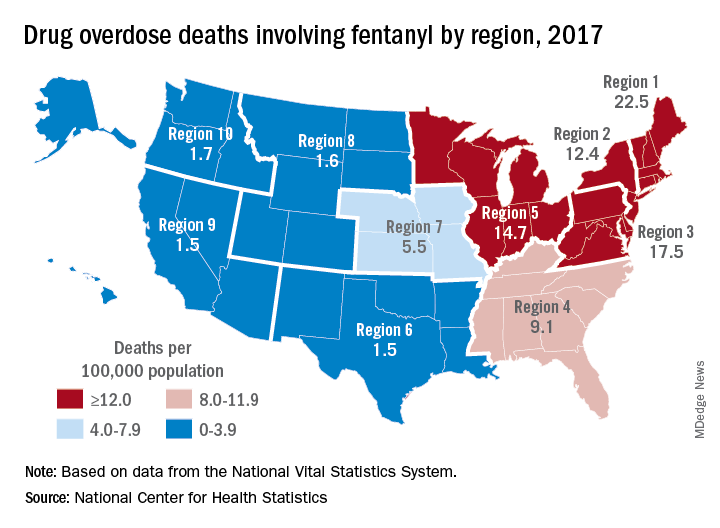
Nationally, fentanyl was involved in 39% of all drug overdose deaths and had an age-adjusted death rate of 8.7/100,000 standard population in 2017. In 2016, when fentanyl also was the most involved drug in the United States, the corresponding figures were 29% and 5.9/100,000, the agency said in a recent report.
Fentanyl was the most involved drug in overdose deaths for 6 of the country’s 10 public health regions in 2017, with a clear pattern of decreasing use from east to west. The highest death rate (22.5/100,000) occurred in Region 1 (New England) and the lowest rates (1.5/100,000) came in Region 6 (Arkansas, Louisiana, New Mexico, Oklahoma, and Texas) and Region 9 (Arizona, California, Hawaii, and Nevada), the researchers said.
A somewhat similar pattern was seen for heroin, which was second nationally on the list of drugs most frequently involved in overdose deaths (23%), except that New England was somewhat below three other regions in the East and upper Midwest. The highest heroin death rate (8.6/100,000) was seen in Region 2 (New Jersey and New York) and the lowest (2.2) occurred in Region 9, they said, based on data from the National Vital Statistics System’s mortality files.
The fentanyl pattern was even more closely repeated with cocaine, third in involvement nationally at 21% of overdose deaths in 2017. The high in overdose deaths (9.5/100,000) came in Region 1 again, and the low in Region 9 (1.3), along with Region 7 (Iowa, Kansas, Missouri, and Nebraska) and Region 10 (Alaska, Idaho, Oregon, and Washington), the report showed.
The regional pattern of overdose deaths for methamphetamine, which was fourth nationally in involvement (13.3%), basically reversed the other three drugs: highest in the West and lowest in the Northeast. Region 9 had the highest death rate (5.2/100,000) and Region 2 the lowest (0.4), with Region 1 just ahead at 0.6.
Fentanyl was involved in more overdose deaths than any other drug in 2017, and the death rate in New England was 15 times higher than in regions of the Midwest and West, according to the National Center for Health Statistics.
Nationally, fentanyl was involved in 39% of all drug overdose deaths and had an age-adjusted death rate of 8.7/100,000 standard population in 2017. In 2016, when fentanyl also was the most involved drug in the United States, the corresponding figures were 29% and 5.9/100,000, the agency said in a recent report.
Fentanyl was the most involved drug in overdose deaths for 6 of the country’s 10 public health regions in 2017, with a clear pattern of decreasing use from east to west. The highest death rate (22.5/100,000) occurred in Region 1 (New England) and the lowest rates (1.5/100,000) came in Region 6 (Arkansas, Louisiana, New Mexico, Oklahoma, and Texas) and Region 9 (Arizona, California, Hawaii, and Nevada), the researchers said.
A somewhat similar pattern was seen for heroin, which was second nationally on the list of drugs most frequently involved in overdose deaths (23%), except that New England was somewhat below three other regions in the East and upper Midwest. The highest heroin death rate (8.6/100,000) was seen in Region 2 (New Jersey and New York) and the lowest (2.2) occurred in Region 9, they said, based on data from the National Vital Statistics System’s mortality files.
The fentanyl pattern was even more closely repeated with cocaine, third in involvement nationally at 21% of overdose deaths in 2017. The high in overdose deaths (9.5/100,000) came in Region 1 again, and the low in Region 9 (1.3), along with Region 7 (Iowa, Kansas, Missouri, and Nebraska) and Region 10 (Alaska, Idaho, Oregon, and Washington), the report showed.
The regional pattern of overdose deaths for methamphetamine, which was fourth nationally in involvement (13.3%), basically reversed the other three drugs: highest in the West and lowest in the Northeast. Region 9 had the highest death rate (5.2/100,000) and Region 2 the lowest (0.4), with Region 1 just ahead at 0.6.
Smokers with PE have higher rate of hospital readmission
NEW ORLEANS – , according to a retrospective study.

The rate of readmission was significantly higher among patients with tobacco dependence, and tobacco dependence was independently associated with an increased risk of readmission.
“This is the first study to quantify the increased rate of hospital readmission due to smoking,” said study investigator Kam Sing Ho, MD, of Mount Sinai St. Luke’s and Mount Sinai West, New York.
Dr. Ho and colleagues described this study and its results in a poster presented at the annual meeting of the American College of Chest Physicians.
The researchers analyzed data on 168,891 hospital admissions of adults with PE, 34.2% of whom had tobacco dependence. Patients with and without tobacco dependence were propensity matched for baseline characteristics (n = 24,262 in each group).
The 30-day readmission rate was significantly higher in patients with tobacco dependence than in those without it – 11.0% and 8.9%, respectively (P less than .001). The most common reason for readmission in both groups was PE.
Dr. Ho said the higher readmission rate among patients with tobacco dependence might be explained by the fact that smokers have a higher level of fibrinogen, which may affect blood viscosity and contribute to thrombus formation (Proc Am Thorac Soc. 2005;2[1]:71-7).
The investigators also found that tobacco dependence was an independent predictor of readmission (hazard ratio, 1.43; P less than .001). And the mortality rate was significantly higher after readmission than after index admission – 6.27% and 3.15%, respectively (P less than .001).
The increased risk of readmission and death among smokers highlights the importance of smoking cessation services. Dr. Ho cited previous research suggesting these services are underused in the hospital setting (BMJ Qual Improv Rep. 2014;3[1]:u204964.w2110).
“Given that smoking is a common phenomenon among patients admitted with pulmonary embolism, we suggest that more rigorous smoking cessation services are implemented prior to discharge for all active smokers,” Dr. Ho said. “[P]atients have the right to be informed on the benefits of smoking cessation and the autonomy to choose. Future research will focus on implementing inpatient smoking cessation at our hospital and its effect on local readmission rate, health resources utilization, and mortality.”
Dr. Ho has no relevant relationships to disclose.
SOURCE: Ho KS et al. CHEST 2019 October. doi: 10.1016/j.chest.2019.08.1551.
NEW ORLEANS – , according to a retrospective study.
The rate of readmission was significantly higher among patients with tobacco dependence, and tobacco dependence was independently associated with an increased risk of readmission.
“This is the first study to quantify the increased rate of hospital readmission due to smoking,” said study investigator Kam Sing Ho, MD, of Mount Sinai St. Luke’s and Mount Sinai West, New York.
Dr. Ho and colleagues described this study and its results in a poster presented at the annual meeting of the American College of Chest Physicians.
The researchers analyzed data on 168,891 hospital admissions of adults with PE, 34.2% of whom had tobacco dependence. Patients with and without tobacco dependence were propensity matched for baseline characteristics (n = 24,262 in each group).
The 30-day readmission rate was significantly higher in patients with tobacco dependence than in those without it – 11.0% and 8.9%, respectively (P less than .001). The most common reason for readmission in both groups was PE.
Dr. Ho said the higher readmission rate among patients with tobacco dependence might be explained by the fact that smokers have a higher level of fibrinogen, which may affect blood viscosity and contribute to thrombus formation (Proc Am Thorac Soc. 2005;2[1]:71-7).
The investigators also found that tobacco dependence was an independent predictor of readmission (hazard ratio, 1.43; P less than .001). And the mortality rate was significantly higher after readmission than after index admission – 6.27% and 3.15%, respectively (P less than .001).
The increased risk of readmission and death among smokers highlights the importance of smoking cessation services. Dr. Ho cited previous research suggesting these services are underused in the hospital setting (BMJ Qual Improv Rep. 2014;3[1]:u204964.w2110).
“Given that smoking is a common phenomenon among patients admitted with pulmonary embolism, we suggest that more rigorous smoking cessation services are implemented prior to discharge for all active smokers,” Dr. Ho said. “[P]atients have the right to be informed on the benefits of smoking cessation and the autonomy to choose. Future research will focus on implementing inpatient smoking cessation at our hospital and its effect on local readmission rate, health resources utilization, and mortality.”
Dr. Ho has no relevant relationships to disclose.
SOURCE: Ho KS et al. CHEST 2019 October. doi: 10.1016/j.chest.2019.08.1551.
REPORTING FROM CHEST 2019
Oral vs. IV antibiotic therapy in early treatment of complex bone and joint infections
Background: The standard of care for complex bone and joint infections includes the use of IV antibiotics. A prior meta-analysis suggested that the outcomes for bone and joint infections treated with oral and IV antibiotics are similar.
Study design: Randomized, controlled trial.
Setting: Twenty-six U.K. sites during June 2010–October 2015.
Synopsis: The study enrolled 1,054 adults with bone or joint infections who would have been treated with 6 weeks of IV antibiotics; they were then randomized to receive either IV or oral antibiotics. Treatment regimens were selected by infectious disease specialists. The rate of the primary endpoint, definite treatment failure at 1 year after randomization, was 14.6% in the intravenous group and 13.2% in the oral group. The difference in the risk of definite treatment failure between the two groups was –1.4% (95% confidence interval, –5.6 to 2.9), which met the predefined noninferiority criteria. The use of oral antibiotics also was associated with a shorter hospital stay and fewer complications. The conclusions of the trial are limited by the open-label design. An associated editorial advocated for additional research before widespread change to current treatment recommendations.
Bottom line: Bone and joint infections treated with oral versus IV antibiotics may have similar treatment failure rates.
Citation: Li HK et al. Oral versus intravenous antibiotics for bone and joint infection. N Eng J Med. 2019 Jan 31;380(5):425-36.
Dr. Roy is a hospitalist at Beth Israel Deaconess Medical Center and instructor in medicine at Harvard Medical School.
Better time data from in-hospital resuscitations
Benefits of an undocumented defibrillator feature
Research and quality improvement (QI) related to in-hospital cardiopulmonary resuscitation attempts (“codes” from here forward) are hampered significantly by the poor quality of data on time intervals from arrest onset to clinical interventions.1

In 2000, the American Heart Association’s (AHA) Emergency Cardiac Care Guidelines said that current data were inaccurate and that greater accuracy was “the key to future high-quality research”2 – but since then, the general situation has not improved: Time intervals reported by the national AHA-supported registry Get With the Guidelines–Resuscitation (GWTG-R, 200+ hospitals enrolled) include a figure from all hospitals for times to first defibrillation of 1 minute median and 0 minutes first interquartile.3 Such numbers are typical – when they are tracked at all – but they strain credulity, and prima facie evidence is available at most clinical simulation centers simply by timing simulated defibrillation attempts under realistic conditions, as in “mock codes.”4,5
Taking artificially short time-interval data from GWTG-R or other sources at face value can hide serious delays in response to in-hospital arrests. It can also lead to flawed studies and highly questionable conclusions.6
The key to accuracy of critical time intervals – the intervals from arrest to key interventions – is an accurate time of arrest.7 Codes are typically recorded in handwritten form, though they may later be transcribed or scanned into electronic records. The “start” of the code for unmonitored arrests and most monitored arrests is typically taken to be the time that a human bedside recorder, arriving at an unknown interval after the arrest, writes down the first intervention. Researchers acknowledged the problem of artificially short time intervals in 2005, but they did not propose a remedy.1 Since then, the problem of in-hospital resuscitation delays has received little to no attention in the professional literature.
Description of feature
To get better time data from unmonitored resuscitation attempts, it is necessary to use a “surrogate marker” – a stand-in or substitute event – for the time of arrest. This event should occur reliably for each code, and as near as possible to the actual time of arrest. The main early events in a code are starting basic CPR, paging the code, and moving the defibrillator (usually on a code cart) to the scene. Ideally these events occur almost simultaneously, but that is not consistently achieved.
There are significant problems with use of the first two events as surrogate markers: the time of starting CPR cannot be determined accurately, and paging the code is dependent on several intermediate steps that lead to inaccuracy. Furthermore, the times of both markers are recorded using clocks that are typically not synchronized with the clock used for recording the code (defibrillator clock or the human recorder’s timepiece). Reconciliation of these times with the code record, while not particularly difficult,8 is rarely if ever done.
Defibrillator Power On is recorded on the defibrillator timeline and thus does not need to be reconciled with the defibrillator clock, but it is not suitable as a surrogate marker because this time is highly variable: It often does not occur until the time that monitoring pads are placed. Moving the code cart to the scene, which must occur early in the code, is a much more valid surrogate marker, with the added benefit that it can be marked on the defibrillator timeline.
The undocumented feature described here provides that marker. This feature has been a part of the LIFEPAK 20/20e’s design since it was launched in 2002, but it has not been publicized until now and is not documented in the user manual.
Hospital defibrillators are connected to alternating-current (AC) power when not in use. When the defibrillator is moved to the scene of the code, it is obviously necessary to disconnect the defibrillator from the wall outlet, at which time “AC Power Loss” is recorded on the event record generated by the LIFEPAK 20/20e defibrillators. The defibrillator may be powered on up to 10 minutes later while retaining the AC Power Loss marker in the event record. This surrogate marker for the start time will be on the same timeline as other events recorded by the defibrillator, including times of first monitoring and shocks.
Once the event record is acquired, determining time intervals is accomplished by subtracting clock times (see example, Figure 1).
In the example, using AC Power Loss as the start time, time intervals from arrest to first monitoring (Initial Rhythm on the Event Record) and first shock were 3:12 (07:16:34 minus 07:13:22) and 8:42 (07:22:14 minus 07:13:22). Note that if Power On were used as the surrogate time of arrest in the example, the calculated intervals would be artificially shorter, by 2 min 12 sec.
Using this undocumented feature, any facility using LIFEPAK 20/20e defibrillators can easily measure critical time intervals during resuscitation attempts with much greater accuracy, including times to first monitoring and first defibrillation. Each defibrillator stores code summaries sufficient for dozens of events and accessing past data is simple. Analysis of the data can provide a much-improved measure of the facility’s speed of response as a baseline for QI.
If desired, the time-interval data thus obtained can also be integrated with the handwritten record. The usual handwritten code sheet records times only in whole minutes, but with one of the more accurate intervals from the defibrillator – to first monitoring or first defibrillation – an adjusted time of arrest can be added to any code record to get other intervals that better approximate real-world response times.9
Research prospects
The feature opens multiple avenues for future research. Acquiring data by this method should be simple for any facility using LIFEPAK 20/20e defibrillators as its standard devices. Matching the existing handwritten code records with the time intervals obtained using this surrogate time marker will show how inaccurate the commonly reported data are. This can be done with a retrospective study comparing the time intervals from the archived event records with those from the handwritten records, to provide an example of the inaccuracy of data reported in the medical literature. The more accurate picture of time intervals can provide a much-needed yardstick for future research aimed at shortening response times.
The feature can facilitate aggregation of data across multiple facilities that use the LIFEPAK 20/20e as their standard defibrillator. Also, it is possible that other defibrillator manufacturers will duplicate this feature with their devices – it should produce valid data with any defibrillator – although there may be legal and technical obstacles to adopting it.
Combining data from multiple sites might lead to an important contribution to resuscitation research: a reasonably accurate overall survival curve for in-hospital tachyarrhythmic arrests. A commonly cited but crude guideline is that survival from tachyarrhythmic arrests decreases by 10%-15% per minute as defibrillation is delayed,10 but it seems unlikely that the relationship would be linear: Experience and the literature suggest that survival drops very quickly in the first few minutes, flattening out as elapsed time after arrest increases. Aggregating the much more accurate time-interval data from multiple facilities should produce a survival curve for in-hospital tachyarrhythmic arrests that comes much closer to reality.
Conclusion
It is unknown whether this feature will be used to improve the accuracy of reported code response times. It greatly facilitates acquiring more accurate times, but the task has never been especially difficult – particularly when balanced with the importance of better time data for QI and research.8 One possible impediment may be institutional obstacles to publishing studies with accurate response times due to concerns about public relations or legal exposure: The more accurate times will almost certainly be longer than those generally reported.
As was stated almost 2 decades ago and remains true today, acquiring accurate time-interval data is “the key to future high-quality research.”2 It is also key to improving any hospital’s quality of code response. As described in this article, better time data can easily be acquired. It is time for this important problem to be recognized and remedied.
Mr. Stewart has worked as a hospital nurse in Seattle for many years, and has numerous publications to his credit related to resuscitation issues. You can contact him at jastewart325@gmail.com.
References
1. Kaye W et al. When minutes count – the fallacy of accurate time documentation during in-hospital resuscitation. Resuscitation. 2005;65(3):285-90.
2. The American Heart Association in collaboration with the International Liaison Committee on Resuscitation. Guidelines 2000 for Cardiopulmonary Resuscitation and Emergency Cardiovascular Care, Part 4: the automated external defibrillator: key link in the chain of survival. Circulation. 2000;102(8 Suppl):I-60-76.
3. Chan PS et al. American Heart Association National Registry of Cardiopulmonary Resuscitation Investigators. Delayed time to defibrillation after in-hospital cardiac arrest. N Engl J Med. 2008 Jan 3;358(1):9-17. doi: 10.1056/NEJMoa0706467.
4. Hunt EA et al. Simulation of in-hospital pediatric medical emergencies and cardiopulmonary arrests: Highlighting the importance of the first 5 minutes. Pediatrics. 2008;121(1):e34-e43. doi: 10.1542/peds.2007-0029.
5. Reeson M et al. Defibrillator design and usability may be impeding timely defibrillation. Comm J Qual Patient Saf. 2018 Sep;44(9):536-544. doi: 10.1016/j.jcjq.2018.01.005.
6. Hunt EA et al. American Heart Association’s Get With The Guidelines – Resuscitation Investigators. Association between time to defibrillation and survival in pediatric in-hospital cardiac arrest with a first documented shockable rhythm JAMA Netw Open. 2018;1(5):e182643. doi: 10.1001/jamanetworkopen.2018.2643.
7. Cummins RO et al. Recommended guidelines for reviewing, reporting, and conducting research on in-hospital resuscitation: the in-hospital “Utstein” style. Circulation. 1997;95:2213-39.
8. Stewart JA. Determining accurate call-to-shock times is easy. Resuscitation. 2005 Oct;67(1):150-1.
9. In infrequent cases, the code cart and defibrillator may be moved to a deteriorating patient before a full arrest. Such occurrences should be analyzed separately or excluded from analysis.
10. Valenzuela TD et al. Estimating effectiveness of cardiac arrest interventions: a logistic regression survival model. Circulation. 1997;96(10):3308-13. doi: 10.1161/01.cir.96.10.3308.
Benefits of an undocumented defibrillator feature
Benefits of an undocumented defibrillator feature
Research and quality improvement (QI) related to in-hospital cardiopulmonary resuscitation attempts (“codes” from here forward) are hampered significantly by the poor quality of data on time intervals from arrest onset to clinical interventions.1
In 2000, the American Heart Association’s (AHA) Emergency Cardiac Care Guidelines said that current data were inaccurate and that greater accuracy was “the key to future high-quality research”2 – but since then, the general situation has not improved: Time intervals reported by the national AHA-supported registry Get With the Guidelines–Resuscitation (GWTG-R, 200+ hospitals enrolled) include a figure from all hospitals for times to first defibrillation of 1 minute median and 0 minutes first interquartile.3 Such numbers are typical – when they are tracked at all – but they strain credulity, and prima facie evidence is available at most clinical simulation centers simply by timing simulated defibrillation attempts under realistic conditions, as in “mock codes.”4,5
Taking artificially short time-interval data from GWTG-R or other sources at face value can hide serious delays in response to in-hospital arrests. It can also lead to flawed studies and highly questionable conclusions.6
The key to accuracy of critical time intervals – the intervals from arrest to key interventions – is an accurate time of arrest.7 Codes are typically recorded in handwritten form, though they may later be transcribed or scanned into electronic records. The “start” of the code for unmonitored arrests and most monitored arrests is typically taken to be the time that a human bedside recorder, arriving at an unknown interval after the arrest, writes down the first intervention. Researchers acknowledged the problem of artificially short time intervals in 2005, but they did not propose a remedy.1 Since then, the problem of in-hospital resuscitation delays has received little to no attention in the professional literature.
Description of feature
To get better time data from unmonitored resuscitation attempts, it is necessary to use a “surrogate marker” – a stand-in or substitute event – for the time of arrest. This event should occur reliably for each code, and as near as possible to the actual time of arrest. The main early events in a code are starting basic CPR, paging the code, and moving the defibrillator (usually on a code cart) to the scene. Ideally these events occur almost simultaneously, but that is not consistently achieved.
There are significant problems with use of the first two events as surrogate markers: the time of starting CPR cannot be determined accurately, and paging the code is dependent on several intermediate steps that lead to inaccuracy. Furthermore, the times of both markers are recorded using clocks that are typically not synchronized with the clock used for recording the code (defibrillator clock or the human recorder’s timepiece). Reconciliation of these times with the code record, while not particularly difficult,8 is rarely if ever done.
Defibrillator Power On is recorded on the defibrillator timeline and thus does not need to be reconciled with the defibrillator clock, but it is not suitable as a surrogate marker because this time is highly variable: It often does not occur until the time that monitoring pads are placed. Moving the code cart to the scene, which must occur early in the code, is a much more valid surrogate marker, with the added benefit that it can be marked on the defibrillator timeline.
The undocumented feature described here provides that marker. This feature has been a part of the LIFEPAK 20/20e’s design since it was launched in 2002, but it has not been publicized until now and is not documented in the user manual.
Hospital defibrillators are connected to alternating-current (AC) power when not in use. When the defibrillator is moved to the scene of the code, it is obviously necessary to disconnect the defibrillator from the wall outlet, at which time “AC Power Loss” is recorded on the event record generated by the LIFEPAK 20/20e defibrillators. The defibrillator may be powered on up to 10 minutes later while retaining the AC Power Loss marker in the event record. This surrogate marker for the start time will be on the same timeline as other events recorded by the defibrillator, including times of first monitoring and shocks.
Once the event record is acquired, determining time intervals is accomplished by subtracting clock times (see example, Figure 1).
In the example, using AC Power Loss as the start time, time intervals from arrest to first monitoring (Initial Rhythm on the Event Record) and first shock were 3:12 (07:16:34 minus 07:13:22) and 8:42 (07:22:14 minus 07:13:22). Note that if Power On were used as the surrogate time of arrest in the example, the calculated intervals would be artificially shorter, by 2 min 12 sec.
Using this undocumented feature, any facility using LIFEPAK 20/20e defibrillators can easily measure critical time intervals during resuscitation attempts with much greater accuracy, including times to first monitoring and first defibrillation. Each defibrillator stores code summaries sufficient for dozens of events and accessing past data is simple. Analysis of the data can provide a much-improved measure of the facility’s speed of response as a baseline for QI.
If desired, the time-interval data thus obtained can also be integrated with the handwritten record. The usual handwritten code sheet records times only in whole minutes, but with one of the more accurate intervals from the defibrillator – to first monitoring or first defibrillation – an adjusted time of arrest can be added to any code record to get other intervals that better approximate real-world response times.9
Research prospects
The feature opens multiple avenues for future research. Acquiring data by this method should be simple for any facility using LIFEPAK 20/20e defibrillators as its standard devices. Matching the existing handwritten code records with the time intervals obtained using this surrogate time marker will show how inaccurate the commonly reported data are. This can be done with a retrospective study comparing the time intervals from the archived event records with those from the handwritten records, to provide an example of the inaccuracy of data reported in the medical literature. The more accurate picture of time intervals can provide a much-needed yardstick for future research aimed at shortening response times.
The feature can facilitate aggregation of data across multiple facilities that use the LIFEPAK 20/20e as their standard defibrillator. Also, it is possible that other defibrillator manufacturers will duplicate this feature with their devices – it should produce valid data with any defibrillator – although there may be legal and technical obstacles to adopting it.
Combining data from multiple sites might lead to an important contribution to resuscitation research: a reasonably accurate overall survival curve for in-hospital tachyarrhythmic arrests. A commonly cited but crude guideline is that survival from tachyarrhythmic arrests decreases by 10%-15% per minute as defibrillation is delayed,10 but it seems unlikely that the relationship would be linear: Experience and the literature suggest that survival drops very quickly in the first few minutes, flattening out as elapsed time after arrest increases. Aggregating the much more accurate time-interval data from multiple facilities should produce a survival curve for in-hospital tachyarrhythmic arrests that comes much closer to reality.
Conclusion
It is unknown whether this feature will be used to improve the accuracy of reported code response times. It greatly facilitates acquiring more accurate times, but the task has never been especially difficult – particularly when balanced with the importance of better time data for QI and research.8 One possible impediment may be institutional obstacles to publishing studies with accurate response times due to concerns about public relations or legal exposure: The more accurate times will almost certainly be longer than those generally reported.
As was stated almost 2 decades ago and remains true today, acquiring accurate time-interval data is “the key to future high-quality research.”2 It is also key to improving any hospital’s quality of code response. As described in this article, better time data can easily be acquired. It is time for this important problem to be recognized and remedied.
Mr. Stewart has worked as a hospital nurse in Seattle for many years, and has numerous publications to his credit related to resuscitation issues. You can contact him at jastewart325@gmail.com.
References
1. Kaye W et al. When minutes count – the fallacy of accurate time documentation during in-hospital resuscitation. Resuscitation. 2005;65(3):285-90.
2. The American Heart Association in collaboration with the International Liaison Committee on Resuscitation. Guidelines 2000 for Cardiopulmonary Resuscitation and Emergency Cardiovascular Care, Part 4: the automated external defibrillator: key link in the chain of survival. Circulation. 2000;102(8 Suppl):I-60-76.
3. Chan PS et al. American Heart Association National Registry of Cardiopulmonary Resuscitation Investigators. Delayed time to defibrillation after in-hospital cardiac arrest. N Engl J Med. 2008 Jan 3;358(1):9-17. doi: 10.1056/NEJMoa0706467.
4. Hunt EA et al. Simulation of in-hospital pediatric medical emergencies and cardiopulmonary arrests: Highlighting the importance of the first 5 minutes. Pediatrics. 2008;121(1):e34-e43. doi: 10.1542/peds.2007-0029.
5. Reeson M et al. Defibrillator design and usability may be impeding timely defibrillation. Comm J Qual Patient Saf. 2018 Sep;44(9):536-544. doi: 10.1016/j.jcjq.2018.01.005.
6. Hunt EA et al. American Heart Association’s Get With The Guidelines – Resuscitation Investigators. Association between time to defibrillation and survival in pediatric in-hospital cardiac arrest with a first documented shockable rhythm JAMA Netw Open. 2018;1(5):e182643. doi: 10.1001/jamanetworkopen.2018.2643.
7. Cummins RO et al. Recommended guidelines for reviewing, reporting, and conducting research on in-hospital resuscitation: the in-hospital “Utstein” style. Circulation. 1997;95:2213-39.
8. Stewart JA. Determining accurate call-to-shock times is easy. Resuscitation. 2005 Oct;67(1):150-1.
9. In infrequent cases, the code cart and defibrillator may be moved to a deteriorating patient before a full arrest. Such occurrences should be analyzed separately or excluded from analysis.
10. Valenzuela TD et al. Estimating effectiveness of cardiac arrest interventions: a logistic regression survival model. Circulation. 1997;96(10):3308-13. doi: 10.1161/01.cir.96.10.3308.