User login
Are psychiatrists more prepared for COVID-19 than we think?
Helping patients navigate surreal situations is what we do
A meme has been going around the Internet in which a Muppet is dressed as a doctor, and the caption declares: “If you don’t want to be intubated by a psychiatrist, stay home!” This meme is meant as a commentary on health care worker shortages. But it also touches on the concerns of psychiatrists who might be questioning our role in the pandemic, given that we are physicians who do not regularly rely on labs or imaging to guide treatment. And we rarely even touch our patients.

As observed by Henry A. Nasrallah, MD, editor in chief of Current Psychiatry, who referred to anxiety as endemic during a viral pandemic (Current Psychiatry. 2020 April;19[4]:e3-5), our society is experiencing intense psychological repercussions from the pandemic. These repercussions will evolve from anxiety to despair, and for some, to resilience.
All jokes aside about the medical knowledge of psychiatrists, we are on the cutting edge of how to address the pandemic of fear and uncertainty gripping individuals and society across the nation.
Isn’t it our role as psychiatrists to help people face the reality of personal and societal crises? Aren’t we trained to help people find their internal reserves, bolster them with medications and/or psychotherapy, and prepare them to respond to challenges? I propose that our training and particular experience of hearing patients’ stories has indeed prepared us to receive surreal information and package it into a palatable, even therapeutic, form for our patients.
I’d like to present two cases I’ve recently seen during the first stages of the COVID-19 pandemic juxtaposed with patients I saw during “normal” times. These cases show that, as psychiatrists, we are prepared to face the psychological impact of this crisis.
A patient called me about worsened anxiety after she’d been sidelined at home from her job as a waitress and was currently spending 12 hours a day with her overbearing mother. She had always used her work to buffer her anxiety, as the fast pace of the restaurant kept her from ruminating.
The call reminded me of ones I’d receive from female patients during the MeToo movement and particularly during the Brett Kavanaugh confirmation hearings for the Supreme Court, in which a sexual assault victim and alleged perpetrator faced off on television. During therapy and medication management sessions alike, I would talk to women struggling with the number of news stories about victims coming forward after sexual assault. They were reliving their humiliations, and despite the empowering nature of the movement, they felt vulnerable in the shadow of memories of their perpetrators.
The advice I gave then is similar to the guidance I give now, and also is closely related to the Centers for Disease Control and Prevention advice on its website on how to manage the mental health impact of COVID-19. People can be informed without suffering by taking these steps:
- Limit the amount of news and social media consumed, and if possible, try to schedule news consumption into discrete periods that are not close to bedtime or other periods meant for relaxation.
- Reach out to loved ones and friends who remind you of strength and better times.
- Make time to relax and unwind, either through resting or engaging in an activity you enjoy.
- Take care of your body and mind with exercise.
- Try for 8 hours of sleep a night (even if it doesn’t happen).
- Use techniques such as meditating, doing yoga, or breathing to practice focusing your attention somewhere.
All of our lives have been disrupted by COVID-19 and acknowledging this to patients can help them feel less isolated and vulnerable. Our patients with diagnosed psychiatric disorders will be more susceptible to crippling anxiety, exacerbations in panic attacks, obsessive-compulsive disorder symptoms, and resurgence of suicidal ideation in the face of uncertainty and despair. They may also be more likely to experience the socioeconomic fallout of this pandemic. But it’s not just these individuals who will be hit with intense feelings as we wonder what the next day, month, or 6 months hold for us, our families, our friends, our country, and our world.
Recently, I had one of the more surreal experiences of my professional life. I work as a consulation-liaison psychiatrist on the medical wards, and I was consulted to treat a young woman from Central America with schizophrenia who made a serious suicide attempt in mid-February before COVID-19 was part of the lexicon.
After an overdose, she developed aspiration pneumonia and acute respiratory distress syndrome and ended up in the ICU on a respirator for 3 weeks. Her doctors and family were certain she would die, but she miraculously survived. By the time she was extubated and less delirious from her medically induced coma, the hospital had restricted all visitors because of COVID-19.
Because I speak Spanish, we developed as decent a working relationship as we could, considering the patient’s delirium and blunted affect. On top of restarting her antipsychotics, I had to inform her that her family was no longer allowed to come visit her. Outside of this room, I vacillated on how to tell a woman with a history of paranoia that the hospital would not allow her family to visit because we were in the middle of a pandemic. A contagious virus had quickly spread around the world, cases were now spiking in the United States, much of the country was on lockdown, and the hospital was limiting visitors because asymptomatic individuals could bring the virus into the hospital or be infected by asymptomatic staff.
As the words came out of my mouth, she looked at me as I have looked at psychotic individuals as they spin me yarns of impossible explanation for their symptoms when I know they’re simply psychotic and living in an alternate reality. Imagine just waking up from a coma and your doctor coming in to tell you: “The U.S. is on lockdown because a deadly virus is spreading throughout our country.” You’d think you’ve woken up in a zombie film. Yet, the patient simply nodded and asked: “Will I be able to use the phone to call my family?” I sighed with relief and helped her dial her brother’s number.
Haven’t we all listened to insane stories while keeping a straight face and then answered with a politely bland question? Just a few months ago, I treated a homeless woman with schizophrenia who calmly explained to me that her large malignant ovarian tumor (which I could see protruding under her gown) was the unborn heir of Queen Victoria and Prince Albert. If she allowed the doctors to take it out (that is, treat her cancer) she’d be assassinated by the Russian intelligence agency. She refused to let the doctors sentence her to death. Ultimately, we allowed her to refuse treatment. Despite a month of treatment with antipsychotic medication, her psychotic beliefs did not change, and we could not imagine forcing her through surgery and chemotherapy. She died in hospice.
I’ve walked the valleys of bizarro land many times. Working through the dark reality of COVID-19 should be no match for us psychiatrists who have listened to dark stories and responded with words of comfort or empathic silence. As mental health clinicians, I believe we are well equipped to fight on the front lines of the pandemic of fear that has arrested our country. We can make ourselves available to our patients, friends, family, and institutions – medical or otherwise – that are grappling with how to cope with the psychological impact of COVID-19.
Dr. Posada is a consultation-liaison psychiatry fellow with the Inova Fairfax Hospital/George Washington University program in Falls Church, Va., and associate producer of the MDedge Psychcast. She changed key details about the patients discussed to protect their confidentiality. Dr. Posada has no conflicts of interest.
Helping patients navigate surreal situations is what we do
Helping patients navigate surreal situations is what we do
A meme has been going around the Internet in which a Muppet is dressed as a doctor, and the caption declares: “If you don’t want to be intubated by a psychiatrist, stay home!” This meme is meant as a commentary on health care worker shortages. But it also touches on the concerns of psychiatrists who might be questioning our role in the pandemic, given that we are physicians who do not regularly rely on labs or imaging to guide treatment. And we rarely even touch our patients.
As observed by Henry A. Nasrallah, MD, editor in chief of Current Psychiatry, who referred to anxiety as endemic during a viral pandemic (Current Psychiatry. 2020 April;19[4]:e3-5), our society is experiencing intense psychological repercussions from the pandemic. These repercussions will evolve from anxiety to despair, and for some, to resilience.
All jokes aside about the medical knowledge of psychiatrists, we are on the cutting edge of how to address the pandemic of fear and uncertainty gripping individuals and society across the nation.
Isn’t it our role as psychiatrists to help people face the reality of personal and societal crises? Aren’t we trained to help people find their internal reserves, bolster them with medications and/or psychotherapy, and prepare them to respond to challenges? I propose that our training and particular experience of hearing patients’ stories has indeed prepared us to receive surreal information and package it into a palatable, even therapeutic, form for our patients.
I’d like to present two cases I’ve recently seen during the first stages of the COVID-19 pandemic juxtaposed with patients I saw during “normal” times. These cases show that, as psychiatrists, we are prepared to face the psychological impact of this crisis.
A patient called me about worsened anxiety after she’d been sidelined at home from her job as a waitress and was currently spending 12 hours a day with her overbearing mother. She had always used her work to buffer her anxiety, as the fast pace of the restaurant kept her from ruminating.
The call reminded me of ones I’d receive from female patients during the MeToo movement and particularly during the Brett Kavanaugh confirmation hearings for the Supreme Court, in which a sexual assault victim and alleged perpetrator faced off on television. During therapy and medication management sessions alike, I would talk to women struggling with the number of news stories about victims coming forward after sexual assault. They were reliving their humiliations, and despite the empowering nature of the movement, they felt vulnerable in the shadow of memories of their perpetrators.
The advice I gave then is similar to the guidance I give now, and also is closely related to the Centers for Disease Control and Prevention advice on its website on how to manage the mental health impact of COVID-19. People can be informed without suffering by taking these steps:
- Limit the amount of news and social media consumed, and if possible, try to schedule news consumption into discrete periods that are not close to bedtime or other periods meant for relaxation.
- Reach out to loved ones and friends who remind you of strength and better times.
- Make time to relax and unwind, either through resting or engaging in an activity you enjoy.
- Take care of your body and mind with exercise.
- Try for 8 hours of sleep a night (even if it doesn’t happen).
- Use techniques such as meditating, doing yoga, or breathing to practice focusing your attention somewhere.
All of our lives have been disrupted by COVID-19 and acknowledging this to patients can help them feel less isolated and vulnerable. Our patients with diagnosed psychiatric disorders will be more susceptible to crippling anxiety, exacerbations in panic attacks, obsessive-compulsive disorder symptoms, and resurgence of suicidal ideation in the face of uncertainty and despair. They may also be more likely to experience the socioeconomic fallout of this pandemic. But it’s not just these individuals who will be hit with intense feelings as we wonder what the next day, month, or 6 months hold for us, our families, our friends, our country, and our world.
Recently, I had one of the more surreal experiences of my professional life. I work as a consulation-liaison psychiatrist on the medical wards, and I was consulted to treat a young woman from Central America with schizophrenia who made a serious suicide attempt in mid-February before COVID-19 was part of the lexicon.
After an overdose, she developed aspiration pneumonia and acute respiratory distress syndrome and ended up in the ICU on a respirator for 3 weeks. Her doctors and family were certain she would die, but she miraculously survived. By the time she was extubated and less delirious from her medically induced coma, the hospital had restricted all visitors because of COVID-19.
Because I speak Spanish, we developed as decent a working relationship as we could, considering the patient’s delirium and blunted affect. On top of restarting her antipsychotics, I had to inform her that her family was no longer allowed to come visit her. Outside of this room, I vacillated on how to tell a woman with a history of paranoia that the hospital would not allow her family to visit because we were in the middle of a pandemic. A contagious virus had quickly spread around the world, cases were now spiking in the United States, much of the country was on lockdown, and the hospital was limiting visitors because asymptomatic individuals could bring the virus into the hospital or be infected by asymptomatic staff.
As the words came out of my mouth, she looked at me as I have looked at psychotic individuals as they spin me yarns of impossible explanation for their symptoms when I know they’re simply psychotic and living in an alternate reality. Imagine just waking up from a coma and your doctor coming in to tell you: “The U.S. is on lockdown because a deadly virus is spreading throughout our country.” You’d think you’ve woken up in a zombie film. Yet, the patient simply nodded and asked: “Will I be able to use the phone to call my family?” I sighed with relief and helped her dial her brother’s number.
Haven’t we all listened to insane stories while keeping a straight face and then answered with a politely bland question? Just a few months ago, I treated a homeless woman with schizophrenia who calmly explained to me that her large malignant ovarian tumor (which I could see protruding under her gown) was the unborn heir of Queen Victoria and Prince Albert. If she allowed the doctors to take it out (that is, treat her cancer) she’d be assassinated by the Russian intelligence agency. She refused to let the doctors sentence her to death. Ultimately, we allowed her to refuse treatment. Despite a month of treatment with antipsychotic medication, her psychotic beliefs did not change, and we could not imagine forcing her through surgery and chemotherapy. She died in hospice.
I’ve walked the valleys of bizarro land many times. Working through the dark reality of COVID-19 should be no match for us psychiatrists who have listened to dark stories and responded with words of comfort or empathic silence. As mental health clinicians, I believe we are well equipped to fight on the front lines of the pandemic of fear that has arrested our country. We can make ourselves available to our patients, friends, family, and institutions – medical or otherwise – that are grappling with how to cope with the psychological impact of COVID-19.
Dr. Posada is a consultation-liaison psychiatry fellow with the Inova Fairfax Hospital/George Washington University program in Falls Church, Va., and associate producer of the MDedge Psychcast. She changed key details about the patients discussed to protect their confidentiality. Dr. Posada has no conflicts of interest.
Use of an Electronic Alert Tool to Prevent Readmissions Following Coronary Artery Bypass Graft Surgery
From the University of North Carolina at Wilmington School of Nursing (Dr. Smith and Dr. Turrise), the New Hanover Regional Medical Center Heart Center (Mr. Jordan), the Coastal Carolinas Health Alliance and Coastal Connect Health Information Exchange (Ms. Robertson), and Coastal Thoracic Surgical Associates (Dr. Kane), Wilmington, NC.
Abstract
Objective: Cardiothoracic (CT) surgeons at our medical center were not receiving timely notification when their coronary artery bypass graft (CABG) surgery patients were admitted to the medical center or to other hospitals. The CT surgical team worked with a health alliance in southeastern North Carolina to implement health information exchange (HIE) real-time electronic notifications for their CABG patients who presented to the hospital’s emergency department (ED) or any ED affiliated with the medical center. The alert tool notifies team members about patient encounters, driving timely clinical engagement.
Methods: The CT team provided the HIE team with the names of CABG surgery patients, which were loaded into the alert tool. When a patient on the list presented to the hospital ED or its affiliates, the alert tool sent a real-time electronic notification to the Cardiac Surgical Services nurse coordinator. This intervention prompted the assessment and disposition of CABG patients, while in the ED, by the CT surgical team.
Results: Over a 16-month period (September 2017-December 2018), the names of 614 post-CABG patients were input into the HIE for tracking. Of these patients, 47 were treated and discharged from the ED; 31 were admitted for observation; 44 were readmitted for inpatient care; and 492 did not have a qualifying event requiring a notification alert. Following implementation of this practice change, the 30-day readmission rate for patients who underwent CABG at our institution decreased from 10% to 7.2%.
Conclusion: Utilizing a real-time alert tool resulted in immediate notification of the CT team when 1 of their patients presented to the ED. This afforded the CT surgical team an opportunity to intervene in the care of their patients, which in turn led to improved quality of care, physician communication and collaboration, and patient outcomes, such as preventable 30-day readmissions.
Keywords: electronic health record; real-time electronic notification; CABG; process improvement.
Unplanned 30-day hospital readmissions of patients who have undergone coronary artery bypass graft (CABG) surgery contribute to higher overall health care costs. CABG is 1 of the conditions/procedures that the Centers for Medicare and Medicaid Services (CMS) monitors for excess readmissions.1 Readmission rates for CABG-related conditions at 30 days post-surgery are reported to be between 16% and 20% for US hospitals.2 Readmissions are not only financially costly, but also have been associated with worse patient outcomes and decreased patient satisfaction.3 Common diagnoses for post-CABG admission include atrial fibrillation, pleural effusion, and wound infection.
The facility where this project was implemented had a 10% post-CABG admission rate for patients across all payers. While this rate is below the national average of 13.2%, the cardiothoracic (CT) surgical team was not being notified in a timely manner when their post-CABG patients were readmitted. The Lean team used the A3 problem-solving process to develop strategies that would reduce these readmissions and improve the care of their patients.
We explored the use of electronic alerts in managing post-CABG patients by conducting a literature search using the terms electronic alerts in patient care, patient engagement in the emergency department, electronic alerts in CABG, real-time notifications to prevent readmission, and CABG readmission. Databases searched were PubMed, Google Scholar, Cumulative Index of Nursing and Allied Health Literature, ProQuest, and ScienceDirect. This search resulted in studies focused on the use of electronic health record (EHR) alerts as a clinical decision-support tool; for example, patient demographic and assessment data are entered into the EHR, and the clinician is prompted with “performance” recommendations (eg, consider electrocardiogram and aspirin).4 In a paper by Engelman and Benjamin,5 the authors discuss the importance of the engaged physician and note that, in their emergency department (ED), an electronic notification is sent when a postoperative patient presents; however, the notification goes to the inpatient service for timely review and disposition. There was no literature that discussed the use of an electronic alert tool as a real-time patient engagement strategy that resulted in a practice change specific to the CT surgical team.
Our process improvement project focused on alerting the CT surgical team when a post-CABG patient presented to the ED, allowing them to evaluate the patient in real time and determine whether the chief complaint was related to the CABG and whether further evaluation by the CT surgeon was required. Specifically, we wanted to determine whether a real-time electronic alert that notified the CT surgical team about post-op CABG patients presenting to the ED would result in timely patient engagement, avoidance of readmissions, and an enhanced patient experience. During this project, alerts were sent to the CT surgical team notifying them of a post-CABG patient presenting to the ED or being directly admitted from home on physician orders, a provider’s office, or inpatient rehabilitation; however, the focus of this article is specifically on the notification regarding post-CABG patients presenting to the ED.
Prior to implementing the electronic notification project, the team developed and implemented several internal and external readmission reduction and prevention strategies for CABG patients. An in-house strategy involved a process whereby patients would receive their discharge medications prior to being discharged from the hospital post-CABG, thereby avoiding potential delays in the patient obtaining medications. When examining post-CABG patient readmissions, the primary conditions that led to readmission were fluid overload, pleural effusion, and atrial fibrillation. As such, a second in-house strategy was developed for post-CABG patients presenting to the ED with atrial fibrillation. The newly established protocol allowed patients to be monitored and treated in the cardiac observation unit. In addition, external strategies, including an outpatient furosemide protocol for home health nurses and an outpatient thoracentesis program and order set, were established (eg, for patients with congestive heart failure, shortness of breath).
Methods
Setting
The regional medical center where this project was implemented is the ninth largest hospital in North Carolina and the largest county-owned public hospital in the state. It is a tertiary care center and teaching hospital with 3 hospital campuses and 855 licensed beds. The medical center was included in the 100 Safecare Hospitals list by the Safecare Group; received a grade “A” Hospital Safety Score from the Leapfrog Group; and is 1 of America’s Top 100 Hospitals for Patient Experience.
Real-Time Notification Project
A regional hospital alliance in southeastern North Carolina established a health information exchange (HIE) with its member hospitals and office-based physicians to enable electronic exchange of patient information to improve quality, safety, and efficiency in health care delivery. Our medical center is part of this alliance. The HIE is a digital platform that facilitates the sharing of information between disparate connected EHR systems, and offers a portal for practices and hospitals to access patient information across North Carolina, South Carolina (via SC HIE), and nationwide (select dialysis centers). More specifically, approved providers and team members are able to access, in real time, patient-care encounter documents from other care settings (eg, acute, post-acute, ambulatory) via the HIE. Additionally, approved care entities can query-retrieve web portal information to support patient outcome improvement strategies. A partnership discussion highlighted the opportunity to utilize the HIE’s capabilities, such as real-time notification, to facilitate workflow (eg, when a patient presents to the ED, the HIE can provide access to health information at the point of care). In this capacity, the alert tool notifies care team members about patient encounters to drive timely clinical engagement for care transitions.
In January 2017, we began discussions on using the HIE to facilitate real-time electronic tracking in the Cardiac Surgical Services department at our medical center. Persons involved in these discussions included the cardiovascular (CV) team (comprised of case managers, department managers and coordinators, program coordinators, administrators, and support services [eg, pre-admission testing and home health staff]) and CT surgeons. At that time, CABG readmissions were manually tracked, and the real-time notification tool was being used in other departments (eg, in case management for tracking readmissions). The entire team was part of the initial decision meeting to pursue this possibility. The CV team reached consensus in June 2017 and proposed extending the use of the alert tool to the post-CABG population presenting to the ED (or any ED affiliated with the medical center) or admitted directly to the medical center.
The HIE staff met with the Cardiac Surgical Services team to tailor and develop the logistics of the project, such as who would be notified and how. The goals of the project were to support appropriate care intervention, reduce preventable hospital readmissions, and improve quality of care through enhanced provider communication and engagement. To achieve these goals, on the day of discharge the Cardiac Surgical Services coordinator provided the HIE team with the names of patients who had undergone CABG surgery. This patient list was loaded into the alert tool and continually updated. At 31 days, patient names were removed from the list. When a patient on the list presented to the hospital ED, the alert tool sent 2 real-time electronic notifications, an email and a text message, to the Cardiac Surgical Services coordinator, noting that a patient event occurred. Personal information was not included in the alert in order to protect patient information and comply with Health Insurance Portability and Accountability Act regulations.
The alert prompted the Cardiac Surgical Services coordinator to securely access patient information to identify and, if necessary, visit the patient. Then, based on the information gathered by the Cardiac Surgical Services coordinator, a Situation-Background-Assessment-Recommendation report was relayed to the CT surgeon, who then determined whether intervention by the CT surgical team was warranted. This process, on average, took approximately 30 minutes to complete. This was a key change in processes, one that allowed post-CABG patients to be seen by the CT surgical team while in the ED. If the issue was related to the CABG surgery, the CT surgeons could then determine an appropriate course of action, including admission or implementation of another protocol, such as the home furosemide protocol. For patients directly admitted, the surgeon contacted the admitting provider to discuss the level of care required (ie, observation or inpatient admission and treatment).
Biweekly CV team meetings were conducted during the implementation of the real-time notification alert tool. At each meeting, updates were provided on notifications received, patients who were missed by the notification process, and how well the real-time alerts were working to enhance care and appropriate disposition.
Measurements
Clinical performance data included total notifications, total number of ED visits, ED disposition (inpatient admission, observation, discharge), total number of direct admissions, direct admissions to observation, direct inpatient admissions, and patients missed by the notification process (eg, due to data entry errors, omissions of information [suffix of junior or senior], as well as programming bugs). Finally, the number of observation admissions converted to inpatient admissions was collected and further analyzed to inform needed process changes.
The Cardiac Surgical Services coordinator collected, entered, and maintained data using Excel. Data were obtained from the EHR, recorded in Excel, and analyzed using basic descriptive statistics in an ongoing fashion. Particular attention was focused on problems with the notification process (eg, patients being missed due to errors in data entry) and summarizing information to keep the Cardiac Surgical Services team updated on the progress of the process improvement. This project did not require staff protections or considerations, and because this was not a research study Institutional Review Board approval was not required.
Results
This practice change was implemented in September 2017 and led to improvements in care quality, as evidenced by improved physician communication and collaboration. In the 16-month period from implementation through December 2018, the names of 614 post-CABG patients were input into the HIE for tracking. Of these patients, 47 were treated and discharged from the ED; 31 were admitted for observation; and 44 were readmitted for inpatient care. The remaining 492 patients did not have a qualifying event requiring a notification alert. Clinical performance data from this period included 70 ED visits, 21 direct admissions, 19 direct admissions to observation, 5 patients missed by the notification process, and 4 observation admissions converted to inpatient admissions. A reduction in the CABG readmission rate from 10% in September 2017 to 7.2% in December 2018 was also noted.
Discussion
The aim of this process improvement project was to determine whether a real-time electronic alert that notified the CT surgical team about post-op CABG patients presenting to the ED would result in timely patient engagement, avoidance of readmissions, and an enhanced patient experience. This practice change has been successful, following 16 months of implementation and process refinement. Integrating a real-time electronic alert with a supporting action plan and care protocols resulted in timely patient engagement and avoidance of readmission of post-CABG patients.
Early notification of possible post-CABG readmissions became a standard-of-care process within the Cardiac Surgical Services department, with expansion to all CT post-op patients. Leveraging HIE technology to support quality improvement processes was also viewed by other departments as relevant and beneficial. For example, the hospital stroke and orthopedic-spine teams established their own processes for receiving real-time alerts.
There were several lessons learned during this project. First, gaining 100% physician buy-in to collaborative communication proved to be critical to the project’s success. The CV team was surprised by the length of time (approximately 8-10 months) it took for the practice change to be adopted by the physicians. In part, some of this delay in adoption resulted from medical staff turnover, primarily in the medical resident training rotations. Collaborative communication was key. The CT surgeons spoke with ED leadership and hospitalist services to explain the readmission reduction project and the use of an electronic alert tool. The CT surgeons also communicated to the ED physicians, hospitalists, and cardiologists that the Cardiac Surgical Services coordinator would be involved in the process and discussions regarding patientss care. Additionally, the CT surgeons authored the furosemide protocol and then committed to its use in the home health setting, further highlighting the role of collaborative communication in avoiding readmissions.
Another key step in this quality improvement project was determining who should receive the alert notifications. At the onset of the project, all notifications were sent to 1 person, the Cardiac Surgical Services coordinator. While this seemed logical in the initial stage of the project, it was unsustainable, as the receipt of the alert and the subsequent notification of the CT surgeon depended on 1 person and their availability. Approximately 10 months into the project, the notification process was further refined, with the cardiovascular intensive care unit charge nurse becoming the point of contact for the alerts. The Cardiac Surgical Services coordinator, in collaboration with nursing leaders and CT surgeons, completed a Lean Standard Work template outlining the major steps and the associated responsibilities (for the cardiovascular intensive care unit charge nurse, CT surgeon and on-call surgeon, Cardiac Surgical Services coordinator) in the process of receiving notifications, collecting patient assessment data, and reporting notifications to the CT surgeons.
Establishing adequate support mechanisms during a practice change is also important. For instance, we had to dedicate personnel time for data collection and analysis and involve additional nursing or other qualified personnel in the new process to avoid depending on a single person for the project’s success. Additional considerations were establishing criteria for surgeon notification and defining an appropriate time frame for notification (eg, urgent versus next-day notifications). We accomplished these activities approximately 10 months into the project, after it became apparent at CV team meeting discussions that further clarification of criteria and timelines was needed.
Some aspects of the project unfolded as planned, while others presented opportunities for improvement. For example, the alert notification process worked as envisioned; however, as previously mentioned, the process needed to be more inclusive to ensure there is always a charge nurse on duty to receive the alert notification, rather than just the Cardiac Surgical Services coordinator, who may not always be at the hospital. The outpatient thoracentesis program was well planned and effectively implemented. This program provided an avenue for patients who had symptoms of pleural effusion to be treated in an outpatient setting, rather than requiring an inpatient stay. Opportunities for improvement included addressing the inconsistent use of the home health furosemide protocol (developed in 2016), and the need for continued interprofessional and interdepartmental communication and coordination. For example, we had to inform the ED physicians and staff who rotate or are new to the ED about established processes and protocols in place for managing post-CABG patients who present to the ED.
The primary limitation of this project was the inability to measure the enhanced patient experience, which was 1 of the stated project goals. This goal became secondary because of more pressing issues, specifically, interorganizational collaboration (eg, hospital EHR, HIE, and CT surgical team) and tailoring the functionality of the electronic alert tool to the project. Developing and implementing measures of enhanced patient experience were not feasible during this implementation. Additionally, because this was not a research study, it was not possible to determine cause and effect or to control for confounders, such as a sicker, older cohort with more comorbid conditions, during the comparison period. Finally, although this process improvement project was conducted at a regional medical center that is the only facility performing CABG within the region, patients may have presented to another facility for an event that led to a readmission. Because readmissions to other facilities could not be captured, it is possible that the actual readmission rate was higher than the rate reported here.
Conclusions and Implications
Utilizing a real-time alert from the HIE to the CT surgical team resulted in CT surgeons being immediately made aware when their patients presented to the ED, allowing the CT surgical team the opportunity to intervene, as appropriate, in the care of their patients. Furthermore, this real-time notification and intervention resulted in timely patient engagement and, in some cases, avoidance of readmissions. Currently, patients are monitored for readmission within 30 days of discharge. In the future, the time will expand to 91 days, in preparation for participation in the CMS bundle payment program for CABG surgery.
This practice change can be used in organizations that do not have or participate in a HIE. In fact, these real-time alert applications may be available through an EHR already in use within the organization. The use of the alert requires collaborative communication and having supporting protocols in place to guide decision-making and care of post-CABG patients presenting to the ED.
There appears to be a gap in the literature discussing the use of an electronic alert tool as a real-time patient engagement strategy for post-CABG patients presenting to the ED. As such, this project contributes important results and lessons learned for other hospital service lines/departments that might consider implementing a similar process. Next steps include designing and conducting methodologically rigorous research studies based on this process improvement project to examine mortality rates as an outcome, and designing a more specific measure of patient experience, as the Hospital Consumer Assessment of Healthcare Providers and Systems (HCAHPS) survey only provides hospital-level data.
Corresponding author: Stephanie D. Smith, PhD, RN, UNCW School of Nursing, 601 South College Road, Wilmington, NC 28403; smithsd@uncw.edu.
Funding disclosures: None.
1. Hannan EL, Zhong Y, Lahey SJ, et al. 30-day readmissions after coronary artery bypass graft surgery in New York State. JACC Cardiovasc Interv. 2011;4:569-576.
2. Feng TR, White R, Gaber-Baylis L, et al. Coronary artery bypass graft readmission rates and risk factors- A retrospective cohort study. Int J Surg. 2018;54 (Part A):7-17.
3. Donndorf P, Kaminski A. “Return to sender” or “consider it done”?! The importance of reducing hospital readmission after coronary artery bypass grafting. J Thorac Cardiovasc Surg. 2017;154:1298-1299.
4. Sequist TD, Morong SM, Marston A, et al. Electronic risk alerts to improve primary care management of chest pain: A randomized, controlled trial. J Gen Intern Med. 2012;27:438-444.
5. Engelman D, Benjamin EM. Physician engagement: The “secret sauce” to success in bundled health care. Am J Med Qual. 2018;33:100-102.
From the University of North Carolina at Wilmington School of Nursing (Dr. Smith and Dr. Turrise), the New Hanover Regional Medical Center Heart Center (Mr. Jordan), the Coastal Carolinas Health Alliance and Coastal Connect Health Information Exchange (Ms. Robertson), and Coastal Thoracic Surgical Associates (Dr. Kane), Wilmington, NC.
Abstract
Objective: Cardiothoracic (CT) surgeons at our medical center were not receiving timely notification when their coronary artery bypass graft (CABG) surgery patients were admitted to the medical center or to other hospitals. The CT surgical team worked with a health alliance in southeastern North Carolina to implement health information exchange (HIE) real-time electronic notifications for their CABG patients who presented to the hospital’s emergency department (ED) or any ED affiliated with the medical center. The alert tool notifies team members about patient encounters, driving timely clinical engagement.
Methods: The CT team provided the HIE team with the names of CABG surgery patients, which were loaded into the alert tool. When a patient on the list presented to the hospital ED or its affiliates, the alert tool sent a real-time electronic notification to the Cardiac Surgical Services nurse coordinator. This intervention prompted the assessment and disposition of CABG patients, while in the ED, by the CT surgical team.
Results: Over a 16-month period (September 2017-December 2018), the names of 614 post-CABG patients were input into the HIE for tracking. Of these patients, 47 were treated and discharged from the ED; 31 were admitted for observation; 44 were readmitted for inpatient care; and 492 did not have a qualifying event requiring a notification alert. Following implementation of this practice change, the 30-day readmission rate for patients who underwent CABG at our institution decreased from 10% to 7.2%.
Conclusion: Utilizing a real-time alert tool resulted in immediate notification of the CT team when 1 of their patients presented to the ED. This afforded the CT surgical team an opportunity to intervene in the care of their patients, which in turn led to improved quality of care, physician communication and collaboration, and patient outcomes, such as preventable 30-day readmissions.
Keywords: electronic health record; real-time electronic notification; CABG; process improvement.
Unplanned 30-day hospital readmissions of patients who have undergone coronary artery bypass graft (CABG) surgery contribute to higher overall health care costs. CABG is 1 of the conditions/procedures that the Centers for Medicare and Medicaid Services (CMS) monitors for excess readmissions.1 Readmission rates for CABG-related conditions at 30 days post-surgery are reported to be between 16% and 20% for US hospitals.2 Readmissions are not only financially costly, but also have been associated with worse patient outcomes and decreased patient satisfaction.3 Common diagnoses for post-CABG admission include atrial fibrillation, pleural effusion, and wound infection.
The facility where this project was implemented had a 10% post-CABG admission rate for patients across all payers. While this rate is below the national average of 13.2%, the cardiothoracic (CT) surgical team was not being notified in a timely manner when their post-CABG patients were readmitted. The Lean team used the A3 problem-solving process to develop strategies that would reduce these readmissions and improve the care of their patients.
We explored the use of electronic alerts in managing post-CABG patients by conducting a literature search using the terms electronic alerts in patient care, patient engagement in the emergency department, electronic alerts in CABG, real-time notifications to prevent readmission, and CABG readmission. Databases searched were PubMed, Google Scholar, Cumulative Index of Nursing and Allied Health Literature, ProQuest, and ScienceDirect. This search resulted in studies focused on the use of electronic health record (EHR) alerts as a clinical decision-support tool; for example, patient demographic and assessment data are entered into the EHR, and the clinician is prompted with “performance” recommendations (eg, consider electrocardiogram and aspirin).4 In a paper by Engelman and Benjamin,5 the authors discuss the importance of the engaged physician and note that, in their emergency department (ED), an electronic notification is sent when a postoperative patient presents; however, the notification goes to the inpatient service for timely review and disposition. There was no literature that discussed the use of an electronic alert tool as a real-time patient engagement strategy that resulted in a practice change specific to the CT surgical team.
Our process improvement project focused on alerting the CT surgical team when a post-CABG patient presented to the ED, allowing them to evaluate the patient in real time and determine whether the chief complaint was related to the CABG and whether further evaluation by the CT surgeon was required. Specifically, we wanted to determine whether a real-time electronic alert that notified the CT surgical team about post-op CABG patients presenting to the ED would result in timely patient engagement, avoidance of readmissions, and an enhanced patient experience. During this project, alerts were sent to the CT surgical team notifying them of a post-CABG patient presenting to the ED or being directly admitted from home on physician orders, a provider’s office, or inpatient rehabilitation; however, the focus of this article is specifically on the notification regarding post-CABG patients presenting to the ED.
Prior to implementing the electronic notification project, the team developed and implemented several internal and external readmission reduction and prevention strategies for CABG patients. An in-house strategy involved a process whereby patients would receive their discharge medications prior to being discharged from the hospital post-CABG, thereby avoiding potential delays in the patient obtaining medications. When examining post-CABG patient readmissions, the primary conditions that led to readmission were fluid overload, pleural effusion, and atrial fibrillation. As such, a second in-house strategy was developed for post-CABG patients presenting to the ED with atrial fibrillation. The newly established protocol allowed patients to be monitored and treated in the cardiac observation unit. In addition, external strategies, including an outpatient furosemide protocol for home health nurses and an outpatient thoracentesis program and order set, were established (eg, for patients with congestive heart failure, shortness of breath).
Methods
Setting
The regional medical center where this project was implemented is the ninth largest hospital in North Carolina and the largest county-owned public hospital in the state. It is a tertiary care center and teaching hospital with 3 hospital campuses and 855 licensed beds. The medical center was included in the 100 Safecare Hospitals list by the Safecare Group; received a grade “A” Hospital Safety Score from the Leapfrog Group; and is 1 of America’s Top 100 Hospitals for Patient Experience.
Real-Time Notification Project
A regional hospital alliance in southeastern North Carolina established a health information exchange (HIE) with its member hospitals and office-based physicians to enable electronic exchange of patient information to improve quality, safety, and efficiency in health care delivery. Our medical center is part of this alliance. The HIE is a digital platform that facilitates the sharing of information between disparate connected EHR systems, and offers a portal for practices and hospitals to access patient information across North Carolina, South Carolina (via SC HIE), and nationwide (select dialysis centers). More specifically, approved providers and team members are able to access, in real time, patient-care encounter documents from other care settings (eg, acute, post-acute, ambulatory) via the HIE. Additionally, approved care entities can query-retrieve web portal information to support patient outcome improvement strategies. A partnership discussion highlighted the opportunity to utilize the HIE’s capabilities, such as real-time notification, to facilitate workflow (eg, when a patient presents to the ED, the HIE can provide access to health information at the point of care). In this capacity, the alert tool notifies care team members about patient encounters to drive timely clinical engagement for care transitions.
In January 2017, we began discussions on using the HIE to facilitate real-time electronic tracking in the Cardiac Surgical Services department at our medical center. Persons involved in these discussions included the cardiovascular (CV) team (comprised of case managers, department managers and coordinators, program coordinators, administrators, and support services [eg, pre-admission testing and home health staff]) and CT surgeons. At that time, CABG readmissions were manually tracked, and the real-time notification tool was being used in other departments (eg, in case management for tracking readmissions). The entire team was part of the initial decision meeting to pursue this possibility. The CV team reached consensus in June 2017 and proposed extending the use of the alert tool to the post-CABG population presenting to the ED (or any ED affiliated with the medical center) or admitted directly to the medical center.
The HIE staff met with the Cardiac Surgical Services team to tailor and develop the logistics of the project, such as who would be notified and how. The goals of the project were to support appropriate care intervention, reduce preventable hospital readmissions, and improve quality of care through enhanced provider communication and engagement. To achieve these goals, on the day of discharge the Cardiac Surgical Services coordinator provided the HIE team with the names of patients who had undergone CABG surgery. This patient list was loaded into the alert tool and continually updated. At 31 days, patient names were removed from the list. When a patient on the list presented to the hospital ED, the alert tool sent 2 real-time electronic notifications, an email and a text message, to the Cardiac Surgical Services coordinator, noting that a patient event occurred. Personal information was not included in the alert in order to protect patient information and comply with Health Insurance Portability and Accountability Act regulations.
The alert prompted the Cardiac Surgical Services coordinator to securely access patient information to identify and, if necessary, visit the patient. Then, based on the information gathered by the Cardiac Surgical Services coordinator, a Situation-Background-Assessment-Recommendation report was relayed to the CT surgeon, who then determined whether intervention by the CT surgical team was warranted. This process, on average, took approximately 30 minutes to complete. This was a key change in processes, one that allowed post-CABG patients to be seen by the CT surgical team while in the ED. If the issue was related to the CABG surgery, the CT surgeons could then determine an appropriate course of action, including admission or implementation of another protocol, such as the home furosemide protocol. For patients directly admitted, the surgeon contacted the admitting provider to discuss the level of care required (ie, observation or inpatient admission and treatment).
Biweekly CV team meetings were conducted during the implementation of the real-time notification alert tool. At each meeting, updates were provided on notifications received, patients who were missed by the notification process, and how well the real-time alerts were working to enhance care and appropriate disposition.
Measurements
Clinical performance data included total notifications, total number of ED visits, ED disposition (inpatient admission, observation, discharge), total number of direct admissions, direct admissions to observation, direct inpatient admissions, and patients missed by the notification process (eg, due to data entry errors, omissions of information [suffix of junior or senior], as well as programming bugs). Finally, the number of observation admissions converted to inpatient admissions was collected and further analyzed to inform needed process changes.
The Cardiac Surgical Services coordinator collected, entered, and maintained data using Excel. Data were obtained from the EHR, recorded in Excel, and analyzed using basic descriptive statistics in an ongoing fashion. Particular attention was focused on problems with the notification process (eg, patients being missed due to errors in data entry) and summarizing information to keep the Cardiac Surgical Services team updated on the progress of the process improvement. This project did not require staff protections or considerations, and because this was not a research study Institutional Review Board approval was not required.
Results
This practice change was implemented in September 2017 and led to improvements in care quality, as evidenced by improved physician communication and collaboration. In the 16-month period from implementation through December 2018, the names of 614 post-CABG patients were input into the HIE for tracking. Of these patients, 47 were treated and discharged from the ED; 31 were admitted for observation; and 44 were readmitted for inpatient care. The remaining 492 patients did not have a qualifying event requiring a notification alert. Clinical performance data from this period included 70 ED visits, 21 direct admissions, 19 direct admissions to observation, 5 patients missed by the notification process, and 4 observation admissions converted to inpatient admissions. A reduction in the CABG readmission rate from 10% in September 2017 to 7.2% in December 2018 was also noted.
Discussion
The aim of this process improvement project was to determine whether a real-time electronic alert that notified the CT surgical team about post-op CABG patients presenting to the ED would result in timely patient engagement, avoidance of readmissions, and an enhanced patient experience. This practice change has been successful, following 16 months of implementation and process refinement. Integrating a real-time electronic alert with a supporting action plan and care protocols resulted in timely patient engagement and avoidance of readmission of post-CABG patients.
Early notification of possible post-CABG readmissions became a standard-of-care process within the Cardiac Surgical Services department, with expansion to all CT post-op patients. Leveraging HIE technology to support quality improvement processes was also viewed by other departments as relevant and beneficial. For example, the hospital stroke and orthopedic-spine teams established their own processes for receiving real-time alerts.
There were several lessons learned during this project. First, gaining 100% physician buy-in to collaborative communication proved to be critical to the project’s success. The CV team was surprised by the length of time (approximately 8-10 months) it took for the practice change to be adopted by the physicians. In part, some of this delay in adoption resulted from medical staff turnover, primarily in the medical resident training rotations. Collaborative communication was key. The CT surgeons spoke with ED leadership and hospitalist services to explain the readmission reduction project and the use of an electronic alert tool. The CT surgeons also communicated to the ED physicians, hospitalists, and cardiologists that the Cardiac Surgical Services coordinator would be involved in the process and discussions regarding patientss care. Additionally, the CT surgeons authored the furosemide protocol and then committed to its use in the home health setting, further highlighting the role of collaborative communication in avoiding readmissions.
Another key step in this quality improvement project was determining who should receive the alert notifications. At the onset of the project, all notifications were sent to 1 person, the Cardiac Surgical Services coordinator. While this seemed logical in the initial stage of the project, it was unsustainable, as the receipt of the alert and the subsequent notification of the CT surgeon depended on 1 person and their availability. Approximately 10 months into the project, the notification process was further refined, with the cardiovascular intensive care unit charge nurse becoming the point of contact for the alerts. The Cardiac Surgical Services coordinator, in collaboration with nursing leaders and CT surgeons, completed a Lean Standard Work template outlining the major steps and the associated responsibilities (for the cardiovascular intensive care unit charge nurse, CT surgeon and on-call surgeon, Cardiac Surgical Services coordinator) in the process of receiving notifications, collecting patient assessment data, and reporting notifications to the CT surgeons.
Establishing adequate support mechanisms during a practice change is also important. For instance, we had to dedicate personnel time for data collection and analysis and involve additional nursing or other qualified personnel in the new process to avoid depending on a single person for the project’s success. Additional considerations were establishing criteria for surgeon notification and defining an appropriate time frame for notification (eg, urgent versus next-day notifications). We accomplished these activities approximately 10 months into the project, after it became apparent at CV team meeting discussions that further clarification of criteria and timelines was needed.
Some aspects of the project unfolded as planned, while others presented opportunities for improvement. For example, the alert notification process worked as envisioned; however, as previously mentioned, the process needed to be more inclusive to ensure there is always a charge nurse on duty to receive the alert notification, rather than just the Cardiac Surgical Services coordinator, who may not always be at the hospital. The outpatient thoracentesis program was well planned and effectively implemented. This program provided an avenue for patients who had symptoms of pleural effusion to be treated in an outpatient setting, rather than requiring an inpatient stay. Opportunities for improvement included addressing the inconsistent use of the home health furosemide protocol (developed in 2016), and the need for continued interprofessional and interdepartmental communication and coordination. For example, we had to inform the ED physicians and staff who rotate or are new to the ED about established processes and protocols in place for managing post-CABG patients who present to the ED.
The primary limitation of this project was the inability to measure the enhanced patient experience, which was 1 of the stated project goals. This goal became secondary because of more pressing issues, specifically, interorganizational collaboration (eg, hospital EHR, HIE, and CT surgical team) and tailoring the functionality of the electronic alert tool to the project. Developing and implementing measures of enhanced patient experience were not feasible during this implementation. Additionally, because this was not a research study, it was not possible to determine cause and effect or to control for confounders, such as a sicker, older cohort with more comorbid conditions, during the comparison period. Finally, although this process improvement project was conducted at a regional medical center that is the only facility performing CABG within the region, patients may have presented to another facility for an event that led to a readmission. Because readmissions to other facilities could not be captured, it is possible that the actual readmission rate was higher than the rate reported here.
Conclusions and Implications
Utilizing a real-time alert from the HIE to the CT surgical team resulted in CT surgeons being immediately made aware when their patients presented to the ED, allowing the CT surgical team the opportunity to intervene, as appropriate, in the care of their patients. Furthermore, this real-time notification and intervention resulted in timely patient engagement and, in some cases, avoidance of readmissions. Currently, patients are monitored for readmission within 30 days of discharge. In the future, the time will expand to 91 days, in preparation for participation in the CMS bundle payment program for CABG surgery.
This practice change can be used in organizations that do not have or participate in a HIE. In fact, these real-time alert applications may be available through an EHR already in use within the organization. The use of the alert requires collaborative communication and having supporting protocols in place to guide decision-making and care of post-CABG patients presenting to the ED.
There appears to be a gap in the literature discussing the use of an electronic alert tool as a real-time patient engagement strategy for post-CABG patients presenting to the ED. As such, this project contributes important results and lessons learned for other hospital service lines/departments that might consider implementing a similar process. Next steps include designing and conducting methodologically rigorous research studies based on this process improvement project to examine mortality rates as an outcome, and designing a more specific measure of patient experience, as the Hospital Consumer Assessment of Healthcare Providers and Systems (HCAHPS) survey only provides hospital-level data.
Corresponding author: Stephanie D. Smith, PhD, RN, UNCW School of Nursing, 601 South College Road, Wilmington, NC 28403; smithsd@uncw.edu.
Funding disclosures: None.
1. Hannan EL, Zhong Y, Lahey SJ, et al. 30-day readmissions after coronary artery bypass graft surgery in New York State. JACC Cardiovasc Interv. 2011;4:569-576.
2. Feng TR, White R, Gaber-Baylis L, et al. Coronary artery bypass graft readmission rates and risk factors- A retrospective cohort study. Int J Surg. 2018;54 (Part A):7-17.
3. Donndorf P, Kaminski A. “Return to sender” or “consider it done”?! The importance of reducing hospital readmission after coronary artery bypass grafting. J Thorac Cardiovasc Surg. 2017;154:1298-1299.
4. Sequist TD, Morong SM, Marston A, et al. Electronic risk alerts to improve primary care management of chest pain: A randomized, controlled trial. J Gen Intern Med. 2012;27:438-444.
5. Engelman D, Benjamin EM. Physician engagement: The “secret sauce” to success in bundled health care. Am J Med Qual. 2018;33:100-102.
Factors Associated With Lower-Extremity Amputation in Patients With Diabetic Foot Ulcers
From Northwell Health System, Lake Success, NY.
Abstract
- Objective: To explore factors associated with lower-extremity amputation (LEA) in patients with diabetic foot ulcers using data from the Online Wound Electronic Medical Record Database.
- Design: Retrospective analysis of medical records.
- Setting and participants: Data from 169 individuals with previously diagnosed diabetes mellitus who received wound care for a 6-month period within a span of 2 years was analyzed. A baseline evaluation was obtained and wound(s) were treated, managed, and monitored.
Treatment continued until the patient healed, required an LEA, or phased out of the study, neither healing nor undergoing an amputation. Of the 149 patients who completed the study, 38 had healed ulcers, 14 underwent amputation, and 97 neither healed nor underwent an amputation. All patients were treated under the care of vascular and/or podiatric surgeons. - Measurements: Variables included wound status (healed, amputated, and unhealed/non-amputated); size of wound area; age, gender, race, and ethnicity; white blood cell (WBC) count, hemoglobin A1c (HbA1c), blood glucose, and body mass index (BMI); and presence of osteomyelitis, gangrene, and peripheral vascular disease.
- Results: As compared to the healed and unhealed/non-amputated group, the group of patients who underwent LEA was older and had higher percentages of males, Hispanics, and African Americans; had a higher WBC count, larger wound area, and higher rates of wound infection, osteomyelitis, and neuropathy; and had lower average values of HbA1c, blood glucose, and BMI and a lower rate of peripheral vascular disease.
- Conclusion: The association between HbA1c and LEA highlights a window of relative safety among an at-risk population. By identifying and focusing on factors associated with LEA, health care professionals may be able to decrease the prevalence of LEA in patients with diabetes.
Keywords: diabetic foot ulcer; lower-extremity amputation; risk factors; HbA1c.
An estimated 30.3 million people, or 9.4% of the US population, has diabetes. In 2014, approximately 108,000 amputations were performed on adults with diagnosed diabetes.1 Furthermore, patients with diabetes have a 10-fold increased risk for lower-extremity amputation (LEA), as compared with patients without diabetes.2 The frequency of amputations in the diabetic population is a public health crisis.
Amputation has significant, life-altering consequences. Patients who undergo LEA often face debilitation in their daily activities and must undergo intense rehabilitation to learn basic tasks. Amputations can also impact individuals’ psychological well-being as they come to terms with their altered body and may face challenges in self-perception, confidence, self-esteem, work life, and relationships. In addition, the mortality rate for patients with diabetes 5 years after undergoing LEA is 30%.2 However, public health studies estimate that more than half of LEAs in patients with diabetes are preventable.3
Although studies have explored the relationship between diabetes and LEA, few have sought to identify factors directly correlated with wound care. In the United States, patients with diabetic ulcerations are typically treated in wound care facilities; however, previous studies have concentrated on the conditions that lead to the formation of an ulcer or amputation, viewing amputation and ulcer as 2 separate entities. Our study took into account systemic variables, patient demographics, and specific wound characteristics to explore factors associated with LEA in a high-risk group of patients with diabetes. This study was designed to assess ailments that are prevalent in patients who require a LEA.
Methods
Patients and Setting
A total of 169 patients who were treated at the Comprehensive Wound Healing and Hyperbaric Center (Lake Success, NY), a tertiary facility of the Northwell Health system, participated in this retrospective study. The data for this study were obtained in conjunction with the development of the New York University School of Medicine’s Online Wound Electronic Medical Record to Decrease Limb Amputations in Persons with Diabetes (OWEMR) database. The OWEMR collects individual patient data from satellite locations across the country. Using this database, researchers can analyze similarities and differences between patients who undergo LEA.
This study utilized patient data specific to the Northwell Health facility. All of the patients in our study were enrolled under the criteria of the OWEMR database. In order to be included in the OWEMR database, patients had to be diagnosed with type 1 or type 2 diabetes; have a break in the skin ≥ 0.5 cm2; be 18 years of age or older; and have a measured hemoglobin A1c (HbA1c) value within the past 120 days. Study patients signed an informed consent and committed to being available for follow-up visits to the wound care facility for 6 months after entering the study. Patients were enrolled between 2012 and 2014, and each patient was monitored for a period of 6 months within this time period. Participants were treated with current standards of care using diet, lifestyle, and pharmacologic interventions. This study was approved by the Northwell Health System Institutional Review Board Human Research Protection Program (Manhasset, NY).
Data Collection
On their first visit to the facility, patients were given a physical examination and initial interview regarding their medical history. Clinicians were required to select 1 ulcer that would be examined for the duration of the study. The selection of the ulcer was based on a point system that awarded points for pedal pulses, the ability to be probed to the bone, the location of the ulcer (ie, located on the foot rather than a toe), and the presence of multiple ulcerations. The ulcer with the highest score was selected for the study. If numerous ulcers were evaluated with the same score, the largest and deepest was selected. Wagner classification of the wound was recorded at baseline and taken at each subsequent patient visit. In addition, peripheral sensation was assessed for signs of neuropathy using Semmes-Weinstein monofilament testing.
Once selected, the wound was clinically evaluated, samples for culture were obtained, and blood tests were performed to detect the presence of wound infection. The patient’s blood was drawn for a full laboratory analysis, including white blood cell (WBC) count and measurement of blood glucose and HbA1c levels. Bone biopsy, magnetic resonance imaging, and bone scans were used to detect the presence of osteomyelitis at the discretion of the health care provider. Wounds suspected of infection, underlying osteomyelitis, or gangrene at baseline were excluded. Patients would then return for follow-up visits at least once every 6 weeks, plus or minus 2 weeks, for a maximum of 6 months.
Statistical Analysis
Utilizing SAS version 9.3 (Cary, NC), descriptive statistics (minimum, maximum, mean, median, and SD) were calculated for the following variables: age, WBC count, wound area, HbA1c, blood glucose, and body mass index (BMI). These variables were collected for each patient as per the OWEMR protocol and provided a basis for which to compare patients who underwent amputation and those who did not. Twenty patients were lost to follow-up, and therefore we altered the window of our statistics from 6 months to 3 months to provide the most accurate data, as 6-month follow-up data were limited. The patients were classified into the following categories: healed, amputated, and unhealed/non-amputated. Descriptive statistics were calculated for these 3 groups, analyzing the same variables (age, WBC count, wound area, HbA1c, blood glucose, and BMI). Additional statistical computations were utilized in order to show the prevalence and frequency of our categorical variables: gender, race, ethnicity, osteomyelitis, gangrene, and peripheral vascular disease. The baseline values of WBC count, HbA1c, wound area, and BMI of the 3 groups were analyzed with descriptive statistics for comparison. A multinomial logistic regression was then performed using a 3-level outcome variable: healed, amputated, or unhealed/non-amputated. Each predictor variable was analyzed independently due to the small sample size.
Results
Of the 169 registered patients treated at the Northwell Health facility, all qualified for the OWEMR study and met the study criteria. In the original 169 patients, there were 19 amputations: 6 toe, 6 trans-metatarsal, 6 below knee, and 1 above knee (Table 1). 
The descriptive statistics of 149 patients grouped into 3 categories (healed, amputated, unhealed/non-amputated) are shown in Table 2.

The results of the logistic regression exploring the differences between the amputation and healed groups and the unhealed/non-amputated group are shown in Table 3. The amputation group had a higher mean age and WBC count and greater wound area. Increased age was determined to be a significant predictor of the odds of amputation (P = 0.0089). For each year increase in age, the odds of amputation increased by 6.5% (odds ratio, 1.07 [95% confidence interval {CI}, 1.02-1.12]). Patients in the amputation group were more likely to be male, Hispanic, and African American and to have wound infections and comorbidities (osteomyelitis, neuropathy, and gangrene).
")
The presence of gangrene was significantly associated with LEA (P = 0.03). Specifically, the odds of patients without gangrene undergoing a LEA were substantially lower compared with their counterparts with gangrene (odds ratio, 0.17; 95% CI, 0.04-0.68; P = 0.0131). However, the presence of gangrene was not associated with the odds of healing compared with the odds of neither healing nor undergoing amputation (P = 0.84; not shown in Table 3).
The amputation group had lower mean values for HbA1c, BMI, and blood glucose levels and a lower rate of peripheral vascular disease. Only the relationship between lower HbA1c and increased odds of amputation versus not healing/non-amputation was found to be statistically significant (95% CI, 0.27-0.78; P = 0.009).
Discussion
This retrospective study was undertaken to evaluate factors associated with LEA in patients with diabetic foot ulcers. Patients with diabetes being treated at a wound care facility often require continuous surgical and metabolic intervention to promote optimal healing: drainage, surgical debridement, irrigation, culturing for infection, and monitoring of blood glucose levels. This treatment requires strict compliance with medical directions and, oftentimes, additional care, such as home-care nursing visits, to maintain a curative environment for the wound. Frequently, wounds on the lower extremity further complicate the healing process by reducing the patient’s mobility and daily life. Due to these factors, many patients progress to LEA. The link between diabetic ulcers and amputation has already been well described in previous studies, with studies showing that history of diabetic foot ulcer significantly predisposes an individual to LEA.4 However, few studies have further investigated demographic factors associated with risk for an amputation. Our study analyzed several categories of patient data taken from a baseline visit. We found that those with highly elevated HbA1c values were less likely to have an amputation than persons with relatively lower levels, a finding that is contrary to previous studies.
Our study’s findings suggest a higher risk for LEA with increased age. The amputation group was, on average, 7 years older than the other 2 groups. A recent study showed that risk for amputation is directly correlated to patient age, as is the mortality rate after undergoing LEA (2.3%; P < 0.05).5 Our study found that with each increase in age of 1 year, the odds of amputation increased by 6.5%. However, recent evidence on LEA risk and aging suggests that age is of less consequence than the duration of diabetes. One study found that the propensity to develop diabetic foot ulcers increases with the duration of diabetes.6 The same study found that prevalence of ulceration was correlated with age, but the relationship between age and LEA was less significant. A follow-up study for LEA could be done to examine the role of disease duration versus age in LEA.
A consensus among previous studies is that men have a higher risk for LEA.5,7 Men comprised the majority in all 3 groups in our study. In addition, the amputation group in our study had the lowest BMI. Higher BMI generally is associated with an increased risk for health complications. However, a past study conducted in Taiwan reported that obese patients with diabetes were less likely to undergo LEA than those within the normal range for BMI.8 Neither study suggests that obesity is a deterrent for LEA, but both studies may suggest that risk of amputation may approach a maximum frequency at a specific BMI range, and then decrease. This unconfirmed “cyclic” relationship should be evaluated further in a larger sample size.
Most patients in our analysis were Caucasian, followed by African American and South Asian. African Americans were the only racial group with an increased frequency in the amputation group. This finding is supported by a previous study that found that the rate of LEA among patients with diabetes in low-income, predominantly African-American neighborhoods was nearly double that in wealthier, predominantly Caucasian areas.9 A potential problem in the comparison between our data with previous studies is that the studies did not analyze patients with our inclusion criteria. All patients with diabetes in previous investigations were grouped by race, but were not necessarily required to have 1 or more ulcers. Multiple ulcers may predispose an individual to a greater risk for amputation.
Multinomial logistic regression did not suggest an association between initial size of a patient’s wound and the risk of amputation. However, the descriptive data suggests a trend. Patients who did not heal or require an amputation had the largest average wound area. This finding is not surprising in that our study followed individuals for only 3 months. Many wounds require a long course of treatment, especially in patients with diabetes, who may have poor vascularization. However, in comparison to the healed patients, the patients who required an amputation had a larger average wound area. A larger wound requires a plentiful vascular supply for the delivery of clotting factors and nutrients to the damaged area. As wound size increases, an individual’s body must transmit an increased quantity of these factors and nutrients for the regeneration of tissue. In addition, wounds that possess a larger surface area require more debridement and present a greater opportunity for infection. This may also foreshadow a longer, more costly course of treatment. Additionally, individuals coping with large ulcerations are burdened by more elaborate and complex wound dressings.
Elevated levels of HbA1c are associated with increased adverse effects of diabetes, including end-stage renal disease, neuropathy, and infection.10 In a previous study, the risk for amputation was 1.2 times higher in patients with elevated HbA1c.11 In contrast, our study suggested the odds of LEA versus not healing/not undergoing amputation decreased as HbA1c increased. As a patient’s HbA1c level increased by a value of 1, their odds for LEA decreased by 54.3%. This finding contradicts prior studies that have found a positive association between HbA1c and LEA risk, including a study where each percentage increase in HbA1c correlated with a 13% to 15% increased risk of LEA.12 The finding that patients who underwent amputation in our study had lower levels of HbA1c and blood glucose cannot be fully explained. The maximum HbA1c value in the amputated group was 7.9%. The average values for healed patients and those who underwent LEA were 8.75% and 6.77%, respectively.
Blood glucose levels were also found to be the lowest in the amputated group in our study (mean, 149.29 mg/dL vs 163.19 mg/dL in the healed group). Similar results were found in a Brazilian study, in which patients who did not require amputation had higher HbA1c levels. This study also found an association between blood glucose levels above 200 mg/dL and amputations.3 These findings provide interesting opportunities for repeat studies, preferably with a larger number of participants.
Our study is limited by the small sample size. The sample population had to be reduced, as many patients were lost to follow-up. Although this paring down of the sample size can introduce bias, we are confident that our study is representative of the demographic of patients treated in our facility. The loss of patients to follow-up in turn caused the window of analysis to be narrowed, as long-term outcome data were not available. A multisite study observing various population samples can better explore the relationship between HbA1c and risk of amputation.
Conclusion
This retrospective study exploring factors associated with LEA was unique in that all our participants had 1 or more diabetic foot ulcerations, and thus already had an extremely high risk for amputation, in contrast to previous studies that followed persons at risk for developing diabetic foot ulcerations. In contrast to several previous studies, we found that the risk for amputation actually decreased as baseline measurements of HbA1c increased. The results of this study offer many opportunities for future investigations, preferably with a larger sample size. By further isolating and scrutinizing specific factors associated with LEA, researchers can help clinicians focus on providing wound care that promotes limb salvage.
Corresponding author: Alisha Oropallo, MD, MS, Northwell Health Comprehensive Wound Care Healing Center and Hyperbarics, 1999 Marcus Avenue, Suite M6, Lake Success, NY 11042; aoropallo@northwell.edu.
Financial disclosures: Funding for this research was provided by a multi-institutional AHRQ governmental grant.
1. Centers for Disease Control and Prevention. National Diabetes Statistics Report: Estimates of Diabetes and Its Burden in the United States, 2017. Atlanta, GA: US Department of Health and Human Services; 2017.
2. Uccioli L, Giurato L, Meloni M, et al. Comment on Hoffstad et al. Diabetes, lower-extremity amputation, and death. Diabetes Care. 2015;38:1852-1857.
3. Gamba MA, Gotlieb SLD, Bergamaschi DP, Vianna LAC. Lower extremity amputations in diabetic patients: a case-control study. Rev Saúde Pública. 2004;38:399-404.
4. Martins-Mendes D, Monteiro-Soares M, Boyko EJ, et al. The independent contribution of diabetic foot ulcer on lower extremity amputation and mortality risk. J Diabetes Complications. 2014;28:632-638.
5. Lipsky BA, Weigelt JA, Sun X, et al. Developing and validating a risk score for lower-extremity amputation in patients hospitalized for a diabetic foot infection. Diabetes Care. 2011;34:1695-1700.
6. Al-Rubeaan K, Al Derwish M, Ouizi S, et al. Diabetic foot complications and their risk factors from a large retrospective cohort study. PLoS One. 2015;10:e0124446.
7. Pickwell K, Siersma V, Kars M, et al. Predictors of lower-extremity amputation in patients with an infected diabetic foot ulcer. Diabetes Care. 2015;38:852-857.
8. Lin C, Hsu BR, Tsai J, et al. Effect of limb preservation status and body mass index on the survival of patients with limb-threatening diabetic foot ulcers. J Diabetes Complications. 2017;31:180-185.
9. Stevens CD, Schriger DL, Raffetto B, et al. Geographic clustering of diabetic lower-extremity amputations in low-income regions of California. Health Aff. 2014;33:1383-1390.
10. Liao L, Li C, Liu C, et al. Extreme levels of HbA1c increase incident ESRD risk in Chinese patients with type 2 diabetes: competing risk analysis in national cohort of Taiwan diabetes study. PLoS One. 2015; 10:e0130828.
11. Miyajima S, Shirai A, Yamamoto S, et al. Risk factors for major limb amputations in diabetic foot gangrene patients. Diabetes Res Clin Pract. 2006;71:272-279.
12. Zhao W, Katzmarzyk PT, Horswell R, et al. HbA1c and lower-extremity amputation risk in low-income patients with diabetes. Diabetes Care. 2013;36:3591-3598.
From Northwell Health System, Lake Success, NY.
Abstract
- Objective: To explore factors associated with lower-extremity amputation (LEA) in patients with diabetic foot ulcers using data from the Online Wound Electronic Medical Record Database.
- Design: Retrospective analysis of medical records.
- Setting and participants: Data from 169 individuals with previously diagnosed diabetes mellitus who received wound care for a 6-month period within a span of 2 years was analyzed. A baseline evaluation was obtained and wound(s) were treated, managed, and monitored.
Treatment continued until the patient healed, required an LEA, or phased out of the study, neither healing nor undergoing an amputation. Of the 149 patients who completed the study, 38 had healed ulcers, 14 underwent amputation, and 97 neither healed nor underwent an amputation. All patients were treated under the care of vascular and/or podiatric surgeons. - Measurements: Variables included wound status (healed, amputated, and unhealed/non-amputated); size of wound area; age, gender, race, and ethnicity; white blood cell (WBC) count, hemoglobin A1c (HbA1c), blood glucose, and body mass index (BMI); and presence of osteomyelitis, gangrene, and peripheral vascular disease.
- Results: As compared to the healed and unhealed/non-amputated group, the group of patients who underwent LEA was older and had higher percentages of males, Hispanics, and African Americans; had a higher WBC count, larger wound area, and higher rates of wound infection, osteomyelitis, and neuropathy; and had lower average values of HbA1c, blood glucose, and BMI and a lower rate of peripheral vascular disease.
- Conclusion: The association between HbA1c and LEA highlights a window of relative safety among an at-risk population. By identifying and focusing on factors associated with LEA, health care professionals may be able to decrease the prevalence of LEA in patients with diabetes.
Keywords: diabetic foot ulcer; lower-extremity amputation; risk factors; HbA1c.
An estimated 30.3 million people, or 9.4% of the US population, has diabetes. In 2014, approximately 108,000 amputations were performed on adults with diagnosed diabetes.1 Furthermore, patients with diabetes have a 10-fold increased risk for lower-extremity amputation (LEA), as compared with patients without diabetes.2 The frequency of amputations in the diabetic population is a public health crisis.
Amputation has significant, life-altering consequences. Patients who undergo LEA often face debilitation in their daily activities and must undergo intense rehabilitation to learn basic tasks. Amputations can also impact individuals’ psychological well-being as they come to terms with their altered body and may face challenges in self-perception, confidence, self-esteem, work life, and relationships. In addition, the mortality rate for patients with diabetes 5 years after undergoing LEA is 30%.2 However, public health studies estimate that more than half of LEAs in patients with diabetes are preventable.3
Although studies have explored the relationship between diabetes and LEA, few have sought to identify factors directly correlated with wound care. In the United States, patients with diabetic ulcerations are typically treated in wound care facilities; however, previous studies have concentrated on the conditions that lead to the formation of an ulcer or amputation, viewing amputation and ulcer as 2 separate entities. Our study took into account systemic variables, patient demographics, and specific wound characteristics to explore factors associated with LEA in a high-risk group of patients with diabetes. This study was designed to assess ailments that are prevalent in patients who require a LEA.
Methods
Patients and Setting
A total of 169 patients who were treated at the Comprehensive Wound Healing and Hyperbaric Center (Lake Success, NY), a tertiary facility of the Northwell Health system, participated in this retrospective study. The data for this study were obtained in conjunction with the development of the New York University School of Medicine’s Online Wound Electronic Medical Record to Decrease Limb Amputations in Persons with Diabetes (OWEMR) database. The OWEMR collects individual patient data from satellite locations across the country. Using this database, researchers can analyze similarities and differences between patients who undergo LEA.
This study utilized patient data specific to the Northwell Health facility. All of the patients in our study were enrolled under the criteria of the OWEMR database. In order to be included in the OWEMR database, patients had to be diagnosed with type 1 or type 2 diabetes; have a break in the skin ≥ 0.5 cm2; be 18 years of age or older; and have a measured hemoglobin A1c (HbA1c) value within the past 120 days. Study patients signed an informed consent and committed to being available for follow-up visits to the wound care facility for 6 months after entering the study. Patients were enrolled between 2012 and 2014, and each patient was monitored for a period of 6 months within this time period. Participants were treated with current standards of care using diet, lifestyle, and pharmacologic interventions. This study was approved by the Northwell Health System Institutional Review Board Human Research Protection Program (Manhasset, NY).
Data Collection
On their first visit to the facility, patients were given a physical examination and initial interview regarding their medical history. Clinicians were required to select 1 ulcer that would be examined for the duration of the study. The selection of the ulcer was based on a point system that awarded points for pedal pulses, the ability to be probed to the bone, the location of the ulcer (ie, located on the foot rather than a toe), and the presence of multiple ulcerations. The ulcer with the highest score was selected for the study. If numerous ulcers were evaluated with the same score, the largest and deepest was selected. Wagner classification of the wound was recorded at baseline and taken at each subsequent patient visit. In addition, peripheral sensation was assessed for signs of neuropathy using Semmes-Weinstein monofilament testing.
Once selected, the wound was clinically evaluated, samples for culture were obtained, and blood tests were performed to detect the presence of wound infection. The patient’s blood was drawn for a full laboratory analysis, including white blood cell (WBC) count and measurement of blood glucose and HbA1c levels. Bone biopsy, magnetic resonance imaging, and bone scans were used to detect the presence of osteomyelitis at the discretion of the health care provider. Wounds suspected of infection, underlying osteomyelitis, or gangrene at baseline were excluded. Patients would then return for follow-up visits at least once every 6 weeks, plus or minus 2 weeks, for a maximum of 6 months.
Statistical Analysis
Utilizing SAS version 9.3 (Cary, NC), descriptive statistics (minimum, maximum, mean, median, and SD) were calculated for the following variables: age, WBC count, wound area, HbA1c, blood glucose, and body mass index (BMI). These variables were collected for each patient as per the OWEMR protocol and provided a basis for which to compare patients who underwent amputation and those who did not. Twenty patients were lost to follow-up, and therefore we altered the window of our statistics from 6 months to 3 months to provide the most accurate data, as 6-month follow-up data were limited. The patients were classified into the following categories: healed, amputated, and unhealed/non-amputated. Descriptive statistics were calculated for these 3 groups, analyzing the same variables (age, WBC count, wound area, HbA1c, blood glucose, and BMI). Additional statistical computations were utilized in order to show the prevalence and frequency of our categorical variables: gender, race, ethnicity, osteomyelitis, gangrene, and peripheral vascular disease. The baseline values of WBC count, HbA1c, wound area, and BMI of the 3 groups were analyzed with descriptive statistics for comparison. A multinomial logistic regression was then performed using a 3-level outcome variable: healed, amputated, or unhealed/non-amputated. Each predictor variable was analyzed independently due to the small sample size.
Results
Of the 169 registered patients treated at the Northwell Health facility, all qualified for the OWEMR study and met the study criteria. In the original 169 patients, there were 19 amputations: 6 toe, 6 trans-metatarsal, 6 below knee, and 1 above knee (Table 1).
The descriptive statistics of 149 patients grouped into 3 categories (healed, amputated, unhealed/non-amputated) are shown in Table 2.
The results of the logistic regression exploring the differences between the amputation and healed groups and the unhealed/non-amputated group are shown in Table 3. The amputation group had a higher mean age and WBC count and greater wound area. Increased age was determined to be a significant predictor of the odds of amputation (P = 0.0089). For each year increase in age, the odds of amputation increased by 6.5% (odds ratio, 1.07 [95% confidence interval {CI}, 1.02-1.12]). Patients in the amputation group were more likely to be male, Hispanic, and African American and to have wound infections and comorbidities (osteomyelitis, neuropathy, and gangrene).
The presence of gangrene was significantly associated with LEA (P = 0.03). Specifically, the odds of patients without gangrene undergoing a LEA were substantially lower compared with their counterparts with gangrene (odds ratio, 0.17; 95% CI, 0.04-0.68; P = 0.0131). However, the presence of gangrene was not associated with the odds of healing compared with the odds of neither healing nor undergoing amputation (P = 0.84; not shown in Table 3).
The amputation group had lower mean values for HbA1c, BMI, and blood glucose levels and a lower rate of peripheral vascular disease. Only the relationship between lower HbA1c and increased odds of amputation versus not healing/non-amputation was found to be statistically significant (95% CI, 0.27-0.78; P = 0.009).
Discussion
This retrospective study was undertaken to evaluate factors associated with LEA in patients with diabetic foot ulcers. Patients with diabetes being treated at a wound care facility often require continuous surgical and metabolic intervention to promote optimal healing: drainage, surgical debridement, irrigation, culturing for infection, and monitoring of blood glucose levels. This treatment requires strict compliance with medical directions and, oftentimes, additional care, such as home-care nursing visits, to maintain a curative environment for the wound. Frequently, wounds on the lower extremity further complicate the healing process by reducing the patient’s mobility and daily life. Due to these factors, many patients progress to LEA. The link between diabetic ulcers and amputation has already been well described in previous studies, with studies showing that history of diabetic foot ulcer significantly predisposes an individual to LEA.4 However, few studies have further investigated demographic factors associated with risk for an amputation. Our study analyzed several categories of patient data taken from a baseline visit. We found that those with highly elevated HbA1c values were less likely to have an amputation than persons with relatively lower levels, a finding that is contrary to previous studies.
Our study’s findings suggest a higher risk for LEA with increased age. The amputation group was, on average, 7 years older than the other 2 groups. A recent study showed that risk for amputation is directly correlated to patient age, as is the mortality rate after undergoing LEA (2.3%; P < 0.05).5 Our study found that with each increase in age of 1 year, the odds of amputation increased by 6.5%. However, recent evidence on LEA risk and aging suggests that age is of less consequence than the duration of diabetes. One study found that the propensity to develop diabetic foot ulcers increases with the duration of diabetes.6 The same study found that prevalence of ulceration was correlated with age, but the relationship between age and LEA was less significant. A follow-up study for LEA could be done to examine the role of disease duration versus age in LEA.
A consensus among previous studies is that men have a higher risk for LEA.5,7 Men comprised the majority in all 3 groups in our study. In addition, the amputation group in our study had the lowest BMI. Higher BMI generally is associated with an increased risk for health complications. However, a past study conducted in Taiwan reported that obese patients with diabetes were less likely to undergo LEA than those within the normal range for BMI.8 Neither study suggests that obesity is a deterrent for LEA, but both studies may suggest that risk of amputation may approach a maximum frequency at a specific BMI range, and then decrease. This unconfirmed “cyclic” relationship should be evaluated further in a larger sample size.
Most patients in our analysis were Caucasian, followed by African American and South Asian. African Americans were the only racial group with an increased frequency in the amputation group. This finding is supported by a previous study that found that the rate of LEA among patients with diabetes in low-income, predominantly African-American neighborhoods was nearly double that in wealthier, predominantly Caucasian areas.9 A potential problem in the comparison between our data with previous studies is that the studies did not analyze patients with our inclusion criteria. All patients with diabetes in previous investigations were grouped by race, but were not necessarily required to have 1 or more ulcers. Multiple ulcers may predispose an individual to a greater risk for amputation.
Multinomial logistic regression did not suggest an association between initial size of a patient’s wound and the risk of amputation. However, the descriptive data suggests a trend. Patients who did not heal or require an amputation had the largest average wound area. This finding is not surprising in that our study followed individuals for only 3 months. Many wounds require a long course of treatment, especially in patients with diabetes, who may have poor vascularization. However, in comparison to the healed patients, the patients who required an amputation had a larger average wound area. A larger wound requires a plentiful vascular supply for the delivery of clotting factors and nutrients to the damaged area. As wound size increases, an individual’s body must transmit an increased quantity of these factors and nutrients for the regeneration of tissue. In addition, wounds that possess a larger surface area require more debridement and present a greater opportunity for infection. This may also foreshadow a longer, more costly course of treatment. Additionally, individuals coping with large ulcerations are burdened by more elaborate and complex wound dressings.
Elevated levels of HbA1c are associated with increased adverse effects of diabetes, including end-stage renal disease, neuropathy, and infection.10 In a previous study, the risk for amputation was 1.2 times higher in patients with elevated HbA1c.11 In contrast, our study suggested the odds of LEA versus not healing/not undergoing amputation decreased as HbA1c increased. As a patient’s HbA1c level increased by a value of 1, their odds for LEA decreased by 54.3%. This finding contradicts prior studies that have found a positive association between HbA1c and LEA risk, including a study where each percentage increase in HbA1c correlated with a 13% to 15% increased risk of LEA.12 The finding that patients who underwent amputation in our study had lower levels of HbA1c and blood glucose cannot be fully explained. The maximum HbA1c value in the amputated group was 7.9%. The average values for healed patients and those who underwent LEA were 8.75% and 6.77%, respectively.
Blood glucose levels were also found to be the lowest in the amputated group in our study (mean, 149.29 mg/dL vs 163.19 mg/dL in the healed group). Similar results were found in a Brazilian study, in which patients who did not require amputation had higher HbA1c levels. This study also found an association between blood glucose levels above 200 mg/dL and amputations.3 These findings provide interesting opportunities for repeat studies, preferably with a larger number of participants.
Our study is limited by the small sample size. The sample population had to be reduced, as many patients were lost to follow-up. Although this paring down of the sample size can introduce bias, we are confident that our study is representative of the demographic of patients treated in our facility. The loss of patients to follow-up in turn caused the window of analysis to be narrowed, as long-term outcome data were not available. A multisite study observing various population samples can better explore the relationship between HbA1c and risk of amputation.
Conclusion
This retrospective study exploring factors associated with LEA was unique in that all our participants had 1 or more diabetic foot ulcerations, and thus already had an extremely high risk for amputation, in contrast to previous studies that followed persons at risk for developing diabetic foot ulcerations. In contrast to several previous studies, we found that the risk for amputation actually decreased as baseline measurements of HbA1c increased. The results of this study offer many opportunities for future investigations, preferably with a larger sample size. By further isolating and scrutinizing specific factors associated with LEA, researchers can help clinicians focus on providing wound care that promotes limb salvage.
Corresponding author: Alisha Oropallo, MD, MS, Northwell Health Comprehensive Wound Care Healing Center and Hyperbarics, 1999 Marcus Avenue, Suite M6, Lake Success, NY 11042; aoropallo@northwell.edu.
Financial disclosures: Funding for this research was provided by a multi-institutional AHRQ governmental grant.
1. Centers for Disease Control and Prevention. National Diabetes Statistics Report: Estimates of Diabetes and Its Burden in the United States, 2017. Atlanta, GA: US Department of Health and Human Services; 2017.
2. Uccioli L, Giurato L, Meloni M, et al. Comment on Hoffstad et al. Diabetes, lower-extremity amputation, and death. Diabetes Care. 2015;38:1852-1857.
3. Gamba MA, Gotlieb SLD, Bergamaschi DP, Vianna LAC. Lower extremity amputations in diabetic patients: a case-control study. Rev Saúde Pública. 2004;38:399-404.
4. Martins-Mendes D, Monteiro-Soares M, Boyko EJ, et al. The independent contribution of diabetic foot ulcer on lower extremity amputation and mortality risk. J Diabetes Complications. 2014;28:632-638.
5. Lipsky BA, Weigelt JA, Sun X, et al. Developing and validating a risk score for lower-extremity amputation in patients hospitalized for a diabetic foot infection. Diabetes Care. 2011;34:1695-1700.
6. Al-Rubeaan K, Al Derwish M, Ouizi S, et al. Diabetic foot complications and their risk factors from a large retrospective cohort study. PLoS One. 2015;10:e0124446.
7. Pickwell K, Siersma V, Kars M, et al. Predictors of lower-extremity amputation in patients with an infected diabetic foot ulcer. Diabetes Care. 2015;38:852-857.
8. Lin C, Hsu BR, Tsai J, et al. Effect of limb preservation status and body mass index on the survival of patients with limb-threatening diabetic foot ulcers. J Diabetes Complications. 2017;31:180-185.
9. Stevens CD, Schriger DL, Raffetto B, et al. Geographic clustering of diabetic lower-extremity amputations in low-income regions of California. Health Aff. 2014;33:1383-1390.
10. Liao L, Li C, Liu C, et al. Extreme levels of HbA1c increase incident ESRD risk in Chinese patients with type 2 diabetes: competing risk analysis in national cohort of Taiwan diabetes study. PLoS One. 2015; 10:e0130828.
11. Miyajima S, Shirai A, Yamamoto S, et al. Risk factors for major limb amputations in diabetic foot gangrene patients. Diabetes Res Clin Pract. 2006;71:272-279.
12. Zhao W, Katzmarzyk PT, Horswell R, et al. HbA1c and lower-extremity amputation risk in low-income patients with diabetes. Diabetes Care. 2013;36:3591-3598.
Impact of Hospitalists on Care Outcomes in a Large Integrated Health System in British Columbia
From the Fraser Health Authority, Surrey, British Columbia, Canada.
Abstract
- Objective: To study care outcomes associated with a network of hospitalist services compared to traditional providers.
- Design: Retrospective review of administrative data.
- Setting and participants: Patients from a large integrated health care system in British Columbia in western Canada admitted and cared for by 3 provider groups between April 1, 2012, and March 31, 2018: hospitalists, family physicians (FP), and internal medicine (IM) physicians:
- Measurements: Average total length of stay (LOS), 30-day readmission, in-hospital mortality, and hospital standardized mortality ratio (HSMR) were the study outcome measures. Multiple logistic regression or generalized regression were completed to determine the relationship between provider groups and outcomes.
- Results: A total of 248,412 hospitalizations were included. Compared to patients admitted to hospitalists, patients admitted to other providers had higher odds of mortality (odds ratio [OR] for FP, 1.29; 95% confidence interval [CI], 1.21-1.37; OR for IM, 1.24; 95% CI, 1.15-1.33). Compared to hospitalist care, FP care was associated with higher readmission (OR, 1.27; 95% CI, 1.22-1.33), while IM care showed lower odds of readmission (OR, 0.83; 95% CI, 0.79-0.87). Patients admitted to the IM group had significantly lower total LOS (mean, 5.13 days; 95% CI, 5.04-5.21) compared to patients admitted to hospitalists (mean, 7.37 days; CI, 7.26-7.49) and FPs (mean, 7.30 days; 95% CI, 7.19-7.41). In a subgroup analysis of patients presenting with congestive heart failure, chronic obstructive pulmonary disease, and pneumonia, these general tendencies broadly persisted for mortality and LOS comparisons between FPs and hospitalists, but results were mixed for hospital readmissions.
- Conclusion: Care provided by hospitalists was associated with lower mortality and readmission rates compared with care provided by FPs, despite similar LOS. These findings may reflect differences in volume of services delivered by individual physicians, on-site availability to address urgent medical issues, and evolving specialization of clinical and nonclinical care processes in the acute care setting.
Keywords: hospital medicine; length of stay; readmission; mortality.
The hospitalist model of care has undergone rapid growth globally in recent years.1 The first hospitalist programs in Canada began around the same time as those in the United States and share many similarities in design and operations with their counterparts.2-4 However, unlike in the United States, where the hospitalist model has successfully established itself as an emerging specialty, debates about the merits of the model and its value proposition continue among Canadian observers.5-9
Historically, the type of physicians who acted as the most responsible provider (MRP) in Canadian hospitals depended on setting and geography.10 In large urban areas, groups of general internists or specialists have historically looked after general medicine patients as part of university-affiliated teaching services.11,12 Patients admitted to community hospitals have traditionally been cared for by their own primary care providers, typically general practitioners or family physicians (FPs). In the mid-1990s, many primary care providers in urban centers began to withdraw from inpatient care and primarily focused their practices in the outpatient setting.13-15 Hospitalist programs emerged as health care administrators sought to fill the resulting gap in MRP coverage.2,10
To date, attempts to understand the impact of hospitalist programs in Canada have been limited. A number of early studies aimed to describe16 the role of hospitalists in Canada and suggested improvements in length of stay (LOS) and staff satisfaction.17 However, these studies relied on unadjusted before-after comparisons and lacked methodological rigor to draw robust conclusions. More recently, a few studies have evaluated care outcomes associated with hospitalists using administrative databases, which attempted to control for potential confounding factors.18-21
While these studies are beginning to shed some light on the impact of hospital medicine programs in Canada, there are a number of issues that limit their generalizability. For example, the majority of studies to date focus on hospital medicine programs in Canada’s largest province (Ontario), and most describe experiences from single institutions. Since each of the 13 provincial and territorial governments organizes its health care system differently,22 results from 1 province may not be generalizable to other parts of the country. Moreover, hospitalists in Ontario are more diverse in their training backgrounds, with a larger percentage having trained in general internal medicine (IM), as compared to other parts of Canada, where the majority of hospitalists are overwhelmingly trained as FPs.3
We aimed to study care outcomes associated with a network of hospitalist services compared to “traditional” providers (community-based FPs and IM specialists) in a large integrated health care system in the province of British Columbia in western Canada. The hospital medicine services in this network span a range of community and academic hospitals, and collectively constitute 1 of the largest regional programs in the country. This provides a unique opportunity to understand the impact of hospitalists on outcome measures across a range of acute care institutions.
Methods
Setting and Population
Fraser Health Authority is 1 of 5 regional health authorities in British Columbia that emerged in 2001.23,24 It operates a network of hospitalist programs in 10 of its 12 acute care hospitals. In addition to hospitalists, there are a variable number of “traditional” physician providers who continue to act as MRPs. These include community-based FPs who continue to see their own patients in the hospital, either as part of a solo-practice model or a clinic-based call group. There are also a number of general internists and other subspecialists who accept MRP roles for general medicine patients who may present with higher-acuity conditions. As a result, patients requiring hospitalization due to nonsurgical or noncritical care conditions at each Fraser Health hospital may be cared for by a physician belonging to 1 of 3 groups, depending on local circumstances: an FP, a hospitalist, or an internist.
Inclusion and Exclusion Criteria
In order to evaluate comparative outcomes associated with hospitalist care, we included all patients admitted to a physician in each of the 3 provider groups between April 1, 2012, and March 31, 2018. We chose this time period for 2 reasons: first, we wanted to ensure comparability over an extended period of time, given the methodological changes implemented in 2009 by the Canadian Institute for Health Information (CIHI), the federal organization in the country responsible for setting standards for health care measures.25 Second, previous internal reviews had suggested that data quality prior to this year was inconsistent. We only considered hospitalizations where patients were admitted to and discharged by the same service, and excluded 2 acute care facilities and 1 free-standing rehabilitation facility without a hospitalist service during this period. We also excluded patients who resided in a location beyond the geographic catchment area of Fraser Health. Further details about data collection are outlined in the Appendix.
Measures
We used the framework developed by White and Glazier26 to inform the selection of our outcome measures, as well as relevant variables that may impact them. This framework proposes that the design of the inpatient care model (structures and processes of care) directly affects care outcomes. The model also proposes that patient and provider attributes can modulate this relationship, and suggests that a comprehensive evaluation of hospitalist performance needs to take these factors into account. We identified average total LOS, 30-day readmission rate, in-hospital mortality, and hospital standardized mortality ratio (HSMR)27 as primary outcome measures. HSMR is defined as actual over expected mortality and is measured by CIHI through a formula that takes into account patient illness attributes (eg, the most responsible diagnosis, comorbidity levels) and baseline population mortality rates.27 We chose these measures because they are clinically relevant and easy to obtain and have been utilized in previous similar studies in Canada and the United States.18-21,26
Statistical Analysis
Baseline demographic and clinical differences in patient outcomes were examined using independent t-tests or chi-square tests. Furthermore, baseline differences based on provider groups were explored using analysis of variance or chi-square tests. Multiple logistic regression analyses were completed to determine the relationship between provider groups and readmission and mortality, while the relationship between provider groups and hospital LOS was determined with generalized linear regression (using gamma distribution and a log link). Gamma distribution with a log link analysis is appropriate with outcome measures that are positively skewed (eg, hospital LOS). It assumes that data are sampled from an exponential family of distributions, thus mimicking a log-normal distribution, and minimizes estimation bias and standard errors. These analyses were completed while controlling for the effects of age, gender, and other potential confounding factors.
We initially attempted to control for case mix by incorporating case-mix groups (CMGs) in our multivariate analysis. However, we identified 475 CMGs with at least 1 patient in our study population. We then explored the inclusion of major clinical categories (MCCs) that broadly group CMGs into various higher order/organ-system level categories (eg, diseases of the respiratory system); however, we could not aggregate them into sufficiently homogenous groups to be entered into regression models. Instead, we conducted subgroup analyses on patients in our study population who were hospitalized with 1 of the following 3 CMGs: chronic obstructive pulmonary disease (COPD, n = 11,404 patients), congestive heart failure without coronary angiography (CHF, n = 7680), and pneumonia (itself an aggregate of 3 separate CMGs: aspiration pneumonia, bacterial pneumonia, viral/unspecified pneumonia, n = 11,155). We chose these CMGs as they are among the top 8 presentations for all 3 provider groups.
For all outcome measures, we excluded atypical patients (defined by CIHI as those with atypically long stays) and patients who had been transferred between facilities. For the readmission analysis, we also excluded patients who died in the hospital (Appendix A). Data analyses were completed in IBM SPSS, version 21. For all analyses, significance was determined using 2-tailed test and alpha < 0.05.
Ethics
The Fraser Health Department of Research and Evaluation reviewed this project to determine need for formal Ethics Review Board review, and granted an exemption based on institutional guidelines for program evaluations.
Results
A total of 132,178 patients were admitted to and discharged by 1 of the 3 study provider groups during the study period, accounting for a total of 248,412 hospitalizations. After excluding patients cared for in Fraser Health facilities without a hospitalist service and those who resided in a geographic area beyond Fraser Health, a total of 224,214 admissions were included in the final analysis.
")
Patient Characteristics
The demographic and clinical characteristics of patients by provider group are summarized in Table 1. Patients admitted to IM providers were substantially younger than those admitted to either FPs or hospitalists (61.00 vs 70.86 and 71.22 years, respectively; P < 0.005). However, patients admitted to hospitalists had higher degrees of complexity (as measured by higher comorbidity levels, number of secondary diagnoses, and higher resource intensity weights [RIWs]; P < 000.1 for all comparisons). Overall, the most common CMGs seen by FPs and hospitalists were similar, while IM providers primarily saw patients with cardiac conditions (Table 2).
")
Trends Over Time
During the study period, the number of patients admitted to the hospitalist services increased by 24%, while admissions to FPs and IM providers declined steadily (Figure). During this time, LOS for hospitalists progressively declined, while LOS for FPs and IM providers increased. Similar trends were observed for measures of mortality, while readmission rates remained constant for FPs, despite a decline observed for other providers.
 annual hospitalization, (B) mortality rate, (C) 30-day readmission rates, (D) hospital standardized mortality ratio, and (E) mean total length of stay by provider group over time")
Mortality
Table 3 summarizes the relationship between provider groups and in-hospital mortality (n = 183,779). Controlling for other variables, patients admitted to FP and IM providers had higher odds of mortality when compared to hospitalists (odds ratio [OR] for FPs, 1.29; 95% confidence interval [CI], 1.21-1.37; OR for IM, 1.24; 95% CI, 1.15-1.33). Older age, higher comorbidity level, higher number of secondary diagnoses, higher use of hospital resources (as measured by RIWs), longer than expected hospital stay (as measured by conservable days), and male gender were also associated with higher mortality. Similarly, patients receiving palliative care and those who spent at least 1 day in a special care unit (critical care, observation, and monitored care units) also had higher odds of mortality. On the other hand, admission to nonteaching medium facilities and longer hospital stay were associated with lower mortality. Compared to the first year of this analysis, lower mortality rates were observed in subsequent fiscal years. Finally, there appear to be geographic variations in mortality within Fraser Health.
")
Our analysis of patients with COPD, CHF, and pneumonia showed mixed results (Table 4). Patients admitted to the FP provider group with CHF and pneumonia had higher mortality compared to hospitalists (OR for CHF, 1.77; 95% CI, 1.38-2.27; OR for pneumonia, 1.53; 95% CI, 1.25-1.88), with a similar but nonstatistically significant trend observed for patients with COPD (OR, 1.29; 95% CI, 0.99-1.70). On the other hand, the higher observed mortality associated with the IM provider group in the overall study population only persisted for patients with COPD (OR, 2.71; 95% CI, 1.94-3.80), with no statistically significant differences for patients with CHF (OR, 1.18; 95% CI, 0.84-1.65) and pneumonia (OR, 0.93; 95% CI, 0.69-1.25).

We also studied adjusted mortality as measured by HSMRs. Currently, our Health Information Management system calculates an HSMR value for each patient admitted to our acute care facilities using the methodology developed by CIHI. Prior internal audits demonstrated that our internal calculations closely approximate those reported nationally. Our analysis suggests that over time, HSMR rates for the 3 provider groups have diverged, with patients admitted to IM providers having a higher mortality rate than what would be expected based on the presenting clinical conditions and comorbidity levels (Figure, part D).
Readmission
The results of our multiple logistic regression for readmission are summarized in Table 5 (n = 166,042). The impact of provider group on 30-day readmission is mixed, with higher odds associated with FPs compared to hospitalists (OR, 1.27; 95% CI, 1.22-1.34) and lower odds associated with IM physicians (OR, 0.83; 95% CI, 0.79-0.87). Gender and RIW did not show any significant associations, but increasing age, higher number of secondary diagnoses, higher comorbidity levels, and longer than expected LOS (as measure by conservable days) were associated with higher odds of readmission. Conversely, longer hospitalization, admission to a large community hospital, palliative status, admission to a special care unit, geography, and fiscal year were associated with lower odds of readmission.
")
The above differences between provider groups were no longer consistently present when we analyzed patients presenting with COPD, CHF, and pneumonias (Table 6). Only patients admitted to the FP provider group with pneumonia had higher odds of readmission compared to hospitalists (OR, 1.27; 95% CI, 1.05-1.54). Conversely, only patients admitted to the IM provider group with CHF showed lower readmission (OR, 0.75; 95% CI, 0.62-0.92).

Total LOS
Results using generalized linear regressions for total LOS are presented in Table 7 (n = 183,779). Patients admitted to the IM provider group had significantly lower total LOS (mean, 5.13 days; 95% CI, 5.04-5.21) compared to the hospitalist (mean, 7.37 days; 95% CI, 7.26-7.49) and FP (mean, 7.30 days; 95% CI, 7.19-7.41) groups, with no significant differences between the latter 2 groups. Older patients, females, patients with higher comorbidity levels or number of secondary diagnoses, higher RIW, palliative patients, and discharge to a facility other than the patient’s home were associated with a significantly longer LOS. On the other hand, admission to nonteaching hospitals and admission to a special care unit was associated with lower LOS.
")
When we compared total LOS for patients admitted with COPD, CHF, and pneumonias, the same differences observed for the broader comparisons persisted: IM patients consistently showed shorter LOS compared to hospitalist patients, while LOS associated with FP patients was similar (Table 8).

Discussion
To our knowledge, our evaluation is the largest study to date designed to understand outcomes associated with hospitalist care in Canada. Our analyses suggest that patients admitted to our large network of hospitalist services present with clinical conditions that are very similar to those of general medicine patients in other Canadian provinces.28,29 They also show that patients cared for by hospitalists experience lower mortality rates compared to those cared for by FPs. Our findings are similar to previous studies, which have suggested a 12% to 75% reduction in odds of mortality associated with hospitalist care.18,19 These differences persisted even when we focused on patients presenting with specific clinical conditions (CHF, COPD, and pneumonias).
White and colleagues have previously demonstrated that generalist physicians who had higher volumes of inpatient care activity also had lower mortality rates compared to those who cared for hospitalized patients less frequently.19 An association between higher physician caseloads and better outcomes has been established for many surgical and medical conditions.30-32 Given that 85% of hospitalists in our program have post-graduate medical training in family medicine (internal department surveys, data not shown), it is less likely that training background can explain differences in outcomes. Instead, differences in patient volumes and the dedicated focus of hospitalists on acute care are likely more important contributors to lower mortality. In our program, a full-time hospitalist spends an average of 2000 hours annually providing services in the hospital setting. The continuous on-site presence of hospitalists enhances their clinical experience with regards to the management of common medical conditions, and increases their exposure to less common presentations of illnesses. The ability to respond to deteriorating patients in a timely manner may be another factor in explaining the differences in mortality rates between dedicated hospital-based generalist providers and similarly trained physicians with a primarily community-based focus.
In our study, hospitalist care was also broadly associated with lower mortality compared to the IM providers, although these differences were not consistently present when patients with specific diagnoses were compared. This may be partly explained by the relationship between caseload and outcomes, but other factors may also be important. For example, patients admitted by IM providers spend significantly more time in specialized units. They also predominantly present with cardiac conditions, and as such may have higher acuity levels and require more invasive interventions. While this may explain the higher observed mortality, a within-group comparison still suggests higher than expected mortality for IM patients. The HSMR methodology measures actual mortality rates compared to what would be expected based on clinical presentation and baseline population characteristics. Calculating HSMR is highly dependent on proper documentation and chart abstraction,33,34 and it is possible that some of the differences observed are due to incomplete physician documentation. However, a more in-depth analysis of care processes will be required to clarify the observed trends.
Compared to hospitalists, patients cared for by FPs also had higher odds of readmission within 30 days, which is consistent with prior studies.18,19 One of the criticisms of the hospitalist model has been the inherent discontinuity of care that is built into the model, which can contribute to suboptimal transitions of care between the acute and community settings.35 The expectation is that FPs who admit their own patients do not face this challenge, and as a result their patients should be readmitted less frequently after discharge. Our data and those from previous studies do not support this hypothesis. At the same time, when we studied patients with specific clinical diagnoses, only those hospitalized for pneumonias continued to demonstrate higher readmission odds. This suggests that hospital readmission rate is a complex measure that may be influenced by a multitude of hospital and community factors, and may be different for patients who present with different clinical diagnoses. Further research is required to better understand the relationship between provider type and experience with hospital readmission for patients with various clinical presentations.
Unlike the United States, where hospitalist care has been associated with reductions in LOS,26,36 studies in the Canadian health care setting have shown mixed results.17-21 In our evaluation, hospitalist care is not associated with reductions in total LOS compared to care provided by FPs or IM physicians. This could be due to a number of factors. First, unlike FPs, who know their patients, hospitalists may have a more conservative risk tolerance in discharging patients with whom they are not familiar. Similarly, physicians who have trained in IM may have a lower threshold for discharging patients than hospitalists, whose training background is mainly rooted in family medicine.3 Second, discontinuity of care has been associated with longer LOS for hospitalized patients.37,38 Hospitalists generally work for 7- to 10-day rotations. As a result, a patient may see a number of different hospitalists during the same hospital stay, which could nullify any gains in LOS that may be expected from better familiarity with hospital processes. Third, whereas a FP or an internist may only have a few inpatients under their care at any given time, each hospitalist typically cares for 17 to 22 patients every day. Increasing hospitalist workload has been shown to negatively impact LOS and may result in lower efficiency.39 Finally, many patients in our health system who require more time to recuperate or need complex discharge planning are usually transferred to the care of the hospitalist service from other services, or are preferentially admitted to hospitalists from the emergency department. As a result, hospitalists may look after a disproportionately higher number of long-stay patients. Despite all this, hospitalists in our population perform similarly to FPs, regardless of the clinical diagnoses of hospitalized patients.
Our study has a number of notable limitations. First, we used administrative data to conduct our evaluation and could only control for factors that are available in our data systems. As a result, some potential confounders may not have been taken into consideration. For example, our databases do not contain provider characteristics (eg, age, years of clinical experience) that have been deemed to be relevant by White and Glazier.26 Similarly, we did not have all the necessary information about the characteristics of the various MRP programs (eg, number of physicians involved in group practices, the schedule model of community FP call groups) and were not able to account for the potential impact of these on observed outcomes. Second, although our findings mirror prior studies from other parts of Canada, they may not be applicable to hospitalist programs in other jurisdictions or in health systems that are not regionalized or integrated. Third, our IM provider group is heterogeneous, with a number of different IM subspecialties (cardiologists, gastroenterologists, general internists) grouped under the IM category in our database. As a result, comparisons between the IM provider group and the other 2 provider groups, which are more homogenous, should be interpreted with caution.
Finally, we included only patients admitted to facilities in which a hospitalist service existed during the study period. As a result, a medium-size community hospital without a hospitalist service where patients are cared for exclusively by FPs and IM physicians was not included in the comparisons, and in 4 of the 10 facilities included, the number of FP patients was less than 10% of total hospitalized patients at the site (Appendix A). This may have resulted in an under-representation of FP patients.
Conclusion
Debates about the merits of the hospitalist model in Canada continue, and are in part fueled by a paucity of robust evidence about its impact on care outcomes compared to more traditional ways of providing inpatient care. In our evaluation, care provided by hospitalists is associated with lower mortality and readmission rates, despite similar LOS compared with FPs. Hospitalist care is also associated with lower mortality compared to IM providers. Hospitalists also demonstrated progressive improvement over time, with decreasing LOS and mortality rates and a stable readmission rate. Our results suggest that physicians with a focus on inpatient care can have positive contributions to quality and efficiency of care in Canada.
Corresponding author: Vandad Yousefi MD, CCFP, FHM, Fraser Health Authority, 400, 13450–102 Avenue, Surrey BC V3T 0H1, Canada.
Financial disclosures: None.
1. Kisuule F, Howell E. Hospital medicine beyond the United States. Int J Gen Med. 2018;11:65-71.
2. Yousefi V, Wilton D. Dedesigning hospital care: learning from the experience of hospital medicine in Canada. J Global Health Care Syst. 2011;1(3).
3. Soong C, Fan E, Howell E, et al. Characteristics of hospitalists and hospitalist programs in the United States and Canada. J Clin Outcomes Manag. 2009;16:69-76.
4. Yousefi V. How Canadian hospitalists spend their time - A work-sampling study within a hospital medicine program in Ontario. J Clin Outcomes Manag. 2011;18:159-166.
5. Wilson G. Are inpatients’ needs better served by hospitalists than by their family doctors? No. Can Fam Physician. 2008;54:1101-1103.
6. Samoil D. Are inpatients’ needs better served by hospitalists than by their family doctors: Yes? Can Fam Physician. 2008;54:1100-1101.
7. Nicolson B. Where’s Marcus Welby when you need him? BC Medical J. 2016;58:63-64.
8. Lemire F. Enhanced skills in family medicine: Update. Can Fam Physician. 2018;64:160.
9. Lerner J. Wanting family medicine without primary care. Can Fam Physician. 2018; 64:155.
10. Canadian Society of Hospital Medicine. Core Competencies in Hospital Medicine - Care of the Medical Inpatient. 2015.
11. Redelmeier DA. A Canadian perspective on the American hospitalist movement. Arch Intern Med. 1999;159:1665-1668.
12. Ghali WA, Greenberg PB, Mejia R, et al. International perspectives on general internal medicine and the case for “globalization” of a discipline. J Gen Intern Med. 2006;21:197-200.
13. Day A, MacMillan L. Neglect of the inpatient: The hospitalist movement in Canada responds. Hosp Q. 2001;4:36.
14. Sullivan P. Enter the hospitalist: New type of patient creating a new type of specialist. CMAJ. 2000;162:1345-1346.
15. Chan BTB. The declining comprehensiveness of primary care. CMAJ. 2002;166:429-434.
16. Abenhaim HA, Kahn SR, Raffoul J, Becker MR. Program description: A hospitalist-run, medical short-stay unit in a teaching hospital. CMAJ. 2000;163:1477-1480.
17. McGowan B, Nightingale M. The hospitalist program a new specialty on the horizon in acute care medicine a hospital case study. BC Med J. 2003;45:391-394.
18. Yousefi V, Chong C. Does implementation of a hospitalist program in a Canadian community hospital improve measures of quality of care and utilization? An observational comparative analysis of hospitalists vs. traditional care providers. BMC Health Serv Res. 2013;13:204.
19. White HL. Assessing the prevalence, penetration and performance of hospital physicians in Ontario: Implications for the quality and efficiency of inpatient care. ProQuest Dissertations Publishing; 2016.
20. Gutierrez CA, Norris M, Chail M. Impact of a newly established hospitalist training program on patient LOS and RIW. Poster presented at the 9th Annual Canadian Society of Hospital Medicine Conference, September 23-25, 2011; Banff, Alberta.
21. Seth P, Nicholson K, Habbous S, Menard J. Implementation of a hospitalist medicine model in a full-service community hospital: Examining impact two years post-implementation on health resource use andpatient satisfaction. Poster presented at the 13th Annual Canadian Society of Hospital Medicine Conference. 2015; Niagara Falls, Ontario.
22. Lewis S. A system in name only--access, variation, and reform in Canada’s provinces. N Engl J Med. 2015;372:497-500.
23. Lewis S, Kouri D. Regionalization: Making sense of the Canadian experience. Healthcare Papers. 2004;5:12-31.
24. Fraser Health Authority. About Fraser health. www.fraserhealth.ca/about-us/about-fraser-health#.XFJrl9JKiUk. Updated 2018. Accessed January 30, 2019.
25. Canadian Institute for Health Information. CMG+. https://www.cihi.ca/en/cmg. Accessed January 30, 2019.
26. White HL, Glazier RH. Do hospitalist physicians improve the quality of inpatient care delivery? A systematic review of process, efficiency and outcome measures. BMC Med. 2011;9:58.
27. Canadian Institute for Health Information. Hospital standardized mortality ratio technical notes. 2008. www.cihi.ca/sites/default/files/document/hsmr-tech-notes_en_0.pdf.
28. McAlister FA, Youngson E, Bakal JA, et al. Physician experience and outcomes among patients admitted to general internal medicine teaching wards. CMAJ. 2015;187:1041-1048.
29. Verma AA, Guo Y, Kwan JL, et al. Patient characteristics, resource use and outcomes associated with general internal medicine hospital care: The general medicine inpatient initiative (GEMINI) retrospective cohort study. CMAJ Open. 2017;5:E849.
30. Morche J, Mathes T, Pieper D. Relationship between surgeon volume and outcomes: A systematic review of systematic reviews. Syst Rev. 2016;5:204.
31. Halm EA, Lee C, Chassin MR. Is volume related to outcome in health care? A systematic review and methodologic critique of the literature. Ann Intern Med. 2002;137:511-520.
32. Chen CH, Chen YH, Lin HC, Lin HC. Association between physician caseload and patient outcome for sepsis treatment. Infect Control Hosp Epidemiol. 2009;30:556-562.
33. van Gestel YR, Lemmens VE, Lingsma HF, et al. The hospital standardized mortality ratio fallacy: A narrative review. Med Care. 2012;50:662-667.
34. Scott IA, Brand CA, Phelps GE, et al. Using hospital standardised mortality ratios to assess quality of care—proceed with extreme caution. Med J Aust. 2011; 194:645-648.
35. Wachter RM. Hospitalists in the United States -- mission accomplished or work in progress? N Engl J Med. 2004;350:1935-1936.
36. Peterson MC. A systematic review of outcomes and quality measures in adult patients cared for by hospitalists vs nonhospitalists. Mayo Clin Proc. 2009;84:248-254.
37. Chandra S, Wright SM, Howell EE. The creating incentives and continuity leading to efficiency staffing model: A quality improvement initiative in hospital medicine. Mayo Clin Proc. 2012;87:364-371.
38. Epstein K, Juarez E, Epstein A, et al. The impact of fragmentation of hospitalist care on length of stay. J Hosp Med. 2010;5:335-338.
39. Elliott DJ, Young RS, Brice J, et al. Effect of hospitalist workload on the quality and efficiency of care. JAMA Intern Med. 2014;174:786-793.
From the Fraser Health Authority, Surrey, British Columbia, Canada.
Abstract
- Objective: To study care outcomes associated with a network of hospitalist services compared to traditional providers.
- Design: Retrospective review of administrative data.
- Setting and participants: Patients from a large integrated health care system in British Columbia in western Canada admitted and cared for by 3 provider groups between April 1, 2012, and March 31, 2018: hospitalists, family physicians (FP), and internal medicine (IM) physicians:
- Measurements: Average total length of stay (LOS), 30-day readmission, in-hospital mortality, and hospital standardized mortality ratio (HSMR) were the study outcome measures. Multiple logistic regression or generalized regression were completed to determine the relationship between provider groups and outcomes.
- Results: A total of 248,412 hospitalizations were included. Compared to patients admitted to hospitalists, patients admitted to other providers had higher odds of mortality (odds ratio [OR] for FP, 1.29; 95% confidence interval [CI], 1.21-1.37; OR for IM, 1.24; 95% CI, 1.15-1.33). Compared to hospitalist care, FP care was associated with higher readmission (OR, 1.27; 95% CI, 1.22-1.33), while IM care showed lower odds of readmission (OR, 0.83; 95% CI, 0.79-0.87). Patients admitted to the IM group had significantly lower total LOS (mean, 5.13 days; 95% CI, 5.04-5.21) compared to patients admitted to hospitalists (mean, 7.37 days; CI, 7.26-7.49) and FPs (mean, 7.30 days; 95% CI, 7.19-7.41). In a subgroup analysis of patients presenting with congestive heart failure, chronic obstructive pulmonary disease, and pneumonia, these general tendencies broadly persisted for mortality and LOS comparisons between FPs and hospitalists, but results were mixed for hospital readmissions.
- Conclusion: Care provided by hospitalists was associated with lower mortality and readmission rates compared with care provided by FPs, despite similar LOS. These findings may reflect differences in volume of services delivered by individual physicians, on-site availability to address urgent medical issues, and evolving specialization of clinical and nonclinical care processes in the acute care setting.
Keywords: hospital medicine; length of stay; readmission; mortality.
The hospitalist model of care has undergone rapid growth globally in recent years.1 The first hospitalist programs in Canada began around the same time as those in the United States and share many similarities in design and operations with their counterparts.2-4 However, unlike in the United States, where the hospitalist model has successfully established itself as an emerging specialty, debates about the merits of the model and its value proposition continue among Canadian observers.5-9
Historically, the type of physicians who acted as the most responsible provider (MRP) in Canadian hospitals depended on setting and geography.10 In large urban areas, groups of general internists or specialists have historically looked after general medicine patients as part of university-affiliated teaching services.11,12 Patients admitted to community hospitals have traditionally been cared for by their own primary care providers, typically general practitioners or family physicians (FPs). In the mid-1990s, many primary care providers in urban centers began to withdraw from inpatient care and primarily focused their practices in the outpatient setting.13-15 Hospitalist programs emerged as health care administrators sought to fill the resulting gap in MRP coverage.2,10
To date, attempts to understand the impact of hospitalist programs in Canada have been limited. A number of early studies aimed to describe16 the role of hospitalists in Canada and suggested improvements in length of stay (LOS) and staff satisfaction.17 However, these studies relied on unadjusted before-after comparisons and lacked methodological rigor to draw robust conclusions. More recently, a few studies have evaluated care outcomes associated with hospitalists using administrative databases, which attempted to control for potential confounding factors.18-21
While these studies are beginning to shed some light on the impact of hospital medicine programs in Canada, there are a number of issues that limit their generalizability. For example, the majority of studies to date focus on hospital medicine programs in Canada’s largest province (Ontario), and most describe experiences from single institutions. Since each of the 13 provincial and territorial governments organizes its health care system differently,22 results from 1 province may not be generalizable to other parts of the country. Moreover, hospitalists in Ontario are more diverse in their training backgrounds, with a larger percentage having trained in general internal medicine (IM), as compared to other parts of Canada, where the majority of hospitalists are overwhelmingly trained as FPs.3
We aimed to study care outcomes associated with a network of hospitalist services compared to “traditional” providers (community-based FPs and IM specialists) in a large integrated health care system in the province of British Columbia in western Canada. The hospital medicine services in this network span a range of community and academic hospitals, and collectively constitute 1 of the largest regional programs in the country. This provides a unique opportunity to understand the impact of hospitalists on outcome measures across a range of acute care institutions.
Methods
Setting and Population
Fraser Health Authority is 1 of 5 regional health authorities in British Columbia that emerged in 2001.23,24 It operates a network of hospitalist programs in 10 of its 12 acute care hospitals. In addition to hospitalists, there are a variable number of “traditional” physician providers who continue to act as MRPs. These include community-based FPs who continue to see their own patients in the hospital, either as part of a solo-practice model or a clinic-based call group. There are also a number of general internists and other subspecialists who accept MRP roles for general medicine patients who may present with higher-acuity conditions. As a result, patients requiring hospitalization due to nonsurgical or noncritical care conditions at each Fraser Health hospital may be cared for by a physician belonging to 1 of 3 groups, depending on local circumstances: an FP, a hospitalist, or an internist.
Inclusion and Exclusion Criteria
In order to evaluate comparative outcomes associated with hospitalist care, we included all patients admitted to a physician in each of the 3 provider groups between April 1, 2012, and March 31, 2018. We chose this time period for 2 reasons: first, we wanted to ensure comparability over an extended period of time, given the methodological changes implemented in 2009 by the Canadian Institute for Health Information (CIHI), the federal organization in the country responsible for setting standards for health care measures.25 Second, previous internal reviews had suggested that data quality prior to this year was inconsistent. We only considered hospitalizations where patients were admitted to and discharged by the same service, and excluded 2 acute care facilities and 1 free-standing rehabilitation facility without a hospitalist service during this period. We also excluded patients who resided in a location beyond the geographic catchment area of Fraser Health. Further details about data collection are outlined in the Appendix.
Measures
We used the framework developed by White and Glazier26 to inform the selection of our outcome measures, as well as relevant variables that may impact them. This framework proposes that the design of the inpatient care model (structures and processes of care) directly affects care outcomes. The model also proposes that patient and provider attributes can modulate this relationship, and suggests that a comprehensive evaluation of hospitalist performance needs to take these factors into account. We identified average total LOS, 30-day readmission rate, in-hospital mortality, and hospital standardized mortality ratio (HSMR)27 as primary outcome measures. HSMR is defined as actual over expected mortality and is measured by CIHI through a formula that takes into account patient illness attributes (eg, the most responsible diagnosis, comorbidity levels) and baseline population mortality rates.27 We chose these measures because they are clinically relevant and easy to obtain and have been utilized in previous similar studies in Canada and the United States.18-21,26
Statistical Analysis
Baseline demographic and clinical differences in patient outcomes were examined using independent t-tests or chi-square tests. Furthermore, baseline differences based on provider groups were explored using analysis of variance or chi-square tests. Multiple logistic regression analyses were completed to determine the relationship between provider groups and readmission and mortality, while the relationship between provider groups and hospital LOS was determined with generalized linear regression (using gamma distribution and a log link). Gamma distribution with a log link analysis is appropriate with outcome measures that are positively skewed (eg, hospital LOS). It assumes that data are sampled from an exponential family of distributions, thus mimicking a log-normal distribution, and minimizes estimation bias and standard errors. These analyses were completed while controlling for the effects of age, gender, and other potential confounding factors.
We initially attempted to control for case mix by incorporating case-mix groups (CMGs) in our multivariate analysis. However, we identified 475 CMGs with at least 1 patient in our study population. We then explored the inclusion of major clinical categories (MCCs) that broadly group CMGs into various higher order/organ-system level categories (eg, diseases of the respiratory system); however, we could not aggregate them into sufficiently homogenous groups to be entered into regression models. Instead, we conducted subgroup analyses on patients in our study population who were hospitalized with 1 of the following 3 CMGs: chronic obstructive pulmonary disease (COPD, n = 11,404 patients), congestive heart failure without coronary angiography (CHF, n = 7680), and pneumonia (itself an aggregate of 3 separate CMGs: aspiration pneumonia, bacterial pneumonia, viral/unspecified pneumonia, n = 11,155). We chose these CMGs as they are among the top 8 presentations for all 3 provider groups.
For all outcome measures, we excluded atypical patients (defined by CIHI as those with atypically long stays) and patients who had been transferred between facilities. For the readmission analysis, we also excluded patients who died in the hospital (Appendix A). Data analyses were completed in IBM SPSS, version 21. For all analyses, significance was determined using 2-tailed test and alpha < 0.05.
Ethics
The Fraser Health Department of Research and Evaluation reviewed this project to determine need for formal Ethics Review Board review, and granted an exemption based on institutional guidelines for program evaluations.
Results
A total of 132,178 patients were admitted to and discharged by 1 of the 3 study provider groups during the study period, accounting for a total of 248,412 hospitalizations. After excluding patients cared for in Fraser Health facilities without a hospitalist service and those who resided in a geographic area beyond Fraser Health, a total of 224,214 admissions were included in the final analysis.
Patient Characteristics
The demographic and clinical characteristics of patients by provider group are summarized in Table 1. Patients admitted to IM providers were substantially younger than those admitted to either FPs or hospitalists (61.00 vs 70.86 and 71.22 years, respectively; P < 0.005). However, patients admitted to hospitalists had higher degrees of complexity (as measured by higher comorbidity levels, number of secondary diagnoses, and higher resource intensity weights [RIWs]; P < 000.1 for all comparisons). Overall, the most common CMGs seen by FPs and hospitalists were similar, while IM providers primarily saw patients with cardiac conditions (Table 2).
Trends Over Time
During the study period, the number of patients admitted to the hospitalist services increased by 24%, while admissions to FPs and IM providers declined steadily (Figure). During this time, LOS for hospitalists progressively declined, while LOS for FPs and IM providers increased. Similar trends were observed for measures of mortality, while readmission rates remained constant for FPs, despite a decline observed for other providers.
Mortality
Table 3 summarizes the relationship between provider groups and in-hospital mortality (n = 183,779). Controlling for other variables, patients admitted to FP and IM providers had higher odds of mortality when compared to hospitalists (odds ratio [OR] for FPs, 1.29; 95% confidence interval [CI], 1.21-1.37; OR for IM, 1.24; 95% CI, 1.15-1.33). Older age, higher comorbidity level, higher number of secondary diagnoses, higher use of hospital resources (as measured by RIWs), longer than expected hospital stay (as measured by conservable days), and male gender were also associated with higher mortality. Similarly, patients receiving palliative care and those who spent at least 1 day in a special care unit (critical care, observation, and monitored care units) also had higher odds of mortality. On the other hand, admission to nonteaching medium facilities and longer hospital stay were associated with lower mortality. Compared to the first year of this analysis, lower mortality rates were observed in subsequent fiscal years. Finally, there appear to be geographic variations in mortality within Fraser Health.
Our analysis of patients with COPD, CHF, and pneumonia showed mixed results (Table 4). Patients admitted to the FP provider group with CHF and pneumonia had higher mortality compared to hospitalists (OR for CHF, 1.77; 95% CI, 1.38-2.27; OR for pneumonia, 1.53; 95% CI, 1.25-1.88), with a similar but nonstatistically significant trend observed for patients with COPD (OR, 1.29; 95% CI, 0.99-1.70). On the other hand, the higher observed mortality associated with the IM provider group in the overall study population only persisted for patients with COPD (OR, 2.71; 95% CI, 1.94-3.80), with no statistically significant differences for patients with CHF (OR, 1.18; 95% CI, 0.84-1.65) and pneumonia (OR, 0.93; 95% CI, 0.69-1.25).
We also studied adjusted mortality as measured by HSMRs. Currently, our Health Information Management system calculates an HSMR value for each patient admitted to our acute care facilities using the methodology developed by CIHI. Prior internal audits demonstrated that our internal calculations closely approximate those reported nationally. Our analysis suggests that over time, HSMR rates for the 3 provider groups have diverged, with patients admitted to IM providers having a higher mortality rate than what would be expected based on the presenting clinical conditions and comorbidity levels (Figure, part D).
Readmission
The results of our multiple logistic regression for readmission are summarized in Table 5 (n = 166,042). The impact of provider group on 30-day readmission is mixed, with higher odds associated with FPs compared to hospitalists (OR, 1.27; 95% CI, 1.22-1.34) and lower odds associated with IM physicians (OR, 0.83; 95% CI, 0.79-0.87). Gender and RIW did not show any significant associations, but increasing age, higher number of secondary diagnoses, higher comorbidity levels, and longer than expected LOS (as measure by conservable days) were associated with higher odds of readmission. Conversely, longer hospitalization, admission to a large community hospital, palliative status, admission to a special care unit, geography, and fiscal year were associated with lower odds of readmission.
The above differences between provider groups were no longer consistently present when we analyzed patients presenting with COPD, CHF, and pneumonias (Table 6). Only patients admitted to the FP provider group with pneumonia had higher odds of readmission compared to hospitalists (OR, 1.27; 95% CI, 1.05-1.54). Conversely, only patients admitted to the IM provider group with CHF showed lower readmission (OR, 0.75; 95% CI, 0.62-0.92).
Total LOS
Results using generalized linear regressions for total LOS are presented in Table 7 (n = 183,779). Patients admitted to the IM provider group had significantly lower total LOS (mean, 5.13 days; 95% CI, 5.04-5.21) compared to the hospitalist (mean, 7.37 days; 95% CI, 7.26-7.49) and FP (mean, 7.30 days; 95% CI, 7.19-7.41) groups, with no significant differences between the latter 2 groups. Older patients, females, patients with higher comorbidity levels or number of secondary diagnoses, higher RIW, palliative patients, and discharge to a facility other than the patient’s home were associated with a significantly longer LOS. On the other hand, admission to nonteaching hospitals and admission to a special care unit was associated with lower LOS.
When we compared total LOS for patients admitted with COPD, CHF, and pneumonias, the same differences observed for the broader comparisons persisted: IM patients consistently showed shorter LOS compared to hospitalist patients, while LOS associated with FP patients was similar (Table 8).
Discussion
To our knowledge, our evaluation is the largest study to date designed to understand outcomes associated with hospitalist care in Canada. Our analyses suggest that patients admitted to our large network of hospitalist services present with clinical conditions that are very similar to those of general medicine patients in other Canadian provinces.28,29 They also show that patients cared for by hospitalists experience lower mortality rates compared to those cared for by FPs. Our findings are similar to previous studies, which have suggested a 12% to 75% reduction in odds of mortality associated with hospitalist care.18,19 These differences persisted even when we focused on patients presenting with specific clinical conditions (CHF, COPD, and pneumonias).
White and colleagues have previously demonstrated that generalist physicians who had higher volumes of inpatient care activity also had lower mortality rates compared to those who cared for hospitalized patients less frequently.19 An association between higher physician caseloads and better outcomes has been established for many surgical and medical conditions.30-32 Given that 85% of hospitalists in our program have post-graduate medical training in family medicine (internal department surveys, data not shown), it is less likely that training background can explain differences in outcomes. Instead, differences in patient volumes and the dedicated focus of hospitalists on acute care are likely more important contributors to lower mortality. In our program, a full-time hospitalist spends an average of 2000 hours annually providing services in the hospital setting. The continuous on-site presence of hospitalists enhances their clinical experience with regards to the management of common medical conditions, and increases their exposure to less common presentations of illnesses. The ability to respond to deteriorating patients in a timely manner may be another factor in explaining the differences in mortality rates between dedicated hospital-based generalist providers and similarly trained physicians with a primarily community-based focus.
In our study, hospitalist care was also broadly associated with lower mortality compared to the IM providers, although these differences were not consistently present when patients with specific diagnoses were compared. This may be partly explained by the relationship between caseload and outcomes, but other factors may also be important. For example, patients admitted by IM providers spend significantly more time in specialized units. They also predominantly present with cardiac conditions, and as such may have higher acuity levels and require more invasive interventions. While this may explain the higher observed mortality, a within-group comparison still suggests higher than expected mortality for IM patients. The HSMR methodology measures actual mortality rates compared to what would be expected based on clinical presentation and baseline population characteristics. Calculating HSMR is highly dependent on proper documentation and chart abstraction,33,34 and it is possible that some of the differences observed are due to incomplete physician documentation. However, a more in-depth analysis of care processes will be required to clarify the observed trends.
Compared to hospitalists, patients cared for by FPs also had higher odds of readmission within 30 days, which is consistent with prior studies.18,19 One of the criticisms of the hospitalist model has been the inherent discontinuity of care that is built into the model, which can contribute to suboptimal transitions of care between the acute and community settings.35 The expectation is that FPs who admit their own patients do not face this challenge, and as a result their patients should be readmitted less frequently after discharge. Our data and those from previous studies do not support this hypothesis. At the same time, when we studied patients with specific clinical diagnoses, only those hospitalized for pneumonias continued to demonstrate higher readmission odds. This suggests that hospital readmission rate is a complex measure that may be influenced by a multitude of hospital and community factors, and may be different for patients who present with different clinical diagnoses. Further research is required to better understand the relationship between provider type and experience with hospital readmission for patients with various clinical presentations.
Unlike the United States, where hospitalist care has been associated with reductions in LOS,26,36 studies in the Canadian health care setting have shown mixed results.17-21 In our evaluation, hospitalist care is not associated with reductions in total LOS compared to care provided by FPs or IM physicians. This could be due to a number of factors. First, unlike FPs, who know their patients, hospitalists may have a more conservative risk tolerance in discharging patients with whom they are not familiar. Similarly, physicians who have trained in IM may have a lower threshold for discharging patients than hospitalists, whose training background is mainly rooted in family medicine.3 Second, discontinuity of care has been associated with longer LOS for hospitalized patients.37,38 Hospitalists generally work for 7- to 10-day rotations. As a result, a patient may see a number of different hospitalists during the same hospital stay, which could nullify any gains in LOS that may be expected from better familiarity with hospital processes. Third, whereas a FP or an internist may only have a few inpatients under their care at any given time, each hospitalist typically cares for 17 to 22 patients every day. Increasing hospitalist workload has been shown to negatively impact LOS and may result in lower efficiency.39 Finally, many patients in our health system who require more time to recuperate or need complex discharge planning are usually transferred to the care of the hospitalist service from other services, or are preferentially admitted to hospitalists from the emergency department. As a result, hospitalists may look after a disproportionately higher number of long-stay patients. Despite all this, hospitalists in our population perform similarly to FPs, regardless of the clinical diagnoses of hospitalized patients.
Our study has a number of notable limitations. First, we used administrative data to conduct our evaluation and could only control for factors that are available in our data systems. As a result, some potential confounders may not have been taken into consideration. For example, our databases do not contain provider characteristics (eg, age, years of clinical experience) that have been deemed to be relevant by White and Glazier.26 Similarly, we did not have all the necessary information about the characteristics of the various MRP programs (eg, number of physicians involved in group practices, the schedule model of community FP call groups) and were not able to account for the potential impact of these on observed outcomes. Second, although our findings mirror prior studies from other parts of Canada, they may not be applicable to hospitalist programs in other jurisdictions or in health systems that are not regionalized or integrated. Third, our IM provider group is heterogeneous, with a number of different IM subspecialties (cardiologists, gastroenterologists, general internists) grouped under the IM category in our database. As a result, comparisons between the IM provider group and the other 2 provider groups, which are more homogenous, should be interpreted with caution.
Finally, we included only patients admitted to facilities in which a hospitalist service existed during the study period. As a result, a medium-size community hospital without a hospitalist service where patients are cared for exclusively by FPs and IM physicians was not included in the comparisons, and in 4 of the 10 facilities included, the number of FP patients was less than 10% of total hospitalized patients at the site (Appendix A). This may have resulted in an under-representation of FP patients.
Conclusion
Debates about the merits of the hospitalist model in Canada continue, and are in part fueled by a paucity of robust evidence about its impact on care outcomes compared to more traditional ways of providing inpatient care. In our evaluation, care provided by hospitalists is associated with lower mortality and readmission rates, despite similar LOS compared with FPs. Hospitalist care is also associated with lower mortality compared to IM providers. Hospitalists also demonstrated progressive improvement over time, with decreasing LOS and mortality rates and a stable readmission rate. Our results suggest that physicians with a focus on inpatient care can have positive contributions to quality and efficiency of care in Canada.
Corresponding author: Vandad Yousefi MD, CCFP, FHM, Fraser Health Authority, 400, 13450–102 Avenue, Surrey BC V3T 0H1, Canada.
Financial disclosures: None.
1. Kisuule F, Howell E. Hospital medicine beyond the United States. Int J Gen Med. 2018;11:65-71.
2. Yousefi V, Wilton D. Dedesigning hospital care: learning from the experience of hospital medicine in Canada. J Global Health Care Syst. 2011;1(3).
3. Soong C, Fan E, Howell E, et al. Characteristics of hospitalists and hospitalist programs in the United States and Canada. J Clin Outcomes Manag. 2009;16:69-76.
4. Yousefi V. How Canadian hospitalists spend their time - A work-sampling study within a hospital medicine program in Ontario. J Clin Outcomes Manag. 2011;18:159-166.
5. Wilson G. Are inpatients’ needs better served by hospitalists than by their family doctors? No. Can Fam Physician. 2008;54:1101-1103.
6. Samoil D. Are inpatients’ needs better served by hospitalists than by their family doctors: Yes? Can Fam Physician. 2008;54:1100-1101.
7. Nicolson B. Where’s Marcus Welby when you need him? BC Medical J. 2016;58:63-64.
8. Lemire F. Enhanced skills in family medicine: Update. Can Fam Physician. 2018;64:160.
9. Lerner J. Wanting family medicine without primary care. Can Fam Physician. 2018; 64:155.
10. Canadian Society of Hospital Medicine. Core Competencies in Hospital Medicine - Care of the Medical Inpatient. 2015.
11. Redelmeier DA. A Canadian perspective on the American hospitalist movement. Arch Intern Med. 1999;159:1665-1668.
12. Ghali WA, Greenberg PB, Mejia R, et al. International perspectives on general internal medicine and the case for “globalization” of a discipline. J Gen Intern Med. 2006;21:197-200.
13. Day A, MacMillan L. Neglect of the inpatient: The hospitalist movement in Canada responds. Hosp Q. 2001;4:36.
14. Sullivan P. Enter the hospitalist: New type of patient creating a new type of specialist. CMAJ. 2000;162:1345-1346.
15. Chan BTB. The declining comprehensiveness of primary care. CMAJ. 2002;166:429-434.
16. Abenhaim HA, Kahn SR, Raffoul J, Becker MR. Program description: A hospitalist-run, medical short-stay unit in a teaching hospital. CMAJ. 2000;163:1477-1480.
17. McGowan B, Nightingale M. The hospitalist program a new specialty on the horizon in acute care medicine a hospital case study. BC Med J. 2003;45:391-394.
18. Yousefi V, Chong C. Does implementation of a hospitalist program in a Canadian community hospital improve measures of quality of care and utilization? An observational comparative analysis of hospitalists vs. traditional care providers. BMC Health Serv Res. 2013;13:204.
19. White HL. Assessing the prevalence, penetration and performance of hospital physicians in Ontario: Implications for the quality and efficiency of inpatient care. ProQuest Dissertations Publishing; 2016.
20. Gutierrez CA, Norris M, Chail M. Impact of a newly established hospitalist training program on patient LOS and RIW. Poster presented at the 9th Annual Canadian Society of Hospital Medicine Conference, September 23-25, 2011; Banff, Alberta.
21. Seth P, Nicholson K, Habbous S, Menard J. Implementation of a hospitalist medicine model in a full-service community hospital: Examining impact two years post-implementation on health resource use andpatient satisfaction. Poster presented at the 13th Annual Canadian Society of Hospital Medicine Conference. 2015; Niagara Falls, Ontario.
22. Lewis S. A system in name only--access, variation, and reform in Canada’s provinces. N Engl J Med. 2015;372:497-500.
23. Lewis S, Kouri D. Regionalization: Making sense of the Canadian experience. Healthcare Papers. 2004;5:12-31.
24. Fraser Health Authority. About Fraser health. www.fraserhealth.ca/about-us/about-fraser-health#.XFJrl9JKiUk. Updated 2018. Accessed January 30, 2019.
25. Canadian Institute for Health Information. CMG+. https://www.cihi.ca/en/cmg. Accessed January 30, 2019.
26. White HL, Glazier RH. Do hospitalist physicians improve the quality of inpatient care delivery? A systematic review of process, efficiency and outcome measures. BMC Med. 2011;9:58.
27. Canadian Institute for Health Information. Hospital standardized mortality ratio technical notes. 2008. www.cihi.ca/sites/default/files/document/hsmr-tech-notes_en_0.pdf.
28. McAlister FA, Youngson E, Bakal JA, et al. Physician experience and outcomes among patients admitted to general internal medicine teaching wards. CMAJ. 2015;187:1041-1048.
29. Verma AA, Guo Y, Kwan JL, et al. Patient characteristics, resource use and outcomes associated with general internal medicine hospital care: The general medicine inpatient initiative (GEMINI) retrospective cohort study. CMAJ Open. 2017;5:E849.
30. Morche J, Mathes T, Pieper D. Relationship between surgeon volume and outcomes: A systematic review of systematic reviews. Syst Rev. 2016;5:204.
31. Halm EA, Lee C, Chassin MR. Is volume related to outcome in health care? A systematic review and methodologic critique of the literature. Ann Intern Med. 2002;137:511-520.
32. Chen CH, Chen YH, Lin HC, Lin HC. Association between physician caseload and patient outcome for sepsis treatment. Infect Control Hosp Epidemiol. 2009;30:556-562.
33. van Gestel YR, Lemmens VE, Lingsma HF, et al. The hospital standardized mortality ratio fallacy: A narrative review. Med Care. 2012;50:662-667.
34. Scott IA, Brand CA, Phelps GE, et al. Using hospital standardised mortality ratios to assess quality of care—proceed with extreme caution. Med J Aust. 2011; 194:645-648.
35. Wachter RM. Hospitalists in the United States -- mission accomplished or work in progress? N Engl J Med. 2004;350:1935-1936.
36. Peterson MC. A systematic review of outcomes and quality measures in adult patients cared for by hospitalists vs nonhospitalists. Mayo Clin Proc. 2009;84:248-254.
37. Chandra S, Wright SM, Howell EE. The creating incentives and continuity leading to efficiency staffing model: A quality improvement initiative in hospital medicine. Mayo Clin Proc. 2012;87:364-371.
38. Epstein K, Juarez E, Epstein A, et al. The impact of fragmentation of hospitalist care on length of stay. J Hosp Med. 2010;5:335-338.
39. Elliott DJ, Young RS, Brice J, et al. Effect of hospitalist workload on the quality and efficiency of care. JAMA Intern Med. 2014;174:786-793.
More than one in three cardiologists burned out, many ready to bolt
Even before the COVID-19 pandemic, , a new survey shows.
“It is important to recognize the personal and professional repercussions of physician burnout,” lead author Laxmi Mehta, MD, director of preventive cardiology and women’s cardiovascular health at Ohio State University, Columbus, said during an online session of the American College of Cardiology 2020 Scientific Session (ACC.20)/World Congress of Cardiology (WCC).
The new ACC 2019 Well Being Survey was sent to 19,348 ACC members in the fall of 2019 and sought to take a deeper dive into the issue of burnout after the ACC’s most recent Professional Life Survey revealed that one in four U.S. cardiologists were burned out in 2015.
While the number of cardiologists who reported feeling stressed fell from 49.5% in 2015 to 43.9% in 2019, the number of cardiologists who reported being burned out increased by 32% from 26.8% to 35.4%, Mehta said.
Among those currently feeling burned out, 23.9% reported having one or more symptoms of burnout, 9.9% had chronic burnout and work frustrations, and 1.6% were “completely burned out” and at the point where they may need to seek help.
Burned-out cardiologists were more likely than those who felt stressed or no burnout to say they may have made a major medical error in the past 3 months (58.3% vs 33.1% and 8.6%; P ≤ .001).
The Usual Suspects
As previously observed, burnout was highest among mid-career cardiologists with 8 to 21 years in practice vs early-career and late-career cardiologists (45.3% vs 35.4% and 31.5%; P ≤ .001) and in women vs men (45.3% vs 33.5%; P ≤ .001). Of the 2025 ACC members who responded, 362 were women.
Several initiatives are underway by the ACC to increase the diversity of cardiology as a specialty, but attention is also needed for mid-career cardiologists, who may not see the “light at the end of the tunnel,” as they take on more clinical demands and more administrative roles, Mehta observed.
Not surprising, clocking 60 or more hours per week increased the risk for burnout, compared with working 40 to 59 hours per week or fewer than 40 hours per week (41.5% vs 29.5% and 17.9%; P ≤ .001).
Burned-out cardiologists were also more likely than those who felt stressed or no burnout to report working in a hectic work environment (59.5% vs 32.3% and 14.6%; P ≤ .001) and to have plans to leave their current practice setting (58.1% vs 27.9% and 14.0%; P ≤ .001).
Factors that played a significant role in those plans were the desire to spend more time with family, on-call time, excessive work or relative value unit (RVU) targets, electronic health records, and the pressure to maintain high patient satisfaction scores, Mehta noted.
“Is any of this relatable to decreasing numbers of cardiologists in the U.S., or is there work to try and relate actual work force availability to burnout?” asked session moderator B. Hadley Wilson, MD, executive vice chair of the Sanger Heart & Vascular Institute in Charlotte, North Carolina, and a member of ACC’s Board of Trustees, following the presentation.
“It’s hard to decipher all of those exact details, but we do know that the cardiology work force tends to be older, so the mid-careers are going to be pulling on a lot more weight in the next few years, so that is a concern,” Mehta replied.
A big factor, however, is the excessive work hours put in by all cardiologists, especially the increasing amount of time spent with electronic medical records and administrative tasks, which is “taking away the fun we had in cardiology,” she added.
Limitations of the survey include the potential for bias; burnout was self-reported and may vary over time; and the 14% response rate was less than ideal, although the results are consistent with other national surveys, Mehta said.
In the recent Medscape Cardiologist Lifestyle, Happiness & Burnout Report 2020, 29% of respondents reported feeling burnout, 2% depressed, and 15% both burned out and depressed.
The Elephant in the Room
The new findings are “certainly a call to action, but it’s hard to avoid the elephant in the room, which is COVID-19,” said panelist Sandra Lewis, MD, Legacy Good Samaritan Hospital & Medical Center, Portland, Oregon.
“The implications of burnout are really front-and-center with our colleagues, who are working long hours, have hectic work environments, lack of control, and, more than that, a lack of safety of the work situations that we have worked so hard to achieve, as we run out of protective gear, we don’t have masks, as we see our colleagues falling victim to this.”
During her presentation, Mehta highlighted the ACC Clinician Well Being Portal and its COVID-19 Hub, but also several self-care strategies to employ, such as relinquishing control during these uncharted waters, revisiting personal strengths and abilities leveraged in other times of uncertainty, and giving yourself a “brain break” by challenging yourself to chat with a colleague for 30 minutes on topics unrelated to COVID-19 and other workplace stressors.
Wilson said the global pandemic only heightens concerns about burnout among cardiologists, which he likened to a “runaway train.”
“These are not great signals, I think they’re shocking, quite frankly,” Wilson told theheart.org | Medscape Cardiology.
“ACC is setting up a task force from the board of trustees to get to work right away and see about ways we can turn this around as quickly as possible and be a voice for the clinicians,” he said. “It’s not only cardiologists, it’s everybody on our cardiovascular care team, including nurses, physician assistants, nurse practitioners, and even pharmacists. Everybody’s burning out.”
The authors and Wilson report no relevant conflicts of interest.
American College of Cardiology 2020 Scientific Session (ACC.20)/World Congress of Cardiology (WCC). Abstract 403.08. Presented March 28, 2020.
This article first appeared on Medscape.com.
Doctors sound off about future of medical meetings
As most 2020 medical conferences have, one by one, been canceled or rescheduled as virtual meetings in the time of a pandemic, some physicians and other healthcare professionals are wondering if this is the year that will change the scene forever.
Amid the choruses of resignation (“Unfortunately, it’s the right thing to do.”) and optimism (“See you next year!”), there have been plenty of voices describing another broad sentiment – that all was not well with medical meetings even before the coronavirus.
One dominant criticism is that there are too many meetings.
Indeed, there are many, many meetings. During 2005–2015, there were 30,000-plus medical meetings in the United States, according to a report from the Healthcare Convention and Exhibitors Association.
Most of those are of little value, tweeted Dhruv Khullar, MD, an internist at Weill Cornell Medicine, New York City (@DhruvKhullar): “One possible consequence of cancelling so many meetings due to #COVID19 is that we realize we probably don’t need most of them.”
The tweet was liked 1.9K times, which is high for a medical post. Comments were mostly in agreement, with some skepticism.
Michaela West, MD, PhD, a surgeon at North Memorial Health, Minneapolis, Minnesota, responded (@MichaelaWst): “Agree. COVID-19 may forever change our perspective regarding medical professional meetings.”
Nwando Olayiwola, MD, chair of family medicine, Ohio State University, Columbus, strongly agreed (@DrNwando): “This is the tweet I wish I tweeted.”
However, Kelly Swords, MD, MPH, urologist, University of California, San Diego, in a dissenting opinion, stated the obvious (@k_dagger): “Except there is no substitute for human interaction.”
Worth the Effort?
The cancellation of medical meetings has given those who regularly attend an opportunity to reassess their value and to question the worth of the effort involved in attending in person.
David Steensma, MD, hematologist-oncologist, Harvard Medical School, Boston, (@DavidSteensma) tweeted that he would like to scale back: “The present crisis is an opportunity to reassess what is actually necessary and rebalance [in terms of meetings].”
Travel to meetings is often unpleasant, said others.
Chris Palatucci, life sciences executive recruiter, Coulter Partners, Boston, tweeted (@LifeSciRcruitr): “I will die a happy man if I never get on another plane. Glorified bus travel.” He also believes that once the coronavirus crisis is over, its “silver lining” will be the realization that “40% of all meetings are unnecessary.”
Many professionals have welcomed the announcements that major conferences have been canceled and will be conducted virtually.
The latest change is from the American Society of Clinical Oncology (ASCO), whose annual meeting was to be held in Chicago at the end of May but will now be held online.
Virtual ASCO will be more manageable – and comfy, said Fumiko Ladd Chino, MD, radiation oncologist, Memorial Sloan Kettering Cancer Center, New York City.
She (@fumikochino) explained why in a recent tweet: “1) I will be finally able to see ALL OF THE PRESENTATIONS I wanted to see instead of wandering around feeling overwhelmed. 2) I will be able to FOCUS on the presentations and not searching for a power outlet. 3) PAJAMAS.”
Virtual meetings already beat real meetings, added Adriana Scheliga, MD, hematologist-oncologist, Brazilian National Cancer Institute (@linfopedia): “I’ve been saying this for a while. For me the best ASCO Meetings, for example, are the “virtual meetings!”
However, meetings in place are also very much about professional community and mutual support, reminds Susan E. Sedory, MA, executive director, Society of Interventional Radiology, which canceled its meeting March 6 in a multifaceted process described by Medscape Medical News.
Is This the Time to Evaluate Meetings?
Coming up soon is the first major conference to go virtual after being canceled – the American College of Cardiology (ACC), which has been one of the top 20 largest meetings in the United States by attendance.
This meeting, which was to have taken place in Chicago on March 28–30, will now occur online on those days. The ACC says it will stream all “live” sessions on demand and provide access to additional videos, abstracts, and slides for at least 90 days after the meeting. And it will be free to anyone with an Internet connection.
Medical meetings in distant locales may bounce back, as they have grown into a very big business. ASCO is illustrative.
The group’s first scientific annual meeting was held in 1965 in Philadelphia, with about 70 members and invited guests in attendance. Fast forward 50-plus years to 2019: there were 42,500 attendees, a 4.4% increase from 2018. Notably, the top countries in attendance in 2019 were the United States and China.
Not everyone is happy that canceled meetings are being held online in the middle of a pandemic.
“In a COVID-19 world, the brain cannot focus on nonviral topics,” said commentator John Mandrola, MD, Baptist Health, Louisville, Kentucky, in his regular column for Medscape Cardiology/theheart.org.
The virtual ACC meeting should be canceled or delayed – to mirror what is happening in the world, he argues. “In hospitals, we have postponed the elective to make room for the coming surge. Shouldn’t ACC do the same? After the crisis passes, we can have a virtual meeting with a proper discussion of the science,” he writes.
But #MedTwitter, with its collective constructive criticism of medical meetings, is perhaps proof that the brain can function – and arrive at clarity – when under pandemic duress.
“Am I the only one experiencing a certain relief at the cancellation of multiple trips and meetings, and vowing to let this revelation affect my decision making in the future,” tweeted Steven Joffe, MD, MPH, University of Pennsylvania, Philadelphia (@Steve Joffe).
Louise Perkins King, MD, a bioethicist at Harvard Medical School, responded to Joffe. Hoping not to “belittle” the suffering from the COVID-19 pandemic, she (@louise_p_king) addressed her healthcare colleagues: “...there is potential for us all to learn what is essential travel and burden and what is not from this. I hope it leads to lasting change.”
This article first appeared on Medscape.com.
The power and promise of person-generated health data (Part II)
In Part I of our discussion we introduced the concept of person-generated health data (PGHD), defined as wellness and/or health-related data created, recorded, or gathered by individuals.

Such rich, longitudinal information is now being used in combination with traditional clinical information to predict, diagnose, and formulate treatment plans for diseases, as well as understand the safety and effectiveness of medical interventions.
Identifying a disease early
One novel example of digital technologies being used for early identification of disease was a promising 2019 study by Eli Lilly (in collaboration with Apple and Evidation Health) called the Lilly Exploratory Digital Assessment Study.
In this study, the feasibility of using PGHD for identifying physiological and behavioral signatures of cognitive impairment was examined for the purpose of seeking new methods to detect mild cognitive impairment (MCI) in a timely and cost-effective manner. The study enrolled 31 study participants with cognitive impairment and 82 without cognitive impairment. It used consumer-grade sensor technologies (the iPhone, Apple Watch, iPad, and Beddit sleep monitor) to continuously and unobtrusively collect data. Among the information the researchers collected were interaction with the phone keyboard, accelerometer data from the Apple Watch, volume of messages sent/received, and sleep cycles.1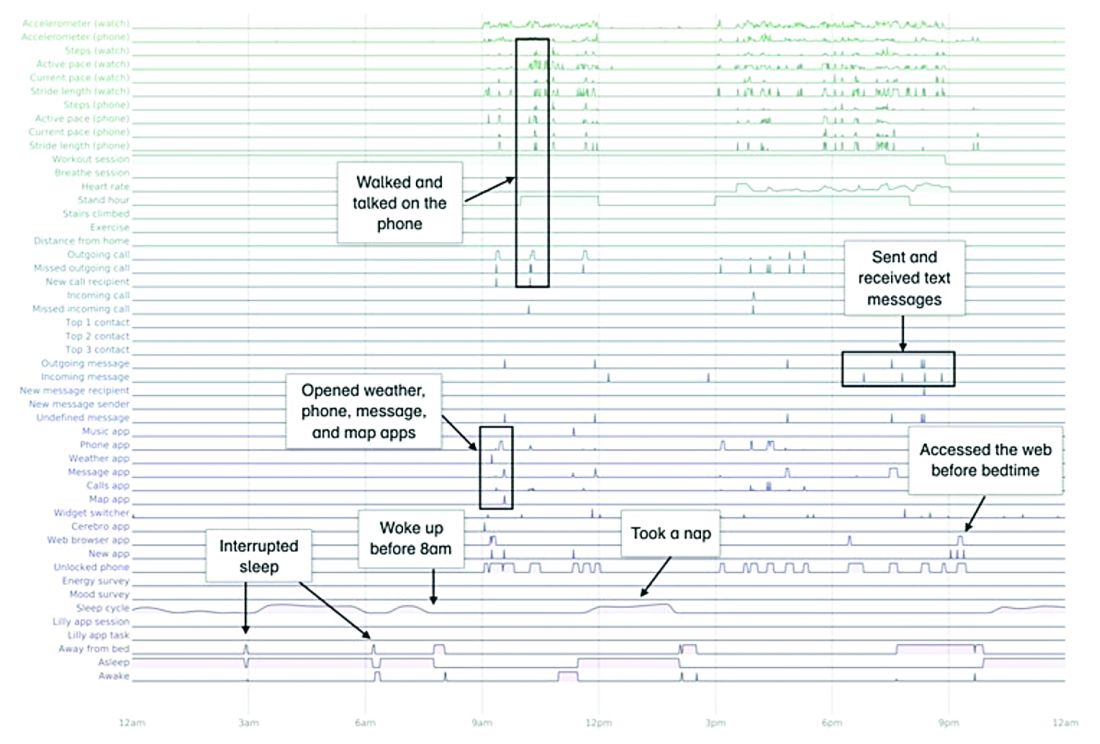
A total of 16 terabytes of data were collected over the course of 12 weeks. Data were organized into a behaviorgram (See Figure 1) that gives a holistic picture of a day in a patient’s life. A machine learning model was used to distinguish between behaviorgrams of symptomatic versus healthy controls, identifying typing speed, circadian rhythm shifts, and reliance on helper apps, among other things, as differentiating cognitively impaired from healthy controls. These behaviorgrams may someday serve as “fingerprints” of different diseases, with specific diseases displaying predictable patterns. In the near future, digital measures like the ones investigated in this study are likely to be used to help clinicians predict and diagnose disease, as well as to better understand disease progression and treatment response.
Leading to better health outcomes

The potential of PGHD to detect diseases early and lead to better health outcomes is being investigated in the Heartline study, a collaboration between Johnson & Johnson and Apple, which is supported by Evidation.2
This study aims to enroll 150,000 adults age 65 years and over to analyze the impact of Apple Watch–based early detection of irregular heart rhythms consistent with atrial fibrillation (AFib). The researchers’ hypothesis is that jointly detecting atrial fibrillation early and providing cardiovascular health programs to new AFib patients, will lead to patients being treated by a medical provider for AFib that otherwise would not have been detected. This, in turn, would lead to these AFib patients decreasing their risks of stroke and other serious cardiovascular events, including death, the study authors speculated.
Presenting new challenges
While PGHD has the potential to help people, it also presents new challenges. It is highly sensitive and personal – it can be as identifying as DNA.3
The vast amount of data that PGHD can collect from interaction with consumer wearable devices poses serious privacy risks if done improperly. To address those risks, companies like Evidation have built in protections. Evidation has an app, Achievement, that has enlisted a connected population of more than 3.5 million members who earn rewards for performing health-related actions, as tracked by wearables devices and apps. Through the Achievement app (See Figure 2.), members are provided opportunities to join research studies. As part of these studies, data collected from sensors and apps is used by permission of the member so that it is clear how their data are contributing to specific research questions or use cases.
This is a collaborative model of data collection built upon trust and permission and is substantially different than the collection of data from electronic health records (EHRs) – which is typically aggregated, deidentified, and commercialized, often without the patients’ knowledge or consent. Stringent protections, explicit permission, and transparency are absolutely imperative until privacy frameworks for data outside of HIPAA regulation catches up and protects patients from discrimination and unintended uses of their data.
Large connected cohorts can help advance our understanding of public health. In one study run on Achievement during the 2017-2018 flu season, a survey was sent to the Achievement population every week asking about symptoms of influenza-like illness and requesting permission to access historical data from their wearable around the influenza-like illness event.4 With the data, it was possible to analyze patterns of activity, sleep, and resting heart rate change around flu events. Resting heart rate, in particular, is shown to increase during fever and at the population level. In fact, through the use of PGHD, it is possible to use the fraction of people with resting heart rate above their usual baseline as a proxy to quantify the number of infected people in a region.5 This resting heart rate–informed flu surveillance method, if refined to increased accuracy, can work in near real time. This means it may be able detect influenza outbreaks days earlier than current epidemiological methods.
Health data generated by connected populations are in the early stages of development. It is clear that it will yield novel insights into health and disease. Only time will tell if it will be able to help clinicians and patients better predict, diagnose, and formulate treatment plans for disease.
Neil Skolnik, M.D. is a professor of family and community medicine at Sidney Kimmel Medical College, Thomas Jefferson University, and associate director of the Family Medicine Residency Program at Abington Jefferson Health. Luca Foschini PhD, is co-founder & chief data scientist at Evidation Health. Bray Patrick-Lake, MFS, is a patient thought leader and director of strategic partnerships at Evidation Health.
References
1. Chen R et al. Developing measures of cognitive impairment in the real world from consumer-grade multimodal sensor streams. KDD ’19. August 4–8, 2019 Aug 4-8.
2. The Heartline Study. https://www.heartline.com.
3. Foschini L. Privacy of Wearable and Sensors Data (or, the Lack Thereof?). Data Driven Investor, Medium. 2019.
4. Bradshaw B et al. Influenza surveillance using wearable mobile health devices. Online J Public Health Inform. 2019;11(1):e249.
5. Radin JM et al. Harnessing wearable device data to improve state-level real-time surveillance of influenza-like illness in the USA: a population-based study. Lancet Digital Health. 2020. doi: 10.1016/S2589-7500(19)30222-5.
In Part I of our discussion we introduced the concept of person-generated health data (PGHD), defined as wellness and/or health-related data created, recorded, or gathered by individuals.
Such rich, longitudinal information is now being used in combination with traditional clinical information to predict, diagnose, and formulate treatment plans for diseases, as well as understand the safety and effectiveness of medical interventions.
Identifying a disease early
One novel example of digital technologies being used for early identification of disease was a promising 2019 study by Eli Lilly (in collaboration with Apple and Evidation Health) called the Lilly Exploratory Digital Assessment Study.
In this study, the feasibility of using PGHD for identifying physiological and behavioral signatures of cognitive impairment was examined for the purpose of seeking new methods to detect mild cognitive impairment (MCI) in a timely and cost-effective manner. The study enrolled 31 study participants with cognitive impairment and 82 without cognitive impairment. It used consumer-grade sensor technologies (the iPhone, Apple Watch, iPad, and Beddit sleep monitor) to continuously and unobtrusively collect data. Among the information the researchers collected were interaction with the phone keyboard, accelerometer data from the Apple Watch, volume of messages sent/received, and sleep cycles.1
A total of 16 terabytes of data were collected over the course of 12 weeks. Data were organized into a behaviorgram (See Figure 1) that gives a holistic picture of a day in a patient’s life. A machine learning model was used to distinguish between behaviorgrams of symptomatic versus healthy controls, identifying typing speed, circadian rhythm shifts, and reliance on helper apps, among other things, as differentiating cognitively impaired from healthy controls. These behaviorgrams may someday serve as “fingerprints” of different diseases, with specific diseases displaying predictable patterns. In the near future, digital measures like the ones investigated in this study are likely to be used to help clinicians predict and diagnose disease, as well as to better understand disease progression and treatment response.
Leading to better health outcomes
The potential of PGHD to detect diseases early and lead to better health outcomes is being investigated in the Heartline study, a collaboration between Johnson & Johnson and Apple, which is supported by Evidation.2
This study aims to enroll 150,000 adults age 65 years and over to analyze the impact of Apple Watch–based early detection of irregular heart rhythms consistent with atrial fibrillation (AFib). The researchers’ hypothesis is that jointly detecting atrial fibrillation early and providing cardiovascular health programs to new AFib patients, will lead to patients being treated by a medical provider for AFib that otherwise would not have been detected. This, in turn, would lead to these AFib patients decreasing their risks of stroke and other serious cardiovascular events, including death, the study authors speculated.
Presenting new challenges
While PGHD has the potential to help people, it also presents new challenges. It is highly sensitive and personal – it can be as identifying as DNA.3
The vast amount of data that PGHD can collect from interaction with consumer wearable devices poses serious privacy risks if done improperly. To address those risks, companies like Evidation have built in protections. Evidation has an app, Achievement, that has enlisted a connected population of more than 3.5 million members who earn rewards for performing health-related actions, as tracked by wearables devices and apps. Through the Achievement app (See Figure 2.), members are provided opportunities to join research studies. As part of these studies, data collected from sensors and apps is used by permission of the member so that it is clear how their data are contributing to specific research questions or use cases.
This is a collaborative model of data collection built upon trust and permission and is substantially different than the collection of data from electronic health records (EHRs) – which is typically aggregated, deidentified, and commercialized, often without the patients’ knowledge or consent. Stringent protections, explicit permission, and transparency are absolutely imperative until privacy frameworks for data outside of HIPAA regulation catches up and protects patients from discrimination and unintended uses of their data.
Large connected cohorts can help advance our understanding of public health. In one study run on Achievement during the 2017-2018 flu season, a survey was sent to the Achievement population every week asking about symptoms of influenza-like illness and requesting permission to access historical data from their wearable around the influenza-like illness event.4 With the data, it was possible to analyze patterns of activity, sleep, and resting heart rate change around flu events. Resting heart rate, in particular, is shown to increase during fever and at the population level. In fact, through the use of PGHD, it is possible to use the fraction of people with resting heart rate above their usual baseline as a proxy to quantify the number of infected people in a region.5 This resting heart rate–informed flu surveillance method, if refined to increased accuracy, can work in near real time. This means it may be able detect influenza outbreaks days earlier than current epidemiological methods.
Health data generated by connected populations are in the early stages of development. It is clear that it will yield novel insights into health and disease. Only time will tell if it will be able to help clinicians and patients better predict, diagnose, and formulate treatment plans for disease.
Neil Skolnik, M.D. is a professor of family and community medicine at Sidney Kimmel Medical College, Thomas Jefferson University, and associate director of the Family Medicine Residency Program at Abington Jefferson Health. Luca Foschini PhD, is co-founder & chief data scientist at Evidation Health. Bray Patrick-Lake, MFS, is a patient thought leader and director of strategic partnerships at Evidation Health.
References
1. Chen R et al. Developing measures of cognitive impairment in the real world from consumer-grade multimodal sensor streams. KDD ’19. August 4–8, 2019 Aug 4-8.
2. The Heartline Study. https://www.heartline.com.
3. Foschini L. Privacy of Wearable and Sensors Data (or, the Lack Thereof?). Data Driven Investor, Medium. 2019.
4. Bradshaw B et al. Influenza surveillance using wearable mobile health devices. Online J Public Health Inform. 2019;11(1):e249.
5. Radin JM et al. Harnessing wearable device data to improve state-level real-time surveillance of influenza-like illness in the USA: a population-based study. Lancet Digital Health. 2020. doi: 10.1016/S2589-7500(19)30222-5.
EULAR cancels June congress, will hold virtual meeting instead
The European League Against Rheumatism has canceled its annual congress scheduled for June 3-6, 2020, in Frankfurt, Germany, and will instead hold a virtual meeting around the same time frame, according to a message from the organization’s president, Iain McInnes, MD, PhD.
“As a scientific medical society, it is our duty to ensure that our medical and health professional participants are available at the forefront of patient care. We are also concerned that bringing our RMD [rheumatic and musculoskeletal disease] patient delegates into a large meeting venue would be extremely unwise at this time,” Dr. McInnes wrote.
While the details of the virtual congress experience have yet to be worked out, Dr. McInnes said that its offerings “will be accessible on demand over a timeframe of several months,” and they “will also publish abstracts/posters online and provide registered delegates with the 1-year access to our journal, the Annals of Rheumatic Diseases.”
The EULAR president also asked for patience as the details of the virtual congress are determined. “We ask you to be patient for a little while longer to give us the time to develop clear answers to all your questions. Our volunteers and staff in the EULAR Office are currently working hard to develop the best possible solutions for this new scenario.”
Focus groups seek transgender experience with HIV prevention
A pair of focus groups explored the experience of transgender patients with HIV prevention, finding many were discouraged by experiences of care that was not culturally competent and affirming.
The findings, including other important themes, were published in Pediatrics.
The pair of online asynchronous focus groups, conducted by Holly B. Fontenot, PhD, RN/NP, of the Fenway Institute in Boston, and colleagues, sought input from 30 transgender participants from across the United States. Eleven were aged 13-18 years, and 19 were aged 18-24 years, with an average age of 19. Most (70%) were white, and the remainder were African American (7%), Asian American (3%), multiracial (17%), and other (3%); 10% identified as Hispanic. Participants were given multiple options for reporting gender identity; 27% reported identifying as transgender males, 17% reported identifying as transgender females, and the rest identified with other terms, including 27% using one or more terms.
The quantitative analysis found four common themes, which the study explored in depth: “barriers to self-efficacy in sexual decision making; safety concerns, fear, and other challenges in forming romantic and/or sexual relationships; need for support and education; and desire for affirmative and culturally competent experiences and interactions.”
Based on their findings, the authors suggested ways of improving transgender youth experiences:
- Increasing provider knowledge and skills in providing affirming care through transgender health education programs.
- Addressing the barriers, such as stigma and lack of accessibility.
- Expanding sexual health education to be more inclusive regarding gender identities, sexual orientations, and definitions of sex.
Providers also need to include information on sexually transmitted infection and HIV prevention, including “discussion of safer sexual behaviors, negotiation and consent, sexual and physical assault, condoms, lubrication, STI and HIV testing, human papillomavirus vaccination, and PrEP [preexposure prophylaxis]” the authors emphasized.
Dr. Fontenot and associates determined that this study’s findings were consistent with what’s known about adult transgender patients, but this study provides more context regarding transgender youth experiences.
“It is important to elicit transgender youth experiences and perspectives related to HIV risk and preventive services,” they concluded. “This study provided a greater understanding of barriers to and facilitators of youth obtaining HIV preventive services and sexual health education.”
Limitations of the study included that non–English speaking participants were excluded, and that participants were predominantly white, non-Hispanic, and assigned female sex at birth.
This study was funded by the Centers for Disease Control and Prevention and NORC at The University of Chicago. The authors had no relevant financial disclosures.
SOURCE: Fontenot HB et al., Pediatrics. 2020. doi: 10.1542/peds.2019-2204.
FROM PEDIATRICS
Hospitals muzzle doctors and nurses on PPE, COVID-19 cases
Over the past month, an orthopedic surgeon has watched as the crowd of sick patients at his hospital has grown, while the supply of personal protective equipment (PPE) for staff has diminished. As he prepares for another day of staffing testing tents and places his one and only mask across his face, he also receives a daily reminder from hospital management: Don’t talk about it.

The surgeon, who works in a COVID-19 hot spot in the Northeast, spoke on the condition of anonymity for fear of employer retribution.
“It’s very clear; no one is allowed to speak for the institution or of the institution,” he said in an interview. “We get a daily warning about being very prudent about posts on personal accounts. They’ve talked about this with respect to various issues: case numbers, case severity, testing availability, [and] PPEs.”
The warnings mean staff at the hospital suffer in silence, unable to share the troubling situation with the public or request assistance with supplies.
“I have one mask. We’re expected to reuse them, unless you were exposed or worked with a known COVID victim,” the surgeon said. “However, with the numbers in our region rapidly increasing, you can’t assume that people don’t have it or that you don’t have particles on your mask, even if you’re not in a known quarantine zone within the institution.”
As the COVID-19 health crisis rages on, online platforms have become a common place for health professionals to lament short supplies, share concerns, tell stories, and plead for help. But at the same time, other physicians, nurses, and health care workers are being muzzled by hospital administrators and threatened with discipline for speaking out about coronavirus caseloads and dwindling supplies. Some worry the gag orders are muddying the picture of how hospitals are faring in the pandemic, while placing the safety of frontline workers at risk.
The silencing of physicians by hospitals about PPE shortages and other COVID-19 issues has become widespread, said Nisha Mehta, MD, a physician advocate and community leader who writes about PPE on social media. Physicians are being warned not to speak or post publicly about their COVID-19 experiences, including PPE shortages, case specifics, and the percentage of full hospital beds, Dr. Mehta said in an interview. In some cases, physicians who have posted have been forced to take down the posts or have faced retribution for speaking out, she said.
“There’s definitely a big fear among physicians, particularly employed physicians, in terms of what the consequences may be for telling their stories,” Dr. Mehta said. “I find that counterproductive. I understand not inducing panic, but these are real stories that are important for people to understand so they do stay home and increase the systemic pressure to get sufficient PPE, so that we can preserve our health care workforce for a problem that is going to get worse before it gets better.”
Meanwhile, an Indiana hospitalist who took to social media to ask for masks for hospitals in his area says he was immediately reprimanded by his management after the posts came to light. The hospitalist posted on a social media platform to request donations of N95 masks after hearing members of the public had purchased such masks. He hoped his plea would aid preparation for the pandemic at local hospitals, explained the physician, who spoke on the condition of anonymity.
Shortly afterward, administrators from his hospital contacted the online forum’s moderator and the posts were removed, he said. During a subsequent conversation, administrators warned the doctor not to make such posts about PPE because it made the hospital appear incompetent.
“I was told, ‘we can handle this, we don’t need the public’s help,’” the physician said. “I was hurt and upset. I was trying to help protect my peers.”
After landing on the management’s radar, the hospitalist said he was reprimanded a second time about posts on a separate personal social media account. The second time, the private posts to friends and family were related to COVID-19 and PPE, but did not include any protected health information, he said. However, administrators did not like the content of the posts, and he was told management was monitoring his activity on social media, he said.
“The larger message is that patients are money,” the hospitalist said. “The corporate side of medicine rules out over the medicine side. Image and making sure there is a consistent cash flow trumps all else.”
Another frontline physician who works at a large New York hospital, said staff have been cautioned not to talk with the media and to be careful what they post on social media regarding COVID-19. The general rule is that only information approved by administrators can be shared, said the physician, who spoke on the condition of anonymity.
“[The health system] is very protective of their public image,” he said. “In the past, people that have posted things that they don’t like get spoken to quickly and/or fired depending on what was written. I could only imagine that would be the situation regarding COVID-19. They are very strict.”
The frontline physician, who has close contact with COVID-19 patients, said he has access to N95 masks at the moment, but when he requested higher-level protective gear, hospital management refused the request and denied that such supplies were needed.
“Safety of frontline workers appears to not be taken seriously,” he said of his hospital. “Everyone is stressed, but at the end of the day, the administration is sitting there, while the rest of us are putting ourselves at risk.”
We reached out to one hospital for comment, but messages were not returned. Other hospitals were not contacted because physicians feared they would face retribution. We also contacted the American Hospital Association but they did not immediately respond.
In Chicago, an email by a nurse to her coworkers about the safety of masks has resulted in a lawsuit after the nurse says she was fired for sharing her concerns with staff. The nurse, Lauri Mazurkiewicz, sent an email to staffers at Northwestern Memorial Hospital stating the surgical masks provided by the hospital were less effective against airborne particles than were N95 masks, according to a lawsuit filed March 23 in Cook County Circuit Court. Ms. Mazurkiewicz was terminated the next day in retaliation for her email, the lawsuit alleges.
Ms. Mazurkiewicz could not be reached for comment by press time.
Christopher King, a spokesman for Northwestern Medicine, said the hospital is reviewing the lawsuit.
“As Northwestern Medicine continues to respond to this unprecedented health care pandemic, the health and well-being of our patients, our staff and our employees is our highest priority,” he said in a statement. “We take these matters seriously and we are currently reviewing the complaint. At this time, we will not be commenting further.”
John Mandrola, MD, a Louisville, Ky.–based cardiologist who has written about the recent muzzling of frontline physicians with respect to the coronavirus, said he is not surprised that some hospitals are preventing physicians from sharing their experiences.
“Before C19, in many hospital systems, there was a culture of fear amongst employed clinicians,” he said. “Employed clinicians see other employed physicians being terminated for speaking frankly about problems. It takes scant few of these cases to create a culture of silence.”
Dr. Mandrola, who is a regular Medscape contributor, said that a number of doctors have reached out to him privately about PPE scarcity and shared that they were explicitly warned by administrators not to talk about the shortfalls. Leadership at Dr. Mandrola’s hospital has not issued the same warnings, he said.
“From the hat of total transparency, I think the public is not getting a full view of the impending potential problems that are going to come by doctors not speaking publicly,” he said. “On the other hand, hospital leadership is doing the best they can. It’s not the hospitals’ fault. Hospital administrators can’t manufacture masks.”
From a public health standpoint, Dr. Mehta said that not allowing health professionals to speak publicly about the situations at their hospitals is “irresponsible.” The public deserves to know what is happening, she said, and the health care workforce needs to prepare for what is to come.
“It’s so important that we hear from our colleagues,” she said. “It’s important to hear those accounts so we can prepare for what we’re about to face. Data is crucial. The more you learn from each other, the better shot we have at successfully treating cases and ultimately beating this.”
With the critical shortage of PPE at his hospital and the inability to speak out about the problem, the orthopedic surgeon foresees the dilemma continuing to worsen.
“It’s not only the lives of front-line health care workers that are at risk, but it’s those that they’re going to spread it to and those that are going to be coming to the hospital requiring our care,” he said. “If we don’t have a fully functioning health care force, our capacity is going to be diminished that much further.”
Over the past month, an orthopedic surgeon has watched as the crowd of sick patients at his hospital has grown, while the supply of personal protective equipment (PPE) for staff has diminished. As he prepares for another day of staffing testing tents and places his one and only mask across his face, he also receives a daily reminder from hospital management: Don’t talk about it.
The surgeon, who works in a COVID-19 hot spot in the Northeast, spoke on the condition of anonymity for fear of employer retribution.
“It’s very clear; no one is allowed to speak for the institution or of the institution,” he said in an interview. “We get a daily warning about being very prudent about posts on personal accounts. They’ve talked about this with respect to various issues: case numbers, case severity, testing availability, [and] PPEs.”
The warnings mean staff at the hospital suffer in silence, unable to share the troubling situation with the public or request assistance with supplies.
“I have one mask. We’re expected to reuse them, unless you were exposed or worked with a known COVID victim,” the surgeon said. “However, with the numbers in our region rapidly increasing, you can’t assume that people don’t have it or that you don’t have particles on your mask, even if you’re not in a known quarantine zone within the institution.”
As the COVID-19 health crisis rages on, online platforms have become a common place for health professionals to lament short supplies, share concerns, tell stories, and plead for help. But at the same time, other physicians, nurses, and health care workers are being muzzled by hospital administrators and threatened with discipline for speaking out about coronavirus caseloads and dwindling supplies. Some worry the gag orders are muddying the picture of how hospitals are faring in the pandemic, while placing the safety of frontline workers at risk.
The silencing of physicians by hospitals about PPE shortages and other COVID-19 issues has become widespread, said Nisha Mehta, MD, a physician advocate and community leader who writes about PPE on social media. Physicians are being warned not to speak or post publicly about their COVID-19 experiences, including PPE shortages, case specifics, and the percentage of full hospital beds, Dr. Mehta said in an interview. In some cases, physicians who have posted have been forced to take down the posts or have faced retribution for speaking out, she said.
“There’s definitely a big fear among physicians, particularly employed physicians, in terms of what the consequences may be for telling their stories,” Dr. Mehta said. “I find that counterproductive. I understand not inducing panic, but these are real stories that are important for people to understand so they do stay home and increase the systemic pressure to get sufficient PPE, so that we can preserve our health care workforce for a problem that is going to get worse before it gets better.”
Meanwhile, an Indiana hospitalist who took to social media to ask for masks for hospitals in his area says he was immediately reprimanded by his management after the posts came to light. The hospitalist posted on a social media platform to request donations of N95 masks after hearing members of the public had purchased such masks. He hoped his plea would aid preparation for the pandemic at local hospitals, explained the physician, who spoke on the condition of anonymity.
Shortly afterward, administrators from his hospital contacted the online forum’s moderator and the posts were removed, he said. During a subsequent conversation, administrators warned the doctor not to make such posts about PPE because it made the hospital appear incompetent.
“I was told, ‘we can handle this, we don’t need the public’s help,’” the physician said. “I was hurt and upset. I was trying to help protect my peers.”
After landing on the management’s radar, the hospitalist said he was reprimanded a second time about posts on a separate personal social media account. The second time, the private posts to friends and family were related to COVID-19 and PPE, but did not include any protected health information, he said. However, administrators did not like the content of the posts, and he was told management was monitoring his activity on social media, he said.
“The larger message is that patients are money,” the hospitalist said. “The corporate side of medicine rules out over the medicine side. Image and making sure there is a consistent cash flow trumps all else.”
Another frontline physician who works at a large New York hospital, said staff have been cautioned not to talk with the media and to be careful what they post on social media regarding COVID-19. The general rule is that only information approved by administrators can be shared, said the physician, who spoke on the condition of anonymity.
“[The health system] is very protective of their public image,” he said. “In the past, people that have posted things that they don’t like get spoken to quickly and/or fired depending on what was written. I could only imagine that would be the situation regarding COVID-19. They are very strict.”
The frontline physician, who has close contact with COVID-19 patients, said he has access to N95 masks at the moment, but when he requested higher-level protective gear, hospital management refused the request and denied that such supplies were needed.
“Safety of frontline workers appears to not be taken seriously,” he said of his hospital. “Everyone is stressed, but at the end of the day, the administration is sitting there, while the rest of us are putting ourselves at risk.”
We reached out to one hospital for comment, but messages were not returned. Other hospitals were not contacted because physicians feared they would face retribution. We also contacted the American Hospital Association but they did not immediately respond.
In Chicago, an email by a nurse to her coworkers about the safety of masks has resulted in a lawsuit after the nurse says she was fired for sharing her concerns with staff. The nurse, Lauri Mazurkiewicz, sent an email to staffers at Northwestern Memorial Hospital stating the surgical masks provided by the hospital were less effective against airborne particles than were N95 masks, according to a lawsuit filed March 23 in Cook County Circuit Court. Ms. Mazurkiewicz was terminated the next day in retaliation for her email, the lawsuit alleges.
Ms. Mazurkiewicz could not be reached for comment by press time.
Christopher King, a spokesman for Northwestern Medicine, said the hospital is reviewing the lawsuit.
“As Northwestern Medicine continues to respond to this unprecedented health care pandemic, the health and well-being of our patients, our staff and our employees is our highest priority,” he said in a statement. “We take these matters seriously and we are currently reviewing the complaint. At this time, we will not be commenting further.”
John Mandrola, MD, a Louisville, Ky.–based cardiologist who has written about the recent muzzling of frontline physicians with respect to the coronavirus, said he is not surprised that some hospitals are preventing physicians from sharing their experiences.
“Before C19, in many hospital systems, there was a culture of fear amongst employed clinicians,” he said. “Employed clinicians see other employed physicians being terminated for speaking frankly about problems. It takes scant few of these cases to create a culture of silence.”
Dr. Mandrola, who is a regular Medscape contributor, said that a number of doctors have reached out to him privately about PPE scarcity and shared that they were explicitly warned by administrators not to talk about the shortfalls. Leadership at Dr. Mandrola’s hospital has not issued the same warnings, he said.
“From the hat of total transparency, I think the public is not getting a full view of the impending potential problems that are going to come by doctors not speaking publicly,” he said. “On the other hand, hospital leadership is doing the best they can. It’s not the hospitals’ fault. Hospital administrators can’t manufacture masks.”
From a public health standpoint, Dr. Mehta said that not allowing health professionals to speak publicly about the situations at their hospitals is “irresponsible.” The public deserves to know what is happening, she said, and the health care workforce needs to prepare for what is to come.
“It’s so important that we hear from our colleagues,” she said. “It’s important to hear those accounts so we can prepare for what we’re about to face. Data is crucial. The more you learn from each other, the better shot we have at successfully treating cases and ultimately beating this.”
With the critical shortage of PPE at his hospital and the inability to speak out about the problem, the orthopedic surgeon foresees the dilemma continuing to worsen.
“It’s not only the lives of front-line health care workers that are at risk, but it’s those that they’re going to spread it to and those that are going to be coming to the hospital requiring our care,” he said. “If we don’t have a fully functioning health care force, our capacity is going to be diminished that much further.”