User login
MSS metastatic CRC: Patients without liver involvement may benefit from PD-1/PD-L1 inhibitors
Key clinical point: Patients with microsatellite stable (MSS) metastatic colorectal cancer (mCRC) with liver metastasis showed resistance to programmed cell death receptor 1/programmed death ligand 1 (PD-1/PD-L1) inhibition, whereas those without liver involvement may derive clinical benefit.
Major finding: Patients without vs with liver metastases had a significantly superior objective response rate (19.5% vs 0.0%; P less than .001) and median progression-free survival (PFS; 4.0 months vs 1.5 months; P less than .001). Liver metastasis at the time of initiation of PD-1/PD-L1 therapy was the most significant factor associated with worse PFS (hazard ratio, 7.00; P < .001).
Study details: Findings are from a retrospective cohort study of 95 patients with MSS mCRC who received PD-1/PD-L1–targeting therapy after progression with prior standard chemotherapy.
Disclosures: No source of funding was declared. Dr. Fakih reported receiving honoraria and research funding and serving as an advisor and on the speakers’ bureau for various sources. No other disclosures were reported.
Source: Wang C et al. JAMA Netw Open. 2021 Aug 9. doi: 10.1001/jamanetworkopen.2021.18416.
Computer-aided detection system superior to other endoscopic imaging techniques in detecting colorectal neoplasia
Key clinical point: Computer-aided detection (CADe) has higher rates of colorectal neoplasia detection than other advanced endoscopic techniques like chromoendoscopy or mucosal visualization tools.
Major finding: The magnitude of increase in adenoma detection rate was higher with CADe vs chromoendoscopy (odds ratio [OR], 1.45; 95% confidence interval [CI], 1.14-1.85) or with increased mucosal visualization systems (OR, 1.54; 95% CI, 1.22-1.94). Compared with high-definition white-light endoscopy, only CADe showed a significant increase in the detection of large adenomas (OR, 1.69; 95% CI, 1.10-2.60).
Study details: Findings are from a systematic review and meta-analysis of 50 randomized control trials including 34,445 participants who underwent colonoscopy.
Disclosures: There was no source of funding for this study. Some of the authors declared receiving consulting fees from Olympus, Medtronic, Fuji, Boston, Aries Pharmaceutical, Braintree Laboratories, Norgine, Endokey, and GI Supply.
Source: Spadaccini M et al. Lancet Gastroenterol Hepatol. 2021 Aug 4. doi: 10.1016/S2468-1253(21)00215-6.
Dapagliflozin in HFrEF may cut arrhythmias, sudden death: DAPA-HF
Dapagliflozin might reduce the risk for ventricular arrhythmias and sudden death in patients with heart failure and reduced ejection fraction (HFrEF), a post hoc analysis of the DAPA-HF trial suggests.
The addition of dapagliflozin to standard therapy reduced the relative risk for the primary composite endpoint of any serious ventricular arrhythmia, resuscitated cardiac arrest, or sudden death by 21%, compared with placebo (hazard ratio, 0.79; 95% confidence interval, 0.63-0.99). The absolute risk reduction was 1.5% (5.9% vs. 7.4%).
The benefit was consistent in a competing-risks analysis that included all-cause mortality (HR, 0.80; P = .043) and across the individual components of the composite outcome, James Curtain, MD, Cardiovascular Research Centre of Glasgow, said at the annual congress of the European Society of Cardiology.
As previously reported from the main trial, treatment with the sodium-glucose cotransporter 2 (SGLT2) inhibitor cut the primary endpoint of cardiovascular death or worsening heart failure by 26% among 4,744 patients with HFrEF and in New York Heart Association functional class 2-4.
Cochair of the late-breaking science session, Lars Lund, MD, Karolinska Institute, Stockholm, pointed out that dapagliflozin reduced sudden cardiac deaths and related events to an extent similar to that observed for cardiovascular deaths, total mortality, and the main trial’s primary endpoint.
“So does that mean it has any particular effect on arrhythmic events or does it mean, such as a beta-blocker, for example, [it] reduces calcium transience and improves handling of calcium, or does it have an effect simply by improving heart failure?” he asked.
Dr. Curtain replied they are still trying to understand the effects of this new class of drug but that studies have shown dapagliflozin and other SGLT2 inhibitors have favorable effects on adverse cardiac remodeling, which contributes to sudden death and ventricular arrhythmia. They’ve also been shown to reduce cardiac chamber size, left ventricular hypertrophy, and N-terminal pro-B-type natriuretic peptide (NT-proBNP) levels over time, consistent with a reduction in myocardial wall stress. “So it could indeed be one of several mechanisms by which they may exert a beneficial cardiac effect.”
Speaking with this news organization, Dr. Curtain pointed out that the Kaplan-Meier curves for the composite outcome began to separate early on, but that the clearest separation was after 9 months, suggestive of a positive action on adverse cardiac remodeling over time.
“This would improve the patients’ heart failure situation, but also thick ventricles are a key risk factor for the occurrence of sudden death and ventricular arrhythmias,” he said. “The effects on adverse cardiac remodeling, given its plausibility in terms of our Kaplan-Meier curves, are one [mechanism] that I’d look to in the first instance, but I’m sure there are more than one actions at play.”
According to the new analysis, the primary outcome occurred in 315 (6.6%) patients; there were 203 adjudicated sudden deaths (64%), 104 investigator-reported ventricular arrhythmias (33%), and 8 resuscitated cardiac arrests (3%). Independent predictors of the primary outcome were higher NT-proBNP levels (odds ratio, 1.54), previous ventricular arrhythmia (OR, 1.93), previous myocardial infarction (OR, 1.42), male sex (OR, 1.53), and higher body mass index (OR, 1.03).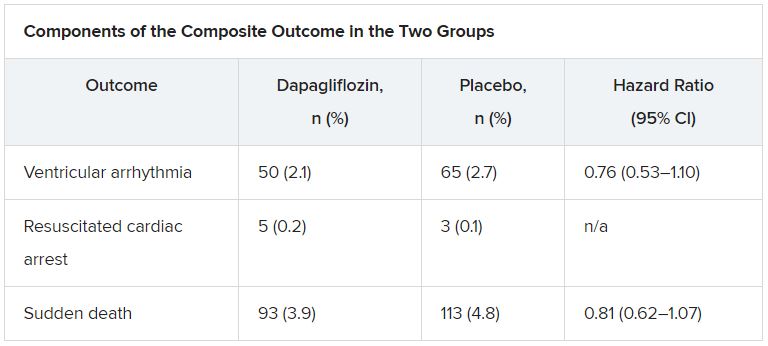
The effect of dapagliflozin on the primary outcome was consistent in several sensitivity analyses and “generally consistent” across key subgroups, Dr. Curtain said.
During a discussion of the results, session cochair Mitja Lainscak, MD, General Hospital Murska Sobota, Slovenia, called out two exceptions. “With regard to patients with implanted ICDs, the effect was neutral, and in the patients without diabetes, the benefit was less than in diabetic patients. Any explanations for that?”
Dr. Curtain responded that “it’s important to note that in the subgroup analyses the point estimates were all on the side favoring dapagliflozin and the interaction test was not significant in that subgroup. The numbers of patients who were in the defibrillator group were modest, and there was a relatively smaller number of events, so it may be harder to show benefit in that group.”
In the dapagliflozin and placebo groups, the event rates per 100 person-years were 3.9 and 5.8, respectively, in patients with diabetes, and 4.1 and 4.7, respectively, in those without diabetes (P for interaction = .273).
Event rates per 100 person-years were 5.8 and 5.9, respectively, in patients with a defibrillator at baseline, and 3.5 and 4.9, respectively, in those without a defibrillator (P for interaction = .174).
Asked to comment on the study, which was simultaneously published in the European Heart Journal, Milton Packer, MD, Baylor University Medical Center, Dallas, said he had “very little confidence” in the findings.
“This was entirely post hoc and the investigators combined events – with markedly different levels of clinical importance – in order to achieve a P value less than 0.05,” he told this news organization. “If one takes asymptomatic ventricular arrhythmias out of the analysis, the effect is no longer statistically significant. Furthermore, half of sudden deaths in patients with heart failure are not related to a ventricular arrhythmia.”
The authors note in their report that the analysis was not prespecified and the findings should be regarded as “hypothesis generating and require confirmation,” but also point out that a recent meta-analysis showed that SGLT2 inhibitor use was associated with a lower risk for ventricular tachycardia. Other limitations to the post hoc analysis are that adverse-event reporting likely underestimated the true prevalence of ventricular arrhythmias, and that these events were not adjudicated.
DAPA-HF was funded by AstraZeneca. Dr. Curtain reports no relevant financial relationships. Disclosures for the coauthors are listed in the paper.
A version of this article first appeared on Medscape.com.
FROM ESC CONGRESS 2021
Human brain patterns may help build a better AI system
new research suggests. “This work opens new opportunities to discover how the network organization of the brain optimizes cognitive capacity,” wrote researchers from The Neuro (Montreal Neurological Institute–Hospital) and the Quebec Artificial Intelligence Institute.

Senior investigator Bratislav Misic, PhD, said the research has potential clinical application for studying diseases of the brain, which is something his team is actively working on. “For example, using MRI techniques, we can measure different patterns of atrophy in neurodegenerative diseases such as Alzheimer’s disease,” he said.
“We can use these disease patterns from real patients to artificially lesion these connectomes and to ask how a particular disease causes a particular pattern of symptoms and cognitive deficits,” he added.
The findings were published online in Nature Machine Intelligence.
Unique approach
Using brain imaging data, the investigators reconstructed a human brain connectivity pattern and applied it to an artificial neural network. After training, the artificial neural network successfully performed a working memory task more flexibly and efficiently than other “benchmark” AI systems.
The researchers noted that their approach is unique because previous work on brain connectivity, also known as connectomics, has focused on describing brain organization without regard to how it actually functions.
Traditional artificial neural network have arbitrary structures that do not reflect how real brain networks are organized. Integrating brain connectomics into the construction of artificial neural network can reveal how the wiring of the brain supports specific cognitive skills, the investigators wrote.
“Up until now, if you look at how neural networks are constructed, the architectures that are used are very ad hoc and very problem specific,” Dr. Misic said. “But the connectomics revolution that’s happened in neuroscience over the past 20 years or so has given us the ability to really measure and trace out connection patterns in a variety of organisms, including the human brain.”
He noted that the researchers took wiring patterns of the real human brain and implemented it as an artificial neural network. They then “trained that network to perform a very simple cognitive task, and when you compare it to other benchmark architectures, it actually does better.”
This shows that there is “something fundamentally different about how the human brain is wired up and that the design principles that we can see in the human brain could be used to potentially build better artificial networks,” Dr. Misic concluded.
Funding for the research was provided by the Canada First Research Excellence Fund, awarded to McGill University for the Healthy Brains, Healthy Lives initiative, and by the Natural Sciences and Engineering Research Council of Canada, Fonds de Recherche du Quebec – Santé, the Canadian Institute for Advanced Research, Canada Research Chairs, Fonds de Recherche du Quebec – Nature et Technologies, and the Centre UNIQUE (Union of Neuroscience and Artificial Intelligence). The investigators have reported no relevant financial relationships.
A version of this article first appeared on Medscape.com.
new research suggests. “This work opens new opportunities to discover how the network organization of the brain optimizes cognitive capacity,” wrote researchers from The Neuro (Montreal Neurological Institute–Hospital) and the Quebec Artificial Intelligence Institute.
Senior investigator Bratislav Misic, PhD, said the research has potential clinical application for studying diseases of the brain, which is something his team is actively working on. “For example, using MRI techniques, we can measure different patterns of atrophy in neurodegenerative diseases such as Alzheimer’s disease,” he said.
“We can use these disease patterns from real patients to artificially lesion these connectomes and to ask how a particular disease causes a particular pattern of symptoms and cognitive deficits,” he added.
The findings were published online in Nature Machine Intelligence.
Unique approach
Using brain imaging data, the investigators reconstructed a human brain connectivity pattern and applied it to an artificial neural network. After training, the artificial neural network successfully performed a working memory task more flexibly and efficiently than other “benchmark” AI systems.
The researchers noted that their approach is unique because previous work on brain connectivity, also known as connectomics, has focused on describing brain organization without regard to how it actually functions.
Traditional artificial neural network have arbitrary structures that do not reflect how real brain networks are organized. Integrating brain connectomics into the construction of artificial neural network can reveal how the wiring of the brain supports specific cognitive skills, the investigators wrote.
“Up until now, if you look at how neural networks are constructed, the architectures that are used are very ad hoc and very problem specific,” Dr. Misic said. “But the connectomics revolution that’s happened in neuroscience over the past 20 years or so has given us the ability to really measure and trace out connection patterns in a variety of organisms, including the human brain.”
He noted that the researchers took wiring patterns of the real human brain and implemented it as an artificial neural network. They then “trained that network to perform a very simple cognitive task, and when you compare it to other benchmark architectures, it actually does better.”
This shows that there is “something fundamentally different about how the human brain is wired up and that the design principles that we can see in the human brain could be used to potentially build better artificial networks,” Dr. Misic concluded.
Funding for the research was provided by the Canada First Research Excellence Fund, awarded to McGill University for the Healthy Brains, Healthy Lives initiative, and by the Natural Sciences and Engineering Research Council of Canada, Fonds de Recherche du Quebec – Santé, the Canadian Institute for Advanced Research, Canada Research Chairs, Fonds de Recherche du Quebec – Nature et Technologies, and the Centre UNIQUE (Union of Neuroscience and Artificial Intelligence). The investigators have reported no relevant financial relationships.
A version of this article first appeared on Medscape.com.
FROM NATURE MACHINE INTELLIGENCE
NIH to study COVID vaccine booster in people with autoimmune disease
In the wake of the Centers for Disease Control and Prevention’s recommendation for a third COVID-19 mRNA vaccine dose for immunocompromised people and the Food and Drug Administration’s authorization of the third dose, the according to an announcement.
The investigators of the trial, called COVID‐19 Booster Vaccine in Autoimmune Disease Non‐Responders, also want to determine if pausing immunosuppressive therapy for autoimmune disease improves the antibody response to an extra dose of a COVID-19 vaccine.
The trial will specifically look at the effects of mycophenolate mofetil (MMF) or mycophenolic acid (MPA), and methotrexate (MTX), or receipt of B cell–depletion therapy such as rituximab within the past 12 months on immune response to a booster dose in people with systemic lupus erythematosus, rheumatoid arthritis, multiple sclerosis, systemic sclerosis, or pemphigus. They have to have either no serologic response to their initial COVID-19 vaccine regimen or a suboptimal response, defined as a Roche Elecsys Anti-SARS-CoV-2 S (RBD) result greater than or equal to 50 U/mL.
The results of studies conducted in solid-organ transplant recipients who take immunosuppressants showed that an extra dose of vaccine could improve the immune response to the vaccine in many of the individuals, which suggests that the same approach might work in people with autoimmune disease who need treatment with immunosuppressive drugs. Improving the immune response of people with autoimmune disease to COVID-19 vaccines is important because higher rates of severe COVID-19 and death have been reported in this group of patients than in the general population, and it is unclear whether this is attributable to the autoimmune disease, the immunosuppressive medications taken to treat it, or both.
The open-label trial, conducted by the NIAID-funded Autoimmunity Centers of Excellence, aims to enroll 600 people aged 18 years and older with those conditions at 15-20 sites in the United States.
Because medications commonly taken by people with these conditions have been associated with poorer immune responses to vaccines, the trial will randomize the following two cohorts to stop or continue taking their immunosuppressive medication(s) or stop them before and after the booster according to protocol:
- Cohort 1 includes people who are taking MMF or MPA, without additional B cell–depleting medications or MTX.
- Cohort 2 includes people who are taking MTX without additional B cell–depleting medications or MMF/MPA.
A third, nonrandomized cohort consists of people who have received B cell–depletion therapy within the past 12 months regardless of whether they are also taking MMF/MPA or MTX.
Besides the cohort-specific exclusions, other rheumatic disease medications, including biologics, are allowed in the groups.
The primary outcome of the trial is the proportion of participants who have a protective antibody response at week 4. Secondary outcomes will examine various antibody responses at intervals, changes in disease activity across autoimmune diseases, adverse events, and SARS-CoV-2 infections out to 48 weeks.
Study participants will be followed for a total of 13 months. Preliminary results are expected in November 2021, according to the National Institutes of Health.
The trial is being led by Judith James, MD, PhD; Meggan Mackay, MD, MS; Dinesh Khanna, MBBS, MSc; and Amit Bar-Or, MD.
ICMs detect serious arrhythmias in high-risk post-MI patients: SMART-MI
Prevention strategies may be next
After a myocardial infarction, implantable cardiac monitors (ICMs) are sensitive for detecting serious arrhythmias in patients with cardiac autonomic dysfunction but only moderately reduced left ventricular ejection fraction (LVEF), according to results of the randomized SMART-MI trial.

When remote monitoring with the ICM was compared with conventional follow-up in this group of patients, serious arrhythmic events were detected at a nearly sixfold greater rate, reported Axel Bauer, MD, at the annual congress of the European Society of Cardiology.
The study further showed that these events were closely associated with subsequent major adverse cardiac and cerebrovascular events (MACCE).
“SMART-MI is the first study to test an implantable device in high-risk MI patients with a LVEF greater than 35%,” reported Dr. Bauer, a cardiologist and director of the internal medicine clinic, University of Innsbruck (Austria). It showed that the types and frequency of arrhythmias were “comparable to those of post-MI patients with reduced LVEF.”
The ability to assess risk is potentially significant because “the majority of cardiovascular complications, including sudden death, occur in patients with only moderately reduced LVEF,” explained Dr. Bauer.
Despite the greater risk, “there are no preventive strategies so far” currently available for this group, he said.
The SMART-MI study confirms the need for treatments, confirms a method for monitoring risk, and might provide the basis for trials designed to test treatments to modify this risk, he added.
ECG used to define autonomic dysfunction
In the SMART MI protocol, 1,305 survivors of MI with LVEF of 36%-50% at 33 participating centers in Austria and Germany were evaluated with a 20-minute high resolution electrocardiogram. They were enrolled and randomized if they demonstrated cardiac autonomic dysfunction on at least two validated ECG biomarkers.
The 400 participants were randomized to implantation of a ICM, which transmitted daily reports to a ICM core laboratory, or to conventional follow-up.
After a median follow-up of 21 months, serious events were detected in 60 of the 201 patients in the ICM group and 12 of the 199 patients in the control group (29% vs. 6%). Serious adverse events were defined as those that would typically warrant therapy, such as prolonged atrial fibrillation (at least 6 minutes) high-degree atrioventricular block, and sustained ventricular tachycardia.
The difference in the detection rate, which was the primary endpoint, was highly significant (P < .0001), but the study was also able to confirm that these events predicted MACCE, a secondary study endpoint. In those with a serious arrhythmia, the hazard ratio for subsequent MACCE was approximately sevenfold greater relative to those without a serious arrhythmia. This was true of those in the ICM group (HR, 6.8; P < .001) and controls (HR 7.3; P < .001).
Arrhythmias warn of impending complications
“The data show that the prognostic impact of detecting a serious arrhythmia does not depend on the mode of detection,” Dr. Bauer reported. The data also confirm that “subclinical serious arrhythmia events are a warning signal for an impending complication.”
Although more interventions – including pacemakers, catheter ablations, and oral anticoagulants – were offered to patients in the experimental arm, “the study was not powered to show differences in outcomes,” and, in fact, no significant differences were observed, according to Dr. Bauer. However, the evidence that ICM is effective for detecting arrhythmias does provide a structure on which to build clinical trials.
“We now need the trials to see if ICM can change practice and improve outcomes,” said Carlos Aguiar, MD, a staff cardiologist at the Hospital Santa Cruz, Lisbon. He acknowledged that this study proves that ICM can detect serious arrhythmias in patients with moderate left ventricular dysfunction, but “we need to develop and test treatment paths.”
Dr. Aguiar considers SMART-MI an important study that “goes to the heart” of a common clinical dilemma.
“In clinical practice, we see patients with LVEF that is not that suppressed and so do not have a class I indication for ICM, but there are often features that might have you concerned and make you think it would be great if the LVEF was 35% or lower [to justify intervention],” Dr. Aguiar said.
Data provide insight on unaddressed risk group
SMART-MI confirms earlier evidence that post-MI patients with cardiac autonomic dysfunction are at high risk. Currently, this relative increase in risk goes “unaddressed,” according to Dr. Bauer. Although he contended that the risk itself “could be an indication for ICM in a high-risk patient group without classically defined left ventricular dysfunction,” he agreed that the ultimate value of this trial might be that it “opens a window” for a rationale to test preventive strategies.

An invited ESC discussant, Gerhard Hindricks, MD, PhD, praised the study for drawing attention to the risk of events in a subset of post-MI patients with LVEF of 35% or greater. However, he suggested that criteria other than those based on ECG might be more sensitive for selecting patients who might benefit from intervention.
“We do not know whether additional methods of establishing risk, such as imaging, might be valuable,” said Dr. Hindricks, chief of the department of arrhythmology in the Heart Institute of the University of Leipzig (Germany). He believes work in this area is needed to ensure appropriate entry criteria for interventional trials designed to modify risk in post-MI patients who do not meet the traditional definition of reduced ejection fraction.
Dr. Bauer reports financial relationships with Medtronic, which sponsored this study, as well as Bayer, Boehringer Ingelheim, Edwards, and Novartis. Dr. Aguiar reports no relevant financial conflicts.
Prevention strategies may be next
Prevention strategies may be next
After a myocardial infarction, implantable cardiac monitors (ICMs) are sensitive for detecting serious arrhythmias in patients with cardiac autonomic dysfunction but only moderately reduced left ventricular ejection fraction (LVEF), according to results of the randomized SMART-MI trial.
When remote monitoring with the ICM was compared with conventional follow-up in this group of patients, serious arrhythmic events were detected at a nearly sixfold greater rate, reported Axel Bauer, MD, at the annual congress of the European Society of Cardiology.
The study further showed that these events were closely associated with subsequent major adverse cardiac and cerebrovascular events (MACCE).
“SMART-MI is the first study to test an implantable device in high-risk MI patients with a LVEF greater than 35%,” reported Dr. Bauer, a cardiologist and director of the internal medicine clinic, University of Innsbruck (Austria). It showed that the types and frequency of arrhythmias were “comparable to those of post-MI patients with reduced LVEF.”
The ability to assess risk is potentially significant because “the majority of cardiovascular complications, including sudden death, occur in patients with only moderately reduced LVEF,” explained Dr. Bauer.
Despite the greater risk, “there are no preventive strategies so far” currently available for this group, he said.
The SMART-MI study confirms the need for treatments, confirms a method for monitoring risk, and might provide the basis for trials designed to test treatments to modify this risk, he added.
ECG used to define autonomic dysfunction
In the SMART MI protocol, 1,305 survivors of MI with LVEF of 36%-50% at 33 participating centers in Austria and Germany were evaluated with a 20-minute high resolution electrocardiogram. They were enrolled and randomized if they demonstrated cardiac autonomic dysfunction on at least two validated ECG biomarkers.
The 400 participants were randomized to implantation of a ICM, which transmitted daily reports to a ICM core laboratory, or to conventional follow-up.
After a median follow-up of 21 months, serious events were detected in 60 of the 201 patients in the ICM group and 12 of the 199 patients in the control group (29% vs. 6%). Serious adverse events were defined as those that would typically warrant therapy, such as prolonged atrial fibrillation (at least 6 minutes) high-degree atrioventricular block, and sustained ventricular tachycardia.
The difference in the detection rate, which was the primary endpoint, was highly significant (P < .0001), but the study was also able to confirm that these events predicted MACCE, a secondary study endpoint. In those with a serious arrhythmia, the hazard ratio for subsequent MACCE was approximately sevenfold greater relative to those without a serious arrhythmia. This was true of those in the ICM group (HR, 6.8; P < .001) and controls (HR 7.3; P < .001).
Arrhythmias warn of impending complications
“The data show that the prognostic impact of detecting a serious arrhythmia does not depend on the mode of detection,” Dr. Bauer reported. The data also confirm that “subclinical serious arrhythmia events are a warning signal for an impending complication.”
Although more interventions – including pacemakers, catheter ablations, and oral anticoagulants – were offered to patients in the experimental arm, “the study was not powered to show differences in outcomes,” and, in fact, no significant differences were observed, according to Dr. Bauer. However, the evidence that ICM is effective for detecting arrhythmias does provide a structure on which to build clinical trials.
“We now need the trials to see if ICM can change practice and improve outcomes,” said Carlos Aguiar, MD, a staff cardiologist at the Hospital Santa Cruz, Lisbon. He acknowledged that this study proves that ICM can detect serious arrhythmias in patients with moderate left ventricular dysfunction, but “we need to develop and test treatment paths.”
Dr. Aguiar considers SMART-MI an important study that “goes to the heart” of a common clinical dilemma.
“In clinical practice, we see patients with LVEF that is not that suppressed and so do not have a class I indication for ICM, but there are often features that might have you concerned and make you think it would be great if the LVEF was 35% or lower [to justify intervention],” Dr. Aguiar said.
Data provide insight on unaddressed risk group
SMART-MI confirms earlier evidence that post-MI patients with cardiac autonomic dysfunction are at high risk. Currently, this relative increase in risk goes “unaddressed,” according to Dr. Bauer. Although he contended that the risk itself “could be an indication for ICM in a high-risk patient group without classically defined left ventricular dysfunction,” he agreed that the ultimate value of this trial might be that it “opens a window” for a rationale to test preventive strategies.
An invited ESC discussant, Gerhard Hindricks, MD, PhD, praised the study for drawing attention to the risk of events in a subset of post-MI patients with LVEF of 35% or greater. However, he suggested that criteria other than those based on ECG might be more sensitive for selecting patients who might benefit from intervention.
“We do not know whether additional methods of establishing risk, such as imaging, might be valuable,” said Dr. Hindricks, chief of the department of arrhythmology in the Heart Institute of the University of Leipzig (Germany). He believes work in this area is needed to ensure appropriate entry criteria for interventional trials designed to modify risk in post-MI patients who do not meet the traditional definition of reduced ejection fraction.
Dr. Bauer reports financial relationships with Medtronic, which sponsored this study, as well as Bayer, Boehringer Ingelheim, Edwards, and Novartis. Dr. Aguiar reports no relevant financial conflicts.
FROM ESC CONGRESS 2021
Study evaluates OTC treatments for molluscum contagiosum
“It’s important for clinicians who see children with molluscum to be aware of the many products marketed to patients and to be able to provide objective information about them,” senior author Elaine Siegfried, MD, said in an interview following the annual meeting of the Society for Pediatric Dermatology, where the abstract was presented during a poster session.
In the text of their abstract, Dr. Siegfried, professor of pediatrics and dermatology at Saint Louis University, and coauthors Isaac Hoft, of Open Mind Holistics in Ft. Collins, Colo., and Samantha K. Ong, BA, a student at SLU, noted that MC primarily infects children, with an annual incidence of 8%. “Although the disease is self-limited, associated symptoms, contagion and an average 1-year duration prompt concern and frequent medical visits,” they wrote.
The optimal treatment for MC has not been defined and there is currently no approved medication approved for the condition, although three products are in development: VP-102 (cantharidin) by Verrica Pharmaceuticals; SB206, a topical antiviral by Novan; and 10%-15% KOH formulation by the Gurina Foundation.
But many OTC products have been marketed to treat the condition. To identify the OTC products and to assess accompanying information related to safety, efficacy, and cost, the researchers performed an internet search using the terms “molluscum” plus “treatment,” “treatment at home,” “relief,” and “medication.” Eight products were identified for analysis: Conzerol (Elroselabs), Molleave (Innovative Med), Mollenol (Jeva Laboratories), MolluscumBLAST (Revitalize Life Organics), Molluscum Away Patches (Molluscum Away), Naturasil (Nature’s Innovation), Terrasil (Advanced Skincare % Topical Solutions), and Zymaderm (Naturopathix). Package sizes ranged from 0.78 to 1.5 ounces, and prices ranged from about $19 to almost $55.
Dr. Siegfried and colleagues found that all products provided instructions on application and use but most package labels did not include sufficient information about their plant-based ingredients or appropriate dosing. Six of the eight products contained Thuja occidentalis (Arbor vitae), a coniferous cedar whose essential oil has been used in homeopathic products for its anti-inflammatory and antiviral properties. Lemon extract, tea tree oil, and other botanicals were present in no more than three products each. Only two of the products provided information about the number of lesions that could be treated per package.
“The lack of national oversight as well as robust methods for high-level data analysis make safety and efficacy unclear for a Thuja extract marketed to treat MC,” the researchers wrote. “Numerous adverse drug events and positive intradermal skin tests related to Thuja have been reported.”
Dr. Siegfried added that many OTC products offer a money-back guarantee, “so when seeing a patient who failed to respond to one of these products, encourage them, at least, to request a refund, but to also submit a comment about lack of efficacy, in order to provide more balanced Internet information.”
Dr. Siegfried disclosed that she has served as an investigator and consultant for Verrica Pharmaceuticals, and as a consultant and Data Safety Monitoring board member for Novan, two of the companies currently developing drugs to treat molluscum. Her coauthors had no conflicts of interest to disclose.
FROM SPD 2021
GUIDE-HF: CardioMEMS-guided meds fall short in mild to moderate heart failure
Medical therapy for heart failure guided by an implanted pulmonary artery pressure (PAP) sensor didn’t improve survival or risk for HF events like hospitalization over a year in a major randomized trial that entered a broad range of patients with mild to moderate disease.
But medical therapy adjustments based on PAP readings from the miniature CardioMEMS (Abbott) implant might well have surpassed conventional HF management for outcomes had the world not been turned upside down by SARS-CoV-2 and the pandemic lockdowns, assert researchers from the GUIDE-HF trial.
Something about the crisis, they concluded – although not without some pushback – led to better outcomes in the standard-care control group, apparently muddling any potential differences from those on PAP-guided management.
Working with regulators, the team conducted a “pre–COVID-19 impact analysis” that compared outcomes before the March 2020 national COVID-19 emergency declaration that forced much of the United States with shelter in place.
By that time, all of the trial’s patients had been followed for at least 3 months, and about three-fourths of its endpoints had already been counted, JoAnn Lindenfeld, MD, Vanderbilt University Medical Center, Nashville, Tenn., said at a media briefing prior to unveiling GUIDE-HF at the all-virtual European Society of Cardiology Congress 2021.
The pre–COVID-19 analysis, approved several months before the end of the trial – while the data were still blinded – had been “suggested by both regulatory agencies and professional societies in Europe and in the United States,” Dr. Lindenfeld said.
It pointed to a possible benefit for the CardioMEMS-guided strategy, a barely significant 19% drop in risk (P = .049) for the primary endpoint of death, HF hospitalization, or urgent HF hospital visit. The effect was driven by a 24% decline in HF events (P = .014), with no significant contribution from mortality.
“The benefits of hemodynamic monitoring and management in reducing heart failure hospitalizations extended to patients with less severe heart failure”; that is, those in New York Heart Association class 2 and any in NYHA class 3 with “elevated natriuretic peptides but no previous hospitalization,” said Dr. Lindenfeld, who is also lead author on the GUIDE-HF report published in the Lancet.
Such benefits would suggest that CardioMEMS-guided management can improve outcomes in an HF population much broader than the device’s current indication.
But as it happens, the trial’s prospectively defined 12-month primary outcomes were less impressive. A 12% decline in risk for the composite endpoint among patients managed by CardioMEMS failed to reach significance compared with standard management (P = .16).
“Several factors could explain the considerable loss of benefit of hemodynamic-guided management during the COVID-19 pandemic,” the Lancet report explained. They include “improved patient compliance with medical and dietary regimens, reduced respiratory infections, altered health-care provider behavior, changes in disease progression due to COVID-19, or other as yet unknown effects of a major pandemic.”
Expanded population
Importantly, GUIDE-HF had entered 1,000 patients in NYHA class 2-4 and either an HF hospitalization in the previous year or elevated natriuretic peptide levels. About 44% of the entrants in NYHA class 3 did not have a 1-year history of HF hospitalization.
That’s a more heterogeneous and potentially lower-risk cohort than patients in the randomized CHAMPION study of 11 years ago, which led to the implant’s approval on both sides of the Atlantic.
In that trial, CardioMEMS-guided management was followed by 30% drop in risk for HF hospitalization over 6 months (P < .001). But CHAMPION was limited to patients in NYHA class 3 with a history of HF hospitalization, the device’s current indication in both the United States and Europe.
The GUIDE-HF findings “reinforce that patients with class 3 heart failure and prior heart failure hospitalization are those in whom there is the clearest benefit, based on the prior CHAMPION trial. These are the patients where this monitoring strategy may be best targeted,” Gregg C. Fonarow, MD, University of California Los Angeles Medical Center, said in an interview.
Although GUIDE-HF didn’t show a significant benefit for NYHA class 2 patients with elevated biomarkers, who aren’t covered by the device’s current labeling, that group showed “some suggestions of potential benefit,” noted Dr. Fonarow, who isn’t a coauthor on the Lancet report. So, “there may be select patients with class 2 heart failure where monitoring could be considered on a case-by-case basis.”
In an interview, Larry A. Allen, MD, MHS, said that, “while the technology is pretty amazing, the real question is whether it tells us something that we didn’t already know that leads to improved care. Unfortunately, as tested here, it doesn’t, or at least not enough to make a big difference.”
The pre–COVID-19 impact analysis “should be interpreted with caution, and not as the primary finding,” Dr. Allen, from the University of Colorado at Denver, Aurora, who is not a GUIDE-HF coauthor, said in an interview.
One might hypothesize, he said, “that, in the setting of limited in-person visits with loss of physical examination, perhaps CardioMEMS would be more – not less – helpful during the pandemic. And yet the opposite was seen.”
The pandemic has “markedly altered all kinds of aspects of patient care and trial conduct, but that doesn’t make the data derived during that period uninformative,” Dr. Allen said. “And as we are increasingly reminded, the future will be a new normal, not a prepandemic normal.”
A third group
The GUIDE-HF trial includes, in addition to the 1,000 randomized patients, a single-group observational cohort of 2,600 patients, whose outcomes will be reported at another time, noted the published report.
But in the randomized comparison, conducted at 118 centers in North America, all patients were implanted with the CardioMEMS device and blinded as to their assigned strategy. Enrollment took place between March 2018 and Dec. 20, 2019.
Of the 1,000 successfully implanted patients, 497 were assigned to the pressure-guided strategy, in which “titration of diuretics was recommended if pulmonary artery pressure provided evidence of excess intravascular volume, and titration of vasodilators was recommended if elevated vascular resistance was evident,” the report stated.
The remaining 503 patients assigned to standard care served as control subjects, for whom “investigators were aware of treatment assignment but did not have access to PAP data.”
The hazard ratio for the primary endpoint in the pressure-guided group, compared with the control group, was 0.88 (95% confidence interval, 0.74-1.05; P = .16) over a median follow-up of 11.7 months.
But in the sensitivity analysis comparing outcomes before and after the COVID-19 lockdowns, using established methodology, the report stated, the primary-endpoint HR was 0.81 (95% CI, 0.66-1.00; P = .049).
The difference is owed to improved outcomes in the control group under pandemic conditions, the researchers concluded. Patients assigned to conventional management –whatever that meant during shelter-in-place – experienced 21% fewer primary-endpoint events than their own rate before the pandemic. After the COVID-19 emergency was declared, there was no significant difference in event rates between the two randomization groups.
In the primary 12-month analysis, the HR for HF events in the guided-therapy was not significant reduced, at 0.85 (95% CI, 0.70-1.03; P = .096). But in the pre-COVID-19 analysis, that risk fell significantly with CardioMEMS-guided management, for an HR of 0.76 (95% CI, 0.61-0.95; P = .014).
An editorial accompanying the GUIDE-HF publication (Lancet. 2021 Aug 27. doi: 10.1016/S0140-6736[21]01914-0) asserts that the trial “did not enroll an ideal group of patients for showing the efficacy of pulmonary artery pressure monitoring, since many had baseline pressures in the target range with little possibility of short-term gain.”
Also, wrote John G. F. Cleland, MD, PhD, University of Glasgow, and Pierpaolo Pellicori, MD, Imperial College London, “follow-up was too short, and interventions did not substantially change pulmonary artery pressure.”
They continue: “Monitoring alone cannot improve outcome, but consequent actions might. The GUIDE-HF results are encouraging but inconclusive, and should inform further research, possibly a large, simple, open-label trial to investigate a system of care rather than a single technology.”
GUIDE-HF was funded by Abbott. Dr. Lindenfeld disclosed receiving research grants from AstraZeneca, Sensible Medical, and Volumetrix; and consulting for Abbott, Alleviant Medical, AstraZeneca, Boehringer Ingelheim, Boston Scientific, CVRx, Edwards, Impulse Dynamics, and VWave. Dr. Fonarow reported consulting for Abbott and that his institution has participated in the GUIDE-HF trial; he has elsewhere disclosed consulting for Amgen, AstraZeneca, CHF Solutions Lifesciences, Janssen, Medtronic, and Novartis. Dr. Allen had elsewhere reported consulting for Abbott, Amgen, Boston Scientific, and Novartis. Dr. Cleland disclosed receiving personal fees from Abbott for serving on an advisory board for the MitraClip device, unrelated to the CardioMEMS device. Dr. Pellicori reported no relevant conflicts.
A version of this article first appeared on Medscape.com.
Aerobic exercise can reduce AFib frequency, severity: ACTIVE-AF
Patients with atrial fibrillation (AFib) gained significant benefits from a 6-month program of supervised and unsupervised moderate exercise versus usual care, new randomized trial results show.
Among 120 AFib patients in the ACTIVE-AF trial, those randomized to the exercise arm had significantly less frequent AFib recurrence and less severe symptoms over a 1-year period, said Adrian Elliott, PhD, who will present this late-breaking research at the European Society of Cardiology (ESC) Congress 2021.
The trial “demonstrates that some patients can control their arrhythmia through physical activity, without the need for complex interventions such as ablation or medications to keep their heart in normal rhythm,” Dr. Elliott, from the University of Adelaide, Australia, said in a statement from the ESC.
This is “the largest randomized controlled trial investigating the value of an exercise prescription in patients with symptomatic paroxysmal or persistent [AFib],” he told this news organization in an email.
The findings “really provide the evidence needed that recommending aerobic exercise in patients with symptomatic AFib can lower the severity of symptoms and prevent the recurrence of AFib for many patients,” he said. Aerobic exercise should be incorporated into patient treatment, he added, “alongside the use of medications, as guided by a cardiologist, and management of obesity, hypertension, and sleep apnea.”
Mina K. Chung, MD, lead author of a Scientific Statement from the American Heart Association on Lifestyle and Risk Factor Modification for Reduction of Atrial Fibrillation, as previously reported, agrees.
The “findings support the AHA Scientific Statement that we should encourage our patients with AFib to include regular moderate exercise to help prevent AFib, reduce AFib burden, and improve AFib-related symptoms and quality of life,” Dr. Chung, a cardiologist at the Cleveland Clinic, summarized in an email.
“Our recommendation is to encourage AFib patients to aim for at least the AHA physical activity guidelines for the general population, which advise 150 minutes each week of moderate-intensity exercise,” Dr. Chung said.
This is a “reasonable” goal, but “some might argue that a slightly higher target of physical activity duration may be considered,” Dr. Elliott commented.
ACTIVE-AF, he noted, suggests that “as a general guide, patients [with AFib] should strive to build up to 3.5 hours per week of aerobic exercise and incorporate some higher intensity activities to improve cardiorespiratory fitness.”
Aim for 3.5 hours a week
A previous observational study showed that patients who improved their cardiorespiratory fitness over a 5-year period were significantly less likely to have AFib recurrences.
And in a randomized trial of 51 patients, 12 weeks of aerobic interval training reduced the time spent in AFib compared to usual care, during a 4-week follow-up.
ACTIVE-AF aimed to investigate the value of exercise in AFib in a larger, longer, randomized trial.
The researchers enrolled 120 patients with an average age of 65 years, of whom 43% were women.
Patients in the treatment group received individualized guided exercise from an exercise physiologist in the cardiology clinic once a week for 3 months, then every second week for the following 3 months along with a physical activity plan to follow at home for the other days – aiming to build up to 3.5 hours of physical activity a week.
The supervised sessions, Dr. Elliott explained, were typically higher intensity to raise cardiorespiratory fitness, while the home-based exercise was a moderate intensity aerobic activity of the patient’s choice, such as walking, indoor cycling, or swimming.
“We certainly cautioned against far exceeding this level,” he added.
Patients in the usual care group received exercise advice but no active intervention.
All patients received usual medical care from their cardiologist, who was blinded to the study group allocation.
The co-primary outcomes were AFib symptom severity score and the percentage of patients with recurrent AFib at 12 months, defined as having an AFib episode that lasted longer than 30 seconds or undergoing ablation or requiring ongoing anti-arrhythmic drug therapy.
At 12 months, the percentage of patients with AFib recurrence was significantly lower in the exercise group than in the control group (60% vs. 80%; hazard ratio, 0.50; 95% confidence interval, 0.33-0.78; P = .002).
This means that more patients in the exercise group had a normal heart rhythm without needing an invasive intervention (ablation) or continued use of drugs, Dr. Elliott stressed.
Patients in the exercise group also had significantly less severe symptoms – palpitations, shortness of breath, and fatigue – than patients in the control group.
“On average, patients were achieving close to 180 minutes [of physical activity] per week by 6 months of the intervention and attended 18 supervised sessions in the clinic,” Dr. Elliott said.
Cost was not a barrier since the sessions with an exercise physiologist were free.
Lack of time was the most common reason for missing the physical activity targets, especially for patients with work and family commitments.
Most patients liked the variety of physical activity options.
The researchers plan to determine any gender differences in ACTIVE-AF.
Further research is needed, Dr. Elliott added, to determine which type of exercise is best, whether exercise plus weight loss is synergistic, and whether exercise leads to better long-term freedom from arrhythmia, reduced hospitalization, and improved survival.
The study was partially supported by the National Heart Foundation of Australia through a postdoctoral fellowship to Dr. Elliott. The researchers and Dr. Chung have disclosed no relevant financial relationships.
A version of this article first appeared on Medscape.com.
EAACI review urges reduction in antibiotic overuse with allergy
Urgent recommendations from a European Academy of Allergy and Clinical Immunology (EAACI) task force are aimed at reducing antibiotic overuse with allergic disease.
Top recommendations include limiting antibiotic therapy in pregnancy and early childhood to help reduce the allergy epidemic in children, and restricting antibiotic therapy in exacerbations and chronic treatment of allergic diseases, especially asthma and atopic dermatitis.
The review, by lead author Gerdien Tramper-Stranders, MD, PhD, department of pediatrics, Franciscus Gasthuis & Vlietland Hospital, Rotterdam, the Netherlands, and colleagues, was published online Aug. 13 in the journal Allergy.
Several studies have shown that use of antibiotics in childhood and during pregnancy is associated with disturbing the intestinal and respiratory microbiome, which in turn leads to dysbiosis and an increased risk of acquiring allergic diseases, the authors noted.
In addition, patients with allergic diseases such as asthma have a higher risk of being prescribed antibiotics for infections compared with the general population, despite lack of clear clinical benefit.
“In fact, there are no clear data supporting antibiotic prescriptions for acute exacerbations; and clinical and/or laboratory criteria are lacking,” the authors wrote.
Despite that lack of data, antibiotics are often prescribed for exacerbations along with oral corticosteroids, Dr. Tramper-Stranders said in an interview. Some patients may benefit from antibiotics in a flare-up, she said, but more research is needed to determine which ones.
Dr. Tramper-Stranders said Franciscus has begun a large study that includes patients with asthma exacerbations to find biomarkers that might predict the type or origin of exacerbation to personalize treatment.
Recommendations have global relevance
She said although the recommendations are coming from the EAACI group, they apply worldwide.
“Especially in countries outside Northern Europe, antibiotic use is tremendous, leading to high rates of antibiotic resistance; but also increasing the risk for developing allergic diseases when prescribed in infancy,” she said.
She pointed out that in the United States, as many as one in six children receive unnecessary antibiotics for an asthma exacerbation. Overtreatment in adults with flare-ups is also prevalent, at rates from 40%-50%.
Millie Kwan, MD, PhD, an allergy specialist at University of North Carolina in Chapel Hill, said in an interview that in the U.S. there’s been a culture change in the direction of antibiotic restraint – but there are still problems.
“It’s a lot easier for us to whip out our prescription pads and prescribe antibiotics for an asthma patient who’s having a flare-up or a patient who has atopic dermatitis before addressing the underlying mechanism directly,” Dr. Kwan said. She agreed that antibiotic overuse is prevalent in pregnancies in the U.S., and she said that starts with the high prevalence of cesarean births. Nearly one-third of all births in the U.S. are by C-section, twice the rate recommended by the World Health Organization.
“Just bypassing the birth canal actually changes what kind of microflora the infant is being exposed to,” Dr. Kwan said. “That’s the first huge problem.”
The second problem, she said, is the potential for overuse of antibiotics with the surgical procedure.
The researchers wrote that pre-, pro- or postbiotics might alter the course of allergic disease, but clear evidence is lacking.
Until now, Dr. Tramper-Stranders said, pre- or probiotic treatment in infancy, irrespective of previous antibiotic use, has not proved effective in preventing allergies.
Data describing the effect of pre- or probiotics after an antibiotic course are scarce, are limited to older children and adults, and are focused on short-term effects, such as diarrhea prevention, she explained.
Dr. Kwan says she agrees that current data are not strong enough to recommend one over another.
“We don’t even know what the normal amount of bacteria should be to constitute an environment where the immune system develops ‘normally,’ “ she said.
Antibiotics should be prescribed cautiously and by following current recommendations to use the narrowest spectrum available, the authors wrote. Future research in antibiotic stewardship should incorporate biomarker-guided therapy to determine which patients might benefit most from antibiotic therapy.
“Practicing antibiotic stewardship needs recurrent attention and we hope that with this initiative, we specifically reach allergy doctors who will rethink their next [antibiotic] prescription. Within our EAACI task force, we will next work on a guideline for rational antibiotic use in asthma,” Dr. Tramper-Stranders said.
The review’s authors and Dr. Kwan have disclosed no relevant financial relationships.
A version of this article first appeared on Medscape.com.