User login
CLL and breast cancer differ in the expression of regulatory microRNAs
Expression of three microRNAs (miR-155, miR-29a, and miR-27b) was detectable in patients with chronic lymphocytic leukemia (CLL) and in breast cancer (BC) patients, but not in healthy subjects, according to a molecular analysis of patients reported in Molecular Therapy Oncolytics. In addition, circulating microarrays were found to be able to differentiate between both CLL and BC patients and healthy subjects.

The researchers obtained blood samples from 15 CLL patients and tissue samples from 15 BC patients, all from a single center.
The use of quantitative reverse transcription polymerase chain reaction (qRT-PCR) demonstrated a significant increase in the expression of all three miRNAs in patients with BC and CLL, compared with respective healthy groups (P less than .001).
In BC patients, there was a significant difference between the expression of miR-155 and miR-29a (P less than .05), miR-155 and miR-27b (P less than .01), and miR-27b and miR-29a (P less than .001). In CLL patients, the qRT-PCR results showed a significant difference between expression of both miR-27b and miR-29a, compared with expression of miR-155 (P less than .001). In addition, there was a significant association between miR-155 and prevascular invasion (P = .013), but no significant association with other clinical variables (age, tumor grade, nuclear grade, tumor stage, tumor size, area of invasive component, tumor side, margin, or preneural invasion), according to the researchers.
Results also showed that elevated circulating miRNAs were BC specific and could differentiate BC tissues from the controls, and comparing expression of miRNAs between BC and CLL patients, there was also a significant difference for all miRNAs (P less than .001) between them.
“Our results suggest that miR-27b, miR-29a, and miR-155 could be potential new biomarkers for diagnosis, as well as a therapeutic target for CLL and BC,” the researchers concluded.
The authors reported that they had no competing interests.
SOURCE: Raeisi F et al. Mol Ther Oncolytics. 2020;16:230-7.
Expression of three microRNAs (miR-155, miR-29a, and miR-27b) was detectable in patients with chronic lymphocytic leukemia (CLL) and in breast cancer (BC) patients, but not in healthy subjects, according to a molecular analysis of patients reported in Molecular Therapy Oncolytics. In addition, circulating microarrays were found to be able to differentiate between both CLL and BC patients and healthy subjects.
The researchers obtained blood samples from 15 CLL patients and tissue samples from 15 BC patients, all from a single center.
The use of quantitative reverse transcription polymerase chain reaction (qRT-PCR) demonstrated a significant increase in the expression of all three miRNAs in patients with BC and CLL, compared with respective healthy groups (P less than .001).
In BC patients, there was a significant difference between the expression of miR-155 and miR-29a (P less than .05), miR-155 and miR-27b (P less than .01), and miR-27b and miR-29a (P less than .001). In CLL patients, the qRT-PCR results showed a significant difference between expression of both miR-27b and miR-29a, compared with expression of miR-155 (P less than .001). In addition, there was a significant association between miR-155 and prevascular invasion (P = .013), but no significant association with other clinical variables (age, tumor grade, nuclear grade, tumor stage, tumor size, area of invasive component, tumor side, margin, or preneural invasion), according to the researchers.
Results also showed that elevated circulating miRNAs were BC specific and could differentiate BC tissues from the controls, and comparing expression of miRNAs between BC and CLL patients, there was also a significant difference for all miRNAs (P less than .001) between them.
“Our results suggest that miR-27b, miR-29a, and miR-155 could be potential new biomarkers for diagnosis, as well as a therapeutic target for CLL and BC,” the researchers concluded.
The authors reported that they had no competing interests.
SOURCE: Raeisi F et al. Mol Ther Oncolytics. 2020;16:230-7.
Expression of three microRNAs (miR-155, miR-29a, and miR-27b) was detectable in patients with chronic lymphocytic leukemia (CLL) and in breast cancer (BC) patients, but not in healthy subjects, according to a molecular analysis of patients reported in Molecular Therapy Oncolytics. In addition, circulating microarrays were found to be able to differentiate between both CLL and BC patients and healthy subjects.
The researchers obtained blood samples from 15 CLL patients and tissue samples from 15 BC patients, all from a single center.
The use of quantitative reverse transcription polymerase chain reaction (qRT-PCR) demonstrated a significant increase in the expression of all three miRNAs in patients with BC and CLL, compared with respective healthy groups (P less than .001).
In BC patients, there was a significant difference between the expression of miR-155 and miR-29a (P less than .05), miR-155 and miR-27b (P less than .01), and miR-27b and miR-29a (P less than .001). In CLL patients, the qRT-PCR results showed a significant difference between expression of both miR-27b and miR-29a, compared with expression of miR-155 (P less than .001). In addition, there was a significant association between miR-155 and prevascular invasion (P = .013), but no significant association with other clinical variables (age, tumor grade, nuclear grade, tumor stage, tumor size, area of invasive component, tumor side, margin, or preneural invasion), according to the researchers.
Results also showed that elevated circulating miRNAs were BC specific and could differentiate BC tissues from the controls, and comparing expression of miRNAs between BC and CLL patients, there was also a significant difference for all miRNAs (P less than .001) between them.
“Our results suggest that miR-27b, miR-29a, and miR-155 could be potential new biomarkers for diagnosis, as well as a therapeutic target for CLL and BC,” the researchers concluded.
The authors reported that they had no competing interests.
SOURCE: Raeisi F et al. Mol Ther Oncolytics. 2020;16:230-7.
FROM MOLECULAR THERAPY ONCOLYTICS
Three COVID-19 rapid diagnostic tests get FDA thumbs-up

The first authorization, announced by the agency on March 21, was for the Xpert Xpress SARS-CoV-2 test, a rapid molecular diagnostic test for qualitative detection of SARS-CoV-2, the virus causing COVID-19.
The test, manufactured by Cepheid, has a detection time of 45 minutes and has been designed to operate on any of the company’s more than 23,000 automated GeneXpert Systems worldwide, according to a statement from the company.
The agency said in its EUA approval document the test is for a “qualitative detection of nucleic acid from the SARS-CoV-2 in nasopharyngeal swab and/or nasal wash/aspirate specimens collected from patients who are suspected of having COVID-19 infection.” Positive results are indicative of an infection but do not rule out other potential infections, it noted.
The company plans to roll out the test by March 30, according to the FDA.
Cepheid said in a statement that it has almost 5,000 GeneXpert systems in the United States that are capable of point-of-care testing and ready for use in hospitals. “Our automated systems do not require users to have specialty training to perform testing – they are capable of running 24/7, with many systems already doing so today,” Warren Kocmond, the company’s president, said in the statement.
FDA Commissioner Stephen Hahn, MD said in a statement that the authorization marked “an important step in expanding the availability of testing and, importantly, rapid results. Point-of-care testing means that results are delivered to the patient in the patient-care settings, like hospitals, urgent care centers, and emergency rooms, instead of samples being sent to a laboratory. With today’s authorization, there is now an option for testing at the point of care, which enables patient access to more immediate results.”
On March 23, the agency issued an emergency use authorization to bioMerieux subsidiary BioFire Defense LLC for its BIOFIRE COVID-19 test, which detects SARS-CoV-2 from a nasopharyngeal swab in about 45 minutes.
The test was developed with funding from the U.S. Department of Defense.
“Positive results are indicative of the presence of SARS-CoV-2 RNA; clinical correlation with patient history and other diagnostic information is necessary to determine patient infection status,” the agency said in its approval document. It again noted that positive results did not rule out bacterial infection or coinfection with other viruses.
Also on March 23, the agency issued an EUA to Mesa Biotech for its Accula SARS-CoV-2 test, which gives COVID-19 diagnostic results in 30 minutes.
The test is indicated for “qualitative, visual detection of nucleic acid from the SARS-CoV-2 in throat swab and nasal swab specimens combined, collected from patients suspected of COVID-19 by their health care provider,” according to the FDA approval document. “The SARS-CoV-2 nucleic acid is generally detectable in throat and nasal swab specimens during the acute phase of infection. Positive results are indicative of the presence of SARS-CoV-2 nucleic acid; clinical correlation with patient history and other diagnostic information is necessary to determine patient infection status. Positive results do not rule out bacterial infection or coinfection with other viruses.”
Mesa Biotech said in a statement that the test is designed for point-of-care use, including at temporary screening facilities, physician office labs, urgent care, and long-term nursing facilities.
“Our test will provide a highly accessible means for health care professionals to access laboratory quality results close in their office to aid in the decision to isolate, treat, or dismiss potential carriers of the virus,” Hong Cai, the CEO and cofounder of Mesa Biotech, said in a statement. “The potential to reduce the growing strain on our nation’s hospitals is tremendous.”
In separate letters to the three companies notifying them of the authorizations, the FDA said the emergency use of the products met the criteria for issuances of authorization because the SARS-CoV-2 can cause a serious or life-threatening disease or condition; it was “reasonable to believe
that [the] product may be effective in diagnosing COVID-19; and there is no “adequate, approved, and available alternative” to the emergency use of the three products.
The first authorization, announced by the agency on March 21, was for the Xpert Xpress SARS-CoV-2 test, a rapid molecular diagnostic test for qualitative detection of SARS-CoV-2, the virus causing COVID-19.
The test, manufactured by Cepheid, has a detection time of 45 minutes and has been designed to operate on any of the company’s more than 23,000 automated GeneXpert Systems worldwide, according to a statement from the company.
The agency said in its EUA approval document the test is for a “qualitative detection of nucleic acid from the SARS-CoV-2 in nasopharyngeal swab and/or nasal wash/aspirate specimens collected from patients who are suspected of having COVID-19 infection.” Positive results are indicative of an infection but do not rule out other potential infections, it noted.
The company plans to roll out the test by March 30, according to the FDA.
Cepheid said in a statement that it has almost 5,000 GeneXpert systems in the United States that are capable of point-of-care testing and ready for use in hospitals. “Our automated systems do not require users to have specialty training to perform testing – they are capable of running 24/7, with many systems already doing so today,” Warren Kocmond, the company’s president, said in the statement.
FDA Commissioner Stephen Hahn, MD said in a statement that the authorization marked “an important step in expanding the availability of testing and, importantly, rapid results. Point-of-care testing means that results are delivered to the patient in the patient-care settings, like hospitals, urgent care centers, and emergency rooms, instead of samples being sent to a laboratory. With today’s authorization, there is now an option for testing at the point of care, which enables patient access to more immediate results.”
On March 23, the agency issued an emergency use authorization to bioMerieux subsidiary BioFire Defense LLC for its BIOFIRE COVID-19 test, which detects SARS-CoV-2 from a nasopharyngeal swab in about 45 minutes.
The test was developed with funding from the U.S. Department of Defense.
“Positive results are indicative of the presence of SARS-CoV-2 RNA; clinical correlation with patient history and other diagnostic information is necessary to determine patient infection status,” the agency said in its approval document. It again noted that positive results did not rule out bacterial infection or coinfection with other viruses.
Also on March 23, the agency issued an EUA to Mesa Biotech for its Accula SARS-CoV-2 test, which gives COVID-19 diagnostic results in 30 minutes.
The test is indicated for “qualitative, visual detection of nucleic acid from the SARS-CoV-2 in throat swab and nasal swab specimens combined, collected from patients suspected of COVID-19 by their health care provider,” according to the FDA approval document. “The SARS-CoV-2 nucleic acid is generally detectable in throat and nasal swab specimens during the acute phase of infection. Positive results are indicative of the presence of SARS-CoV-2 nucleic acid; clinical correlation with patient history and other diagnostic information is necessary to determine patient infection status. Positive results do not rule out bacterial infection or coinfection with other viruses.”
Mesa Biotech said in a statement that the test is designed for point-of-care use, including at temporary screening facilities, physician office labs, urgent care, and long-term nursing facilities.
“Our test will provide a highly accessible means for health care professionals to access laboratory quality results close in their office to aid in the decision to isolate, treat, or dismiss potential carriers of the virus,” Hong Cai, the CEO and cofounder of Mesa Biotech, said in a statement. “The potential to reduce the growing strain on our nation’s hospitals is tremendous.”
In separate letters to the three companies notifying them of the authorizations, the FDA said the emergency use of the products met the criteria for issuances of authorization because the SARS-CoV-2 can cause a serious or life-threatening disease or condition; it was “reasonable to believe
that [the] product may be effective in diagnosing COVID-19; and there is no “adequate, approved, and available alternative” to the emergency use of the three products.
The first authorization, announced by the agency on March 21, was for the Xpert Xpress SARS-CoV-2 test, a rapid molecular diagnostic test for qualitative detection of SARS-CoV-2, the virus causing COVID-19.
The test, manufactured by Cepheid, has a detection time of 45 minutes and has been designed to operate on any of the company’s more than 23,000 automated GeneXpert Systems worldwide, according to a statement from the company.
The agency said in its EUA approval document the test is for a “qualitative detection of nucleic acid from the SARS-CoV-2 in nasopharyngeal swab and/or nasal wash/aspirate specimens collected from patients who are suspected of having COVID-19 infection.” Positive results are indicative of an infection but do not rule out other potential infections, it noted.
The company plans to roll out the test by March 30, according to the FDA.
Cepheid said in a statement that it has almost 5,000 GeneXpert systems in the United States that are capable of point-of-care testing and ready for use in hospitals. “Our automated systems do not require users to have specialty training to perform testing – they are capable of running 24/7, with many systems already doing so today,” Warren Kocmond, the company’s president, said in the statement.
FDA Commissioner Stephen Hahn, MD said in a statement that the authorization marked “an important step in expanding the availability of testing and, importantly, rapid results. Point-of-care testing means that results are delivered to the patient in the patient-care settings, like hospitals, urgent care centers, and emergency rooms, instead of samples being sent to a laboratory. With today’s authorization, there is now an option for testing at the point of care, which enables patient access to more immediate results.”
On March 23, the agency issued an emergency use authorization to bioMerieux subsidiary BioFire Defense LLC for its BIOFIRE COVID-19 test, which detects SARS-CoV-2 from a nasopharyngeal swab in about 45 minutes.
The test was developed with funding from the U.S. Department of Defense.
“Positive results are indicative of the presence of SARS-CoV-2 RNA; clinical correlation with patient history and other diagnostic information is necessary to determine patient infection status,” the agency said in its approval document. It again noted that positive results did not rule out bacterial infection or coinfection with other viruses.
Also on March 23, the agency issued an EUA to Mesa Biotech for its Accula SARS-CoV-2 test, which gives COVID-19 diagnostic results in 30 minutes.
The test is indicated for “qualitative, visual detection of nucleic acid from the SARS-CoV-2 in throat swab and nasal swab specimens combined, collected from patients suspected of COVID-19 by their health care provider,” according to the FDA approval document. “The SARS-CoV-2 nucleic acid is generally detectable in throat and nasal swab specimens during the acute phase of infection. Positive results are indicative of the presence of SARS-CoV-2 nucleic acid; clinical correlation with patient history and other diagnostic information is necessary to determine patient infection status. Positive results do not rule out bacterial infection or coinfection with other viruses.”
Mesa Biotech said in a statement that the test is designed for point-of-care use, including at temporary screening facilities, physician office labs, urgent care, and long-term nursing facilities.
“Our test will provide a highly accessible means for health care professionals to access laboratory quality results close in their office to aid in the decision to isolate, treat, or dismiss potential carriers of the virus,” Hong Cai, the CEO and cofounder of Mesa Biotech, said in a statement. “The potential to reduce the growing strain on our nation’s hospitals is tremendous.”
In separate letters to the three companies notifying them of the authorizations, the FDA said the emergency use of the products met the criteria for issuances of authorization because the SARS-CoV-2 can cause a serious or life-threatening disease or condition; it was “reasonable to believe
that [the] product may be effective in diagnosing COVID-19; and there is no “adequate, approved, and available alternative” to the emergency use of the three products.

Reports increasingly suggest anosmia/hyposmia can signal early COVID-19 infection
Unexplained anosmia, hyposmia, and dysgeusia should be added to the list of possible COVID-19 symptoms for screening purposes, and individuals with such symptoms should consider self-isolation, the American Academy of Otolaryngology-Head and Neck Surgery (AAO-HNS) has proposed.

However, a World Health Organization expert said during a March 23 daily briefing on the novel coronavirus pandemic that the jury is still out on that.
The AAO-HNS proposal is based on “rapidly accumulating” anecdotal evidence that such symptoms – in the absence of other symptoms suggestive of COVID-19 – have sometimes preceded a COVID-19 diagnosis.
“ ... anosmia, hyposmia, and dysgeusia in the absence of other respiratory disease such as allergic rhinitis, acute rhinosinusitis, or chronic rhinosinusitis should alert physicians to the possibility of COVID-19 infection and warrant serious consideration for self-isolation and testing of these individuals,” the AAO-HNS said in a statement on the proposal.
ENT UK, an organization representing Ear, Nose, and Throat surgery and its related specialties in the UK, also is emphasizing the potential importance of these symptoms. In a March 21 letter, ENT UK experts cited “good evidence from South Korea, China and Italy that significant numbers of patients with proven COVID-19 infection have developed anosmia/hyposmia.”
Claire Hopkins, BMBCh, president of the British Rhinological Society and a professor of Rhinology at King’s College London, along with ENT UK president Nirmal Kumar, also noted in the letter that two of every three cases in Germany, and 30% of patients testing positive in South Korea, had anosmia as their first symptom.
“While there is a chance the apparent increase in incidence could merely reflect the attention COVID-19 has attracted in the media, and that such cases may be caused by typical rhinovirus and coronavirus strains, it could potentially be used as a screening tool to help identify otherwise asymptomatic patients, who could then be better instructed on self-isolation,” they wrote.
Maria Van Kerkhove, MD, technical lead of the WHO Medical Emergencies Program, acknowledged the anecdotal evidence during the WHO briefing.
“Yes, we’ve seen quite a few reports ... but this is something that we need to look into to really capture if this is one of the early signs and symptoms of COVID-19,” she said, noting that WHO is working with more than a dozen countries that are systematically collecting data using molecular and serological testing to “capture more robustly” the early signs and symptoms, and is “reaching out to a number of countries and looking at the cases that have already been reported to see if [anosmia] is a common feature.”
“We don’t have the answer to that,” she said, adding that, in addition to the major symptoms – including dry cough, fever, and shortness of breath – that are well known at this point, “there are likely to be many signs and symptoms that people have.”
“A loss of smell or a loss of taste is something that we’re looking into, and we’re looking forward to the results of these early investigations ... so that we have a more evidence-based approach and we can add that to the list.”
Unexplained anosmia, hyposmia, and dysgeusia should be added to the list of possible COVID-19 symptoms for screening purposes, and individuals with such symptoms should consider self-isolation, the American Academy of Otolaryngology-Head and Neck Surgery (AAO-HNS) has proposed.
However, a World Health Organization expert said during a March 23 daily briefing on the novel coronavirus pandemic that the jury is still out on that.
The AAO-HNS proposal is based on “rapidly accumulating” anecdotal evidence that such symptoms – in the absence of other symptoms suggestive of COVID-19 – have sometimes preceded a COVID-19 diagnosis.
“ ... anosmia, hyposmia, and dysgeusia in the absence of other respiratory disease such as allergic rhinitis, acute rhinosinusitis, or chronic rhinosinusitis should alert physicians to the possibility of COVID-19 infection and warrant serious consideration for self-isolation and testing of these individuals,” the AAO-HNS said in a statement on the proposal.
ENT UK, an organization representing Ear, Nose, and Throat surgery and its related specialties in the UK, also is emphasizing the potential importance of these symptoms. In a March 21 letter, ENT UK experts cited “good evidence from South Korea, China and Italy that significant numbers of patients with proven COVID-19 infection have developed anosmia/hyposmia.”
Claire Hopkins, BMBCh, president of the British Rhinological Society and a professor of Rhinology at King’s College London, along with ENT UK president Nirmal Kumar, also noted in the letter that two of every three cases in Germany, and 30% of patients testing positive in South Korea, had anosmia as their first symptom.
“While there is a chance the apparent increase in incidence could merely reflect the attention COVID-19 has attracted in the media, and that such cases may be caused by typical rhinovirus and coronavirus strains, it could potentially be used as a screening tool to help identify otherwise asymptomatic patients, who could then be better instructed on self-isolation,” they wrote.
Maria Van Kerkhove, MD, technical lead of the WHO Medical Emergencies Program, acknowledged the anecdotal evidence during the WHO briefing.
“Yes, we’ve seen quite a few reports ... but this is something that we need to look into to really capture if this is one of the early signs and symptoms of COVID-19,” she said, noting that WHO is working with more than a dozen countries that are systematically collecting data using molecular and serological testing to “capture more robustly” the early signs and symptoms, and is “reaching out to a number of countries and looking at the cases that have already been reported to see if [anosmia] is a common feature.”
“We don’t have the answer to that,” she said, adding that, in addition to the major symptoms – including dry cough, fever, and shortness of breath – that are well known at this point, “there are likely to be many signs and symptoms that people have.”
“A loss of smell or a loss of taste is something that we’re looking into, and we’re looking forward to the results of these early investigations ... so that we have a more evidence-based approach and we can add that to the list.”
Unexplained anosmia, hyposmia, and dysgeusia should be added to the list of possible COVID-19 symptoms for screening purposes, and individuals with such symptoms should consider self-isolation, the American Academy of Otolaryngology-Head and Neck Surgery (AAO-HNS) has proposed.
However, a World Health Organization expert said during a March 23 daily briefing on the novel coronavirus pandemic that the jury is still out on that.
The AAO-HNS proposal is based on “rapidly accumulating” anecdotal evidence that such symptoms – in the absence of other symptoms suggestive of COVID-19 – have sometimes preceded a COVID-19 diagnosis.
“ ... anosmia, hyposmia, and dysgeusia in the absence of other respiratory disease such as allergic rhinitis, acute rhinosinusitis, or chronic rhinosinusitis should alert physicians to the possibility of COVID-19 infection and warrant serious consideration for self-isolation and testing of these individuals,” the AAO-HNS said in a statement on the proposal.
ENT UK, an organization representing Ear, Nose, and Throat surgery and its related specialties in the UK, also is emphasizing the potential importance of these symptoms. In a March 21 letter, ENT UK experts cited “good evidence from South Korea, China and Italy that significant numbers of patients with proven COVID-19 infection have developed anosmia/hyposmia.”
Claire Hopkins, BMBCh, president of the British Rhinological Society and a professor of Rhinology at King’s College London, along with ENT UK president Nirmal Kumar, also noted in the letter that two of every three cases in Germany, and 30% of patients testing positive in South Korea, had anosmia as their first symptom.
“While there is a chance the apparent increase in incidence could merely reflect the attention COVID-19 has attracted in the media, and that such cases may be caused by typical rhinovirus and coronavirus strains, it could potentially be used as a screening tool to help identify otherwise asymptomatic patients, who could then be better instructed on self-isolation,” they wrote.
Maria Van Kerkhove, MD, technical lead of the WHO Medical Emergencies Program, acknowledged the anecdotal evidence during the WHO briefing.
“Yes, we’ve seen quite a few reports ... but this is something that we need to look into to really capture if this is one of the early signs and symptoms of COVID-19,” she said, noting that WHO is working with more than a dozen countries that are systematically collecting data using molecular and serological testing to “capture more robustly” the early signs and symptoms, and is “reaching out to a number of countries and looking at the cases that have already been reported to see if [anosmia] is a common feature.”
“We don’t have the answer to that,” she said, adding that, in addition to the major symptoms – including dry cough, fever, and shortness of breath – that are well known at this point, “there are likely to be many signs and symptoms that people have.”
“A loss of smell or a loss of taste is something that we’re looking into, and we’re looking forward to the results of these early investigations ... so that we have a more evidence-based approach and we can add that to the list.”

High rate of asymptomatic COVID-19 seen in cruise ship passengers
The high rate of asymptomatic COVID-19 infections aboard the cruise ship Diamond Princess “could partially explain the high attack rate among” the passengers and crew, according to the Centers for Disease Control and Prevention.

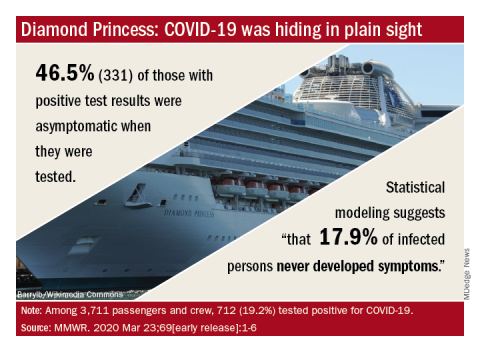
Testing of the 3,711 passengers and crew aboard the ship – the source of the largest outbreak outside of China during the initial stages of the pandemic – revealed that 19.2% were positive for COVID-19, Leah F. Moriarty, MPH, and associates reported in the Morbidity and Mortality Weekly Report.
At the time of testing, 46.5% (331) of the 712 infected individuals were asymptomatic, and “statistical models of the Diamond Princess outbreak suggest that 17.9% of infected persons never developed symptoms,” wrote Ms. Moriarty of the CDC COVID-19 response team, and associates.
RNA from the SARS-CoV-2 virus was found on surfaces in cabins up to 17 days after they had been vacated by passengers but before the cabins had been disinfected, the investigators noted.
The Diamond Princess departed from Yokohama, Japan, on Jan. 20, 2020, and returned on Feb. 3 after making six stops in three countries. The ship was quarantined upon its return because a symptomatic passenger who had departed Jan. 25 in Hong Kong tested positive for SARS-CoV-2, Ms. Moriarty and associates explained.
Of the 381 people from the ship who were symptomatic and tested positive, 37 (9.7%) needed intensive care and 9 (1.3%) died. There were 428 Americans on the ship, of whom 107 (25.0%) tested positive and 11 remained hospitalized in Japan as of March 13, they said.
“Many other cruise ships have since been implicated in SARS-CoV-2 transmission,” the investigators said, including the Grand Princess, which sailed out of San Francisco with 3,571 people on Feb. 21 and returned to Oakland on March 8.
That ship had been the site of virus transmission during its previous voyage from Feb. 11 to Feb. 21, from which more than 20 cases have been identified. During the latter trip, 21 of 45 passengers and crew tested positive before the ship docked. During the subsequent land-based quarantine, there have been 78 positive tests among the 469 people tested as of March 21, a rate of 16.6%, the research team reported.
“Public health responses to cruise ship outbreaks require extensive resources,” they wrote. “These responses required the coordination of stakeholders across multiple sectors, including U.S. government departments and agencies, foreign ministries of health, foreign embassies, state and local public health departments, hospitals, laboratories, and cruise ship companies.”
SOURCE: Moriarty LF et al. MMWR. 2020 Mar 23;69[early release]:1-6.
The high rate of asymptomatic COVID-19 infections aboard the cruise ship Diamond Princess “could partially explain the high attack rate among” the passengers and crew, according to the Centers for Disease Control and Prevention.
Testing of the 3,711 passengers and crew aboard the ship – the source of the largest outbreak outside of China during the initial stages of the pandemic – revealed that 19.2% were positive for COVID-19, Leah F. Moriarty, MPH, and associates reported in the Morbidity and Mortality Weekly Report.
At the time of testing, 46.5% (331) of the 712 infected individuals were asymptomatic, and “statistical models of the Diamond Princess outbreak suggest that 17.9% of infected persons never developed symptoms,” wrote Ms. Moriarty of the CDC COVID-19 response team, and associates.
RNA from the SARS-CoV-2 virus was found on surfaces in cabins up to 17 days after they had been vacated by passengers but before the cabins had been disinfected, the investigators noted.
The Diamond Princess departed from Yokohama, Japan, on Jan. 20, 2020, and returned on Feb. 3 after making six stops in three countries. The ship was quarantined upon its return because a symptomatic passenger who had departed Jan. 25 in Hong Kong tested positive for SARS-CoV-2, Ms. Moriarty and associates explained.
Of the 381 people from the ship who were symptomatic and tested positive, 37 (9.7%) needed intensive care and 9 (1.3%) died. There were 428 Americans on the ship, of whom 107 (25.0%) tested positive and 11 remained hospitalized in Japan as of March 13, they said.
“Many other cruise ships have since been implicated in SARS-CoV-2 transmission,” the investigators said, including the Grand Princess, which sailed out of San Francisco with 3,571 people on Feb. 21 and returned to Oakland on March 8.
That ship had been the site of virus transmission during its previous voyage from Feb. 11 to Feb. 21, from which more than 20 cases have been identified. During the latter trip, 21 of 45 passengers and crew tested positive before the ship docked. During the subsequent land-based quarantine, there have been 78 positive tests among the 469 people tested as of March 21, a rate of 16.6%, the research team reported.
“Public health responses to cruise ship outbreaks require extensive resources,” they wrote. “These responses required the coordination of stakeholders across multiple sectors, including U.S. government departments and agencies, foreign ministries of health, foreign embassies, state and local public health departments, hospitals, laboratories, and cruise ship companies.”
SOURCE: Moriarty LF et al. MMWR. 2020 Mar 23;69[early release]:1-6.
The high rate of asymptomatic COVID-19 infections aboard the cruise ship Diamond Princess “could partially explain the high attack rate among” the passengers and crew, according to the Centers for Disease Control and Prevention.
Testing of the 3,711 passengers and crew aboard the ship – the source of the largest outbreak outside of China during the initial stages of the pandemic – revealed that 19.2% were positive for COVID-19, Leah F. Moriarty, MPH, and associates reported in the Morbidity and Mortality Weekly Report.
At the time of testing, 46.5% (331) of the 712 infected individuals were asymptomatic, and “statistical models of the Diamond Princess outbreak suggest that 17.9% of infected persons never developed symptoms,” wrote Ms. Moriarty of the CDC COVID-19 response team, and associates.
RNA from the SARS-CoV-2 virus was found on surfaces in cabins up to 17 days after they had been vacated by passengers but before the cabins had been disinfected, the investigators noted.
The Diamond Princess departed from Yokohama, Japan, on Jan. 20, 2020, and returned on Feb. 3 after making six stops in three countries. The ship was quarantined upon its return because a symptomatic passenger who had departed Jan. 25 in Hong Kong tested positive for SARS-CoV-2, Ms. Moriarty and associates explained.
Of the 381 people from the ship who were symptomatic and tested positive, 37 (9.7%) needed intensive care and 9 (1.3%) died. There were 428 Americans on the ship, of whom 107 (25.0%) tested positive and 11 remained hospitalized in Japan as of March 13, they said.
“Many other cruise ships have since been implicated in SARS-CoV-2 transmission,” the investigators said, including the Grand Princess, which sailed out of San Francisco with 3,571 people on Feb. 21 and returned to Oakland on March 8.
That ship had been the site of virus transmission during its previous voyage from Feb. 11 to Feb. 21, from which more than 20 cases have been identified. During the latter trip, 21 of 45 passengers and crew tested positive before the ship docked. During the subsequent land-based quarantine, there have been 78 positive tests among the 469 people tested as of March 21, a rate of 16.6%, the research team reported.
“Public health responses to cruise ship outbreaks require extensive resources,” they wrote. “These responses required the coordination of stakeholders across multiple sectors, including U.S. government departments and agencies, foreign ministries of health, foreign embassies, state and local public health departments, hospitals, laboratories, and cruise ship companies.”
SOURCE: Moriarty LF et al. MMWR. 2020 Mar 23;69[early release]:1-6.
FROM MMWR
CDC coronavirus testing decision likely to haunt nation for months to come
As the novel coronavirus snaked its way across the globe, the Centers for Disease Control and Prevention in early February distributed 200 test kits it had produced to more than 100 public health labs run by states and counties nationwide.
Each kit contained material to test a mere 300-400 patients. And labs, whether serving the population of New York or tiny towns in rural America, apparently received the same kits.
The kits were distributed roughly equally to locales in all 50 states. That decision presaged weeks of chaos, in which the availability of COVID-19 tests seemed oddly out of sync with where testing was needed.
A woman in South Dakota with mild symptoms and no fever readily got the test and the results. Meanwhile, political leaders and public officials in places like New York, Boston, Seattle, and the San Francisco Bay area – all in the throes of serious outbreaks – couldn’t get enough tests to screen ill patients or, thereby, the information they needed to protect the general public and stem the outbreak of the virus, whose symptoms mimic those of common respiratory illnesses.
Rapid testing is crucial in the early stages of an outbreak. It allows health workers and families to identify and focus on treating those infected and isolate them.
Yet health officials in New York and such states as New York, Washington, Pennsylvania, and Georgia confirmed that they each initially got one test kit, calling into question whether they would have even stood a chance to contain the outbreaks that would emerge. They would soon discover that the tests they did receive were flawed, lacking critical components, and delivering faulty results.
During those early weeks, the virus took off, infecting thousands of people and leading to nationwide social distancing and sheltering in place. Public health officials are just beginning to grapple with the fallout from that early bungling of testing, which is likely to haunt the country in the months to come.
Too little too late
The first shipment to Washington state arrived more than 2 weeks after officials there announced the first U.S. case of coronavirus, and at a moment when deadly outbreaks of the disease were already festering in places like the Life Care Center in Kirkland. Within weeks, three dozen people infected with COVID-19 would die at the nursing home in the suburbs of Seattle.
The spread of COVID-19 would not take long to overwhelm the state, which as of March 20, 2020, had more than 1,300 cases.
The Trump administration in recent days has attempted to speed testing for the virus after early missteps hampered the government’s response to contain the contagion, and officials have had to respond to a barrage of criticism from public health experts, state officials, and members of Congress.
Federal health officials have eased the process for university and commercial labs to perform their own tests, and they are ramping up their capacity. As of March 16, public and private labs in the United States had the ability to test more than 36,000 people a day, according to estimates compiled by the American Enterprise Institute, a conservative-leaning think tank in Washington, a figure expected to rapidly escalate in coming weeks. That figure, however, can vary considerably by state and does not indicate how many tests are actually given to patients.
“We are now beginning to see that they have spread out in a prioritized way. We asked them to prioritize the regions that were mostly affected,” Deborah Birx, the coronavirus response coordinator for the White House Coronavirus Task Force, said March 18 of private labs’ testing, without elaboration.
The scaling up of testing is set to take place after weeks of faltering and hundreds, if not thousands, of undiagnosed people spreading the virus. For example, New York’s state health department received a faulty CDC test kit on Feb. 8 for 800 patient specimens, an amount that’s consistent with other states, according to a spokesperson. It later began testing patients with a test that state officials developed based on the CDC protocol and has significantly increased testing – as of March 20, more than 7,200 people had tested positive statewide.
In New York City, the first batch was obtained on Feb. 7.
“The other state and local public health laboratories got test kits as they became available,” said Eric Blank, chief program officer of the Association of Public Health Laboratories.
Places in the middle of the country with no outbreaks had the luxury of time to plan. For example, Missouri officials have had about 800 tests to work with, leading to only 395 performed so far in the region by public health labs – 26 of which were positive. When private lab tests are accounted for, as of March 20 there were 47 confirmed cases.
Health care providers and public health staff in the state, however, benefited from the fact that there is less international travel to the region, according to infectious disease expert Steven Lawrence, MD, of Washington University, St. Louis.
“This is very similar to 1918 with the influenza pandemic – St. Louis had more time to prepare and was able to put measures in place to flatten the curve than, say, Philadelphia,” Dr. Lawrence said. “Seattle didn’t have an opportunity to prepare as much in advance.”
While commercial labs are coming online, strict restrictions are limiting testing capabilities, Dr. Lawrence said.
“The state has had their hands tied,” he added.
Waiting And wondering
Because of a widespread lag in testing, it is still a mystery for thousands of people to know whether they’ve come into contact with an infected person until well after it happens. As of March 20, the pandemic had killed more than 11,000 globally. More than 16,000 Americans were confirmed infected and at least 216 have died.
“CDC will distribute tests based on where they can do the most good. But without hospital-based testing and commercial testing, it will not be possible to meet the need,” said Tom Frieden, who led the CDC during President Obama’s administration and is a former commissioner of the New York City Health Department.
In California, public school teacher Claire Dugan, whose state was among the hardest hit in the initial wave of U.S. coronavirus cases, was told she didn’t qualify for testing because she had not traveled abroad to any country with an outbreak of the virus or been in contact with an infected person. Ms. Dugan, who lives in the San Francisco Bay area and is already medically fragile after a stray bullet nearly killed her while driving 4 years ago, sought a test from her doctor after registering a temperature of 100.7° F earlier this month.
“There are a lot of layers as to why this is so messed up,” said Ms. Dugan, who relies on a feeding tube and said she sought a test not only to protect herself but her students. “It’s community spreading right now, so it’s kind of silly we’re still insisting on [the early criteria for testing]. How would I know?”
Since the CDC’s initial distribution, states have been reordering more tests through the office’s International Reagent Resource – a long-standing tool that public health labs have relied on. They have also revised testing protocols to use only one sample per person, which boosts the number of people screened.
Yet problems still abound with tests or other materials needed to be able to detect the virus. California Gov. Gavin Newsom (D) said on March 12 that county public health labs can’t use all of the 8,000 test kits the state has because they are missing key components.
In Pennsylvania, state officials weren’t able to begin testing until March 2 because of problems with the CDC’s initial kit, according to Nate Wardle, a spokesperson at its department of health. New York received two newly manufactured CDC test kits on Feb. 29 and also began performing tests March 2, according to its health department.
“We are still limited on extraction kits,” Mandy Cohen, the Health & Human Services secretary in North Carolina, said in an interview in mid-March. Officials earlier this month could test only 300 patients because of shortages in the extraction materials needed to register whether the novel coronavirus is present.
In North Dakota, Loralyn Hegland wrote her physician’s practice an email on March 10 with the subject line “dry cough,” wondering if she should come in for testing after learning that was one symptom of COVID-19. The recommendation she got echoes those of countless others across the United States, saying her risk of being exposed was very low because she hadn’t traveled outside the United States and had not come into contact with a person who had been “definitely” diagnosed with the virus.
Ms. Hegland, who lives in Fargo, didn’t have a fever but decided to shelter herself, anyway, out of caution.
Would she push to get a test?
“What’s the point?” she said. “You can’t know what you don’t know. It’s just that simple. How else do you explain it to people when you’re not testing?”
KHN Midwest correspondent Lauren Weber in St. Louis contributed to this article.
Kaiser Health News is a national health policy news service. It is an editorially independent program of the Henry J. Kaiser Family Foundation which is not affiliated with Kaiser Permanente.
As the novel coronavirus snaked its way across the globe, the Centers for Disease Control and Prevention in early February distributed 200 test kits it had produced to more than 100 public health labs run by states and counties nationwide.
Each kit contained material to test a mere 300-400 patients. And labs, whether serving the population of New York or tiny towns in rural America, apparently received the same kits.
The kits were distributed roughly equally to locales in all 50 states. That decision presaged weeks of chaos, in which the availability of COVID-19 tests seemed oddly out of sync with where testing was needed.
A woman in South Dakota with mild symptoms and no fever readily got the test and the results. Meanwhile, political leaders and public officials in places like New York, Boston, Seattle, and the San Francisco Bay area – all in the throes of serious outbreaks – couldn’t get enough tests to screen ill patients or, thereby, the information they needed to protect the general public and stem the outbreak of the virus, whose symptoms mimic those of common respiratory illnesses.
Rapid testing is crucial in the early stages of an outbreak. It allows health workers and families to identify and focus on treating those infected and isolate them.
Yet health officials in New York and such states as New York, Washington, Pennsylvania, and Georgia confirmed that they each initially got one test kit, calling into question whether they would have even stood a chance to contain the outbreaks that would emerge. They would soon discover that the tests they did receive were flawed, lacking critical components, and delivering faulty results.
During those early weeks, the virus took off, infecting thousands of people and leading to nationwide social distancing and sheltering in place. Public health officials are just beginning to grapple with the fallout from that early bungling of testing, which is likely to haunt the country in the months to come.
Too little too late
The first shipment to Washington state arrived more than 2 weeks after officials there announced the first U.S. case of coronavirus, and at a moment when deadly outbreaks of the disease were already festering in places like the Life Care Center in Kirkland. Within weeks, three dozen people infected with COVID-19 would die at the nursing home in the suburbs of Seattle.
The spread of COVID-19 would not take long to overwhelm the state, which as of March 20, 2020, had more than 1,300 cases.
The Trump administration in recent days has attempted to speed testing for the virus after early missteps hampered the government’s response to contain the contagion, and officials have had to respond to a barrage of criticism from public health experts, state officials, and members of Congress.
Federal health officials have eased the process for university and commercial labs to perform their own tests, and they are ramping up their capacity. As of March 16, public and private labs in the United States had the ability to test more than 36,000 people a day, according to estimates compiled by the American Enterprise Institute, a conservative-leaning think tank in Washington, a figure expected to rapidly escalate in coming weeks. That figure, however, can vary considerably by state and does not indicate how many tests are actually given to patients.
“We are now beginning to see that they have spread out in a prioritized way. We asked them to prioritize the regions that were mostly affected,” Deborah Birx, the coronavirus response coordinator for the White House Coronavirus Task Force, said March 18 of private labs’ testing, without elaboration.
The scaling up of testing is set to take place after weeks of faltering and hundreds, if not thousands, of undiagnosed people spreading the virus. For example, New York’s state health department received a faulty CDC test kit on Feb. 8 for 800 patient specimens, an amount that’s consistent with other states, according to a spokesperson. It later began testing patients with a test that state officials developed based on the CDC protocol and has significantly increased testing – as of March 20, more than 7,200 people had tested positive statewide.
In New York City, the first batch was obtained on Feb. 7.
“The other state and local public health laboratories got test kits as they became available,” said Eric Blank, chief program officer of the Association of Public Health Laboratories.
Places in the middle of the country with no outbreaks had the luxury of time to plan. For example, Missouri officials have had about 800 tests to work with, leading to only 395 performed so far in the region by public health labs – 26 of which were positive. When private lab tests are accounted for, as of March 20 there were 47 confirmed cases.
Health care providers and public health staff in the state, however, benefited from the fact that there is less international travel to the region, according to infectious disease expert Steven Lawrence, MD, of Washington University, St. Louis.
“This is very similar to 1918 with the influenza pandemic – St. Louis had more time to prepare and was able to put measures in place to flatten the curve than, say, Philadelphia,” Dr. Lawrence said. “Seattle didn’t have an opportunity to prepare as much in advance.”
While commercial labs are coming online, strict restrictions are limiting testing capabilities, Dr. Lawrence said.
“The state has had their hands tied,” he added.
Waiting And wondering
Because of a widespread lag in testing, it is still a mystery for thousands of people to know whether they’ve come into contact with an infected person until well after it happens. As of March 20, the pandemic had killed more than 11,000 globally. More than 16,000 Americans were confirmed infected and at least 216 have died.
“CDC will distribute tests based on where they can do the most good. But without hospital-based testing and commercial testing, it will not be possible to meet the need,” said Tom Frieden, who led the CDC during President Obama’s administration and is a former commissioner of the New York City Health Department.
In California, public school teacher Claire Dugan, whose state was among the hardest hit in the initial wave of U.S. coronavirus cases, was told she didn’t qualify for testing because she had not traveled abroad to any country with an outbreak of the virus or been in contact with an infected person. Ms. Dugan, who lives in the San Francisco Bay area and is already medically fragile after a stray bullet nearly killed her while driving 4 years ago, sought a test from her doctor after registering a temperature of 100.7° F earlier this month.
“There are a lot of layers as to why this is so messed up,” said Ms. Dugan, who relies on a feeding tube and said she sought a test not only to protect herself but her students. “It’s community spreading right now, so it’s kind of silly we’re still insisting on [the early criteria for testing]. How would I know?”
Since the CDC’s initial distribution, states have been reordering more tests through the office’s International Reagent Resource – a long-standing tool that public health labs have relied on. They have also revised testing protocols to use only one sample per person, which boosts the number of people screened.
Yet problems still abound with tests or other materials needed to be able to detect the virus. California Gov. Gavin Newsom (D) said on March 12 that county public health labs can’t use all of the 8,000 test kits the state has because they are missing key components.
In Pennsylvania, state officials weren’t able to begin testing until March 2 because of problems with the CDC’s initial kit, according to Nate Wardle, a spokesperson at its department of health. New York received two newly manufactured CDC test kits on Feb. 29 and also began performing tests March 2, according to its health department.
“We are still limited on extraction kits,” Mandy Cohen, the Health & Human Services secretary in North Carolina, said in an interview in mid-March. Officials earlier this month could test only 300 patients because of shortages in the extraction materials needed to register whether the novel coronavirus is present.
In North Dakota, Loralyn Hegland wrote her physician’s practice an email on March 10 with the subject line “dry cough,” wondering if she should come in for testing after learning that was one symptom of COVID-19. The recommendation she got echoes those of countless others across the United States, saying her risk of being exposed was very low because she hadn’t traveled outside the United States and had not come into contact with a person who had been “definitely” diagnosed with the virus.
Ms. Hegland, who lives in Fargo, didn’t have a fever but decided to shelter herself, anyway, out of caution.
Would she push to get a test?
“What’s the point?” she said. “You can’t know what you don’t know. It’s just that simple. How else do you explain it to people when you’re not testing?”
KHN Midwest correspondent Lauren Weber in St. Louis contributed to this article.
Kaiser Health News is a national health policy news service. It is an editorially independent program of the Henry J. Kaiser Family Foundation which is not affiliated with Kaiser Permanente.
As the novel coronavirus snaked its way across the globe, the Centers for Disease Control and Prevention in early February distributed 200 test kits it had produced to more than 100 public health labs run by states and counties nationwide.
Each kit contained material to test a mere 300-400 patients. And labs, whether serving the population of New York or tiny towns in rural America, apparently received the same kits.
The kits were distributed roughly equally to locales in all 50 states. That decision presaged weeks of chaos, in which the availability of COVID-19 tests seemed oddly out of sync with where testing was needed.
A woman in South Dakota with mild symptoms and no fever readily got the test and the results. Meanwhile, political leaders and public officials in places like New York, Boston, Seattle, and the San Francisco Bay area – all in the throes of serious outbreaks – couldn’t get enough tests to screen ill patients or, thereby, the information they needed to protect the general public and stem the outbreak of the virus, whose symptoms mimic those of common respiratory illnesses.
Rapid testing is crucial in the early stages of an outbreak. It allows health workers and families to identify and focus on treating those infected and isolate them.
Yet health officials in New York and such states as New York, Washington, Pennsylvania, and Georgia confirmed that they each initially got one test kit, calling into question whether they would have even stood a chance to contain the outbreaks that would emerge. They would soon discover that the tests they did receive were flawed, lacking critical components, and delivering faulty results.
During those early weeks, the virus took off, infecting thousands of people and leading to nationwide social distancing and sheltering in place. Public health officials are just beginning to grapple with the fallout from that early bungling of testing, which is likely to haunt the country in the months to come.
Too little too late
The first shipment to Washington state arrived more than 2 weeks after officials there announced the first U.S. case of coronavirus, and at a moment when deadly outbreaks of the disease were already festering in places like the Life Care Center in Kirkland. Within weeks, three dozen people infected with COVID-19 would die at the nursing home in the suburbs of Seattle.
The spread of COVID-19 would not take long to overwhelm the state, which as of March 20, 2020, had more than 1,300 cases.
The Trump administration in recent days has attempted to speed testing for the virus after early missteps hampered the government’s response to contain the contagion, and officials have had to respond to a barrage of criticism from public health experts, state officials, and members of Congress.
Federal health officials have eased the process for university and commercial labs to perform their own tests, and they are ramping up their capacity. As of March 16, public and private labs in the United States had the ability to test more than 36,000 people a day, according to estimates compiled by the American Enterprise Institute, a conservative-leaning think tank in Washington, a figure expected to rapidly escalate in coming weeks. That figure, however, can vary considerably by state and does not indicate how many tests are actually given to patients.
“We are now beginning to see that they have spread out in a prioritized way. We asked them to prioritize the regions that were mostly affected,” Deborah Birx, the coronavirus response coordinator for the White House Coronavirus Task Force, said March 18 of private labs’ testing, without elaboration.
The scaling up of testing is set to take place after weeks of faltering and hundreds, if not thousands, of undiagnosed people spreading the virus. For example, New York’s state health department received a faulty CDC test kit on Feb. 8 for 800 patient specimens, an amount that’s consistent with other states, according to a spokesperson. It later began testing patients with a test that state officials developed based on the CDC protocol and has significantly increased testing – as of March 20, more than 7,200 people had tested positive statewide.
In New York City, the first batch was obtained on Feb. 7.
“The other state and local public health laboratories got test kits as they became available,” said Eric Blank, chief program officer of the Association of Public Health Laboratories.
Places in the middle of the country with no outbreaks had the luxury of time to plan. For example, Missouri officials have had about 800 tests to work with, leading to only 395 performed so far in the region by public health labs – 26 of which were positive. When private lab tests are accounted for, as of March 20 there were 47 confirmed cases.
Health care providers and public health staff in the state, however, benefited from the fact that there is less international travel to the region, according to infectious disease expert Steven Lawrence, MD, of Washington University, St. Louis.
“This is very similar to 1918 with the influenza pandemic – St. Louis had more time to prepare and was able to put measures in place to flatten the curve than, say, Philadelphia,” Dr. Lawrence said. “Seattle didn’t have an opportunity to prepare as much in advance.”
While commercial labs are coming online, strict restrictions are limiting testing capabilities, Dr. Lawrence said.
“The state has had their hands tied,” he added.
Waiting And wondering
Because of a widespread lag in testing, it is still a mystery for thousands of people to know whether they’ve come into contact with an infected person until well after it happens. As of March 20, the pandemic had killed more than 11,000 globally. More than 16,000 Americans were confirmed infected and at least 216 have died.
“CDC will distribute tests based on where they can do the most good. But without hospital-based testing and commercial testing, it will not be possible to meet the need,” said Tom Frieden, who led the CDC during President Obama’s administration and is a former commissioner of the New York City Health Department.
In California, public school teacher Claire Dugan, whose state was among the hardest hit in the initial wave of U.S. coronavirus cases, was told she didn’t qualify for testing because she had not traveled abroad to any country with an outbreak of the virus or been in contact with an infected person. Ms. Dugan, who lives in the San Francisco Bay area and is already medically fragile after a stray bullet nearly killed her while driving 4 years ago, sought a test from her doctor after registering a temperature of 100.7° F earlier this month.
“There are a lot of layers as to why this is so messed up,” said Ms. Dugan, who relies on a feeding tube and said she sought a test not only to protect herself but her students. “It’s community spreading right now, so it’s kind of silly we’re still insisting on [the early criteria for testing]. How would I know?”
Since the CDC’s initial distribution, states have been reordering more tests through the office’s International Reagent Resource – a long-standing tool that public health labs have relied on. They have also revised testing protocols to use only one sample per person, which boosts the number of people screened.
Yet problems still abound with tests or other materials needed to be able to detect the virus. California Gov. Gavin Newsom (D) said on March 12 that county public health labs can’t use all of the 8,000 test kits the state has because they are missing key components.
In Pennsylvania, state officials weren’t able to begin testing until March 2 because of problems with the CDC’s initial kit, according to Nate Wardle, a spokesperson at its department of health. New York received two newly manufactured CDC test kits on Feb. 29 and also began performing tests March 2, according to its health department.
“We are still limited on extraction kits,” Mandy Cohen, the Health & Human Services secretary in North Carolina, said in an interview in mid-March. Officials earlier this month could test only 300 patients because of shortages in the extraction materials needed to register whether the novel coronavirus is present.
In North Dakota, Loralyn Hegland wrote her physician’s practice an email on March 10 with the subject line “dry cough,” wondering if she should come in for testing after learning that was one symptom of COVID-19. The recommendation she got echoes those of countless others across the United States, saying her risk of being exposed was very low because she hadn’t traveled outside the United States and had not come into contact with a person who had been “definitely” diagnosed with the virus.
Ms. Hegland, who lives in Fargo, didn’t have a fever but decided to shelter herself, anyway, out of caution.
Would she push to get a test?
“What’s the point?” she said. “You can’t know what you don’t know. It’s just that simple. How else do you explain it to people when you’re not testing?”
KHN Midwest correspondent Lauren Weber in St. Louis contributed to this article.
Kaiser Health News is a national health policy news service. It is an editorially independent program of the Henry J. Kaiser Family Foundation which is not affiliated with Kaiser Permanente.
Get out the inpatient vote
Disenfranchisement undeniably remains a major problem across the United States. While it is challenging for health care providers to find time to vote, hospitalized patients are an underrecognized vulnerable group, often unable to exercise this constitutional right. With the 2020 election approaching, voting is as important as ever.

On morning rounds after the 2018 election, we discussed the impact of a changing majority in the House of Representatives and its potential impact on health care in America. We discussed where, when, and how we voted, and then suddenly considered a question that we were unable to answer: How do our hospitalized patients vote and did any of them vote in this important election?

Inpatients rarely know when or how long they will be hospitalized. They often have no chance to prepare by paying bills, arranging care for loved ones, or finding coverage for employment responsibilities. The sickest patients can do little more than wonder about anything other than their short-term health. As a result of restricted voting laws, they, like too many others, are effectively disenfranchised.
We asked administrators in multiple hospitals across New York City how to help our patients vote. Unfortunately, the process is overwhelmingly complex and varies by state. Absentee ballots, which are easily accessible in New York if it they are requested no later than 7 days before the election, are harder to come by on the same day. Most people struggle to vote in general – with only 61% voting in the 2016 election.1 To combat this, individual hospitals have created initiatives such as Penn Votes, which has helped 65 hospitalized Pennsylvania residents vote in the last three elections2 – a success, but still leaving so many without a voice.
With health care being a major policy issue for the 2020 election, voting has never been more important for patients. With nearly 1 million hospital beds in America,3 hospitalized patients represent a significant number of potential voters who are functionally disenfranchised. Most importantly, these patients are directly under our care, and we are their strongest advocates. Therefore, we ask our fellow health care providers to start planning today how we will help our patients exercise their voices, participate in our health care policy debate, and choose the future leaders of our country.
Dr. Rosenblatt is assistant professor of medicine, Division of Gastroenterology and Hepatology, at Weill Cornell Medicine, New York. Dr. Verna is assistant professor of medicine, Department of Surgery, at Columbia University Irving Medical School, New York. Dr. Rosenblatt and Dr. Verna reported having no relevant conflicts of interest.
References
1. File T. Voting in America: A Look at the 2016 Presidential Election [Internet]. 2017 [cited 2020 Jan 7];Available from: https://www.census.gov/newsroom/blogs/random-samplings/2017/05/voting_in_america.html.
2. Vigodner S. Penn students are helping hospitalized patients cast emergency ballots for Tuesday’s election [Internet]. Dly. Pennsylvanian. 2018;Available from: https://www.thedp.com/article/2018/11/penn-med-votes-emergency-hospital-patients-upenn-philadelphia-elections.
3. Association AH. Fast facts on US hospitals [Internet]. 2019 [cited 2020 Jan 7];Available from: https://www.aha.org/statistics/fast-facts-us-hospitals.
Disenfranchisement undeniably remains a major problem across the United States. While it is challenging for health care providers to find time to vote, hospitalized patients are an underrecognized vulnerable group, often unable to exercise this constitutional right. With the 2020 election approaching, voting is as important as ever.
On morning rounds after the 2018 election, we discussed the impact of a changing majority in the House of Representatives and its potential impact on health care in America. We discussed where, when, and how we voted, and then suddenly considered a question that we were unable to answer: How do our hospitalized patients vote and did any of them vote in this important election?
Inpatients rarely know when or how long they will be hospitalized. They often have no chance to prepare by paying bills, arranging care for loved ones, or finding coverage for employment responsibilities. The sickest patients can do little more than wonder about anything other than their short-term health. As a result of restricted voting laws, they, like too many others, are effectively disenfranchised.
We asked administrators in multiple hospitals across New York City how to help our patients vote. Unfortunately, the process is overwhelmingly complex and varies by state. Absentee ballots, which are easily accessible in New York if it they are requested no later than 7 days before the election, are harder to come by on the same day. Most people struggle to vote in general – with only 61% voting in the 2016 election.1 To combat this, individual hospitals have created initiatives such as Penn Votes, which has helped 65 hospitalized Pennsylvania residents vote in the last three elections2 – a success, but still leaving so many without a voice.
With health care being a major policy issue for the 2020 election, voting has never been more important for patients. With nearly 1 million hospital beds in America,3 hospitalized patients represent a significant number of potential voters who are functionally disenfranchised. Most importantly, these patients are directly under our care, and we are their strongest advocates. Therefore, we ask our fellow health care providers to start planning today how we will help our patients exercise their voices, participate in our health care policy debate, and choose the future leaders of our country.
Dr. Rosenblatt is assistant professor of medicine, Division of Gastroenterology and Hepatology, at Weill Cornell Medicine, New York. Dr. Verna is assistant professor of medicine, Department of Surgery, at Columbia University Irving Medical School, New York. Dr. Rosenblatt and Dr. Verna reported having no relevant conflicts of interest.
References
1. File T. Voting in America: A Look at the 2016 Presidential Election [Internet]. 2017 [cited 2020 Jan 7];Available from: https://www.census.gov/newsroom/blogs/random-samplings/2017/05/voting_in_america.html.
2. Vigodner S. Penn students are helping hospitalized patients cast emergency ballots for Tuesday’s election [Internet]. Dly. Pennsylvanian. 2018;Available from: https://www.thedp.com/article/2018/11/penn-med-votes-emergency-hospital-patients-upenn-philadelphia-elections.
3. Association AH. Fast facts on US hospitals [Internet]. 2019 [cited 2020 Jan 7];Available from: https://www.aha.org/statistics/fast-facts-us-hospitals.
Disenfranchisement undeniably remains a major problem across the United States. While it is challenging for health care providers to find time to vote, hospitalized patients are an underrecognized vulnerable group, often unable to exercise this constitutional right. With the 2020 election approaching, voting is as important as ever.
On morning rounds after the 2018 election, we discussed the impact of a changing majority in the House of Representatives and its potential impact on health care in America. We discussed where, when, and how we voted, and then suddenly considered a question that we were unable to answer: How do our hospitalized patients vote and did any of them vote in this important election?
Inpatients rarely know when or how long they will be hospitalized. They often have no chance to prepare by paying bills, arranging care for loved ones, or finding coverage for employment responsibilities. The sickest patients can do little more than wonder about anything other than their short-term health. As a result of restricted voting laws, they, like too many others, are effectively disenfranchised.
We asked administrators in multiple hospitals across New York City how to help our patients vote. Unfortunately, the process is overwhelmingly complex and varies by state. Absentee ballots, which are easily accessible in New York if it they are requested no later than 7 days before the election, are harder to come by on the same day. Most people struggle to vote in general – with only 61% voting in the 2016 election.1 To combat this, individual hospitals have created initiatives such as Penn Votes, which has helped 65 hospitalized Pennsylvania residents vote in the last three elections2 – a success, but still leaving so many without a voice.
With health care being a major policy issue for the 2020 election, voting has never been more important for patients. With nearly 1 million hospital beds in America,3 hospitalized patients represent a significant number of potential voters who are functionally disenfranchised. Most importantly, these patients are directly under our care, and we are their strongest advocates. Therefore, we ask our fellow health care providers to start planning today how we will help our patients exercise their voices, participate in our health care policy debate, and choose the future leaders of our country.
Dr. Rosenblatt is assistant professor of medicine, Division of Gastroenterology and Hepatology, at Weill Cornell Medicine, New York. Dr. Verna is assistant professor of medicine, Department of Surgery, at Columbia University Irving Medical School, New York. Dr. Rosenblatt and Dr. Verna reported having no relevant conflicts of interest.
References
1. File T. Voting in America: A Look at the 2016 Presidential Election [Internet]. 2017 [cited 2020 Jan 7];Available from: https://www.census.gov/newsroom/blogs/random-samplings/2017/05/voting_in_america.html.
2. Vigodner S. Penn students are helping hospitalized patients cast emergency ballots for Tuesday’s election [Internet]. Dly. Pennsylvanian. 2018;Available from: https://www.thedp.com/article/2018/11/penn-med-votes-emergency-hospital-patients-upenn-philadelphia-elections.
3. Association AH. Fast facts on US hospitals [Internet]. 2019 [cited 2020 Jan 7];Available from: https://www.aha.org/statistics/fast-facts-us-hospitals.

CVH in pregnant women: Ample room for improvement
Cardiovascular disease is both common and chronic, and it remains the leading cause of death in women. Because it is a life-long condition, cardiovascular disease must be managed over the entire lifespan. In recognition of the important role of obstetricians and gynecologists in monitoring women’s health, the American Heart Association/American College of Obstetricians and Gynecologists 2018 guidelines1 promoted the use of “Life’s Simple 7”2 for assessing cardiovascular health (CVH) in women.
These seven metrics include diet, physical activity, smoking status, body mass index (BMI), blood pressure, total cholesterol, and fasting blood glucose levels. They have been shown to predict positive health outcomes in nonpregnant adults. However, until now, CVH had not been assessed in pregnant women.
Perak et al. recently performed the first cross-sectional study of the prevalence of CVH metrics in pregnant women using the AHA definition.3 Using data from the National Health and Nutrition Examination Surveys (NHANES), they used the Life’s Simple 7 metrics to assess CVH in 1,117 pregnant and 8,200 nonpregnant women in the United States aged 20-44 years. Each of the Life’s Simple 7 metrics was scored 0, 1, or 2 points, corresponding to a rating of poor, intermediate, or ideal, respectively. Thus, the total CVH score ranged from 0-14 points, with total scores of 0-7 indicating low CVH, 8-11 indicating moderate CVH, and 12-14 indicating high CVH.
which was even worse than in nonpregnant women, of whom only 13% were scored as having ideal CVH. Ideal scores were observed for 0.1% of pregnant women for diet, 27% for physical activity, 39% for cholesterol levels, 51% for BMI, 78% for smoking, 90% for blood pressure, and 92% for fasting blood glucose. Physical activity and cholesterol levels appeared to be the major drivers of the lower CVH scores in pregnant women.

Although further studies are warranted to determine the relevance of CVH during pregnancy to outcomes for both mother and offspring, the study by Perak et al. is an important step toward the development of pregnancy-specific guidelines and definitions for CVH metrics. These are stated goals of the AHA/ACOG that will help promote CVH in women across their lifespans, but which have not been possible due to scant data.
Emerging data suggest that cumulative lifetime exposure is a significant factor in cardiovascular disease outcomes; therefore, earlier intervention would have a more significant impact. Just as gestational diabetes is a predictor of future type 2 diabetes, CVH earlier in a woman’s life predicts cardiovascular disease later in life.4-7 The best data in this regard come from genetic and other studies of hyperlipidemia, which suggest that lowering lipid levels before symptoms develop may prevent cardiovascular disease. In contrast, treatment of patients with clinically manifest disease neither offers a cure nor prevents the occurrence of most cardiovascular events.
It is a particularly salient point in this regard that there currently are no guidelines on treatment of hypercholesterolemia during pregnancy. Notably, the study by Perak et al. suggested that cholesterol levels may have a significant impact on CVH in pregnant women. There also is emerging data supporting the importance of controlling blood pressure across the lifespan,7,8 including during pregnancy.9

For many women, their ob.gyn. is their primary care physician, and pregnancy is often the first time that a woman will have a substantial interaction with the health care system. The AHA/ACOG advisory panel described pregnancy as a “physiological stress test” for women that offers the opportunity to identify those at increased risk of cardiovascular disease.1
As pregnancy is a time when women particularly are motivated to improve their health,10 it also presents a valuable opportunity for physicians, including ob.gyns., to make a lifelong impact on the CVH of their patients through early identification, education, and intervention.
Dr. Charles Hong is the Melvin Sharoky, MD, Professor of Medicine and director of cardiovascular research in the department of medicine at the University of Maryland School of Medicine. Dr. E. Albert Reece, who specializes in maternal-fetal medicine, is executive vice president for medical affairs at the University of Maryland School of Medicine as well as the John Z. and Akiko K. Bowers Distinguished Professor and dean of the school of medicine. Neither physician had any relevant financial disclosures. Contact him at obnews@mdedge.com.
References
1. Circulation. 2018;137:e843–e852.
2. Circulation. 2010 Jan 20;121(4):586–613.
3. J Am Heart Assoc. 2020 Feb 17;9:e015123.
4. J Am Coll Cardiol. 2018 Sep 4;72(10):1141-56.
5. N Engl J Med. 2016 Dec 1;375:2144-53.
6. Nat Rev Cardiol. 2011 Nov 1;8(12):721-5.
7. J Am Coll Cardiol. 2019 Jul 23;74(3):330-41.
8. Circulation. 2020 Mar 2:141:725-7.
9. Circulation. 2013 Feb 12;127(6):681-90.
10. Nutrients. 2018 Aug 8. doi: 10.3390/nu10081032.
Cardiovascular disease is both common and chronic, and it remains the leading cause of death in women. Because it is a life-long condition, cardiovascular disease must be managed over the entire lifespan. In recognition of the important role of obstetricians and gynecologists in monitoring women’s health, the American Heart Association/American College of Obstetricians and Gynecologists 2018 guidelines1 promoted the use of “Life’s Simple 7”2 for assessing cardiovascular health (CVH) in women.
These seven metrics include diet, physical activity, smoking status, body mass index (BMI), blood pressure, total cholesterol, and fasting blood glucose levels. They have been shown to predict positive health outcomes in nonpregnant adults. However, until now, CVH had not been assessed in pregnant women.
Perak et al. recently performed the first cross-sectional study of the prevalence of CVH metrics in pregnant women using the AHA definition.3 Using data from the National Health and Nutrition Examination Surveys (NHANES), they used the Life’s Simple 7 metrics to assess CVH in 1,117 pregnant and 8,200 nonpregnant women in the United States aged 20-44 years. Each of the Life’s Simple 7 metrics was scored 0, 1, or 2 points, corresponding to a rating of poor, intermediate, or ideal, respectively. Thus, the total CVH score ranged from 0-14 points, with total scores of 0-7 indicating low CVH, 8-11 indicating moderate CVH, and 12-14 indicating high CVH.
which was even worse than in nonpregnant women, of whom only 13% were scored as having ideal CVH. Ideal scores were observed for 0.1% of pregnant women for diet, 27% for physical activity, 39% for cholesterol levels, 51% for BMI, 78% for smoking, 90% for blood pressure, and 92% for fasting blood glucose. Physical activity and cholesterol levels appeared to be the major drivers of the lower CVH scores in pregnant women.
Although further studies are warranted to determine the relevance of CVH during pregnancy to outcomes for both mother and offspring, the study by Perak et al. is an important step toward the development of pregnancy-specific guidelines and definitions for CVH metrics. These are stated goals of the AHA/ACOG that will help promote CVH in women across their lifespans, but which have not been possible due to scant data.
Emerging data suggest that cumulative lifetime exposure is a significant factor in cardiovascular disease outcomes; therefore, earlier intervention would have a more significant impact. Just as gestational diabetes is a predictor of future type 2 diabetes, CVH earlier in a woman’s life predicts cardiovascular disease later in life.4-7 The best data in this regard come from genetic and other studies of hyperlipidemia, which suggest that lowering lipid levels before symptoms develop may prevent cardiovascular disease. In contrast, treatment of patients with clinically manifest disease neither offers a cure nor prevents the occurrence of most cardiovascular events.
It is a particularly salient point in this regard that there currently are no guidelines on treatment of hypercholesterolemia during pregnancy. Notably, the study by Perak et al. suggested that cholesterol levels may have a significant impact on CVH in pregnant women. There also is emerging data supporting the importance of controlling blood pressure across the lifespan,7,8 including during pregnancy.9
For many women, their ob.gyn. is their primary care physician, and pregnancy is often the first time that a woman will have a substantial interaction with the health care system. The AHA/ACOG advisory panel described pregnancy as a “physiological stress test” for women that offers the opportunity to identify those at increased risk of cardiovascular disease.1
As pregnancy is a time when women particularly are motivated to improve their health,10 it also presents a valuable opportunity for physicians, including ob.gyns., to make a lifelong impact on the CVH of their patients through early identification, education, and intervention.
Dr. Charles Hong is the Melvin Sharoky, MD, Professor of Medicine and director of cardiovascular research in the department of medicine at the University of Maryland School of Medicine. Dr. E. Albert Reece, who specializes in maternal-fetal medicine, is executive vice president for medical affairs at the University of Maryland School of Medicine as well as the John Z. and Akiko K. Bowers Distinguished Professor and dean of the school of medicine. Neither physician had any relevant financial disclosures. Contact him at obnews@mdedge.com.
References
1. Circulation. 2018;137:e843–e852.
2. Circulation. 2010 Jan 20;121(4):586–613.
3. J Am Heart Assoc. 2020 Feb 17;9:e015123.
4. J Am Coll Cardiol. 2018 Sep 4;72(10):1141-56.
5. N Engl J Med. 2016 Dec 1;375:2144-53.
6. Nat Rev Cardiol. 2011 Nov 1;8(12):721-5.
7. J Am Coll Cardiol. 2019 Jul 23;74(3):330-41.
8. Circulation. 2020 Mar 2:141:725-7.
9. Circulation. 2013 Feb 12;127(6):681-90.
10. Nutrients. 2018 Aug 8. doi: 10.3390/nu10081032.
Cardiovascular disease is both common and chronic, and it remains the leading cause of death in women. Because it is a life-long condition, cardiovascular disease must be managed over the entire lifespan. In recognition of the important role of obstetricians and gynecologists in monitoring women’s health, the American Heart Association/American College of Obstetricians and Gynecologists 2018 guidelines1 promoted the use of “Life’s Simple 7”2 for assessing cardiovascular health (CVH) in women.
These seven metrics include diet, physical activity, smoking status, body mass index (BMI), blood pressure, total cholesterol, and fasting blood glucose levels. They have been shown to predict positive health outcomes in nonpregnant adults. However, until now, CVH had not been assessed in pregnant women.
Perak et al. recently performed the first cross-sectional study of the prevalence of CVH metrics in pregnant women using the AHA definition.3 Using data from the National Health and Nutrition Examination Surveys (NHANES), they used the Life’s Simple 7 metrics to assess CVH in 1,117 pregnant and 8,200 nonpregnant women in the United States aged 20-44 years. Each of the Life’s Simple 7 metrics was scored 0, 1, or 2 points, corresponding to a rating of poor, intermediate, or ideal, respectively. Thus, the total CVH score ranged from 0-14 points, with total scores of 0-7 indicating low CVH, 8-11 indicating moderate CVH, and 12-14 indicating high CVH.
which was even worse than in nonpregnant women, of whom only 13% were scored as having ideal CVH. Ideal scores were observed for 0.1% of pregnant women for diet, 27% for physical activity, 39% for cholesterol levels, 51% for BMI, 78% for smoking, 90% for blood pressure, and 92% for fasting blood glucose. Physical activity and cholesterol levels appeared to be the major drivers of the lower CVH scores in pregnant women.
Although further studies are warranted to determine the relevance of CVH during pregnancy to outcomes for both mother and offspring, the study by Perak et al. is an important step toward the development of pregnancy-specific guidelines and definitions for CVH metrics. These are stated goals of the AHA/ACOG that will help promote CVH in women across their lifespans, but which have not been possible due to scant data.
Emerging data suggest that cumulative lifetime exposure is a significant factor in cardiovascular disease outcomes; therefore, earlier intervention would have a more significant impact. Just as gestational diabetes is a predictor of future type 2 diabetes, CVH earlier in a woman’s life predicts cardiovascular disease later in life.4-7 The best data in this regard come from genetic and other studies of hyperlipidemia, which suggest that lowering lipid levels before symptoms develop may prevent cardiovascular disease. In contrast, treatment of patients with clinically manifest disease neither offers a cure nor prevents the occurrence of most cardiovascular events.
It is a particularly salient point in this regard that there currently are no guidelines on treatment of hypercholesterolemia during pregnancy. Notably, the study by Perak et al. suggested that cholesterol levels may have a significant impact on CVH in pregnant women. There also is emerging data supporting the importance of controlling blood pressure across the lifespan,7,8 including during pregnancy.9
For many women, their ob.gyn. is their primary care physician, and pregnancy is often the first time that a woman will have a substantial interaction with the health care system. The AHA/ACOG advisory panel described pregnancy as a “physiological stress test” for women that offers the opportunity to identify those at increased risk of cardiovascular disease.1
As pregnancy is a time when women particularly are motivated to improve their health,10 it also presents a valuable opportunity for physicians, including ob.gyns., to make a lifelong impact on the CVH of their patients through early identification, education, and intervention.
Dr. Charles Hong is the Melvin Sharoky, MD, Professor of Medicine and director of cardiovascular research in the department of medicine at the University of Maryland School of Medicine. Dr. E. Albert Reece, who specializes in maternal-fetal medicine, is executive vice president for medical affairs at the University of Maryland School of Medicine as well as the John Z. and Akiko K. Bowers Distinguished Professor and dean of the school of medicine. Neither physician had any relevant financial disclosures. Contact him at obnews@mdedge.com.
References
1. Circulation. 2018;137:e843–e852.
2. Circulation. 2010 Jan 20;121(4):586–613.
3. J Am Heart Assoc. 2020 Feb 17;9:e015123.
4. J Am Coll Cardiol. 2018 Sep 4;72(10):1141-56.
5. N Engl J Med. 2016 Dec 1;375:2144-53.
6. Nat Rev Cardiol. 2011 Nov 1;8(12):721-5.
7. J Am Coll Cardiol. 2019 Jul 23;74(3):330-41.
8. Circulation. 2020 Mar 2:141:725-7.
9. Circulation. 2013 Feb 12;127(6):681-90.
10. Nutrients. 2018 Aug 8. doi: 10.3390/nu10081032.
Genomic prostate score does not improve risk assessment
A genomic prostate score (GPS) has little value in predicting adverse outcomes in men who have undergone a period of active surveillance before having a radical prostatectomy, according to a study published in the Journal of Clinical of Oncology.
The hazard ratio for adverse pathology using the 17-gene Oncotype DX Genomic Prostate Score did not reach statistical significance in a multivariate model (HR, 1.17; P = .066). This model took into account factors such as the prostate-specific antigen density (PSAD) and the Gleason grade group at diagnosis.
“In our study, the independent association of GPS with adverse pathology after initial active surveillance was not statistically significant,” Daniel W. Lin, MD, of the Fred Hutchinson Cancer Research Center in Seattle, and colleagues wrote.
There was also no association between the GPS and having upgraded biopsy findings during active surveillance.
Active surveillance is the “preferred management strategy” for men with low-risk prostate cancer, observed Dr. Lin and colleagues, but its use is often tempered by the worry that there may be underlying pathology that is not detected using routine clinical measures such as prostate-specific antigen testing. In their study, the investigators looked to see if using the GPS could help risk-stratify men undergoing active surveillance.
They noted that the biopsy-based genomic test had been shown to predict adverse surgical pathology and recurrence in men with low- and intermediate-risk prostate cancer who had undergone immediate radical prostatectomy. The team therefore wanted to clarify the test’s role in men who had been initially managed with a period of active surveillance.
To calculate the GPS, the investigators retrospectively analyzed diagnostic biopsy samples that had been prospectively collected from 432 men in the Canary Prostate Active Surveillance Study. The primary endpoint was adverse pathology in men who underwent radical prostatectomy after initial surveillance. Adverse pathology was defined as a Gleason grade of 3 or greater, a staging of pT3a or higher (with or without N1), or both.
After a median follow-up of 4.6 years, 167 (39%) men experienced upgrading of their prostate cancer at a surveillance biopsy, with 51 (12%) being upgraded to a Gleason grade group of 3 or higher. A total of 101 (23%) men had radical prostatectomy at a median of 2.1 years after their diagnostic biopsy, and just over half (n = 52; 51%) had adverse pathology at this time point.
GPS was associated with adverse pathology when the diagnostic Gleason grade group was taken into account (HR, 1.18; P = .030) but not when the investigators adjusted for both PSAD and diagnostic Gleason grade group. By contrast, PSAD (HR, 1.75; P = .025) was significantly associated with adverse pathology.
“Adding GPS to a model containing PSAD and diagnostic [Gleason grade group] did not significantly improve stratification of risk for [adverse pathology] over the clinical variables alone,” Dr. Lin and colleagues concluded.
This work was supported by the Canary Foundation, the Department of Defense, the National Institutes of Health, and Genomic Health. The authors disclosed relationships with Genomic Health and other companies.
SOURCE: Lin DW et al. J Clin Oncol. 2020 Mar 4. doi: 10.1200/JCO.19.02267.
A genomic prostate score (GPS) has little value in predicting adverse outcomes in men who have undergone a period of active surveillance before having a radical prostatectomy, according to a study published in the Journal of Clinical of Oncology.
The hazard ratio for adverse pathology using the 17-gene Oncotype DX Genomic Prostate Score did not reach statistical significance in a multivariate model (HR, 1.17; P = .066). This model took into account factors such as the prostate-specific antigen density (PSAD) and the Gleason grade group at diagnosis.
“In our study, the independent association of GPS with adverse pathology after initial active surveillance was not statistically significant,” Daniel W. Lin, MD, of the Fred Hutchinson Cancer Research Center in Seattle, and colleagues wrote.
There was also no association between the GPS and having upgraded biopsy findings during active surveillance.
Active surveillance is the “preferred management strategy” for men with low-risk prostate cancer, observed Dr. Lin and colleagues, but its use is often tempered by the worry that there may be underlying pathology that is not detected using routine clinical measures such as prostate-specific antigen testing. In their study, the investigators looked to see if using the GPS could help risk-stratify men undergoing active surveillance.
They noted that the biopsy-based genomic test had been shown to predict adverse surgical pathology and recurrence in men with low- and intermediate-risk prostate cancer who had undergone immediate radical prostatectomy. The team therefore wanted to clarify the test’s role in men who had been initially managed with a period of active surveillance.
To calculate the GPS, the investigators retrospectively analyzed diagnostic biopsy samples that had been prospectively collected from 432 men in the Canary Prostate Active Surveillance Study. The primary endpoint was adverse pathology in men who underwent radical prostatectomy after initial surveillance. Adverse pathology was defined as a Gleason grade of 3 or greater, a staging of pT3a or higher (with or without N1), or both.
After a median follow-up of 4.6 years, 167 (39%) men experienced upgrading of their prostate cancer at a surveillance biopsy, with 51 (12%) being upgraded to a Gleason grade group of 3 or higher. A total of 101 (23%) men had radical prostatectomy at a median of 2.1 years after their diagnostic biopsy, and just over half (n = 52; 51%) had adverse pathology at this time point.
GPS was associated with adverse pathology when the diagnostic Gleason grade group was taken into account (HR, 1.18; P = .030) but not when the investigators adjusted for both PSAD and diagnostic Gleason grade group. By contrast, PSAD (HR, 1.75; P = .025) was significantly associated with adverse pathology.
“Adding GPS to a model containing PSAD and diagnostic [Gleason grade group] did not significantly improve stratification of risk for [adverse pathology] over the clinical variables alone,” Dr. Lin and colleagues concluded.
This work was supported by the Canary Foundation, the Department of Defense, the National Institutes of Health, and Genomic Health. The authors disclosed relationships with Genomic Health and other companies.
SOURCE: Lin DW et al. J Clin Oncol. 2020 Mar 4. doi: 10.1200/JCO.19.02267.
A genomic prostate score (GPS) has little value in predicting adverse outcomes in men who have undergone a period of active surveillance before having a radical prostatectomy, according to a study published in the Journal of Clinical of Oncology.
The hazard ratio for adverse pathology using the 17-gene Oncotype DX Genomic Prostate Score did not reach statistical significance in a multivariate model (HR, 1.17; P = .066). This model took into account factors such as the prostate-specific antigen density (PSAD) and the Gleason grade group at diagnosis.
“In our study, the independent association of GPS with adverse pathology after initial active surveillance was not statistically significant,” Daniel W. Lin, MD, of the Fred Hutchinson Cancer Research Center in Seattle, and colleagues wrote.
There was also no association between the GPS and having upgraded biopsy findings during active surveillance.
Active surveillance is the “preferred management strategy” for men with low-risk prostate cancer, observed Dr. Lin and colleagues, but its use is often tempered by the worry that there may be underlying pathology that is not detected using routine clinical measures such as prostate-specific antigen testing. In their study, the investigators looked to see if using the GPS could help risk-stratify men undergoing active surveillance.
They noted that the biopsy-based genomic test had been shown to predict adverse surgical pathology and recurrence in men with low- and intermediate-risk prostate cancer who had undergone immediate radical prostatectomy. The team therefore wanted to clarify the test’s role in men who had been initially managed with a period of active surveillance.
To calculate the GPS, the investigators retrospectively analyzed diagnostic biopsy samples that had been prospectively collected from 432 men in the Canary Prostate Active Surveillance Study. The primary endpoint was adverse pathology in men who underwent radical prostatectomy after initial surveillance. Adverse pathology was defined as a Gleason grade of 3 or greater, a staging of pT3a or higher (with or without N1), or both.
After a median follow-up of 4.6 years, 167 (39%) men experienced upgrading of their prostate cancer at a surveillance biopsy, with 51 (12%) being upgraded to a Gleason grade group of 3 or higher. A total of 101 (23%) men had radical prostatectomy at a median of 2.1 years after their diagnostic biopsy, and just over half (n = 52; 51%) had adverse pathology at this time point.
GPS was associated with adverse pathology when the diagnostic Gleason grade group was taken into account (HR, 1.18; P = .030) but not when the investigators adjusted for both PSAD and diagnostic Gleason grade group. By contrast, PSAD (HR, 1.75; P = .025) was significantly associated with adverse pathology.
“Adding GPS to a model containing PSAD and diagnostic [Gleason grade group] did not significantly improve stratification of risk for [adverse pathology] over the clinical variables alone,” Dr. Lin and colleagues concluded.
This work was supported by the Canary Foundation, the Department of Defense, the National Institutes of Health, and Genomic Health. The authors disclosed relationships with Genomic Health and other companies.
SOURCE: Lin DW et al. J Clin Oncol. 2020 Mar 4. doi: 10.1200/JCO.19.02267.
FROM THE JOURNAL OF CLINICAL ONCOLOGY
Study: Delays filling biologic prescriptions have consequences
Insurance and specialty pharmacy delays in authorizing new biologic prescriptions for severe allergies leave waiting patients at risk of asthma attacks, hospitalizations, emergency department visits and prednisone shots and their known side effects, according to a single-center study that was to have been presented at the annual meeting of the American Academy of Allergy, Asthma and Immunology.

The AAAAI canceled their annual meeting and provided abstracts and access to presenters for press coverage.
The study of 80 patients in State College, Pa., found that they waited an average of 44 days from when their doctor submitted the preauthorization request to the insurance company until the practice received the shipment for dispensing to the patient, investigator Faoud Ishmael, MD, PhD, of Mount Nittany Medical Group said in an interview. “The implication here is that these are really the most severe patients who, you would argue, need their medications the quickest, and it’s taking longer to get them than it would an inhaler,” Dr. Ishmael said.
The study focused on patients with severe asthma (n = 60) or urticarial (n = 20) who received a new prescription of monoclonal antibody therapy from March 2014 to August 2019. For asthma treatments, the average time was 45.8 days; for urticaria, 40.6 days (P = .573), Dr. Ishmael said. The researchers divided the total amount of time into two components: insurance plan review and approval (P = .654, and specialty pharmacy review and dispensing of the medicine, each of which averaged 22.8 days (P = .384), he said.
He also noted wide disparity in the range of approval times. “The shortest approval time was 1 day, and the longest 97 days,” Dr. Ishmael said. “It’s interesting that we had this really broad spread.”
What’s more, the study found no trend for the delays among insurers and specialty pharmacies, Dr. Ishmael added. “When these prescriptions get submitted, it’s like a black box,” he said. “It really seems arbitrary why some of them take so long and some of them don’t.” The findings were independent of type of coverage, whether commercial or government, or even specific insurance plans. “It’s more the process that is flawed rather than one insurance company being the bad guy,” he said.
The study also looked at what happened to patients while they were waiting for their prescriptions to be delivered. “What we found is that over half of asthmatics had an exacerbation – 51% had at least one asthma attack where they needed prednisone,” Dr. Ishmael said (P = .0015), “and we had three patients admitted to the hospital over that time frame when they were waiting for the drugs.” One of those patients had been admitted twice, making four total hospitalizations. Preliminary data analysis showed that about 40% of the patients who had attacks went to the emergency department.
For asthmatics who needed prednisone, the average dose was 480 mg (P = .284) – “a pretty substantial number,” in Dr. Ishmael’s words. He noted that a large portion of the study patients were obese, with a mean body mass index of 33 kg/m2. Other comorbidities prevalent in the study population were hypertension and type 2 diabetes. “Prednisone is something that could worsen all of those conditions, so it’s not a trivial issue,” he said.
The study, however, didn’t evaluate costs of the interventions during the delay period vs. the costs of the medications themselves. Of the 80 prescriptions Dr. Ishmael and coauthors submitted, only one was rejected, that person being a smoker, he said. “I understand these are expensive medicines, but it’s counterproductive to delay them because in the long run the insurance company ends up paying for the hospitalization and the drug rather than just the drug,” he said.
Timothy Craig, DO, of Penn State Health Allergy, Asthma, and Immunology and professor of medicine and pediatrics at Penn State College of Medicine, both in Hershey, said he was surprised at the brevity of the delays reported in Dr. Ishmael’s study. “They do much better than we do with preauthorization,” he said, noting that, in his experience, these approvals take much longer. He added that his own research has found faulty insurance plan algorithms are at the heart of these delays. “We need more studies to clarify how much this is interfering with patient care and how much risk they’re putting patients in,” he said.

The COVID-19 pandemic poses a double-edged sword for physicians managing patients with severe asthma, Dr. Craig noted. “Their asthma care is important, especially if they do test for COVID-19,” he said. On the other hand, doctors and nurses attending to COVID-19 patients will have less time to haggle with payers to expedite coverage for biologics for their severe asthma patients, he said. “I hope the flexibility is there, especially at this time to allow people to get on the biologics and stay on them,” he said.
Dr. Ishmael said these findings have serious implications because biologics are getting prescribed ever more frequently for asthma and hives. Steps his practice has taken to streamline the process include following the payer’s approval guidelines as closely as possible. This sometimes can mean making sure a patient with severe asthma has been maximized on controller medications before submitting the biologic prescription, he said. Another step is to use drug company programs to remove barriers to coverage.
Nonetheless, the approval process can be daunting even when taking those steps, he said. “Those guidelines that constitute approval may vary a lot from one insurer to another; and sometimes those guidelines are different from the criteria that studies may have used when these drugs were being evaluated in clinical trials,” he said. It would be helpful, he said, if payers used the National Heart, Lung and Blood institute and the Global Initiative for Asthma guidelines for biologics.
One of the goals of the researchers is to present their findings to payers, “to let them know, here are some of the hang-ups and the real risks associated with delaying these medications,” Dr. Ishmael said.
“When specialists especially prescribe these therapies, there’s usually a valid reason,” he said. “We really need to do something about the current process – if there are ways to make it more transparent, faster.”
Dr. Ishmael has no relevant financial relationships to disclose.
SOURCE: Ishmael F et al. AAAAI 2020. Session 3609, Presentation 558.
Insurance and specialty pharmacy delays in authorizing new biologic prescriptions for severe allergies leave waiting patients at risk of asthma attacks, hospitalizations, emergency department visits and prednisone shots and their known side effects, according to a single-center study that was to have been presented at the annual meeting of the American Academy of Allergy, Asthma and Immunology.
The AAAAI canceled their annual meeting and provided abstracts and access to presenters for press coverage.
The study of 80 patients in State College, Pa., found that they waited an average of 44 days from when their doctor submitted the preauthorization request to the insurance company until the practice received the shipment for dispensing to the patient, investigator Faoud Ishmael, MD, PhD, of Mount Nittany Medical Group said in an interview. “The implication here is that these are really the most severe patients who, you would argue, need their medications the quickest, and it’s taking longer to get them than it would an inhaler,” Dr. Ishmael said.
The study focused on patients with severe asthma (n = 60) or urticarial (n = 20) who received a new prescription of monoclonal antibody therapy from March 2014 to August 2019. For asthma treatments, the average time was 45.8 days; for urticaria, 40.6 days (P = .573), Dr. Ishmael said. The researchers divided the total amount of time into two components: insurance plan review and approval (P = .654, and specialty pharmacy review and dispensing of the medicine, each of which averaged 22.8 days (P = .384), he said.
He also noted wide disparity in the range of approval times. “The shortest approval time was 1 day, and the longest 97 days,” Dr. Ishmael said. “It’s interesting that we had this really broad spread.”
What’s more, the study found no trend for the delays among insurers and specialty pharmacies, Dr. Ishmael added. “When these prescriptions get submitted, it’s like a black box,” he said. “It really seems arbitrary why some of them take so long and some of them don’t.” The findings were independent of type of coverage, whether commercial or government, or even specific insurance plans. “It’s more the process that is flawed rather than one insurance company being the bad guy,” he said.
The study also looked at what happened to patients while they were waiting for their prescriptions to be delivered. “What we found is that over half of asthmatics had an exacerbation – 51% had at least one asthma attack where they needed prednisone,” Dr. Ishmael said (P = .0015), “and we had three patients admitted to the hospital over that time frame when they were waiting for the drugs.” One of those patients had been admitted twice, making four total hospitalizations. Preliminary data analysis showed that about 40% of the patients who had attacks went to the emergency department.
For asthmatics who needed prednisone, the average dose was 480 mg (P = .284) – “a pretty substantial number,” in Dr. Ishmael’s words. He noted that a large portion of the study patients were obese, with a mean body mass index of 33 kg/m2. Other comorbidities prevalent in the study population were hypertension and type 2 diabetes. “Prednisone is something that could worsen all of those conditions, so it’s not a trivial issue,” he said.
The study, however, didn’t evaluate costs of the interventions during the delay period vs. the costs of the medications themselves. Of the 80 prescriptions Dr. Ishmael and coauthors submitted, only one was rejected, that person being a smoker, he said. “I understand these are expensive medicines, but it’s counterproductive to delay them because in the long run the insurance company ends up paying for the hospitalization and the drug rather than just the drug,” he said.
Timothy Craig, DO, of Penn State Health Allergy, Asthma, and Immunology and professor of medicine and pediatrics at Penn State College of Medicine, both in Hershey, said he was surprised at the brevity of the delays reported in Dr. Ishmael’s study. “They do much better than we do with preauthorization,” he said, noting that, in his experience, these approvals take much longer. He added that his own research has found faulty insurance plan algorithms are at the heart of these delays. “We need more studies to clarify how much this is interfering with patient care and how much risk they’re putting patients in,” he said.
The COVID-19 pandemic poses a double-edged sword for physicians managing patients with severe asthma, Dr. Craig noted. “Their asthma care is important, especially if they do test for COVID-19,” he said. On the other hand, doctors and nurses attending to COVID-19 patients will have less time to haggle with payers to expedite coverage for biologics for their severe asthma patients, he said. “I hope the flexibility is there, especially at this time to allow people to get on the biologics and stay on them,” he said.
Dr. Ishmael said these findings have serious implications because biologics are getting prescribed ever more frequently for asthma and hives. Steps his practice has taken to streamline the process include following the payer’s approval guidelines as closely as possible. This sometimes can mean making sure a patient with severe asthma has been maximized on controller medications before submitting the biologic prescription, he said. Another step is to use drug company programs to remove barriers to coverage.
Nonetheless, the approval process can be daunting even when taking those steps, he said. “Those guidelines that constitute approval may vary a lot from one insurer to another; and sometimes those guidelines are different from the criteria that studies may have used when these drugs were being evaluated in clinical trials,” he said. It would be helpful, he said, if payers used the National Heart, Lung and Blood institute and the Global Initiative for Asthma guidelines for biologics.
One of the goals of the researchers is to present their findings to payers, “to let them know, here are some of the hang-ups and the real risks associated with delaying these medications,” Dr. Ishmael said.
“When specialists especially prescribe these therapies, there’s usually a valid reason,” he said. “We really need to do something about the current process – if there are ways to make it more transparent, faster.”
Dr. Ishmael has no relevant financial relationships to disclose.
SOURCE: Ishmael F et al. AAAAI 2020. Session 3609, Presentation 558.
Insurance and specialty pharmacy delays in authorizing new biologic prescriptions for severe allergies leave waiting patients at risk of asthma attacks, hospitalizations, emergency department visits and prednisone shots and their known side effects, according to a single-center study that was to have been presented at the annual meeting of the American Academy of Allergy, Asthma and Immunology.
The AAAAI canceled their annual meeting and provided abstracts and access to presenters for press coverage.
The study of 80 patients in State College, Pa., found that they waited an average of 44 days from when their doctor submitted the preauthorization request to the insurance company until the practice received the shipment for dispensing to the patient, investigator Faoud Ishmael, MD, PhD, of Mount Nittany Medical Group said in an interview. “The implication here is that these are really the most severe patients who, you would argue, need their medications the quickest, and it’s taking longer to get them than it would an inhaler,” Dr. Ishmael said.
The study focused on patients with severe asthma (n = 60) or urticarial (n = 20) who received a new prescription of monoclonal antibody therapy from March 2014 to August 2019. For asthma treatments, the average time was 45.8 days; for urticaria, 40.6 days (P = .573), Dr. Ishmael said. The researchers divided the total amount of time into two components: insurance plan review and approval (P = .654, and specialty pharmacy review and dispensing of the medicine, each of which averaged 22.8 days (P = .384), he said.
He also noted wide disparity in the range of approval times. “The shortest approval time was 1 day, and the longest 97 days,” Dr. Ishmael said. “It’s interesting that we had this really broad spread.”
What’s more, the study found no trend for the delays among insurers and specialty pharmacies, Dr. Ishmael added. “When these prescriptions get submitted, it’s like a black box,” he said. “It really seems arbitrary why some of them take so long and some of them don’t.” The findings were independent of type of coverage, whether commercial or government, or even specific insurance plans. “It’s more the process that is flawed rather than one insurance company being the bad guy,” he said.
The study also looked at what happened to patients while they were waiting for their prescriptions to be delivered. “What we found is that over half of asthmatics had an exacerbation – 51% had at least one asthma attack where they needed prednisone,” Dr. Ishmael said (P = .0015), “and we had three patients admitted to the hospital over that time frame when they were waiting for the drugs.” One of those patients had been admitted twice, making four total hospitalizations. Preliminary data analysis showed that about 40% of the patients who had attacks went to the emergency department.
For asthmatics who needed prednisone, the average dose was 480 mg (P = .284) – “a pretty substantial number,” in Dr. Ishmael’s words. He noted that a large portion of the study patients were obese, with a mean body mass index of 33 kg/m2. Other comorbidities prevalent in the study population were hypertension and type 2 diabetes. “Prednisone is something that could worsen all of those conditions, so it’s not a trivial issue,” he said.
The study, however, didn’t evaluate costs of the interventions during the delay period vs. the costs of the medications themselves. Of the 80 prescriptions Dr. Ishmael and coauthors submitted, only one was rejected, that person being a smoker, he said. “I understand these are expensive medicines, but it’s counterproductive to delay them because in the long run the insurance company ends up paying for the hospitalization and the drug rather than just the drug,” he said.
Timothy Craig, DO, of Penn State Health Allergy, Asthma, and Immunology and professor of medicine and pediatrics at Penn State College of Medicine, both in Hershey, said he was surprised at the brevity of the delays reported in Dr. Ishmael’s study. “They do much better than we do with preauthorization,” he said, noting that, in his experience, these approvals take much longer. He added that his own research has found faulty insurance plan algorithms are at the heart of these delays. “We need more studies to clarify how much this is interfering with patient care and how much risk they’re putting patients in,” he said.
The COVID-19 pandemic poses a double-edged sword for physicians managing patients with severe asthma, Dr. Craig noted. “Their asthma care is important, especially if they do test for COVID-19,” he said. On the other hand, doctors and nurses attending to COVID-19 patients will have less time to haggle with payers to expedite coverage for biologics for their severe asthma patients, he said. “I hope the flexibility is there, especially at this time to allow people to get on the biologics and stay on them,” he said.
Dr. Ishmael said these findings have serious implications because biologics are getting prescribed ever more frequently for asthma and hives. Steps his practice has taken to streamline the process include following the payer’s approval guidelines as closely as possible. This sometimes can mean making sure a patient with severe asthma has been maximized on controller medications before submitting the biologic prescription, he said. Another step is to use drug company programs to remove barriers to coverage.
Nonetheless, the approval process can be daunting even when taking those steps, he said. “Those guidelines that constitute approval may vary a lot from one insurer to another; and sometimes those guidelines are different from the criteria that studies may have used when these drugs were being evaluated in clinical trials,” he said. It would be helpful, he said, if payers used the National Heart, Lung and Blood institute and the Global Initiative for Asthma guidelines for biologics.
One of the goals of the researchers is to present their findings to payers, “to let them know, here are some of the hang-ups and the real risks associated with delaying these medications,” Dr. Ishmael said.
“When specialists especially prescribe these therapies, there’s usually a valid reason,” he said. “We really need to do something about the current process – if there are ways to make it more transparent, faster.”
Dr. Ishmael has no relevant financial relationships to disclose.
SOURCE: Ishmael F et al. AAAAI 2020. Session 3609, Presentation 558.
REPORTING FROM AAAAI

How long is it safe to delay gynecologic cancer surgery?
As I write this column, there are more than 25,000 current cases of COVID-19 in the United States with an expected exponential rise in these numbers. Hospitals are issuing directives to cancel or postpone “elective” surgery to preserve the finite essential personal protective equipment (PPE), encourage social distancing, prevent exposure of at-risk patients within the hospital, and ensure bed and ventilator capacity for the impending surge in COVID-19 patients.

Many health systems have defined which surgeries they consider permissible, typically by using time parameters such as would not cause patient harm if not performed within 4 weeks, or 7 days, or 24 hours. This leaves surgeons in the unfamiliar position of rationing health care, a role with which, over the coming months, we may have to become increasingly comfortable. This is an enormous responsibility, the shift of resources between one population in need and another, and decisions should be based on data, not bias or hunch. We know that untreated cancer is life threatening, but there is a difference between untreated and delayed. What is a safe time to wait for gynecologic cancer surgery after diagnosis without negatively affecting survival from that cancer?
As I looked through my own upcoming surgical schedule, I sought guidance from the American College of Surgeons’ website, updated on March 17, 2020. In this site they tabulate an “Elective Surgery Acuity Scale” in which “most cancers” fit into tier 3a, which corresponds to high acuity surgery – “do not postpone.” This definition is fairly generalized and blunt; it does not account for the differences in cancers and occasional voluntary needs to postpone a patient’s cancer surgery for health optimization. There are limited data that measure the impact of surgical wait times on survival from gynecologic cancer. Most of this research is observational, and therefore, is influenced by confounders causing delay in surgery (e.g., comorbid conditions or socioeconomic factors that limit access to care). However, the current enforced delays are involuntary; driven by the system, not the patient; and access is universally restricted.
Endometrial cancer
Most data regarding outcomes and gynecologic cancer delay come from endometrial cancer. In 2016, Shalowitz et al. evaluated 182,000 endometrial cancer cases documented within the National Cancer Database (NCDB), which captures approximately 70% of cancer surgeries in the United States.1 They separated these patients into groups of low-grade (grade 1 and 2 endometrioid) and high-grade (grade 3 endometrioid and nonendometrioid) cancers, and evaluated the groups for their overall survival, stratified by the time period between diagnosis and surgery. Interestingly, those whose surgery was performed under 2 weeks from diagnosis had worse perioperative mortality and long-term survival. This seems to be a function of lack of medical optimization; low-volume, nonspecialized centers having less wait time; and the presentation of more advanced and symptomatic disease demanding a more urgent surgery. After those initial 2 weeks of worse outcomes, there was a period of stable outcomes and safety in waiting that extended up to 8 weeks for patients with low-grade cancers and up to 18 weeks for patients with high-grade cancers.
It may be counterintuitive to think that surgical delay affects patients with high-grade endometrial cancers less. These are more aggressive cancers, and there is patient and provider concern for metastatic spread with time elapsed. But an expedited surgery does not appear to be necessary for this group. The Shalowitz study demonstrated no risk for upstaging with surgical delay, meaning that advanced stage was not more likely to be identified in patients whose surgery was delayed, compared with those performed earlier. This observation suggests that the survival from high-grade endometrial cancers is largely determined by factors that cannot be controlled by the surgeon such as the stage at diagnosis, occult spread, and decreased responsiveness of the tumor to adjuvant therapy. In other words, fast-tracking these patients to surgery has limited influence on the outcomes for high-grade endometrial cancers.
For low-grade cancers, adverse outcomes were seen with a surgical delay of more than 8 weeks. But this may not have been caused by progression of disease (low-grade cancers also were not upstaged with delays), but rather may reflect that, in normal times, elective delays of more than 8 weeks are a function of necessary complex medical optimization of comorbidities (such as obesity-related disease). The survival that is measured by NCDB is not disease specific, and patients with comorbidities will be more likely to have impaired overall survival.
A systematic review of all papers that looked at endometrial cancer outcomes associated with surgical delay determined that it is reasonable to delay surgery for up to 8 weeks.2
Ovarian cancer
The data for ovarian cancer surgery is more limited. Most literature discusses the impact of delay in the time between surgery and the receipt of adjuvant chemotherapy, but there are limited data exploring how a delay in primary debulking negatively affects patients. This is perhaps because advanced ovarian cancer surgery rarely is delayed because of symptoms and apparent advanced stage at diagnosis. When a patient’s surgery does need to be voluntarily delayed, for example for medical optimization, there is the option of neoadjuvant chemotherapy (NACT) in which surgery is performed after three or more cycles of chemotherapy. NACT has been shown in multiple studies to have noninferior cancer outcomes, compared with primary debulking surgery.3,4
Perhaps in this current environment in which access to operating rooms and supplies is rationed, we should consider offering more, or all, patients NACT? Hospital stays after primary cytoreductive surgeries are typically 3-7 days in length, and these patients are at a higher risk, compared with other gynecologic cancer surgeries, of ICU admission and blood transfusions, both limited resources in this current environment. The disadvantage of this approach is that, while chemotherapy can keep patients out of the hospital so that they can practice social distancing, this particular therapy adds to the immunocompromised population. However, even patients who undergo primary surgical cytoreductive surgery will need to rapidly transition to immunosuppressive cytotoxic therapy; therefore it is unlikely that this can be avoided entirely during this time.
Lower genital tract cancers

Surgery for patients with lower genital tract cancers – such as cervical and vulvar cancer – also can probably be safely delayed for a 4-week period, and possibly longer. A Canadian retrospective study looked collectively at cervical, vaginal, and vulvar cancers evaluating for disease progression associated with delay to surgery, using 28 days as a benchmark for delayed surgery.5 They found no significant increased progression associated with surgical delay greater than 28 days. This study evaluated progression of cancer and did not measure cancer survival, although it is unlikely we would see impaired survival without a significant increase in disease progression.
We also can look to outcomes from delayed radical hysterectomy for stage I cervical cancer in pregnancy to provided us with some data. A retrospective cohort study observed no difference in survival when 28 women with early-stage cervical cancer who were diagnosed in pregnancy (average wait time 20 weeks from diagnosis to treatment) were compared with the outcomes of 52 matched nonpregnant control patients (average wait time 8 weeks). Their survival was 89% versus 94% respectively (P = .08).6
Summary
Synthesizing this data, it appears that, in an environment of competing needs and resources, it is reasonable and safe to delay surgery for patients with gynecologic cancers for 4-6 weeks and potentially longer. This includes patients with high-grade endometrial cancers. Clearly, these decisions should be individualized to patients and different health systems. For example, a patient who presents with a cancer-associated life-threatening bowel obstruction or hemorrhage may need an immediate intervention, and communities minimally affected by the coronavirus pandemic may have more allowances for surgery. With respect to patient anxiety, most patients with cancer are keen to have surgery promptly, and breaking the news to them that their surgery may be delayed because of institutional and public health needs will be difficult. However, the data support that this is likely safe.
Dr. Rossi is assistant professor in the division of gynecologic oncology at the University of North Carolina at Chapel Hill. She had no relevant financial disclosures. Email Dr. Rossi at obnews@mdedge.com.
References
1. Am J Obstet Gynecol 2017;216(3):268 e1-68 e18.
2. Eur J Obstet Gynecol Reprod Biol 2020;246:1-6. doi: 10.1016/j.ejogrb.2020.01.004.
3. N Engl J Med 2010;363(10):943-53.
4. Lancet 2015;386(9990):249-57.
5. J Obstet Gynaecol Can 2015;37(4):338-44.
6. Am J Obstet Gynecol 2017;216(3):276 e1-76 e6. doi: 10.1016/j.ajog.2016.10.034.
As I write this column, there are more than 25,000 current cases of COVID-19 in the United States with an expected exponential rise in these numbers. Hospitals are issuing directives to cancel or postpone “elective” surgery to preserve the finite essential personal protective equipment (PPE), encourage social distancing, prevent exposure of at-risk patients within the hospital, and ensure bed and ventilator capacity for the impending surge in COVID-19 patients.
Many health systems have defined which surgeries they consider permissible, typically by using time parameters such as would not cause patient harm if not performed within 4 weeks, or 7 days, or 24 hours. This leaves surgeons in the unfamiliar position of rationing health care, a role with which, over the coming months, we may have to become increasingly comfortable. This is an enormous responsibility, the shift of resources between one population in need and another, and decisions should be based on data, not bias or hunch. We know that untreated cancer is life threatening, but there is a difference between untreated and delayed. What is a safe time to wait for gynecologic cancer surgery after diagnosis without negatively affecting survival from that cancer?
As I looked through my own upcoming surgical schedule, I sought guidance from the American College of Surgeons’ website, updated on March 17, 2020. In this site they tabulate an “Elective Surgery Acuity Scale” in which “most cancers” fit into tier 3a, which corresponds to high acuity surgery – “do not postpone.” This definition is fairly generalized and blunt; it does not account for the differences in cancers and occasional voluntary needs to postpone a patient’s cancer surgery for health optimization. There are limited data that measure the impact of surgical wait times on survival from gynecologic cancer. Most of this research is observational, and therefore, is influenced by confounders causing delay in surgery (e.g., comorbid conditions or socioeconomic factors that limit access to care). However, the current enforced delays are involuntary; driven by the system, not the patient; and access is universally restricted.
Endometrial cancer
Most data regarding outcomes and gynecologic cancer delay come from endometrial cancer. In 2016, Shalowitz et al. evaluated 182,000 endometrial cancer cases documented within the National Cancer Database (NCDB), which captures approximately 70% of cancer surgeries in the United States.1 They separated these patients into groups of low-grade (grade 1 and 2 endometrioid) and high-grade (grade 3 endometrioid and nonendometrioid) cancers, and evaluated the groups for their overall survival, stratified by the time period between diagnosis and surgery. Interestingly, those whose surgery was performed under 2 weeks from diagnosis had worse perioperative mortality and long-term survival. This seems to be a function of lack of medical optimization; low-volume, nonspecialized centers having less wait time; and the presentation of more advanced and symptomatic disease demanding a more urgent surgery. After those initial 2 weeks of worse outcomes, there was a period of stable outcomes and safety in waiting that extended up to 8 weeks for patients with low-grade cancers and up to 18 weeks for patients with high-grade cancers.
It may be counterintuitive to think that surgical delay affects patients with high-grade endometrial cancers less. These are more aggressive cancers, and there is patient and provider concern for metastatic spread with time elapsed. But an expedited surgery does not appear to be necessary for this group. The Shalowitz study demonstrated no risk for upstaging with surgical delay, meaning that advanced stage was not more likely to be identified in patients whose surgery was delayed, compared with those performed earlier. This observation suggests that the survival from high-grade endometrial cancers is largely determined by factors that cannot be controlled by the surgeon such as the stage at diagnosis, occult spread, and decreased responsiveness of the tumor to adjuvant therapy. In other words, fast-tracking these patients to surgery has limited influence on the outcomes for high-grade endometrial cancers.
For low-grade cancers, adverse outcomes were seen with a surgical delay of more than 8 weeks. But this may not have been caused by progression of disease (low-grade cancers also were not upstaged with delays), but rather may reflect that, in normal times, elective delays of more than 8 weeks are a function of necessary complex medical optimization of comorbidities (such as obesity-related disease). The survival that is measured by NCDB is not disease specific, and patients with comorbidities will be more likely to have impaired overall survival.
A systematic review of all papers that looked at endometrial cancer outcomes associated with surgical delay determined that it is reasonable to delay surgery for up to 8 weeks.2
Ovarian cancer
The data for ovarian cancer surgery is more limited. Most literature discusses the impact of delay in the time between surgery and the receipt of adjuvant chemotherapy, but there are limited data exploring how a delay in primary debulking negatively affects patients. This is perhaps because advanced ovarian cancer surgery rarely is delayed because of symptoms and apparent advanced stage at diagnosis. When a patient’s surgery does need to be voluntarily delayed, for example for medical optimization, there is the option of neoadjuvant chemotherapy (NACT) in which surgery is performed after three or more cycles of chemotherapy. NACT has been shown in multiple studies to have noninferior cancer outcomes, compared with primary debulking surgery.3,4
Perhaps in this current environment in which access to operating rooms and supplies is rationed, we should consider offering more, or all, patients NACT? Hospital stays after primary cytoreductive surgeries are typically 3-7 days in length, and these patients are at a higher risk, compared with other gynecologic cancer surgeries, of ICU admission and blood transfusions, both limited resources in this current environment. The disadvantage of this approach is that, while chemotherapy can keep patients out of the hospital so that they can practice social distancing, this particular therapy adds to the immunocompromised population. However, even patients who undergo primary surgical cytoreductive surgery will need to rapidly transition to immunosuppressive cytotoxic therapy; therefore it is unlikely that this can be avoided entirely during this time.
Lower genital tract cancers
Surgery for patients with lower genital tract cancers – such as cervical and vulvar cancer – also can probably be safely delayed for a 4-week period, and possibly longer. A Canadian retrospective study looked collectively at cervical, vaginal, and vulvar cancers evaluating for disease progression associated with delay to surgery, using 28 days as a benchmark for delayed surgery.5 They found no significant increased progression associated with surgical delay greater than 28 days. This study evaluated progression of cancer and did not measure cancer survival, although it is unlikely we would see impaired survival without a significant increase in disease progression.
We also can look to outcomes from delayed radical hysterectomy for stage I cervical cancer in pregnancy to provided us with some data. A retrospective cohort study observed no difference in survival when 28 women with early-stage cervical cancer who were diagnosed in pregnancy (average wait time 20 weeks from diagnosis to treatment) were compared with the outcomes of 52 matched nonpregnant control patients (average wait time 8 weeks). Their survival was 89% versus 94% respectively (P = .08).6
Summary
Synthesizing this data, it appears that, in an environment of competing needs and resources, it is reasonable and safe to delay surgery for patients with gynecologic cancers for 4-6 weeks and potentially longer. This includes patients with high-grade endometrial cancers. Clearly, these decisions should be individualized to patients and different health systems. For example, a patient who presents with a cancer-associated life-threatening bowel obstruction or hemorrhage may need an immediate intervention, and communities minimally affected by the coronavirus pandemic may have more allowances for surgery. With respect to patient anxiety, most patients with cancer are keen to have surgery promptly, and breaking the news to them that their surgery may be delayed because of institutional and public health needs will be difficult. However, the data support that this is likely safe.
Dr. Rossi is assistant professor in the division of gynecologic oncology at the University of North Carolina at Chapel Hill. She had no relevant financial disclosures. Email Dr. Rossi at obnews@mdedge.com.
References
1. Am J Obstet Gynecol 2017;216(3):268 e1-68 e18.
2. Eur J Obstet Gynecol Reprod Biol 2020;246:1-6. doi: 10.1016/j.ejogrb.2020.01.004.
3. N Engl J Med 2010;363(10):943-53.
4. Lancet 2015;386(9990):249-57.
5. J Obstet Gynaecol Can 2015;37(4):338-44.
6. Am J Obstet Gynecol 2017;216(3):276 e1-76 e6. doi: 10.1016/j.ajog.2016.10.034.
As I write this column, there are more than 25,000 current cases of COVID-19 in the United States with an expected exponential rise in these numbers. Hospitals are issuing directives to cancel or postpone “elective” surgery to preserve the finite essential personal protective equipment (PPE), encourage social distancing, prevent exposure of at-risk patients within the hospital, and ensure bed and ventilator capacity for the impending surge in COVID-19 patients.
Many health systems have defined which surgeries they consider permissible, typically by using time parameters such as would not cause patient harm if not performed within 4 weeks, or 7 days, or 24 hours. This leaves surgeons in the unfamiliar position of rationing health care, a role with which, over the coming months, we may have to become increasingly comfortable. This is an enormous responsibility, the shift of resources between one population in need and another, and decisions should be based on data, not bias or hunch. We know that untreated cancer is life threatening, but there is a difference between untreated and delayed. What is a safe time to wait for gynecologic cancer surgery after diagnosis without negatively affecting survival from that cancer?
As I looked through my own upcoming surgical schedule, I sought guidance from the American College of Surgeons’ website, updated on March 17, 2020. In this site they tabulate an “Elective Surgery Acuity Scale” in which “most cancers” fit into tier 3a, which corresponds to high acuity surgery – “do not postpone.” This definition is fairly generalized and blunt; it does not account for the differences in cancers and occasional voluntary needs to postpone a patient’s cancer surgery for health optimization. There are limited data that measure the impact of surgical wait times on survival from gynecologic cancer. Most of this research is observational, and therefore, is influenced by confounders causing delay in surgery (e.g., comorbid conditions or socioeconomic factors that limit access to care). However, the current enforced delays are involuntary; driven by the system, not the patient; and access is universally restricted.
Endometrial cancer
Most data regarding outcomes and gynecologic cancer delay come from endometrial cancer. In 2016, Shalowitz et al. evaluated 182,000 endometrial cancer cases documented within the National Cancer Database (NCDB), which captures approximately 70% of cancer surgeries in the United States.1 They separated these patients into groups of low-grade (grade 1 and 2 endometrioid) and high-grade (grade 3 endometrioid and nonendometrioid) cancers, and evaluated the groups for their overall survival, stratified by the time period between diagnosis and surgery. Interestingly, those whose surgery was performed under 2 weeks from diagnosis had worse perioperative mortality and long-term survival. This seems to be a function of lack of medical optimization; low-volume, nonspecialized centers having less wait time; and the presentation of more advanced and symptomatic disease demanding a more urgent surgery. After those initial 2 weeks of worse outcomes, there was a period of stable outcomes and safety in waiting that extended up to 8 weeks for patients with low-grade cancers and up to 18 weeks for patients with high-grade cancers.
It may be counterintuitive to think that surgical delay affects patients with high-grade endometrial cancers less. These are more aggressive cancers, and there is patient and provider concern for metastatic spread with time elapsed. But an expedited surgery does not appear to be necessary for this group. The Shalowitz study demonstrated no risk for upstaging with surgical delay, meaning that advanced stage was not more likely to be identified in patients whose surgery was delayed, compared with those performed earlier. This observation suggests that the survival from high-grade endometrial cancers is largely determined by factors that cannot be controlled by the surgeon such as the stage at diagnosis, occult spread, and decreased responsiveness of the tumor to adjuvant therapy. In other words, fast-tracking these patients to surgery has limited influence on the outcomes for high-grade endometrial cancers.
For low-grade cancers, adverse outcomes were seen with a surgical delay of more than 8 weeks. But this may not have been caused by progression of disease (low-grade cancers also were not upstaged with delays), but rather may reflect that, in normal times, elective delays of more than 8 weeks are a function of necessary complex medical optimization of comorbidities (such as obesity-related disease). The survival that is measured by NCDB is not disease specific, and patients with comorbidities will be more likely to have impaired overall survival.
A systematic review of all papers that looked at endometrial cancer outcomes associated with surgical delay determined that it is reasonable to delay surgery for up to 8 weeks.2
Ovarian cancer
The data for ovarian cancer surgery is more limited. Most literature discusses the impact of delay in the time between surgery and the receipt of adjuvant chemotherapy, but there are limited data exploring how a delay in primary debulking negatively affects patients. This is perhaps because advanced ovarian cancer surgery rarely is delayed because of symptoms and apparent advanced stage at diagnosis. When a patient’s surgery does need to be voluntarily delayed, for example for medical optimization, there is the option of neoadjuvant chemotherapy (NACT) in which surgery is performed after three or more cycles of chemotherapy. NACT has been shown in multiple studies to have noninferior cancer outcomes, compared with primary debulking surgery.3,4
Perhaps in this current environment in which access to operating rooms and supplies is rationed, we should consider offering more, or all, patients NACT? Hospital stays after primary cytoreductive surgeries are typically 3-7 days in length, and these patients are at a higher risk, compared with other gynecologic cancer surgeries, of ICU admission and blood transfusions, both limited resources in this current environment. The disadvantage of this approach is that, while chemotherapy can keep patients out of the hospital so that they can practice social distancing, this particular therapy adds to the immunocompromised population. However, even patients who undergo primary surgical cytoreductive surgery will need to rapidly transition to immunosuppressive cytotoxic therapy; therefore it is unlikely that this can be avoided entirely during this time.
Lower genital tract cancers
Surgery for patients with lower genital tract cancers – such as cervical and vulvar cancer – also can probably be safely delayed for a 4-week period, and possibly longer. A Canadian retrospective study looked collectively at cervical, vaginal, and vulvar cancers evaluating for disease progression associated with delay to surgery, using 28 days as a benchmark for delayed surgery.5 They found no significant increased progression associated with surgical delay greater than 28 days. This study evaluated progression of cancer and did not measure cancer survival, although it is unlikely we would see impaired survival without a significant increase in disease progression.
We also can look to outcomes from delayed radical hysterectomy for stage I cervical cancer in pregnancy to provided us with some data. A retrospective cohort study observed no difference in survival when 28 women with early-stage cervical cancer who were diagnosed in pregnancy (average wait time 20 weeks from diagnosis to treatment) were compared with the outcomes of 52 matched nonpregnant control patients (average wait time 8 weeks). Their survival was 89% versus 94% respectively (P = .08).6
Summary
Synthesizing this data, it appears that, in an environment of competing needs and resources, it is reasonable and safe to delay surgery for patients with gynecologic cancers for 4-6 weeks and potentially longer. This includes patients with high-grade endometrial cancers. Clearly, these decisions should be individualized to patients and different health systems. For example, a patient who presents with a cancer-associated life-threatening bowel obstruction or hemorrhage may need an immediate intervention, and communities minimally affected by the coronavirus pandemic may have more allowances for surgery. With respect to patient anxiety, most patients with cancer are keen to have surgery promptly, and breaking the news to them that their surgery may be delayed because of institutional and public health needs will be difficult. However, the data support that this is likely safe.
Dr. Rossi is assistant professor in the division of gynecologic oncology at the University of North Carolina at Chapel Hill. She had no relevant financial disclosures. Email Dr. Rossi at obnews@mdedge.com.
References
1. Am J Obstet Gynecol 2017;216(3):268 e1-68 e18.
2. Eur J Obstet Gynecol Reprod Biol 2020;246:1-6. doi: 10.1016/j.ejogrb.2020.01.004.
3. N Engl J Med 2010;363(10):943-53.
4. Lancet 2015;386(9990):249-57.
5. J Obstet Gynaecol Can 2015;37(4):338-44.
6. Am J Obstet Gynecol 2017;216(3):276 e1-76 e6. doi: 10.1016/j.ajog.2016.10.034.