User login
Single Botox treatment cuts AF for 3 years
BOSTON – A single set of four injections with botulinum toxin into neuron-containing cardiac fat pads of patients during open-chest cardiac artery bypass surgery led to a long-term cut in the cumulative incidence of atrial tachyarrhythmias during 3-year follow-up in a pilot, sham-controlled study with 60 patients at two Russian centers.
“Because the favorable reduction of atrial fibrillation [AF] outlasted the anticipated botulinum toxin effects on autonomic nervous system activity, this may represent a form of autonomic reverse remodeling” triggered by just one injection of the paralyzing toxin at each of four intracardiac fat pads, Alexander B. Romanov, MD, said at the annual scientific sessions of the Heart Rhythm Society. Botulinum toxin (BT) blocks neuronal release of acetylcholine, thereby interfering with cholinergic neurotransmission and producing hypothesized neurologic remodeling, explained Dr. Romanov, a researcher at the Meshalkin National Medical Research Center in Novosibirsk, Russia.
The 3-year results also showed statistically significant differences or trends favoring BT injections for several other clinical outcomes. Two deaths and two strokes occurred, all among the control patients. Two patients required a total of three hospitalizations during follow-up in the BT-treated group, compared with 10 patients hospitalized a total of 21 times in the control arm. Clinicians prescribed antiarrhythmic drugs to six of the BT-treated patients and to 15 of the controls.
All patients received an implanted heart rhythm monitor during their bypass surgery, and the researchers measured AF burden – the percentage of time during which AF occurred. After 12 months, 24 months, and 36 months, the AF burden averaged 0.2%, 1.6%, and 1.2%, respectively, in the BT-treated patients and 1.9%, 9.5%, and 6.9% in the sham-control patients.
“We don’t know why this works, but it’s a fascinating new approach that is worthy of further study,” commented Kalyanam Shivkumar, MD, professor and director of the Cardiac Arrhythmia Center at the University of California, Los Angeles, and designated discussant for the report.
“This is an extremely exciting study, but it remains inconclusive because how it works is not fully understood,” commented Andrew D. Krahn, MD, professor and chief of cardiology at the University of British Columbia in Vancouver.
REPORTING FROM HEART RHYTHM 2018
Key clinical point:
Major finding: During 3-year follow-up, atrial tachyarrhythmias occurred in 23% of botulinum toxin-treated patients and in 50% of sham controls.
Study details: Randomized, sham-controlled study with 60 patients at two Russian centers.
Disclosures: The study received no commercial funding. Dr. Romanov, Dr. Shivkumar, and Dr. Krahn had no relevant disclosures.
Source: Romanov A et al. Heart Rhythm 2018, Abstract B-LBCT02-01.
Vaccine-related febrile seizures have zero developmental impact
MALMO, SWEDEN – Children who experience a febrile seizure in conjunction with a vaccination have developmental outcomes comparable with those of children who have non–vaccine-related febrile seizures and healthy controls who’ve never had a febrile seizure, according to the first prospective case-control cohort study to examine the issue.
This finding has important implications for clinical practice, Lucy Deng, MD, observed at the annual meeting of the European Society for Paediatric Infectious Diseases.
“Febrile seizures associated with a vaccine can decrease parent and provider confidence in vaccine safety,” the pediatrician noted. Based upon her study results, however, physicians now can offer a truly evidence-based message of reassurance.
“If you have a child with a vaccine-related febrile seizure, you can give the same advice to those parents as for anyone else who’s had a febrile seizure, in that there is no difference in the clinical outcomes of vaccine-proximate and non–vaccine-proximate febrile seizures. Vaccine-proximate febrile seizures are usually brief, they don’t require any antiepileptic drugs, their length of stay is usually less than a day, and developmentally at 12-24 months post initial febrile seizure, they’re exactly the same as children who’ve never had a seizure before or who’ve had a non-vaccine-related febrile seizure,” said Dr. Deng of the National Centre for Immunisation Research and Surveillance in Sydney.
The impetus for her study was straightforward: “We all know that most children with a history of febrile seizures have normal behavior, intelligence, and academic achievement and do not later develop epilepsy. What we didn’t know before is if all of these facts apply to vaccine-proximate febrile seizures,” she explained.
The clinical severity analysis portion of this prospective case-control cohort study included 1,085 children with febrile seizures seen at five Australian children’s hospitals. Sixty-eight of them had vaccine-proximate febrile seizures, for a 6.6% rate. The febrile seizures in the other 1,027 children didn’t occur within 2 weeks following a vaccination.
Measles vaccine was implicated in 56 of the 68 children with vaccine-proximate febrile seizures, or 82%. Because Australian children receive their first measles-containing vaccine at age 12 months, the average age of the cohort with vaccine-proximate febrile seizures was 13 months, significantly younger than the 20-month average for children with non–vaccine-related febrile seizures.
In a multivariate analysis adjusted for patient age, gender, and history of prior afebrile seizures, the groups with vaccine-proximate and vaccine-unrelated febrile seizures didn’t differ significantly in terms of the proportion with a hospital length of stay greater than 1 day (20% vs. 15%), ICU admission (1.5% vs. 2.3%), seizure duration of more than 15 minutes (16% vs. 12%), repeat seizures within 24 hours (9% vs. 10%), or discharge on antiepileptic medication (4.4% vs. 4.3%).
In the developmental outcomes analysis, 62 of the children with vaccine-proximate febrile seizures, 70 with vaccine-unrelated febrile seizures, and 85 healthy controls with no seizure history underwent formal assessment using the third edition of the Bayley Scales of Infant and Toddler Development 12-24 months after their initial febrile seizure. Scores adjusted for years of maternal education were closely similar in all three groups across all five test domains: cognitive, language, motor, social-emotional, and general-adaptive.
Dr. Deng reported having no financial conflicts of interest regarding the study, which was partially funded by the Australian National Centre for Immunisation Research and Surveillance.
REPORTING FROM ESPID 2018
Key clinical point: Parents now can confidently be reassured that vaccine-proximate febrile seizures have no long-term consequences.
Major finding: as in controls with no seizure history.
Study details: This prospective case-control study comprised 1,180 children at five Australian children’s hospitals.
Disclosures: The study was partially funded by the Australian National Centre for Immunisation Research and Surveillance. The presenter reported having no financial conflicts.
Reoperation Rates After Cartilage Restoration Procedures in the Knee: Analysis of a Large US Commercial Database
ABSTRACT
The purpose of this study is to describe the rate of return to the operating room (OR) following microfracture (MFX), autologous chondrocyte implantation (ACI), osteochondral autograft transplantation (OATS), and osteochondral allograft (OCA) procedures at 90 days, 1 year, and 2 years. Current Procedural Terminology codes for all patients undergoing MFX, ACI, OATS, and OCA were used to search a prospectively collected, commercially available private payer insurance company database from 2007 to 2011. Within 90 days, 1 year, and 2 years after surgery, the database was searched for the occurrence of these same patients undergoing knee diagnostic arthroscopy with biopsy, lysis of adhesions, synovectomy, arthroscopy for infection or lavage, arthroscopy for removal of loose bodies, chondroplasty, MFX, ACI, OATS, OCA, and/or knee arthroplasty. Descriptive statistical analysis and contingency table analysis were performed. A total of 47,207 cartilage procedures were performed from 2007 to 2011, including 43,576 MFX, 640 ACI, 386 open OATS, 997 arthroscopic OATS, 714 open OCA, and 894 arthroscopic OCA procedures. The weighted average reoperation rates for all procedures were 5.87% at 90 days, 11.94% at 1 year, and 14.90% at 2 years following the index cartilage surgery. At 2 years, patients who underwent MFX, ACI, OATS, OCA had reoperation rates of 14.65%, 29.69%, 8.82%, and 12.22%, respectively. There was a statistically significantly increased risk for ACI return to OR within all intervals (P < .0001); however, MFX had a greater risk factor (P < .0001) for conversion to arthroplasty. There was no difference in failure/revision rates between the restorative treatment options. With a large US commercial insurance database from 2007 to 2011, reparative procedures were favored for chondral injuries, but yielded an increased risk for conversion to arthroplasty. There was no difference in failure/revision rates between the restorative approaches, yet cell-based approaches yielded a significantly increased risk for a return to the OR.
Continue to: Symptomatic, full-thickness articular cartilage
Symptomatic, full-thickness articular cartilage defects in the knee are difficult to manage, particularly in the young, athletic patient population. Fortunately, a variety of cartilage repair (direct repair of the cartilage or those procedures which attempt to generate fibrocartilage) and restoration (those aimed at restoring hyaline cartilage) procedures are available, with encouraging short- and long-term clinical outcomes. After failure of nonoperative management, several surgical options are available for treating symptomatic focal chondral defects, including microfracture (MFX), autologous chondrocyte implantation (ACI), osteochondral autograft transplantation (OATS), and open and arthroscopic osteochondral allograft (OCA) transplantation procedures.1,2 When appropriately indicated, each of these techniques has demonstrated good to excellent clinical outcomes with respect to reducing pain and improving function.3-5
While major complications following cartilage surgery are uncommon, the need for reoperation following an index articular cartilage operation is poorly understood. Recently, McCormick and colleagues6 found that reoperation within the first 2 years following meniscus allograft transplantation (MAT) is associated with an increased likelihood of revision MAT or future arthroplasty. Given the association between early reoperation following meniscus restoration surgery and subsequent failure, an improved understanding of the epidemiology and implications of reoperations following cartilage restoration surgery is warranted. Further, in deciding which treatment option is best suited to a particular patient, the rate of return to the operating room (OR) should be taken into consideration, as this could potentially influence surgical decision-making as to which procedure to perform, especially in value-based care decision-making environments.
The purpose of this study is to describe the rate of return to the OR for knee procedures following cartilage restoration at intervals of 90 days, 1 year, and 2 years across a large-scale US patient database. The authors hypothesize that the rate of return to the OR following knee cartilage repair or restoration procedures will be under 20% during the first post-operative year, with increasing reoperation rates over time. A secondary hypothesis is that there will be no difference in reoperation rates according to sex, but that younger patients (those younger than 40 years) will have higher reoperation rates than older patients.
METHODS
We performed a retrospective analysis of a prospectively collected, large-scale, and commercially available private payer insurance company database (PearlDiver) from 2007 to 2011. The PearlDiver database is a Health Insurance Portability and Accountability Act (HIPAA) compliant, publicly available national database consisting of a collection of private payer records, with United Health Group representing the contributing health plan. The database has more than 30 million patient records and contains Current Procedural Terminology (CPT) and International Classification of Diseases, Ninth Revision (ICD-9) codes related to orthopedic procedures. From 2007 to 2011, the private payer database captured between 5.9 million and 6.2 million patients per year.
Our search was based on the CPT codes for MFX (29879), ACI (27412), OATS (29866, 29867), and OCA (27415, 27416). Return to the OR for revision surgery for the above-mentioned procedures was classified as patients with a diagnosis of diagnostic arthroscopy with biopsy (CPT 29870), lysis of adhesions (CPT 29884), synovectomy (29875, 29876), arthroscopy for infection or lavage (CPT 29871), arthroscopy for removal of loose bodies (29874), chondroplasty (29877), unicompartmental knee arthroplasty (27446), total knee arthroplasty (27447), and/or patellar arthroplasty (27438). Patient records were followed for reoperations occurring within 90 days, 1 year, and 2 years after the index cartilage procedure. All data were compared based on patient age and sex.
Table 1. Breakdown of MFX, ACI, OATS, and OCA Procedures by Sex | ||||||
MFX | ACI | Open OATS | Arthroscopic OATS | Open OCA | Arthroscopic OCA | |
Females | 20,589 | 276 | 167 | 401 | 275 | 350 |
Males | 22,987 | 364 | 219 | 596 | 439 | 544 |
Total | 43,576 | 640 | 386 | 997 | 714 | 894 |
Abbreviations: ACI, autologous chondrocyte implantation; MFX, microfracture; OCA, osteochondral allograft; OATS, osteochondral autograft transplantation.
Continue to: Statistical analysis...
STATISTICAL ANALYSIS
Statistical analysis of this study was primarily descriptive to demonstrate the incidence for each code at each time interval. One-way analysis of variance, Chi-square analysis, and contingency tables were used to compare the incidence of each type of procedure throughout the various time intervals. A P-value of < 0.05 was considered statistically significant. Statistical analysis was performed using SPSS v.20 (International Business Machines).
RESULTS
A total of 47,207 cartilage procedures were performed from 2007 to 2011, including 43,576 MFX (92.3%) 640 ACI (1.4%), 386 open OATS (0.82%), 997 arthroscopic OATS (2.11%), 714 open OCA (1.51%), and 894 arthroscopic OCA (1.89%) procedures. A summary of the procedures performed, broken down by age and sex, is provided in Tables 1 and 2. A total of 25,149 male patients (53.3%) underwent surgical procedures compared to 22,058 female patients (46.7%). For each category of procedure (MFX, ACI, OATS, OCA), there was a significantly higher proportion of males than females undergoing surgery (P < .0001 for all). Surgical treatment with MFX was consistently the most frequently performed surgery across all age groups (92.31%), while cell-based therapy with ACI was the least frequently performed procedure across all age ranges (1.36%). Restorative OATS and OCA techniques were performed with the greatest frequency in the 15-year-old to 19-year-old age group, but were not utilized in patients over 64 years of age (Table 2).
Table 2. Breakdown of MFX, ACI, OATS, and OCA Procedures by Age | ||||
Age (y) | MFX | ACI | OATS | OCA |
10 to 14 | 572 | 22 | 74 | 47 |
15 to 19 | 1984 | 83 | 254 | 235 |
20 to 24 | 1468 | 54 | 140 | 144 |
25 to 29 | 1787 | 74 | 152 | 176 |
30 to 34 | 2824 | 114 | 152 | 204 |
35 to 39 | 4237 | 96 | 153 | 210 |
40 to 44 | 5441 | 103 | 166 | 217 |
45 to 49 | 7126 | 57 | 149 | 180 |
50 to 54 | 7004 | 25 | 83 | 140 |
55 to 59 | 6410 | 12 | 40 | 40 |
60 to 64 | 4409 | 0 | 20 | 15 |
65 to 69 | 269 | 0 | 0 | 0 |
70 to 74 | 45 | 0 | 0 | 0 |
Total | 43,576 | 640 | 1383 | 1608 |
Abbreviations: ACI, autologous chondrocyte implantation; MFX, microfracture; OCA, osteochondral allograft; OATS, osteochondral autograft transplantation.
A summary of all reoperation data is provided in Tables 3 to 7 and Figures 1 and 2. The weighted average reoperation rates for all procedures were 5.87% at 90 days, 11.94% at 1 year, and 14.90% at 2 years following the index cartilage surgery. Patients who underwent MFX had reoperation rates of 6.05% at 90 days, 11.80% at 1 year, and 14.65% at 2 years. Patients who underwent ACI had reoperation rates of 4.53% at 90 days, 23.28% at 1 year, and 29.69% at 2 years. Patients who had open and arthroscopic OATS had reoperation rates of 3.122% and 5.12% at 90 days, 6.74% and 8.53% at 1 year, and 7.51% and 10.13% at 2 years, respectively. Patients who underwent open and arthroscopic OCA had reoperation rates of 2.52% and 3.91% at 90 days, 7.14% and 6.60% at 1 year, and 13.59% and 10.85% at 2 years (Table 3). There was a statistically significantly increased risk for reoperation following ACI within all intervals compared to all other surgical techniques (P < .0001); however, MFX had a greater risk factor (P < .0001) for conversion to arthroplasty at 6.70%. There was no significant difference between failure rates (revision OATS/OCA or conversion to arthroplasty) between the restorative treatment options, with 14 failures for OATS (9.52% of reoperations at 2 years) compared to 22 failures for OCA (12.7% of reoperations at 2 years, P = .358). Among the entire cohort of cartilage surgery patients, arthroscopic chondroplasty was the most frequent procedure performed at the time of reoperation at all time points assessed, notably accounting for 33.08% of reoperations 2 years following microfracture, 51.58% of reoperations at 2 years following ACI, 53.06% of reoperations at 2 years following OATS, and 54.07% of reoperations at 2 years following OCA (Figure 3, Tables 4–7).
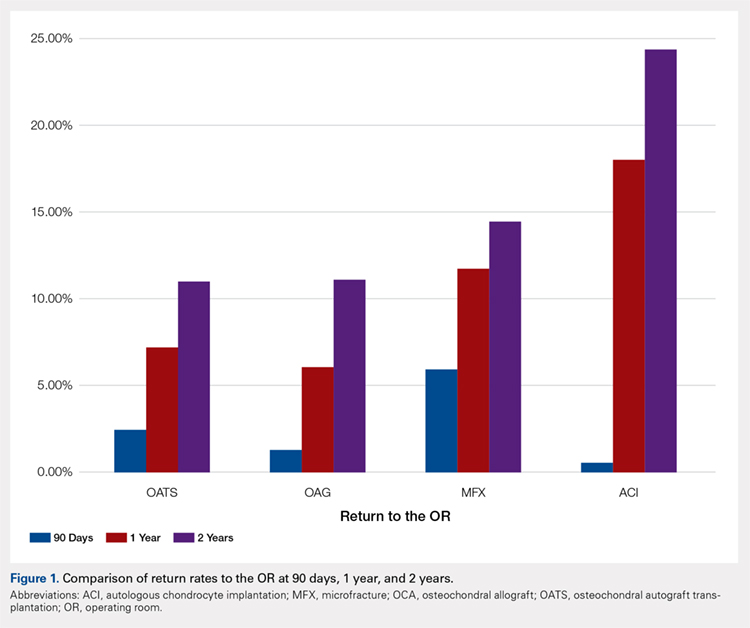
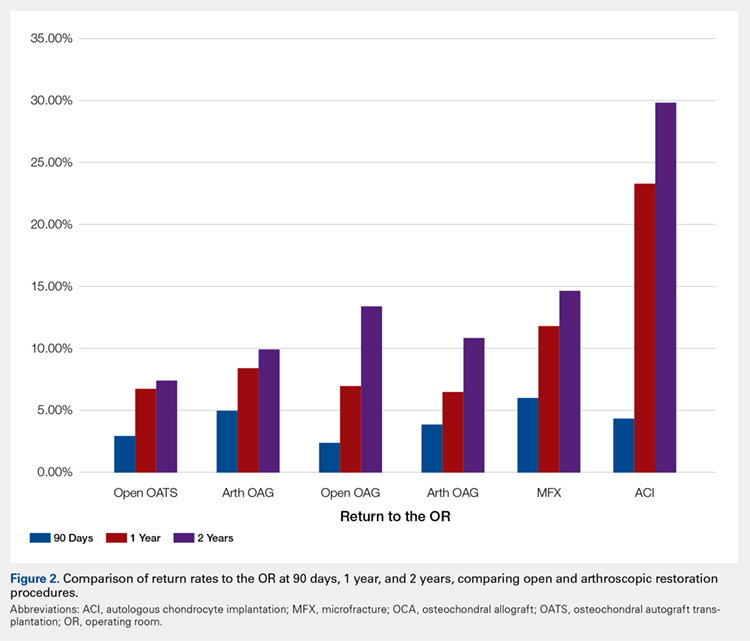
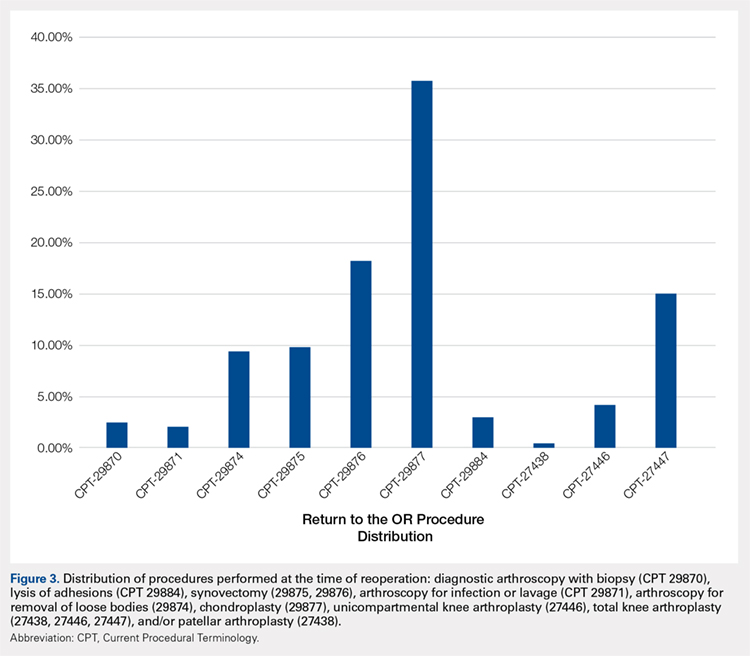
Table 3. Comparison of Return to OR Following MFX, ACI, OCA, and OATS | |||||||
Procedure | Total No. of Cases in Study Period | No. of Reoperations at 90 Days | Return to OR Rate at 90 Days | No. of Reoperations at 1 Year | Return to OR Rate at 1 Year | No. of Reoperations at 2 Years | Return to OR Rate at 2 Years |
MFX | 43,576 | 2636 | 6.05% | 5142 | 11.80% | 6385 | 14.65% |
ACI | 640 | 29 | 4.53% | 149 | 23.28% | 190 | 29.69% |
Open OATS | 386 | 12 | 3.12% | 26 | 6.74% | 29 | 7.51% |
Arthroscopic OATS | 997 | 51 | 5.12% | 85 | 8.53% | 101 | 10.13% |
Open OCA | 714 | 18 | 2.52% | 51 | 7.14% | 97 | 13.59% |
Arthroscopic OCA | 894 | 161 | 3.91% | 59 | 6.60% | 97 | 10.85% |
Weighted average for all procedures |
| 5.87% |
| 11.94% |
| 14.90% | |
Abbreviations: ACI, autologous chondrocyte implantation; MFX, microfracture; OCA, osteochondral allograft; OATS, osteochondral autograft transplantation; OR, operating room.
Table 4. Rate of Return to OR Following MFX (n = 43,574) | ||||
Procedure | CPT Code | 90 Days | 1 Year | 2 Years |
Knee arthroscopy | 29870 | 54 | 122 | 162 |
Knee arthroscopic drainage and lavage | 29871 | 84 | 102 | 104 |
Arthroscopic adhesions débridement | 29874 | 300 | 468 | 549 |
Arthroscopic synovectomy | 29875 | 324 | 528 | 611 |
Major arthroscopic synovectomy | 29876 | 557 | 926 | 1087 |
Knee arthroscopic chondroplasty | 29877 | 1063 | 1722 | 2112 |
Arthroscopic lysis of adhesions | 29884 | 61 | 129 | 171 |
Patellar arthroplasty | 27438 | 0 | 38 | 49 |
Medial or lateral knee arthroplasty | 27446 | 51 | 242 | 328 |
Medial and lateral knee arthroplasty | 27447 | 142 | 865 | 1212 |
Total | 2636 | 5142 | 6385 | |
Return to OR | 6.05% | 11.80% | 14.65% | |
Abbreviations: CPT, Current Procedural Terminology; MFX, microfracture; OR, operating room.
Table 5. Rate of Return to OR Following ACI (n = 640) | ||||
Procedure | CPT Code | 90 Daysa | 1 Yeara | 2 Yearsa |
Revision ACI | 27412 | 29 | 33 | 35 |
Knee arthroscopy | 29870 | -1 | -1 | -1 |
Knee arthroscopic drainage and lavage | 29871 | -1 | -1 | -1 |
Arthroscopic adhesions débridement | 29874 | 0 | -1 | -1 |
Arthroscopic synovectomy | 29875 | -1 | -1 | -1 |
Major arthroscopic synovectomy | 29876 | -1 | 12 | 20 |
Knee arthroscopic chondroplasty | 29877 | -1 | 71 | 98 |
Arthroscopic lysis of adhesions | 29884 | -1 | 33 | 37 |
Patellar arthroplasty | 27438 | 0 | 0 | 0 |
Medial or lateral knee arthroplasty | 27446 | 0 | -1 | -1 |
Medial and lateral knee arthroplasty | 27447 | 0 | -1 | -1 |
Total | 29 | 149 | 190 | |
Return to OR | 4.53% | 23.28% | 29.69% | |
aA -1 denotes No. <11 within the PearlDiver database, and exact numbers are not reported due to patient privacy considerations.
Abbreviations: ACI, autologous chondrocyte implantation; CPT, Current Procedural Terminology; OR, operating room.
Table 6. Rate of Return to OR Following OATS (n = 1320) | ||||
Procedure | CPT Code | 90 Days | 1 Year | 2 Years |
Knee arthroscopy | 29870 | 0 | 0 | 0 |
Knee arthroscopic drainage and lavage | 29871 | 0 | 0 | 0 |
Arthroscopic adhesions débridement | 29874 | 0 | 12 | 13 |
Arthroscopic synovectomy | 29875 | 0 | 0 | 14 |
Major arthroscopic synovectomy | 29876 | 16 | 25 | 28 |
Knee arthroscopic chondroplasty | 29877 | 17 | 58 | 78 |
Arthroscopic lysis of adhesions | 29884 | 0 | 0 | 0 |
Patellar arthroplasty | 27438 | 0 | 0 | 0 |
Medial or lateral knee arthroplasty | 27446 | 0 | 0 | 0 |
Medial and lateral knee arthroplasty | 27447 | 0 | 0 | 14 |
Total | 33 | 95 | 147 | |
Return to OR | 2.50% | 7.20% | 11.14% | |
Abbreviations: CPT, Current Procedural Terminology; OATS, osteochondral autograft transplantation; OR, operating room.
Table 7. Rate of Return to OR Following OCA Transplantation (n = 1531) | ||||
Procedure | CPT Code | 90 Days | 1 Year | 2 Year |
Knee arthroscopy | 29870 | 0 | 0 | 0 |
Knee arthroscopic drainage and lavage | 29871 | 0 | 0 | 0 |
Arthroscopic adhesions débridement | 29874 | 0 | 15 | 19 |
Arthroscopic synovectomy | 29875 | 0 | 0 | 0 |
Major arthroscopic synovectomy | 29876 | 0 | 20 | 38 |
Knee arthroscopic chondroplasty | 29877 | 22 | 59 | 93 |
Arthroscopic lysis of adhesions | 29884 | 0 | 0 | 0 |
Patellar arthroplasty | 27438 | 0 | 0 | 0 |
Medial or lateral knee arthroplasty | 27446 | 0 | 0 | 0 |
Medial and lateral knee arthroplasty | 27447 | 0 | 0 | 22 |
Total | 22 | 94 | 172 | |
Return to OR | 1.44% | 6.14% | 11.23% | |
Abbreviations: CPT, Current Procedural Terminology; OCA, osteochondral allograft; OR, operating room.
Continue to: Discussion...
DISCUSSION
The principle findings of this study demonstrate that there is an overall reoperation rate of 14.90% at 2 years following cartilage repair/restoration surgery, with the highest reoperation rates following MFX at 90 days, and ACI at both 1 year and 2 years following the index procedure. Also, patients undergoing index MFX as the index procedure have the highest risk for conversion to arthroplasty, reoperation rates for all cartilage surgeries increase over time, and arthroscopic chondroplasty is the most frequent procedure performed at the time of reoperation.
The management of symptomatic articular cartilage knee pathology is extremely challenging. With improvements in surgical technique, instrumentation, and clinical decision-making, indications are constantly evolving. Techniques that may work for “small” defects, though there is some debate as to what constitutes a “small” defect, are not necessarily going to be successful for larger defects, and this certainly varies depending on where the defect is located within the knee joint (distal femur vs patella vs trochlea, etc.). Recently, in a 2015 analysis of 3 level I or II studies, Miller and colleagues7 demonstrated both MFX and OATS to be viable, cost-effective, first-line treatment options for articular cartilage injuries, with similar clinical outcomes at 8.7 years. The authors noted cumulative reoperation rates of 29% among patients undergoing MFX compared to 13% among patients undergoing OATS. While ACI and OCA procedures were not included in their study, the reported reoperation rates of 29% following MFX and 13% following OATS at nearly 10 years suggest a possible increased need for reoperation following MFX over time (approximately 15% at 2 years in our study) and a stable rate of reoperation following OATS (approximately 11% at 2 years in our study). This finding is significant, as one of the goals with these procedures is to deliver effective, long-lasting pain relief and restoration of function. Interestingly, in this study, restorative OATS and OCA techniques were performed with the greatest frequency in the 15-year-old to 19-year-old age group, but were not performed in patients older than 64 years. This may be explained by the higher prevalence of acute traumatic injuries and osteochondritis dissecans diagnoses in younger patients compared with older patients, as these diagnoses are more often indicated to undergo restorative procedures as opposed to marrow stimulation.
In a 2016 systematic review of 20 studies incorporating 1117 patients, Campbell and colleagues8 assessed return-to-play rates following MFX, ACI, OATS, and OCA. The authors noted that return to sport (RTS) rates were greatest following OATS (89%), followed by OCA (88%), ACI (84%), and MFX (75%). Positive prognostic factors for RTS included younger age, shorter duration of preoperative symptoms, no history of prior ipsilateral knee surgery, and smaller chondral defects. Reoperation rates between the 4 techniques were not statistically compared in their study. Interestingly, in 2013, Chalmers and colleagues9 conducted a separate systematic review of 20 studies comprising 1375 patients undergoing MFX, ACI, or OATS. In their study, the authors found significant advantages following ACI and OATS compared to MFX with respect to patient-reported outcome scores but noted significantly faster RTS rates with MFX. Reoperation rates were noted to be similar between the 3 procedures (25% for ACI, 21% for MFX, and 28% for OATS) at an average 3.7 years following the index procedure. When considering these 2 systematic reviews together, despite a faster RTS rate following MFX, a greater proportion of patients seem to be able to RTS over time following other procedures such as OATS, OCA, and ACI. Unfortunately, these reviews do not provide insight as to the role, if any, of reoperation on return to play rates nor on overall clinical outcome scores on patients undergoing articular cartilage surgery. However, this information is valuable when counseling athletes who are in season and would like to RTS as soon as possible as opposed to those who do not have tight time constraints for when they need to RTS.
Regardless of the cartilage technique chosen, the goals of surgery remain similar—to reduce pain and improve function. For athletes, the ultimate goal is to return to the same level of play that the athlete was able to achieve prior to injury. Certainly, the need for reoperation following a cartilage surgery has implications on pain, function, and ability to RTS. Our review of nearly 50,000 cartilage surgeries demonstrates that reoperations following cartilage repair surgery are not uncommon, with a rate of 14.90% at 2 years, and that while reoperation rates are the highest following ACI, the rate of conversion to knee arthroplasty is highest following MFX. Due to the limitations of the PearlDiver database, it is not possible to determine the clinical outcomes of patients undergoing reoperation following cartilage surgery, but certainly, given these data, reoperation is clearly not necessarily indicative of clinical failure. This is highlighted by the fact that the most common procedure performed at the time of reoperation is arthroscopic chondroplasty, which, despite being an additional surgical procedure, may be acceptable for patients who wish to RTS, particularly in the setting of an index ACI in which there may be graft hypertrophy. Ideally, additional studies incorporating a cost-effectiveness analysis of each of the procedures, incorporating reoperation rates as well as patient-reported clinical outcomes, would be helpful to truly determine the patient and societal implications of reoperation following cartilage repair/restoration.
Many of the advantages and disadvantages of the described cartilage repair/restoration procedures have been well described.10-17 Microfracture is the most commonly utilized first-line repair/restoration option for small articular cartilage lesions, mainly due to its low cost, low morbidity, and relatively low level of difficulty.18 Despite these advantages, MFX is not without limitations, and the need for revision cartilage restoration and/or conversion to arthroplasty is concerning. In 2013, Salzmann and colleagues19 evaluated a cohort of 454 patients undergoing MFX for a symptomatic knee defect and noted a reoperation rate of 26.9% (n = 123) within 2 years of the index surgery, with risk factors for reoperation noted to include an increased number of pre-MFX ipsilateral knee surgeries, patellofemoral lesions, smoking, and lower preoperative numeric analog scale scores. The definition of reoperation in their study is unfortunately not described, and thus the extent of reoperation (arthroscopy to arthroplasty) is unclear. In a 2009 systematic review of 3122 patients (28 studies) undergoing MFX conducted by Mithoefer and colleagues,20 revision rates were noted to range from 2% to 31% depending on the study analyzed, with increasing revision rates after 2 years. Unfortunately, the heterogeneity of the included studies makes it difficult to determine which patients tend to fail over time.
Continue to: OATS...
OATS is a promising cartilage restoration technique indicated for treatment of patients with large, uncontained chondral lesions, and/or lesions with both bone and cartilage loss.1 OCA is similar to OATS but uses allograft tissue instead of autograft tissue and is typically considered a viable treatment option in larger lesions (>2 cm2).21 Cell-based ACI therapy has evolved substantially over the past decade and is now available as a third-generation model utilizing biodegradable 3-dimensional scaffolds seeded with chondrocytes. Reoperation rates following ACI can often be higher than those following other cartilage treatments, particularly given the known complication of graft hypertrophy and/or delamination. Harris and colleagues22 conducted a systematic review of 5276 subjects undergoing ACI (all generations), noting an overall reoperation rate of 33%, but a failure rate of 5.8% at an average of 22 months following ACI. Risk factors for reoperation included periosteal-based ACI as well as open (vs arthroscopic) ACI. In this study, we found a modestly lower return to OR rate of 29.69% at 2 years.
When the outcomes of patients undergoing OATS or OCA are compared to those of patients undergoing MFX or ACI, it can be difficult to interpret the results, as the indications for performing these procedures tend to be very different. Further, the reasons for reoperation, as well as the procedures performed at the time of reoperation, are often poorly described, making it difficult to truly quantify the risk of reoperation and the implications of reoperation for patients undergoing any of these index cartilage procedures.
Overall, in this database, the return to the OR rate approaches 15% at 2 years following cartilage surgery, with cell-based therapy demonstrating higher reoperation rates at 2 years, without the risk of conversion to arthroplasty. Reoperation rates appear to stabilize at 1 year following surgery and consist mostly of minor arthroscopic procedures. These findings can help surgeons counsel patients as to the rate and type of reoperations that can be expected following cartilage surgery. Additional research incorporating patient-reported outcomes and patient-specific risk factors are needed to complement these data as to the impact of reoperations on overall clinical outcomes. Further, studies incorporating 90-day, 1-year, and 2-year costs associated with cartilage surgery will help to determine which index procedure is the most cost effective over the short- and long-term.
LIMITATIONS
This study is not without limitations. The PearlDiver database is reliant upon accurate CPT and ICD-9 coding, which creates a potential for a reporting bias. The overall reliability of the analyses is dependent on the quality of the available data, which, as noted in previous PearlDiver studies,18,23-28 may include inaccurate billing codes, miscoding, and/or non-coding by physicians as potential sources of error. At the time of this study, the PearlDiver database did not provide consistent data points on laterality, and thus it is possible that the reported rates of reoperation overestimate the true reoperation rate following a given procedure. Fortunately, the reoperation rates for each procedure analyzed in this database study are consistent with those previously presented in the literature. In addition, it is not uncommon for patients receiving one of these procedures to have previously been treated with one of the others. Due to the inherent limitations of the PearlDiver database, this study did not investigate concomitant procedures performed along with the index procedure, nor did it investigate confounding factors such as comorbidities. The PearlDiver database does not provide data on defect size, location within the knee, concomitant pathologies (eg, meniscus tear), prior surgeries, or patient comorbidities, and while important, these factors cannot be accounted for in our analysis. The inability to account for these important factors, particularly concomitant diagnoses, procedures, and lesion size/location, represents an important limitation of this study, as this is a source of selection bias and may influence the need for reoperation in a given patient. Despite these limitations, the results of this study are supported by previous and current literature. In addition, the PearlDiver database, as a HIPAA-compliant database, does not report exact numbers when the value of the outcome of interest is between 0 and 10, which prohibits analysis of any cartilage procedure performed in a cohort of patients greater than 1 and less than 11. Finally, while not necessarily a limitation, it should be noted that CPT 29879 is not specific for microfracture, as the code also includes abrasion arthroplasty and drilling. Due to the limitations of the methodology of searching the database for this code, it is unclear as to how many patients underwent actual microfracture vs abrasion arthroplasty.
CONCLUSION
Within a large US commercial insurance database from 2007 to 2011, reparative procedures were favored for chondral injuries, but yielded an increased risk for conversion to arthroplasty. There was no difference between failure/revision rates among the restorative approaches, yet cell-based approaches yielded a significantly increased risk for a return to the OR.
- Farr J, Cole B, Dhawan A, Kercher J, Sherman S. Clinical cartilage restoration: evolution and overview. Clin Orthop Relat Res. 2011;469(10):2696-2705. doi:10.1007/s11999-010-1764-z.
- Alford JW, Cole BJ. Cartilage restoration, part 1: basic science, historical perspective, patient evaluation, and treatment options. Am J Sports Med. 2005;33(2):295-306. doi:10.1177/03635465004273510.
- Alford JW, Cole BJ. Cartilage restoration, part 2: techniques, outcomes, and future directions. Am J Sports Med. 2005;33(3):443-460. doi:10.1177/0363546505274578.
- Gudas R, Gudaitė A, Pocius A, et al. Ten-year follow-up of a prospective, randomized clinical study of mosaic osteochondral autologous transplantation versus microfracture for the treatment of osteochondral defects in the knee joint of athletes. Am J Sports Med. 2012;40(11):2499-2508. doi:10.1177/0363546512458763.
- Saris DBF, Vanlauwe J, Victor J, et al. Treatment of symptomatic cartilage defects of the knee: characterized chondrocyte implantation results in better clinical outcome at 36 months in a randomized trial compared to microfracture. Am J Sports Med. 2009;37(suppl 1):10-19. doi:10.1177/0363546509350694.
- McCormick F, Harris JD, Abrams GD, et al. Survival and reoperation rates after meniscal allograft transplantation: analysis of failures for 172 consecutive transplants at a minimum 2-year follow-up. Am J Sports Med. 2014;42(4):892-897. doi:10.1177/0363546513520115.
- Miller DJ, Smith MV, Matava MJ, Wright RW, Brophy RH. Microfracture and osteochondral autograft transplantation are cost-effective treatments for articular cartilage lesions of the distal femur. Am J Sports Med. 2015;43(9):2175-2181. doi:10.1177/0363546515591261.
- Campbell AB, Pineda M, Harris JD, Flanigan DC. Return to sport after articular cartilage repair in athletes' knees: a systematic review. Arthroscopy. 2016;32(4):651-668.
- Chalmers PN, Vigneswaran H, Harris JD, Cole BJ. Activity-related outcomes of articular cartilage surgery: a systematic review. Cartilage. 2013;4(3):193-203.
- Bentley G, Biant LC, Vijayan S, Macmull S, Skinner JA, Carrington RW. Minimum ten-year results of a prospective randomised study of autologous chondrocyte implantation versus mosaicplasty for symptomatic articular cartilage lesions of the knee. JBone Joint Surg Br. 2012;94(4):504-509. doi:10.1177/1947603513481603.
- Beris AE, Lykissas MG, Kostas-Agnantis I, Manoudis GN. Treatment of full-thickness chondral defects of the knee with autologous chondrocyte implantation: a functional evaluation with long-term follow-up. Am J Sports Med. 2012;40(3):562-567.
- Chahal J, Gross AE, Gross C, et al. Outcomes of osteochondral allograft transplantation in the knee. Arthroscopy. 2013;29(3):575-588. doi:10.1177/0363546511428778.
- Emmerson BC, Görtz S, Jamali AA, Chung C, Amiel D, Bugbee WD. Fresh osteochondral allografting in the treatment of osteochondritis dissecans of the femoral condyle. Am J Sports Med. 2007;35(6):907-914. doi:10.1177/0363546507299932.
- Gudas R, Stankevičius E, Monastyreckienė E, Pranys D, Kalesinskas R. Osteochondral autologous transplantation versus microfracture for the treatment of articular cartilage defects in the knee joint in athletes. Knee Surg Sports Traumatol Arthrosc. 2006;14(9):834-842. doi:10.1007/s00167-006-0067-0.
- Lynch TS, Patel RM, Benedick A, Amin NH, Jones MH, Miniaci A. Systematic review of autogenous osteochondral transplant outcomes. Arthroscopy. 2015;31(4):746-754. doi:10.1016/j.arthro.2014.11.018.
- Niemeyer P, Porichis S, Steinwachs M, et al. Long-term outcomes after first-generation autologous chondrocyte implantation for cartilage defects of the knee. Am J Sports Med. 2014;42(1):150-157. doi:10.1177/0363546513506593.
- Ulstein S, Årøen A, Røtterud J, Løken S, Engebretsen L, Heir S. Microfracture technique versus osteochondral autologous transplantation mosaicplasty in patients with articular chondral lesions of the knee: a prospective randomized trial with long-term follow-up. Knee Surg Sports Traumatol Arthrosc. 2014;22(6):1207-1215. doi:10.1007/s00167-014-2843-6.
- Montgomery S, Foster B, Ngo S, et al. Trends in the surgical treatment of articular cartilage defects of the knee in the United States. Knee Surg Sports Traumatol Arthrosc. 2014;22(9):2070-2075. doi:10.1007/s00167-013-2614-9.
- Salzmann GM, Sah B, Südkamp NP, Niemeyer P. Reoperative characteristics after microfracture of knee cartilage lesions in 454 patients. Knee Surg Sports Traumatol Arthrosc. 2013;21(2):365-371. doi:10.1007/s00167-012-1973-y.
- Mithoefer K, McAdams T, Williams RJ, Kreuz PC, Mandelbaum BR. Clinical efficacy of the microfracture technique for articular cartilage repair in the knee: an evidence-based systematic analysis. Am J Sports Med. 2009;37(10):2053-2063. doi:10.1177/0363546508328414.
- Wajsfisz A, Makridis KG, Djian P. Arthroscopic retrograde osteochondral autograft transplantation for cartilage lesions of the tibial plateau: a prospective study. Am J Sports Med. 2013;41(2):411-415. doi:10.1177/0363546512469091.
- Harris JD, Siston RA, Brophy RH, Lattermann C, Carey JL, Flanigan DC. Failures, re-operations, and complications after autologous chondrocyte implantation–a systematic review. Osteoarthritis Cartilage. 2011;19(7):779-791. doi:10.1016/j.joca.2011.02.010.
- Abrams GD, Frank RM, Gupta AK, Harris JD, McCormick FM, Cole BJ. Trends in meniscus repair and meniscectomy in the United States, 2005-2011. Am J Sports Med. 2013;41(10):2333-2339. doi:10.1177/0363546513495641.
- Montgomery SR, Ngo SS, Hobson T, et al. Trends and demographics in hip arthroscopy in the United States. Arthroscopy. 2013;29(4):661-665. doi:10.1016/j.arthro.2012.11.005.
- Yeranosian MG, Arshi A, Terrell RD, Wang JC, McAllister DR, Petrigliano FA. Incidence of acute postoperative infections requiring reoperation after arthroscopic shoulder surgery. Am J Sports Med. 2014;42(2):437-441. doi:10.1177/0363546513510686.
- Zhang AL, Montgomery SR, Ngo SS, Hame SL, Wang JC, Gamradt SC. Arthroscopic versus open shoulder stabilization: current practice patterns in the United States. Arthroscopy. 2014;30(4):436-443. doi:10.1016/j.arthro.2013.12.013.
- Werner BC, Carr JB, Wiggins JC, Gwathmey FW, Browne JA. Manipulation under anesthesia after total knee arthroplasty is associated with an increased incidence of subsequent revision surgery. J Arthroplasty. 2015;30(suppl 9):72-75. doi:10.1016/j.arth.2015.01.061.
- Carr JB 2nd, Werner BC, Browne JA. Trends and outcomes in the treatment of failed septic total knee arthroplasty: comparing arthrodesis and above-knee amputation. J Arthroplasty. 2016;31(7):1574-1577. doi:10.1016/j.arth.2016.01.010.
ABSTRACT
The purpose of this study is to describe the rate of return to the operating room (OR) following microfracture (MFX), autologous chondrocyte implantation (ACI), osteochondral autograft transplantation (OATS), and osteochondral allograft (OCA) procedures at 90 days, 1 year, and 2 years. Current Procedural Terminology codes for all patients undergoing MFX, ACI, OATS, and OCA were used to search a prospectively collected, commercially available private payer insurance company database from 2007 to 2011. Within 90 days, 1 year, and 2 years after surgery, the database was searched for the occurrence of these same patients undergoing knee diagnostic arthroscopy with biopsy, lysis of adhesions, synovectomy, arthroscopy for infection or lavage, arthroscopy for removal of loose bodies, chondroplasty, MFX, ACI, OATS, OCA, and/or knee arthroplasty. Descriptive statistical analysis and contingency table analysis were performed. A total of 47,207 cartilage procedures were performed from 2007 to 2011, including 43,576 MFX, 640 ACI, 386 open OATS, 997 arthroscopic OATS, 714 open OCA, and 894 arthroscopic OCA procedures. The weighted average reoperation rates for all procedures were 5.87% at 90 days, 11.94% at 1 year, and 14.90% at 2 years following the index cartilage surgery. At 2 years, patients who underwent MFX, ACI, OATS, OCA had reoperation rates of 14.65%, 29.69%, 8.82%, and 12.22%, respectively. There was a statistically significantly increased risk for ACI return to OR within all intervals (P < .0001); however, MFX had a greater risk factor (P < .0001) for conversion to arthroplasty. There was no difference in failure/revision rates between the restorative treatment options. With a large US commercial insurance database from 2007 to 2011, reparative procedures were favored for chondral injuries, but yielded an increased risk for conversion to arthroplasty. There was no difference in failure/revision rates between the restorative approaches, yet cell-based approaches yielded a significantly increased risk for a return to the OR.
Continue to: Symptomatic, full-thickness articular cartilage
Symptomatic, full-thickness articular cartilage defects in the knee are difficult to manage, particularly in the young, athletic patient population. Fortunately, a variety of cartilage repair (direct repair of the cartilage or those procedures which attempt to generate fibrocartilage) and restoration (those aimed at restoring hyaline cartilage) procedures are available, with encouraging short- and long-term clinical outcomes. After failure of nonoperative management, several surgical options are available for treating symptomatic focal chondral defects, including microfracture (MFX), autologous chondrocyte implantation (ACI), osteochondral autograft transplantation (OATS), and open and arthroscopic osteochondral allograft (OCA) transplantation procedures.1,2 When appropriately indicated, each of these techniques has demonstrated good to excellent clinical outcomes with respect to reducing pain and improving function.3-5
While major complications following cartilage surgery are uncommon, the need for reoperation following an index articular cartilage operation is poorly understood. Recently, McCormick and colleagues6 found that reoperation within the first 2 years following meniscus allograft transplantation (MAT) is associated with an increased likelihood of revision MAT or future arthroplasty. Given the association between early reoperation following meniscus restoration surgery and subsequent failure, an improved understanding of the epidemiology and implications of reoperations following cartilage restoration surgery is warranted. Further, in deciding which treatment option is best suited to a particular patient, the rate of return to the operating room (OR) should be taken into consideration, as this could potentially influence surgical decision-making as to which procedure to perform, especially in value-based care decision-making environments.
The purpose of this study is to describe the rate of return to the OR for knee procedures following cartilage restoration at intervals of 90 days, 1 year, and 2 years across a large-scale US patient database. The authors hypothesize that the rate of return to the OR following knee cartilage repair or restoration procedures will be under 20% during the first post-operative year, with increasing reoperation rates over time. A secondary hypothesis is that there will be no difference in reoperation rates according to sex, but that younger patients (those younger than 40 years) will have higher reoperation rates than older patients.
METHODS
We performed a retrospective analysis of a prospectively collected, large-scale, and commercially available private payer insurance company database (PearlDiver) from 2007 to 2011. The PearlDiver database is a Health Insurance Portability and Accountability Act (HIPAA) compliant, publicly available national database consisting of a collection of private payer records, with United Health Group representing the contributing health plan. The database has more than 30 million patient records and contains Current Procedural Terminology (CPT) and International Classification of Diseases, Ninth Revision (ICD-9) codes related to orthopedic procedures. From 2007 to 2011, the private payer database captured between 5.9 million and 6.2 million patients per year.
Our search was based on the CPT codes for MFX (29879), ACI (27412), OATS (29866, 29867), and OCA (27415, 27416). Return to the OR for revision surgery for the above-mentioned procedures was classified as patients with a diagnosis of diagnostic arthroscopy with biopsy (CPT 29870), lysis of adhesions (CPT 29884), synovectomy (29875, 29876), arthroscopy for infection or lavage (CPT 29871), arthroscopy for removal of loose bodies (29874), chondroplasty (29877), unicompartmental knee arthroplasty (27446), total knee arthroplasty (27447), and/or patellar arthroplasty (27438). Patient records were followed for reoperations occurring within 90 days, 1 year, and 2 years after the index cartilage procedure. All data were compared based on patient age and sex.
Table 1. Breakdown of MFX, ACI, OATS, and OCA Procedures by Sex | ||||||
MFX | ACI | Open OATS | Arthroscopic OATS | Open OCA | Arthroscopic OCA | |
Females | 20,589 | 276 | 167 | 401 | 275 | 350 |
Males | 22,987 | 364 | 219 | 596 | 439 | 544 |
Total | 43,576 | 640 | 386 | 997 | 714 | 894 |
Abbreviations: ACI, autologous chondrocyte implantation; MFX, microfracture; OCA, osteochondral allograft; OATS, osteochondral autograft transplantation.
Continue to: Statistical analysis...
STATISTICAL ANALYSIS
Statistical analysis of this study was primarily descriptive to demonstrate the incidence for each code at each time interval. One-way analysis of variance, Chi-square analysis, and contingency tables were used to compare the incidence of each type of procedure throughout the various time intervals. A P-value of < 0.05 was considered statistically significant. Statistical analysis was performed using SPSS v.20 (International Business Machines).
RESULTS
A total of 47,207 cartilage procedures were performed from 2007 to 2011, including 43,576 MFX (92.3%) 640 ACI (1.4%), 386 open OATS (0.82%), 997 arthroscopic OATS (2.11%), 714 open OCA (1.51%), and 894 arthroscopic OCA (1.89%) procedures. A summary of the procedures performed, broken down by age and sex, is provided in Tables 1 and 2. A total of 25,149 male patients (53.3%) underwent surgical procedures compared to 22,058 female patients (46.7%). For each category of procedure (MFX, ACI, OATS, OCA), there was a significantly higher proportion of males than females undergoing surgery (P < .0001 for all). Surgical treatment with MFX was consistently the most frequently performed surgery across all age groups (92.31%), while cell-based therapy with ACI was the least frequently performed procedure across all age ranges (1.36%). Restorative OATS and OCA techniques were performed with the greatest frequency in the 15-year-old to 19-year-old age group, but were not utilized in patients over 64 years of age (Table 2).
Table 2. Breakdown of MFX, ACI, OATS, and OCA Procedures by Age | ||||
Age (y) | MFX | ACI | OATS | OCA |
10 to 14 | 572 | 22 | 74 | 47 |
15 to 19 | 1984 | 83 | 254 | 235 |
20 to 24 | 1468 | 54 | 140 | 144 |
25 to 29 | 1787 | 74 | 152 | 176 |
30 to 34 | 2824 | 114 | 152 | 204 |
35 to 39 | 4237 | 96 | 153 | 210 |
40 to 44 | 5441 | 103 | 166 | 217 |
45 to 49 | 7126 | 57 | 149 | 180 |
50 to 54 | 7004 | 25 | 83 | 140 |
55 to 59 | 6410 | 12 | 40 | 40 |
60 to 64 | 4409 | 0 | 20 | 15 |
65 to 69 | 269 | 0 | 0 | 0 |
70 to 74 | 45 | 0 | 0 | 0 |
Total | 43,576 | 640 | 1383 | 1608 |
Abbreviations: ACI, autologous chondrocyte implantation; MFX, microfracture; OCA, osteochondral allograft; OATS, osteochondral autograft transplantation.
A summary of all reoperation data is provided in Tables 3 to 7 and Figures 1 and 2. The weighted average reoperation rates for all procedures were 5.87% at 90 days, 11.94% at 1 year, and 14.90% at 2 years following the index cartilage surgery. Patients who underwent MFX had reoperation rates of 6.05% at 90 days, 11.80% at 1 year, and 14.65% at 2 years. Patients who underwent ACI had reoperation rates of 4.53% at 90 days, 23.28% at 1 year, and 29.69% at 2 years. Patients who had open and arthroscopic OATS had reoperation rates of 3.122% and 5.12% at 90 days, 6.74% and 8.53% at 1 year, and 7.51% and 10.13% at 2 years, respectively. Patients who underwent open and arthroscopic OCA had reoperation rates of 2.52% and 3.91% at 90 days, 7.14% and 6.60% at 1 year, and 13.59% and 10.85% at 2 years (Table 3). There was a statistically significantly increased risk for reoperation following ACI within all intervals compared to all other surgical techniques (P < .0001); however, MFX had a greater risk factor (P < .0001) for conversion to arthroplasty at 6.70%. There was no significant difference between failure rates (revision OATS/OCA or conversion to arthroplasty) between the restorative treatment options, with 14 failures for OATS (9.52% of reoperations at 2 years) compared to 22 failures for OCA (12.7% of reoperations at 2 years, P = .358). Among the entire cohort of cartilage surgery patients, arthroscopic chondroplasty was the most frequent procedure performed at the time of reoperation at all time points assessed, notably accounting for 33.08% of reoperations 2 years following microfracture, 51.58% of reoperations at 2 years following ACI, 53.06% of reoperations at 2 years following OATS, and 54.07% of reoperations at 2 years following OCA (Figure 3, Tables 4–7).
Table 3. Comparison of Return to OR Following MFX, ACI, OCA, and OATS | |||||||
Procedure | Total No. of Cases in Study Period | No. of Reoperations at 90 Days | Return to OR Rate at 90 Days | No. of Reoperations at 1 Year | Return to OR Rate at 1 Year | No. of Reoperations at 2 Years | Return to OR Rate at 2 Years |
MFX | 43,576 | 2636 | 6.05% | 5142 | 11.80% | 6385 | 14.65% |
ACI | 640 | 29 | 4.53% | 149 | 23.28% | 190 | 29.69% |
Open OATS | 386 | 12 | 3.12% | 26 | 6.74% | 29 | 7.51% |
Arthroscopic OATS | 997 | 51 | 5.12% | 85 | 8.53% | 101 | 10.13% |
Open OCA | 714 | 18 | 2.52% | 51 | 7.14% | 97 | 13.59% |
Arthroscopic OCA | 894 | 161 | 3.91% | 59 | 6.60% | 97 | 10.85% |
Weighted average for all procedures |
| 5.87% |
| 11.94% |
| 14.90% | |
Abbreviations: ACI, autologous chondrocyte implantation; MFX, microfracture; OCA, osteochondral allograft; OATS, osteochondral autograft transplantation; OR, operating room.
Table 4. Rate of Return to OR Following MFX (n = 43,574) | ||||
Procedure | CPT Code | 90 Days | 1 Year | 2 Years |
Knee arthroscopy | 29870 | 54 | 122 | 162 |
Knee arthroscopic drainage and lavage | 29871 | 84 | 102 | 104 |
Arthroscopic adhesions débridement | 29874 | 300 | 468 | 549 |
Arthroscopic synovectomy | 29875 | 324 | 528 | 611 |
Major arthroscopic synovectomy | 29876 | 557 | 926 | 1087 |
Knee arthroscopic chondroplasty | 29877 | 1063 | 1722 | 2112 |
Arthroscopic lysis of adhesions | 29884 | 61 | 129 | 171 |
Patellar arthroplasty | 27438 | 0 | 38 | 49 |
Medial or lateral knee arthroplasty | 27446 | 51 | 242 | 328 |
Medial and lateral knee arthroplasty | 27447 | 142 | 865 | 1212 |
Total | 2636 | 5142 | 6385 | |
Return to OR | 6.05% | 11.80% | 14.65% | |
Abbreviations: CPT, Current Procedural Terminology; MFX, microfracture; OR, operating room.
Table 5. Rate of Return to OR Following ACI (n = 640) | ||||
Procedure | CPT Code | 90 Daysa | 1 Yeara | 2 Yearsa |
Revision ACI | 27412 | 29 | 33 | 35 |
Knee arthroscopy | 29870 | -1 | -1 | -1 |
Knee arthroscopic drainage and lavage | 29871 | -1 | -1 | -1 |
Arthroscopic adhesions débridement | 29874 | 0 | -1 | -1 |
Arthroscopic synovectomy | 29875 | -1 | -1 | -1 |
Major arthroscopic synovectomy | 29876 | -1 | 12 | 20 |
Knee arthroscopic chondroplasty | 29877 | -1 | 71 | 98 |
Arthroscopic lysis of adhesions | 29884 | -1 | 33 | 37 |
Patellar arthroplasty | 27438 | 0 | 0 | 0 |
Medial or lateral knee arthroplasty | 27446 | 0 | -1 | -1 |
Medial and lateral knee arthroplasty | 27447 | 0 | -1 | -1 |
Total | 29 | 149 | 190 | |
Return to OR | 4.53% | 23.28% | 29.69% | |
aA -1 denotes No. <11 within the PearlDiver database, and exact numbers are not reported due to patient privacy considerations.
Abbreviations: ACI, autologous chondrocyte implantation; CPT, Current Procedural Terminology; OR, operating room.
Table 6. Rate of Return to OR Following OATS (n = 1320) | ||||
Procedure | CPT Code | 90 Days | 1 Year | 2 Years |
Knee arthroscopy | 29870 | 0 | 0 | 0 |
Knee arthroscopic drainage and lavage | 29871 | 0 | 0 | 0 |
Arthroscopic adhesions débridement | 29874 | 0 | 12 | 13 |
Arthroscopic synovectomy | 29875 | 0 | 0 | 14 |
Major arthroscopic synovectomy | 29876 | 16 | 25 | 28 |
Knee arthroscopic chondroplasty | 29877 | 17 | 58 | 78 |
Arthroscopic lysis of adhesions | 29884 | 0 | 0 | 0 |
Patellar arthroplasty | 27438 | 0 | 0 | 0 |
Medial or lateral knee arthroplasty | 27446 | 0 | 0 | 0 |
Medial and lateral knee arthroplasty | 27447 | 0 | 0 | 14 |
Total | 33 | 95 | 147 | |
Return to OR | 2.50% | 7.20% | 11.14% | |
Abbreviations: CPT, Current Procedural Terminology; OATS, osteochondral autograft transplantation; OR, operating room.
Table 7. Rate of Return to OR Following OCA Transplantation (n = 1531) | ||||
Procedure | CPT Code | 90 Days | 1 Year | 2 Year |
Knee arthroscopy | 29870 | 0 | 0 | 0 |
Knee arthroscopic drainage and lavage | 29871 | 0 | 0 | 0 |
Arthroscopic adhesions débridement | 29874 | 0 | 15 | 19 |
Arthroscopic synovectomy | 29875 | 0 | 0 | 0 |
Major arthroscopic synovectomy | 29876 | 0 | 20 | 38 |
Knee arthroscopic chondroplasty | 29877 | 22 | 59 | 93 |
Arthroscopic lysis of adhesions | 29884 | 0 | 0 | 0 |
Patellar arthroplasty | 27438 | 0 | 0 | 0 |
Medial or lateral knee arthroplasty | 27446 | 0 | 0 | 0 |
Medial and lateral knee arthroplasty | 27447 | 0 | 0 | 22 |
Total | 22 | 94 | 172 | |
Return to OR | 1.44% | 6.14% | 11.23% | |
Abbreviations: CPT, Current Procedural Terminology; OCA, osteochondral allograft; OR, operating room.
Continue to: Discussion...
DISCUSSION
The principle findings of this study demonstrate that there is an overall reoperation rate of 14.90% at 2 years following cartilage repair/restoration surgery, with the highest reoperation rates following MFX at 90 days, and ACI at both 1 year and 2 years following the index procedure. Also, patients undergoing index MFX as the index procedure have the highest risk for conversion to arthroplasty, reoperation rates for all cartilage surgeries increase over time, and arthroscopic chondroplasty is the most frequent procedure performed at the time of reoperation.
The management of symptomatic articular cartilage knee pathology is extremely challenging. With improvements in surgical technique, instrumentation, and clinical decision-making, indications are constantly evolving. Techniques that may work for “small” defects, though there is some debate as to what constitutes a “small” defect, are not necessarily going to be successful for larger defects, and this certainly varies depending on where the defect is located within the knee joint (distal femur vs patella vs trochlea, etc.). Recently, in a 2015 analysis of 3 level I or II studies, Miller and colleagues7 demonstrated both MFX and OATS to be viable, cost-effective, first-line treatment options for articular cartilage injuries, with similar clinical outcomes at 8.7 years. The authors noted cumulative reoperation rates of 29% among patients undergoing MFX compared to 13% among patients undergoing OATS. While ACI and OCA procedures were not included in their study, the reported reoperation rates of 29% following MFX and 13% following OATS at nearly 10 years suggest a possible increased need for reoperation following MFX over time (approximately 15% at 2 years in our study) and a stable rate of reoperation following OATS (approximately 11% at 2 years in our study). This finding is significant, as one of the goals with these procedures is to deliver effective, long-lasting pain relief and restoration of function. Interestingly, in this study, restorative OATS and OCA techniques were performed with the greatest frequency in the 15-year-old to 19-year-old age group, but were not performed in patients older than 64 years. This may be explained by the higher prevalence of acute traumatic injuries and osteochondritis dissecans diagnoses in younger patients compared with older patients, as these diagnoses are more often indicated to undergo restorative procedures as opposed to marrow stimulation.
In a 2016 systematic review of 20 studies incorporating 1117 patients, Campbell and colleagues8 assessed return-to-play rates following MFX, ACI, OATS, and OCA. The authors noted that return to sport (RTS) rates were greatest following OATS (89%), followed by OCA (88%), ACI (84%), and MFX (75%). Positive prognostic factors for RTS included younger age, shorter duration of preoperative symptoms, no history of prior ipsilateral knee surgery, and smaller chondral defects. Reoperation rates between the 4 techniques were not statistically compared in their study. Interestingly, in 2013, Chalmers and colleagues9 conducted a separate systematic review of 20 studies comprising 1375 patients undergoing MFX, ACI, or OATS. In their study, the authors found significant advantages following ACI and OATS compared to MFX with respect to patient-reported outcome scores but noted significantly faster RTS rates with MFX. Reoperation rates were noted to be similar between the 3 procedures (25% for ACI, 21% for MFX, and 28% for OATS) at an average 3.7 years following the index procedure. When considering these 2 systematic reviews together, despite a faster RTS rate following MFX, a greater proportion of patients seem to be able to RTS over time following other procedures such as OATS, OCA, and ACI. Unfortunately, these reviews do not provide insight as to the role, if any, of reoperation on return to play rates nor on overall clinical outcome scores on patients undergoing articular cartilage surgery. However, this information is valuable when counseling athletes who are in season and would like to RTS as soon as possible as opposed to those who do not have tight time constraints for when they need to RTS.
Regardless of the cartilage technique chosen, the goals of surgery remain similar—to reduce pain and improve function. For athletes, the ultimate goal is to return to the same level of play that the athlete was able to achieve prior to injury. Certainly, the need for reoperation following a cartilage surgery has implications on pain, function, and ability to RTS. Our review of nearly 50,000 cartilage surgeries demonstrates that reoperations following cartilage repair surgery are not uncommon, with a rate of 14.90% at 2 years, and that while reoperation rates are the highest following ACI, the rate of conversion to knee arthroplasty is highest following MFX. Due to the limitations of the PearlDiver database, it is not possible to determine the clinical outcomes of patients undergoing reoperation following cartilage surgery, but certainly, given these data, reoperation is clearly not necessarily indicative of clinical failure. This is highlighted by the fact that the most common procedure performed at the time of reoperation is arthroscopic chondroplasty, which, despite being an additional surgical procedure, may be acceptable for patients who wish to RTS, particularly in the setting of an index ACI in which there may be graft hypertrophy. Ideally, additional studies incorporating a cost-effectiveness analysis of each of the procedures, incorporating reoperation rates as well as patient-reported clinical outcomes, would be helpful to truly determine the patient and societal implications of reoperation following cartilage repair/restoration.
Many of the advantages and disadvantages of the described cartilage repair/restoration procedures have been well described.10-17 Microfracture is the most commonly utilized first-line repair/restoration option for small articular cartilage lesions, mainly due to its low cost, low morbidity, and relatively low level of difficulty.18 Despite these advantages, MFX is not without limitations, and the need for revision cartilage restoration and/or conversion to arthroplasty is concerning. In 2013, Salzmann and colleagues19 evaluated a cohort of 454 patients undergoing MFX for a symptomatic knee defect and noted a reoperation rate of 26.9% (n = 123) within 2 years of the index surgery, with risk factors for reoperation noted to include an increased number of pre-MFX ipsilateral knee surgeries, patellofemoral lesions, smoking, and lower preoperative numeric analog scale scores. The definition of reoperation in their study is unfortunately not described, and thus the extent of reoperation (arthroscopy to arthroplasty) is unclear. In a 2009 systematic review of 3122 patients (28 studies) undergoing MFX conducted by Mithoefer and colleagues,20 revision rates were noted to range from 2% to 31% depending on the study analyzed, with increasing revision rates after 2 years. Unfortunately, the heterogeneity of the included studies makes it difficult to determine which patients tend to fail over time.
Continue to: OATS...
OATS is a promising cartilage restoration technique indicated for treatment of patients with large, uncontained chondral lesions, and/or lesions with both bone and cartilage loss.1 OCA is similar to OATS but uses allograft tissue instead of autograft tissue and is typically considered a viable treatment option in larger lesions (>2 cm2).21 Cell-based ACI therapy has evolved substantially over the past decade and is now available as a third-generation model utilizing biodegradable 3-dimensional scaffolds seeded with chondrocytes. Reoperation rates following ACI can often be higher than those following other cartilage treatments, particularly given the known complication of graft hypertrophy and/or delamination. Harris and colleagues22 conducted a systematic review of 5276 subjects undergoing ACI (all generations), noting an overall reoperation rate of 33%, but a failure rate of 5.8% at an average of 22 months following ACI. Risk factors for reoperation included periosteal-based ACI as well as open (vs arthroscopic) ACI. In this study, we found a modestly lower return to OR rate of 29.69% at 2 years.
When the outcomes of patients undergoing OATS or OCA are compared to those of patients undergoing MFX or ACI, it can be difficult to interpret the results, as the indications for performing these procedures tend to be very different. Further, the reasons for reoperation, as well as the procedures performed at the time of reoperation, are often poorly described, making it difficult to truly quantify the risk of reoperation and the implications of reoperation for patients undergoing any of these index cartilage procedures.
Overall, in this database, the return to the OR rate approaches 15% at 2 years following cartilage surgery, with cell-based therapy demonstrating higher reoperation rates at 2 years, without the risk of conversion to arthroplasty. Reoperation rates appear to stabilize at 1 year following surgery and consist mostly of minor arthroscopic procedures. These findings can help surgeons counsel patients as to the rate and type of reoperations that can be expected following cartilage surgery. Additional research incorporating patient-reported outcomes and patient-specific risk factors are needed to complement these data as to the impact of reoperations on overall clinical outcomes. Further, studies incorporating 90-day, 1-year, and 2-year costs associated with cartilage surgery will help to determine which index procedure is the most cost effective over the short- and long-term.
LIMITATIONS
This study is not without limitations. The PearlDiver database is reliant upon accurate CPT and ICD-9 coding, which creates a potential for a reporting bias. The overall reliability of the analyses is dependent on the quality of the available data, which, as noted in previous PearlDiver studies,18,23-28 may include inaccurate billing codes, miscoding, and/or non-coding by physicians as potential sources of error. At the time of this study, the PearlDiver database did not provide consistent data points on laterality, and thus it is possible that the reported rates of reoperation overestimate the true reoperation rate following a given procedure. Fortunately, the reoperation rates for each procedure analyzed in this database study are consistent with those previously presented in the literature. In addition, it is not uncommon for patients receiving one of these procedures to have previously been treated with one of the others. Due to the inherent limitations of the PearlDiver database, this study did not investigate concomitant procedures performed along with the index procedure, nor did it investigate confounding factors such as comorbidities. The PearlDiver database does not provide data on defect size, location within the knee, concomitant pathologies (eg, meniscus tear), prior surgeries, or patient comorbidities, and while important, these factors cannot be accounted for in our analysis. The inability to account for these important factors, particularly concomitant diagnoses, procedures, and lesion size/location, represents an important limitation of this study, as this is a source of selection bias and may influence the need for reoperation in a given patient. Despite these limitations, the results of this study are supported by previous and current literature. In addition, the PearlDiver database, as a HIPAA-compliant database, does not report exact numbers when the value of the outcome of interest is between 0 and 10, which prohibits analysis of any cartilage procedure performed in a cohort of patients greater than 1 and less than 11. Finally, while not necessarily a limitation, it should be noted that CPT 29879 is not specific for microfracture, as the code also includes abrasion arthroplasty and drilling. Due to the limitations of the methodology of searching the database for this code, it is unclear as to how many patients underwent actual microfracture vs abrasion arthroplasty.
CONCLUSION
Within a large US commercial insurance database from 2007 to 2011, reparative procedures were favored for chondral injuries, but yielded an increased risk for conversion to arthroplasty. There was no difference between failure/revision rates among the restorative approaches, yet cell-based approaches yielded a significantly increased risk for a return to the OR.
- Farr J, Cole B, Dhawan A, Kercher J, Sherman S. Clinical cartilage restoration: evolution and overview. Clin Orthop Relat Res. 2011;469(10):2696-2705. doi:10.1007/s11999-010-1764-z.
- Alford JW, Cole BJ. Cartilage restoration, part 1: basic science, historical perspective, patient evaluation, and treatment options. Am J Sports Med. 2005;33(2):295-306. doi:10.1177/03635465004273510.
- Alford JW, Cole BJ. Cartilage restoration, part 2: techniques, outcomes, and future directions. Am J Sports Med. 2005;33(3):443-460. doi:10.1177/0363546505274578.
- Gudas R, Gudaitė A, Pocius A, et al. Ten-year follow-up of a prospective, randomized clinical study of mosaic osteochondral autologous transplantation versus microfracture for the treatment of osteochondral defects in the knee joint of athletes. Am J Sports Med. 2012;40(11):2499-2508. doi:10.1177/0363546512458763.
- Saris DBF, Vanlauwe J, Victor J, et al. Treatment of symptomatic cartilage defects of the knee: characterized chondrocyte implantation results in better clinical outcome at 36 months in a randomized trial compared to microfracture. Am J Sports Med. 2009;37(suppl 1):10-19. doi:10.1177/0363546509350694.
- McCormick F, Harris JD, Abrams GD, et al. Survival and reoperation rates after meniscal allograft transplantation: analysis of failures for 172 consecutive transplants at a minimum 2-year follow-up. Am J Sports Med. 2014;42(4):892-897. doi:10.1177/0363546513520115.
- Miller DJ, Smith MV, Matava MJ, Wright RW, Brophy RH. Microfracture and osteochondral autograft transplantation are cost-effective treatments for articular cartilage lesions of the distal femur. Am J Sports Med. 2015;43(9):2175-2181. doi:10.1177/0363546515591261.
- Campbell AB, Pineda M, Harris JD, Flanigan DC. Return to sport after articular cartilage repair in athletes' knees: a systematic review. Arthroscopy. 2016;32(4):651-668.
- Chalmers PN, Vigneswaran H, Harris JD, Cole BJ. Activity-related outcomes of articular cartilage surgery: a systematic review. Cartilage. 2013;4(3):193-203.
- Bentley G, Biant LC, Vijayan S, Macmull S, Skinner JA, Carrington RW. Minimum ten-year results of a prospective randomised study of autologous chondrocyte implantation versus mosaicplasty for symptomatic articular cartilage lesions of the knee. JBone Joint Surg Br. 2012;94(4):504-509. doi:10.1177/1947603513481603.
- Beris AE, Lykissas MG, Kostas-Agnantis I, Manoudis GN. Treatment of full-thickness chondral defects of the knee with autologous chondrocyte implantation: a functional evaluation with long-term follow-up. Am J Sports Med. 2012;40(3):562-567.
- Chahal J, Gross AE, Gross C, et al. Outcomes of osteochondral allograft transplantation in the knee. Arthroscopy. 2013;29(3):575-588. doi:10.1177/0363546511428778.
- Emmerson BC, Görtz S, Jamali AA, Chung C, Amiel D, Bugbee WD. Fresh osteochondral allografting in the treatment of osteochondritis dissecans of the femoral condyle. Am J Sports Med. 2007;35(6):907-914. doi:10.1177/0363546507299932.
- Gudas R, Stankevičius E, Monastyreckienė E, Pranys D, Kalesinskas R. Osteochondral autologous transplantation versus microfracture for the treatment of articular cartilage defects in the knee joint in athletes. Knee Surg Sports Traumatol Arthrosc. 2006;14(9):834-842. doi:10.1007/s00167-006-0067-0.
- Lynch TS, Patel RM, Benedick A, Amin NH, Jones MH, Miniaci A. Systematic review of autogenous osteochondral transplant outcomes. Arthroscopy. 2015;31(4):746-754. doi:10.1016/j.arthro.2014.11.018.
- Niemeyer P, Porichis S, Steinwachs M, et al. Long-term outcomes after first-generation autologous chondrocyte implantation for cartilage defects of the knee. Am J Sports Med. 2014;42(1):150-157. doi:10.1177/0363546513506593.
- Ulstein S, Årøen A, Røtterud J, Løken S, Engebretsen L, Heir S. Microfracture technique versus osteochondral autologous transplantation mosaicplasty in patients with articular chondral lesions of the knee: a prospective randomized trial with long-term follow-up. Knee Surg Sports Traumatol Arthrosc. 2014;22(6):1207-1215. doi:10.1007/s00167-014-2843-6.
- Montgomery S, Foster B, Ngo S, et al. Trends in the surgical treatment of articular cartilage defects of the knee in the United States. Knee Surg Sports Traumatol Arthrosc. 2014;22(9):2070-2075. doi:10.1007/s00167-013-2614-9.
- Salzmann GM, Sah B, Südkamp NP, Niemeyer P. Reoperative characteristics after microfracture of knee cartilage lesions in 454 patients. Knee Surg Sports Traumatol Arthrosc. 2013;21(2):365-371. doi:10.1007/s00167-012-1973-y.
- Mithoefer K, McAdams T, Williams RJ, Kreuz PC, Mandelbaum BR. Clinical efficacy of the microfracture technique for articular cartilage repair in the knee: an evidence-based systematic analysis. Am J Sports Med. 2009;37(10):2053-2063. doi:10.1177/0363546508328414.
- Wajsfisz A, Makridis KG, Djian P. Arthroscopic retrograde osteochondral autograft transplantation for cartilage lesions of the tibial plateau: a prospective study. Am J Sports Med. 2013;41(2):411-415. doi:10.1177/0363546512469091.
- Harris JD, Siston RA, Brophy RH, Lattermann C, Carey JL, Flanigan DC. Failures, re-operations, and complications after autologous chondrocyte implantation–a systematic review. Osteoarthritis Cartilage. 2011;19(7):779-791. doi:10.1016/j.joca.2011.02.010.
- Abrams GD, Frank RM, Gupta AK, Harris JD, McCormick FM, Cole BJ. Trends in meniscus repair and meniscectomy in the United States, 2005-2011. Am J Sports Med. 2013;41(10):2333-2339. doi:10.1177/0363546513495641.
- Montgomery SR, Ngo SS, Hobson T, et al. Trends and demographics in hip arthroscopy in the United States. Arthroscopy. 2013;29(4):661-665. doi:10.1016/j.arthro.2012.11.005.
- Yeranosian MG, Arshi A, Terrell RD, Wang JC, McAllister DR, Petrigliano FA. Incidence of acute postoperative infections requiring reoperation after arthroscopic shoulder surgery. Am J Sports Med. 2014;42(2):437-441. doi:10.1177/0363546513510686.
- Zhang AL, Montgomery SR, Ngo SS, Hame SL, Wang JC, Gamradt SC. Arthroscopic versus open shoulder stabilization: current practice patterns in the United States. Arthroscopy. 2014;30(4):436-443. doi:10.1016/j.arthro.2013.12.013.
- Werner BC, Carr JB, Wiggins JC, Gwathmey FW, Browne JA. Manipulation under anesthesia after total knee arthroplasty is associated with an increased incidence of subsequent revision surgery. J Arthroplasty. 2015;30(suppl 9):72-75. doi:10.1016/j.arth.2015.01.061.
- Carr JB 2nd, Werner BC, Browne JA. Trends and outcomes in the treatment of failed septic total knee arthroplasty: comparing arthrodesis and above-knee amputation. J Arthroplasty. 2016;31(7):1574-1577. doi:10.1016/j.arth.2016.01.010.
TAKE-HOME POINTS
- With a large US commercial insurance database analyzing techniques for cartilage restoration, reparative procedures were favored for chondral injuries compared to restorative approaches.
- Among patients undergoing microfracture, autologous chondrocyte implantation, osteochondral autograft transfer, and osteochondral allograft transplantation, the average 90-day reoperation rate is 6%.
- Among patients undergoing microfracture, autologous chondrocyte implantation, osteochondral autograft transfer, and osteochondral allograft transplantation, the average 2-year reoperation rate is 15%.
- Patients undergoing autologous chondrocyte implantation are more likely to experience reoperation at 90 days, 1 year, and 2 years compared to other cartilage restoration techniques including microfracture, osteochondral autograft transfer, and osteochondral allograft transplantation.
- Patients undergoing microfracture are more likely to experience an ultimate conversion to arthroplasty compared to other cartilage restoration techniques including autologous chondrocyte implantation, osteochondral autograft transfer, and osteochondral allograft transplantation.
Supreme Court case NIFLA v Becerra: What you need to know
On March 20, 2018, the United States Supreme Court heard arguments in National Institute of Family and Life Advocates (NIFLA) v Becerra. The Court is expected to issue its decision in June and the results could shape legislation around the country. Here is what you need to know.
The background
There are more than 4,000 Crisis Pregnancy Centers (CPCs) around the country, vastly out numbering abortion clinics.1 The services offered and the make-up of the staff who work in CPCs can vary. CPCs can be licensed to provide medical services, including urine pregnancy tests and ultrasounds, and may have clinicians on staff. Alternatively, other CPCs may be volunteer-run and provide counseling as well as supplies for women, including diapers and baby formula. Within CPCs, however, women are often given misleading and medically inaccurate information about abortion and contraception and are not provided with appropriate or timely referrals if they seek abortion care.
To ensure women have access to comprehensive reproductive health services, California passed the Reproductive Freedom, Accountability, Comprehensive Care, and Transparency (FACT) Act in 2015. This act requires licensed clinics — which may include some CPCs — to notify patients that they may access state-funded prenatal care, family planning, and abortion services through a county health department phone number. Additionally, facilities that provide pregnancy testing and ultrasounds are required to notify clients if they do not employ a licensed medical professional.
In response, NIFLA sued the state of California, alleging that the law violated their freedom of speech by forcing them to communicate about abortion with women who visited their centers.
The case
NIFLA argues that California is violating CPCs’ freedom of speech by requiring them to post statements about medications and medical procedures they strongly oppose. According to NIFLA, if California wants to promote state-funded options, they should publicize that information and not require the CPCs to post it.
The State of California enacted the law to ensure that California women have timely access to all available health care services, including contraception and abortion, and are made aware that the clinic they visit does not offer licensed medical care. Women may not know of their publicly funded options and, without this law, CPCs could withhold that information or provide misleading information, delaying or preventing women from accessing care.
Possible outcomes
If the Supreme Court strikes down California’s FACT Act as a violation of the First Amendment, CPCs in that state would not be required to provide information about free or low-cost prenatal care, contraception, and abortion services or post, if appropriate, that they were an unlicensed facility. However, such a ruling could call into question laws in 18 other states that require doctors to give women false information about possible side effects and complications of abortion during the consent process. This case could provide precedent for physicians to assert that such requirements violate their freedom of speech.
If the Supreme Court upholds California’s FACT Act, this would likely lead to similar laws around the country requiring CPCs to disclose the availability of affordable contraception and abortion services in their state and the lack of licensed medical providers.
For more information, check out https://www.supremecourt.gov/
Acknowledgement
Special thanks to Sara Needleman Kline, Esq, Chief Legal Officer, American College of Obstetricians and Gynecologists, for aid with this article.
Share your thoughts! Send your Letter to the Editor to rbarbieri@mdedge.com. Please include your name and the city and state in which you practice.
- Dias E. The Abortion Battleground: Crisis Pregnancy Centers. Time Magazine. http://content.time.com/time/nation/article/0,8599,2008846,00.html. Published August 5, 2010. Accessed May 16, 2018.
On March 20, 2018, the United States Supreme Court heard arguments in National Institute of Family and Life Advocates (NIFLA) v Becerra. The Court is expected to issue its decision in June and the results could shape legislation around the country. Here is what you need to know.
The background
There are more than 4,000 Crisis Pregnancy Centers (CPCs) around the country, vastly out numbering abortion clinics.1 The services offered and the make-up of the staff who work in CPCs can vary. CPCs can be licensed to provide medical services, including urine pregnancy tests and ultrasounds, and may have clinicians on staff. Alternatively, other CPCs may be volunteer-run and provide counseling as well as supplies for women, including diapers and baby formula. Within CPCs, however, women are often given misleading and medically inaccurate information about abortion and contraception and are not provided with appropriate or timely referrals if they seek abortion care.
To ensure women have access to comprehensive reproductive health services, California passed the Reproductive Freedom, Accountability, Comprehensive Care, and Transparency (FACT) Act in 2015. This act requires licensed clinics — which may include some CPCs — to notify patients that they may access state-funded prenatal care, family planning, and abortion services through a county health department phone number. Additionally, facilities that provide pregnancy testing and ultrasounds are required to notify clients if they do not employ a licensed medical professional.
In response, NIFLA sued the state of California, alleging that the law violated their freedom of speech by forcing them to communicate about abortion with women who visited their centers.
The case
NIFLA argues that California is violating CPCs’ freedom of speech by requiring them to post statements about medications and medical procedures they strongly oppose. According to NIFLA, if California wants to promote state-funded options, they should publicize that information and not require the CPCs to post it.
The State of California enacted the law to ensure that California women have timely access to all available health care services, including contraception and abortion, and are made aware that the clinic they visit does not offer licensed medical care. Women may not know of their publicly funded options and, without this law, CPCs could withhold that information or provide misleading information, delaying or preventing women from accessing care.
Possible outcomes
If the Supreme Court strikes down California’s FACT Act as a violation of the First Amendment, CPCs in that state would not be required to provide information about free or low-cost prenatal care, contraception, and abortion services or post, if appropriate, that they were an unlicensed facility. However, such a ruling could call into question laws in 18 other states that require doctors to give women false information about possible side effects and complications of abortion during the consent process. This case could provide precedent for physicians to assert that such requirements violate their freedom of speech.
If the Supreme Court upholds California’s FACT Act, this would likely lead to similar laws around the country requiring CPCs to disclose the availability of affordable contraception and abortion services in their state and the lack of licensed medical providers.
For more information, check out https://www.supremecourt.gov/
Acknowledgement
Special thanks to Sara Needleman Kline, Esq, Chief Legal Officer, American College of Obstetricians and Gynecologists, for aid with this article.
Share your thoughts! Send your Letter to the Editor to rbarbieri@mdedge.com. Please include your name and the city and state in which you practice.
- Dias E. The Abortion Battleground: Crisis Pregnancy Centers. Time Magazine. http://content.time.com/time/nation/article/0,8599,2008846,00.html. Published August 5, 2010. Accessed May 16, 2018.
- Dias E. The Abortion Battleground: Crisis Pregnancy Centers. Time Magazine. http://content.time.com/time/nation/article/0,8599,2008846,00.html. Published August 5, 2010. Accessed May 16, 2018.

ACS: Start colorectal cancer screening at age 45
The American Cancer Society recommends all U.S. adults at average risk of colorectal cancer (CRC) undergo screening starting at age 45 years.
That update to ACS recommendations is based on an increasing burden of CRC in younger individuals, microsimulation modeling results, and a “reasonable expectation” that screening tests will perform as well in adults aged 45-49 years as they do in older adults, members of the ACS Guideline Development Group said in the guideline, which was published in CA: A Cancer Journal for Clinicians.
Starting screening at age 45 contrasts with recommendations from the U.S. Preventive Services Task Force (USPSTF), which in 2016 gave an “A” recommendation for CRC screening from 50 to 75 years of age. At the time, the USPSTF noted a modest increase in life-years gained by starting earlier, based on microsimulation modeling. But it concluded that available evidence best supported starting at age 50.
The updated ACS guidelines are based in part on a modeling study that the authors say extends the previous analysis conducted for the USPSTF.
“The recommendation places a high value on the potential years of life saved, addresses anticipated rising incidence going forward, and is expected to contribute to the reduction in disparities in incidence before age 50 years in some racial groups,” the ACS guideline authors added.
The recommendation to start screening at age 45 is a “qualified” recommendation, the authors said, given the limitations of the current evidence base. Most studies to date have been focused on older individuals, in keeping with long-standing recommendations to start screening at age 50.
The move downward in screening age recommendation acknowledges one of the most “significant and disturbing” developments in CRC, the guideline’s authors said: the marked increase in incidence among younger individuals.
While CRC incidence and mortality have been declining in adults aged 55 years and older, recent studies cited in the ACS guideline document show a 51% increase in incidence from 1994 to 2014 – and an 11% increase in mortality from 2005 to 2015 – for adults younger than 55 years.
The current age-specific incidence rate for adults 45-49 years is 31.4 per 100,000, compared with 58.4 per 100,000 in adults 50-54 years. However, the ACS guideline authors said the higher rate in the older cohort is partly influenced by more frequent screening. “The true underlying risk in adults aged 45-49 years is likely closer to the risk in adults aged 50-54 years than the most recent age-specific rates would suggest,” they wrote.
Since patients in this age range have not been routinely screened before, the ACS recommendation is based on modeling. Now we need to analyze the outcomes of early screening to identify which patients will benefit most. Choices for screening include either a structural examination or a high-sensitivity stool-based test, according to the guideline, which doesn’t state a preference for any particular test.
The AGA, in their statement in response, noted that with CRC rates rising in people younger than age 50, it is appropriate to consider beginning routine screening at age 45. The statement continues “Since patients in this age range have not been previously routinely screened, the ACS recommendation is based on modeling. Now we need to analyze the outcomes of early screening to identify which patients will benefit most.”
In addition to Dr. Wolf, members of the ACS Guideline Development Group received no compensation.
SOURCE: Wolf AMD et al. CA Cancer J Clin. 2018 May 30. doi: 10.3322/caac.21457.
The latest recommendations from the American Cancer Society added individuals 45 years and older to the population for whom CRC screeningshould be performed. The change from a start age of 50 was prompted by the increase in CRC reported in younger adults and was based on a computer simulation that predicted a greater number of life-years saved using an earlier age for initiation of screening among adults at average risk for development of colorectal cancer. It is likely that screening will reduce cancer mortality even in this younger age group; however, several issues should be considered when implementing this policy.
Differences in screening tests: The reason for the increase in CRC in younger adults is not known. Nor is it understood why this increase is far greater for rectal cancer than cancers more proximal in the colon. Based on this observation, however, it is possible that flexible sigmoidoscopy may be a more appropriate test than colonoscopy for younger adults. Conversely, we do not know if the precursor of early-age CRC is more likely to be a flat lesion that is more difficult to detect using endoscopy, or less likely to bleed that may make FIT less able to detect, or have a genetic mechanism different from proximal CRC that is not part of the current DNA stool testing.

Value is the benefit gained with screening compared with the resources required to implement screening. The value of screening is greater in older individuals than in younger individuals because the risk of CRC is increased and for this reason, population-based screening should focus on screening older adults who have not undergone screening. Unfortunately, U.S. population adherence to CRC screening remains below 70% with little improvement since 2010. Only after the older population is fully screened should our attention shift to younger populations.
Disparities: The individuals most likely to undergo screening are unlikely to be the individuals most likely to benefit. African Americans have a higher age-related incidence of CRC but have the lowest screening rates in the U.S. compared with other racial and ethnic groups. This relates to not only reduced access but also reduced utilization. It is a concern that, by increasing the pool of individuals recommended for screening, we may also reduce access to those who may benefit most.
The ACS recommendations to go low may reduce colorectal cancer mortality in younger adults; however, our lack of understanding about the biology of the cancer hampers our ability to recommend the optimal screening strategy, sacrifices value, and may increase disparities in cancer outcomes.
John M. Inadomi, MD, AGAF, is a Cyrus E. Rubin Professor of Medicine and head of the division of gastroenterology at the University of Washington School of Medicine, Seattle. He has no conflicts.
The latest recommendations from the American Cancer Society added individuals 45 years and older to the population for whom CRC screeningshould be performed. The change from a start age of 50 was prompted by the increase in CRC reported in younger adults and was based on a computer simulation that predicted a greater number of life-years saved using an earlier age for initiation of screening among adults at average risk for development of colorectal cancer. It is likely that screening will reduce cancer mortality even in this younger age group; however, several issues should be considered when implementing this policy.
Differences in screening tests: The reason for the increase in CRC in younger adults is not known. Nor is it understood why this increase is far greater for rectal cancer than cancers more proximal in the colon. Based on this observation, however, it is possible that flexible sigmoidoscopy may be a more appropriate test than colonoscopy for younger adults. Conversely, we do not know if the precursor of early-age CRC is more likely to be a flat lesion that is more difficult to detect using endoscopy, or less likely to bleed that may make FIT less able to detect, or have a genetic mechanism different from proximal CRC that is not part of the current DNA stool testing.
Value is the benefit gained with screening compared with the resources required to implement screening. The value of screening is greater in older individuals than in younger individuals because the risk of CRC is increased and for this reason, population-based screening should focus on screening older adults who have not undergone screening. Unfortunately, U.S. population adherence to CRC screening remains below 70% with little improvement since 2010. Only after the older population is fully screened should our attention shift to younger populations.
Disparities: The individuals most likely to undergo screening are unlikely to be the individuals most likely to benefit. African Americans have a higher age-related incidence of CRC but have the lowest screening rates in the U.S. compared with other racial and ethnic groups. This relates to not only reduced access but also reduced utilization. It is a concern that, by increasing the pool of individuals recommended for screening, we may also reduce access to those who may benefit most.
The ACS recommendations to go low may reduce colorectal cancer mortality in younger adults; however, our lack of understanding about the biology of the cancer hampers our ability to recommend the optimal screening strategy, sacrifices value, and may increase disparities in cancer outcomes.
John M. Inadomi, MD, AGAF, is a Cyrus E. Rubin Professor of Medicine and head of the division of gastroenterology at the University of Washington School of Medicine, Seattle. He has no conflicts.
The American Cancer Society recommends all U.S. adults at average risk of colorectal cancer (CRC) undergo screening starting at age 45 years.
That update to ACS recommendations is based on an increasing burden of CRC in younger individuals, microsimulation modeling results, and a “reasonable expectation” that screening tests will perform as well in adults aged 45-49 years as they do in older adults, members of the ACS Guideline Development Group said in the guideline, which was published in CA: A Cancer Journal for Clinicians.
Starting screening at age 45 contrasts with recommendations from the U.S. Preventive Services Task Force (USPSTF), which in 2016 gave an “A” recommendation for CRC screening from 50 to 75 years of age. At the time, the USPSTF noted a modest increase in life-years gained by starting earlier, based on microsimulation modeling. But it concluded that available evidence best supported starting at age 50.
The updated ACS guidelines are based in part on a modeling study that the authors say extends the previous analysis conducted for the USPSTF.
“The recommendation places a high value on the potential years of life saved, addresses anticipated rising incidence going forward, and is expected to contribute to the reduction in disparities in incidence before age 50 years in some racial groups,” the ACS guideline authors added.
The recommendation to start screening at age 45 is a “qualified” recommendation, the authors said, given the limitations of the current evidence base. Most studies to date have been focused on older individuals, in keeping with long-standing recommendations to start screening at age 50.
The move downward in screening age recommendation acknowledges one of the most “significant and disturbing” developments in CRC, the guideline’s authors said: the marked increase in incidence among younger individuals.
While CRC incidence and mortality have been declining in adults aged 55 years and older, recent studies cited in the ACS guideline document show a 51% increase in incidence from 1994 to 2014 – and an 11% increase in mortality from 2005 to 2015 – for adults younger than 55 years.
The current age-specific incidence rate for adults 45-49 years is 31.4 per 100,000, compared with 58.4 per 100,000 in adults 50-54 years. However, the ACS guideline authors said the higher rate in the older cohort is partly influenced by more frequent screening. “The true underlying risk in adults aged 45-49 years is likely closer to the risk in adults aged 50-54 years than the most recent age-specific rates would suggest,” they wrote.
Since patients in this age range have not been routinely screened before, the ACS recommendation is based on modeling. Now we need to analyze the outcomes of early screening to identify which patients will benefit most. Choices for screening include either a structural examination or a high-sensitivity stool-based test, according to the guideline, which doesn’t state a preference for any particular test.
The AGA, in their statement in response, noted that with CRC rates rising in people younger than age 50, it is appropriate to consider beginning routine screening at age 45. The statement continues “Since patients in this age range have not been previously routinely screened, the ACS recommendation is based on modeling. Now we need to analyze the outcomes of early screening to identify which patients will benefit most.”
In addition to Dr. Wolf, members of the ACS Guideline Development Group received no compensation.
SOURCE: Wolf AMD et al. CA Cancer J Clin. 2018 May 30. doi: 10.3322/caac.21457.
FROM CA: A CANCER JOURNAL FOR CLINICIANS
Evaluation of Seizures and Seizure-like Activity in the Emergency Department: Part 1
Seizures are a common emergency presentation, accounting for approximately 1% of all ED visits.1 Presentations include patients with epilepsy, new-onset or first-time seizure (whether provoked or unprovoked), and other diagnostic entities that can mimic seizure but are not a true epileptic seizure. Even after a detailed and comprehensive evaluation, correctly determining the diagnosis can still be a challenge.2
Seizure Phases
The International League Against Epilepsy (ILAE) defines epileptic seizures as “a transient occurrence of signs and/or symptoms due to abnormal excessive or synchronous neuronal activity in the brain.”3 There are typically three phases of a seizure—the aural, ictal, and postictal states.
Aural Phase. Patients may or may not experience an aura prior to seizure onset. An aura can manifest as a sense of déjà vu or a rising sensation in the abdomen, abnormal taste or smell, or autonomic changes. These are not warning signs of a seizure but rather an early manifestation of a focal seizure before there has been enough electrical spread to cause cognitive or motor symptoms.
Ictal Phase. The second stage of seizure, the ictal phase, is the typical cognitive or motor manifestations of seizure activity. Seizures can last several seconds to minutes, but the majority has a duration of less than 1 minute.
Postictal Phase. The postictal period occurs after the active phase of seizure and is characterized by confusion, altered mental status, and somnolence. The postictal period can last from several minutes to hours and can result in suppression of function; including cognitive or motor deficits such as Todd’s paralysis wherein a patient experiences transient paralysis confined to one hemisphere.4
Etiology and Classification
Seizures can be subdivided based on two different categories: etiology or origin of abnormal electrical impulses within the brain. To categorize seizures based on etiology, the clinician must determine whether the seizure was brought on by an identifiable cause.
Provoked Seizure
Provoked seizures are also referred to as acute symptomatic seizures, because they present within 7 days of a systemic insult, whether it be secondary to an electrolyte abnormality (eg, hyponatremia, hypoglycemia, hypercalcemia), substance withdrawal (eg, alcohol, benzodiazepines), toxic ingestion, infection, central nervous system lesions, or head injury. The aforementioned does not represent a comprehensive list, but rather some of the more common etiologies of seizures.2,5
Unprovoked Seizure
An unprovoked seizure occurs without an identifiable acute precipitating insult. These types of seizures are generally more consistent with epilepsy or are due to a remote systemic insult greater than 7 days prior. Examples include patients who have a history of stroke, traumatic brain injury, or congenital brain malformation.2,5
Epilepsy is described as a seizure disorder where recurrent, usually unprovoked seizures occur. Determining the probable etiology of a seizure can be important when pursuing proper objective evaluation and work up, as we will discuss in this article.
Seizure Type
Seizures can also be classified as being generalized or focal, depending on the probable origin of the abnormal electrical discharges within the brain. This classification system is widely used and was developed by the ILAE.6
Generalized Seizures
Generalized seizures have bilateral cortical involvement at the onset of presentation and are associated with loss of consciousness. This is determined through electroencephalogram (EEG) monitoring because focal seizures, where the initiation of abnormal electrical discharges are located in one cortical hemisphere or localized area of the brain, may rapidly spread to both hemispheres and appear very similar to a primary generalized seizure.
Tonic-Clonic Seizures. The most colloquial type of generalized seizure is a tonic-clonic seizure. “Tonic” refers to the muscle stiffness or rigidity that occurs during this type of seizure, and “clonic” describes the rhythmic jerking of these muscles.
Nontonic-Clonic Seizures. Other types of generalized seizures include absence seizures (brief staring episodes or an arrest in behavior), atonic seizures (loss of muscle tone), and myoclonic seizures (brief, sudden muscular contractions).5
Focal Seizures
Focal seizures are diagnosed when the history, clinical presentation, and EEG findings support the localization of abnormal electrical neuronal discharges to one hemisphere of the brain. Loss of consciousness does not always occur during a focal seizure, and the ILAE recently updated the terminology in this regard to this distinction in 2017. Instead of classifying focal seizures as simple partial or complex partial in relation to the preservation of consciousness, the terminology has now changed to focal aware (no loss of consciousness) and focal impaired awareness (affected consciousness). Focal seizures can have not only motor manifestations, but may also present with sensory, autonomic, or psychic symptoms, depending on the anatomic location of the abnormal neuronal activity.5-6
Evaluation in the ED Setting
The classification of a seizure does not often change the ED management of seizures, but it is important to be able to recognize that seizures may present with different clinical appearances. It is also important to remember that not all seizure-like activity is due to epilepsy or abnormal neuronal discharges. There are several other conditions that can present with physical symptoms and characteristics similar to seizure, and are often misdiagnosed as seizures. The next section describes several of these seizure mimics and how to recognize or differentiate them from seizures through a careful history, physical examination, and laboratory evaluation; as one diagnostic tool, the EEG, is not routinely available to the emergency physician (EP).
Seizure Mimics
Syncope
Syncope is secondary to decreased cerebral perfusion, which results in brief loss of consciousness and postural tone, and often with brief convulsions. Myoclonic jerking lasting a few seconds can be seen in many syncopal episodes, and if present is termed convulsive syncope. Following any syncopal episode, patients generally return to their baseline mental status without a postictal period. A prodrome of pallor and sweating can be helpful clues to identify a syncopal episode. In addition, a patient’s eyes may remain open during the event.
There are several types of syncope: cardiac, orthostatic, or neurocardiogenic (vasovagal). History and physical examination can help distinguish syncope from seizure.
Cardiac Syncope. Cardiogenic causes of syncope may be seen in elderly patients who lack a prodrome prior to the event, chest pain may have been present, the event may occur with exercise, or there is evidence of underlying heart disease. An electrocardiogram (ECG) should be done to detect cardiac dysrhythmias. Orthostatic Syncope. Vital signs may be useful in assessing for an orthostatic cause of syncope (drop in systolic blood pressure [BP] by 20 mm Hg or more and drop in diastolic BP by 10 mm Hg or more within 3 minutes of standing), though orthostatic hypotension is common in the elderly.7-8 Dysautonomia as a cause of orthostatic hypotension may show a delayed drop in BP after standing 5 to 10 minutes, in contrast to hypovolemia which tends to be present with immediate standing.Neurocardiogenic Syncope. Neurocardiogenic syncope, a somewhat confusing term, is perhaps better described as a reflex syncope, or simple faint. Often this is referred to as “vasovagal” syncope. Typically, there are physical or psychological noxious stimuli prior to the brief loss of consciousness and postural tone. Pain or strong emotions are common triggers.
Convulsive Concussion
Another seizure mimic is convulsive concussion in which the patient exhibits nonepileptic movement following a closed head injury. It is hypothesized that these post-traumatic convulsions are due to transient functional abnormalities, rather than structural brain injury. In one study, 22 cases of concussive convulsions were identified in which tonic-clonic convulsions began within 2 seconds of impact, and lasted for up to 150 seconds. These patients generally have good outcomes and do not require antiepileptic treatment; they also do not need to abstain from sports or other physical activities.9-11
Movement Disorders
Certain movement disorders can appear similar to seizures with sustained muscle contractions, repetitive movements, dystonias, or even abnormal posturing. However, these abnormal movements are generally painful and there is often impairment of consciousness. They may be genetic in nature or secondary to a neurologic disease or medications such as neuroleptics or antipsychotics.
Psychogenic Nonepileptic Seizures
Psychogenic nonepileptic seizures (PNES) are defined as episodes of altered movements or sensations that appear similar to epileptic seizures, but have an underlying psychological etiology rather than abnormal neuronal discharges. Seventy percent of these patients have a psychiatric illness, such as depression, post-traumatic stress disorder, or personality disorders. Features that can help distinguish PNES from epileptic seizures include long duration, fluctuating symptoms, asynchronous or non-rhythmic movements, pelvic thrusting, side-to-side head or body movements, closed eyes, lack of tongue biting, memory recall, crying, or suppression by distraction. Laboratory testing provides little benefit, aside from a lactate level, which if elevated can suggest a possible epileptic etiology.12 These cases may require consultation with neurology and psychiatry or video-EEG monitoring to correctly diagnose.13-14
Other non-epileptic and possible seizure mimic diagnoses to be considered include stroke, transient ischemic attack, migraine headache, and sleep disorders.
Evaluation
When assessing a patient presenting with seizure-like activity or altered mental status, the clinician must keep a broad differential diagnosis. The first step is to evaluate the ABCs. Once that is completed, a blood glucose should be obtained, as it is a quick test and can determine whether hypoglycemia is the likely cause. Intravenous (IV) access should be obtained and routine labs ordered, including a complete blood count (CBC), a comprehensive metabolic profile (CMP), magnesium, urinalysis, ECG, and lactate. Other labs that may be of clinical utility in certain cases include anticonvulsant levels (in patients that are on these medications), toxicology screens, and cerebrospinal fluid studies, if indicated. It is important to note that anticonvulsant reference ranges are trough values, so levels that are drawn within a few hours of the last dose taken
Patient Disposition
The management and ultimate disposition of a patient with a seizure depends on the underlying cause, and whether the patient has neurologic deficits and/or is back to their baseline mental status. For patients presenting with a first-time seizure and have returned to baseline, the American College of Emergency Physicians’ (ACEP) clinical policy states that precipitating medical conditions should be identified and addressed accordingly if it is a provoked seizure.
If patients present with a first-time unprovoked seizure and do not have evidence of brain injury or neurologic disease (ie, persistent altered mental status or abnormal neurologic examination), then the EP does not need to initiate antiepileptic medications. If there is evidence of neurologic disease or brain injury in an unprovoked seizure, then the EP may either choose to initiate antiepileptic medications or choose to defer, pending consultation with neurology. This group of patients (first-time unprovoked seizure back to baseline) do not need to be admitted to the hospital under the premise that they have a negative workup, to include glucose, CT scan (if indicated), ECG, CBC, and CMP. They must also have normal vital signs, be advised regarding seizure precautions such as not to drive until further medical evaluation (with duration perhaps being set by state law), and have good social support. They will require close follow up for further evaluation and definitive diagnosis, which may include head imaging, if not already performed in the ED, and EEG.
Patients with a history of epilepsy can have recurrent seizures that are either provoked or unprovoked. If the seizure appears clinically similar to their previous seizures, then causes that could lower the seizure threshold should be investigated; including compliance with antiepileptic medications (obtain serum levels), infection (urinalysis and/or chest X-ray), sleep deprivation, electrolyte imbalances, or medications known to lower seizure threshold (eg, certain antibiotics such as fluoroquinolones, antidepressants such as bupropion and venlafaxine, and antipsychotics such as clozapine). These underlying causes should be treated accordingly. If a patient has been noncompliant with their medications, a loading dose can be given in the ED, although there are no definitive studies that either support or debunk this practice. If it is a true, unprovoked seizure and the patient is compliant with their antiepileptic medication, it is reasonable to discuss medication regimen changes with the patient’s neurologist.17A patient that presents with seizure-like activity and does not return back to their baseline mental status requires a more immediate and comprehensive evaluation. Persistent altered mental status has a vast differential diagnosis, and is outside the scope of this article, but if seizures were part of the clinical presentation, the possibility of non-convulsive epilepticus should be considered. These patients may require treatment with medications (usually IV benzodiazepines), admission to the hospital, neurology consultation, EEG, imaging (CT vs MRI), and +/- lumbar puncture depending on the clinical scenario.
Status epilepticus will be further discussed in part 2 of this review.
1. Pallin DJ, Goldstein JN, Moussally JS, Pelletier AJ, Green AR, Carmargo CA Jr. Seizure visits in the US emergency departments: epidemiology and potential disparities in care. Int J Emerg Med. 2008;1(2):97-105.
2. Huff JS, Melnick ER, Tomaszewski CA, Thiessen ME, Jagoda AS, Fesmire FM; American College of Emergency Physicians. Clinical policy: critical issues in the evaluation and management of adult patients presenting to the emergency department with seizures. Ann Emerg Med. 2014;63(4):437-447.e15. doi:10.1016/j.annemergmed.2014.01.018.
3. Fisher RS, van Emde Boas W, Blume W, et al. Epileptic seizures and epilepsy: definitions proposed by the International League Against Epilepsy (ILAE) and the International Bureau for Epilepsy (IBE). Epilepsia. 2005;46(4):470-472.
4. Webb J, Long B, Koyfman A. An emergency medicine-focused review of seizure mimics. J Emerg Med. 2017;52(5):645-653. doi:10.1016/j.jemermed.2016.11.002.
5. Huff JS, Fountain NB. Pathophysiology and definitions of seizures and status epilepticus. Emerg Med Clin North Am. 2011;29(1):1-13. doi:10.1016/j.emc.2010.08.001.
6. Fisher RS, Cross JH, French JA, et al. Operational classification of seizure types by the International League Against Epilepsy: Position Paper of the ILAE Commission for Classification and Terminology. Epilepsia. 2017;58(4):522-530. doi:10.1111/epi.13670.
7. Kanjwal K, Karabin B, Kanjwal Y, Grubb BP. Differentiation of convulsive syncope from epilepsy with an implantable loop recorder. Int J Med Sci. 2009;6(6):296-300.
8. Ozkara C, Metin B, Kucukoglu S. Convulsive syncope: a condition to be differentiated from epilepsy. Epileptic Disord. 2009;11(4):315-319. doi:10.1684/epd.2009.0281.
9. McCrory PR, Berkovic SF. Concussive convulsions. Incidence in sport and treatment recommendations. Sports Med. 1998;25(2);131-136.
10. Ellis MJ, Wennberg R. Convulsions in a 17-year-old boy after a head injury sustained while playing hockey. CMAJ. 2016;188(6):443-445. doi:10.1503/cmaj.150124.
11. McCrory PR, Bladin PF, Berkovic SF. Retrospective study of concussive convulsions in elite Australian rules and rugby league footballers: phenomenology, aetiology, and outcome. BMJ. 1997;314(7075):171-174.
12. Webb JL, Long B. Seizure mimics: pearls and pitfalls. emDocs Web site. http://www.emdocs.net/seizure-mimics-pearls-pitfalls/. Accessed May 15, 2018.
13. Chen DK, LaFrance WC Jr. Diagnosis and treatment of nonepileptic seizures. Continuum (Mineapp Minn). 2016;22(1):116-131. doi:10.1212/CON.0000000000000282.
14. O’Sullivan SS, Redwood RI, Hunt D, McMahon EM, O’Sullivan S. Recognition of psychogenic non-epileptic seizures: a curable neurophobia? J Neurol Neurosurg Psychiatry. 2013;84(2):228-231. doi:10.1136/jnnp-2012-303062.
15. Clinical policy for the initial approach to patients presenting with a chief complaint of seizure, who are not in status epilepticus. Ann Emerg Med. 1993;22(5):875-883.
16. Reassessment: neuroimaging in the emergency patient presenting with seizure (an evidence-based review): report of the Therapeutics and Technology Assessment Subcommittee of the American Academy of Neurology. Neurology. 2007;69(18):1772-1780.
17. Montouris GD, Jagoda AS. Management of breakthrough seizures in the emergency department: continuity of patient care. Curr Med Res Opin. 2007;23(7):1583-1592.
Seizures are a common emergency presentation, accounting for approximately 1% of all ED visits.1 Presentations include patients with epilepsy, new-onset or first-time seizure (whether provoked or unprovoked), and other diagnostic entities that can mimic seizure but are not a true epileptic seizure. Even after a detailed and comprehensive evaluation, correctly determining the diagnosis can still be a challenge.2
Seizure Phases
The International League Against Epilepsy (ILAE) defines epileptic seizures as “a transient occurrence of signs and/or symptoms due to abnormal excessive or synchronous neuronal activity in the brain.”3 There are typically three phases of a seizure—the aural, ictal, and postictal states.
Aural Phase. Patients may or may not experience an aura prior to seizure onset. An aura can manifest as a sense of déjà vu or a rising sensation in the abdomen, abnormal taste or smell, or autonomic changes. These are not warning signs of a seizure but rather an early manifestation of a focal seizure before there has been enough electrical spread to cause cognitive or motor symptoms.
Ictal Phase. The second stage of seizure, the ictal phase, is the typical cognitive or motor manifestations of seizure activity. Seizures can last several seconds to minutes, but the majority has a duration of less than 1 minute.
Postictal Phase. The postictal period occurs after the active phase of seizure and is characterized by confusion, altered mental status, and somnolence. The postictal period can last from several minutes to hours and can result in suppression of function; including cognitive or motor deficits such as Todd’s paralysis wherein a patient experiences transient paralysis confined to one hemisphere.4
Etiology and Classification
Seizures can be subdivided based on two different categories: etiology or origin of abnormal electrical impulses within the brain. To categorize seizures based on etiology, the clinician must determine whether the seizure was brought on by an identifiable cause.
Provoked Seizure
Provoked seizures are also referred to as acute symptomatic seizures, because they present within 7 days of a systemic insult, whether it be secondary to an electrolyte abnormality (eg, hyponatremia, hypoglycemia, hypercalcemia), substance withdrawal (eg, alcohol, benzodiazepines), toxic ingestion, infection, central nervous system lesions, or head injury. The aforementioned does not represent a comprehensive list, but rather some of the more common etiologies of seizures.2,5
Unprovoked Seizure
An unprovoked seizure occurs without an identifiable acute precipitating insult. These types of seizures are generally more consistent with epilepsy or are due to a remote systemic insult greater than 7 days prior. Examples include patients who have a history of stroke, traumatic brain injury, or congenital brain malformation.2,5
Epilepsy is described as a seizure disorder where recurrent, usually unprovoked seizures occur. Determining the probable etiology of a seizure can be important when pursuing proper objective evaluation and work up, as we will discuss in this article.
Seizure Type
Seizures can also be classified as being generalized or focal, depending on the probable origin of the abnormal electrical discharges within the brain. This classification system is widely used and was developed by the ILAE.6
Generalized Seizures
Generalized seizures have bilateral cortical involvement at the onset of presentation and are associated with loss of consciousness. This is determined through electroencephalogram (EEG) monitoring because focal seizures, where the initiation of abnormal electrical discharges are located in one cortical hemisphere or localized area of the brain, may rapidly spread to both hemispheres and appear very similar to a primary generalized seizure.
Tonic-Clonic Seizures. The most colloquial type of generalized seizure is a tonic-clonic seizure. “Tonic” refers to the muscle stiffness or rigidity that occurs during this type of seizure, and “clonic” describes the rhythmic jerking of these muscles.
Nontonic-Clonic Seizures. Other types of generalized seizures include absence seizures (brief staring episodes or an arrest in behavior), atonic seizures (loss of muscle tone), and myoclonic seizures (brief, sudden muscular contractions).5
Focal Seizures
Focal seizures are diagnosed when the history, clinical presentation, and EEG findings support the localization of abnormal electrical neuronal discharges to one hemisphere of the brain. Loss of consciousness does not always occur during a focal seizure, and the ILAE recently updated the terminology in this regard to this distinction in 2017. Instead of classifying focal seizures as simple partial or complex partial in relation to the preservation of consciousness, the terminology has now changed to focal aware (no loss of consciousness) and focal impaired awareness (affected consciousness). Focal seizures can have not only motor manifestations, but may also present with sensory, autonomic, or psychic symptoms, depending on the anatomic location of the abnormal neuronal activity.5-6
Evaluation in the ED Setting
The classification of a seizure does not often change the ED management of seizures, but it is important to be able to recognize that seizures may present with different clinical appearances. It is also important to remember that not all seizure-like activity is due to epilepsy or abnormal neuronal discharges. There are several other conditions that can present with physical symptoms and characteristics similar to seizure, and are often misdiagnosed as seizures. The next section describes several of these seizure mimics and how to recognize or differentiate them from seizures through a careful history, physical examination, and laboratory evaluation; as one diagnostic tool, the EEG, is not routinely available to the emergency physician (EP).
Seizure Mimics
Syncope
Syncope is secondary to decreased cerebral perfusion, which results in brief loss of consciousness and postural tone, and often with brief convulsions. Myoclonic jerking lasting a few seconds can be seen in many syncopal episodes, and if present is termed convulsive syncope. Following any syncopal episode, patients generally return to their baseline mental status without a postictal period. A prodrome of pallor and sweating can be helpful clues to identify a syncopal episode. In addition, a patient’s eyes may remain open during the event.
There are several types of syncope: cardiac, orthostatic, or neurocardiogenic (vasovagal). History and physical examination can help distinguish syncope from seizure.
Cardiac Syncope. Cardiogenic causes of syncope may be seen in elderly patients who lack a prodrome prior to the event, chest pain may have been present, the event may occur with exercise, or there is evidence of underlying heart disease. An electrocardiogram (ECG) should be done to detect cardiac dysrhythmias. Orthostatic Syncope. Vital signs may be useful in assessing for an orthostatic cause of syncope (drop in systolic blood pressure [BP] by 20 mm Hg or more and drop in diastolic BP by 10 mm Hg or more within 3 minutes of standing), though orthostatic hypotension is common in the elderly.7-8 Dysautonomia as a cause of orthostatic hypotension may show a delayed drop in BP after standing 5 to 10 minutes, in contrast to hypovolemia which tends to be present with immediate standing.Neurocardiogenic Syncope. Neurocardiogenic syncope, a somewhat confusing term, is perhaps better described as a reflex syncope, or simple faint. Often this is referred to as “vasovagal” syncope. Typically, there are physical or psychological noxious stimuli prior to the brief loss of consciousness and postural tone. Pain or strong emotions are common triggers.
Convulsive Concussion
Another seizure mimic is convulsive concussion in which the patient exhibits nonepileptic movement following a closed head injury. It is hypothesized that these post-traumatic convulsions are due to transient functional abnormalities, rather than structural brain injury. In one study, 22 cases of concussive convulsions were identified in which tonic-clonic convulsions began within 2 seconds of impact, and lasted for up to 150 seconds. These patients generally have good outcomes and do not require antiepileptic treatment; they also do not need to abstain from sports or other physical activities.9-11
Movement Disorders
Certain movement disorders can appear similar to seizures with sustained muscle contractions, repetitive movements, dystonias, or even abnormal posturing. However, these abnormal movements are generally painful and there is often impairment of consciousness. They may be genetic in nature or secondary to a neurologic disease or medications such as neuroleptics or antipsychotics.
Psychogenic Nonepileptic Seizures
Psychogenic nonepileptic seizures (PNES) are defined as episodes of altered movements or sensations that appear similar to epileptic seizures, but have an underlying psychological etiology rather than abnormal neuronal discharges. Seventy percent of these patients have a psychiatric illness, such as depression, post-traumatic stress disorder, or personality disorders. Features that can help distinguish PNES from epileptic seizures include long duration, fluctuating symptoms, asynchronous or non-rhythmic movements, pelvic thrusting, side-to-side head or body movements, closed eyes, lack of tongue biting, memory recall, crying, or suppression by distraction. Laboratory testing provides little benefit, aside from a lactate level, which if elevated can suggest a possible epileptic etiology.12 These cases may require consultation with neurology and psychiatry or video-EEG monitoring to correctly diagnose.13-14
Other non-epileptic and possible seizure mimic diagnoses to be considered include stroke, transient ischemic attack, migraine headache, and sleep disorders.
Evaluation
When assessing a patient presenting with seizure-like activity or altered mental status, the clinician must keep a broad differential diagnosis. The first step is to evaluate the ABCs. Once that is completed, a blood glucose should be obtained, as it is a quick test and can determine whether hypoglycemia is the likely cause. Intravenous (IV) access should be obtained and routine labs ordered, including a complete blood count (CBC), a comprehensive metabolic profile (CMP), magnesium, urinalysis, ECG, and lactate. Other labs that may be of clinical utility in certain cases include anticonvulsant levels (in patients that are on these medications), toxicology screens, and cerebrospinal fluid studies, if indicated. It is important to note that anticonvulsant reference ranges are trough values, so levels that are drawn within a few hours of the last dose taken
Patient Disposition
The management and ultimate disposition of a patient with a seizure depends on the underlying cause, and whether the patient has neurologic deficits and/or is back to their baseline mental status. For patients presenting with a first-time seizure and have returned to baseline, the American College of Emergency Physicians’ (ACEP) clinical policy states that precipitating medical conditions should be identified and addressed accordingly if it is a provoked seizure.
If patients present with a first-time unprovoked seizure and do not have evidence of brain injury or neurologic disease (ie, persistent altered mental status or abnormal neurologic examination), then the EP does not need to initiate antiepileptic medications. If there is evidence of neurologic disease or brain injury in an unprovoked seizure, then the EP may either choose to initiate antiepileptic medications or choose to defer, pending consultation with neurology. This group of patients (first-time unprovoked seizure back to baseline) do not need to be admitted to the hospital under the premise that they have a negative workup, to include glucose, CT scan (if indicated), ECG, CBC, and CMP. They must also have normal vital signs, be advised regarding seizure precautions such as not to drive until further medical evaluation (with duration perhaps being set by state law), and have good social support. They will require close follow up for further evaluation and definitive diagnosis, which may include head imaging, if not already performed in the ED, and EEG.
Patients with a history of epilepsy can have recurrent seizures that are either provoked or unprovoked. If the seizure appears clinically similar to their previous seizures, then causes that could lower the seizure threshold should be investigated; including compliance with antiepileptic medications (obtain serum levels), infection (urinalysis and/or chest X-ray), sleep deprivation, electrolyte imbalances, or medications known to lower seizure threshold (eg, certain antibiotics such as fluoroquinolones, antidepressants such as bupropion and venlafaxine, and antipsychotics such as clozapine). These underlying causes should be treated accordingly. If a patient has been noncompliant with their medications, a loading dose can be given in the ED, although there are no definitive studies that either support or debunk this practice. If it is a true, unprovoked seizure and the patient is compliant with their antiepileptic medication, it is reasonable to discuss medication regimen changes with the patient’s neurologist.17A patient that presents with seizure-like activity and does not return back to their baseline mental status requires a more immediate and comprehensive evaluation. Persistent altered mental status has a vast differential diagnosis, and is outside the scope of this article, but if seizures were part of the clinical presentation, the possibility of non-convulsive epilepticus should be considered. These patients may require treatment with medications (usually IV benzodiazepines), admission to the hospital, neurology consultation, EEG, imaging (CT vs MRI), and +/- lumbar puncture depending on the clinical scenario.
Status epilepticus will be further discussed in part 2 of this review.
1. Pallin DJ, Goldstein JN, Moussally JS, Pelletier AJ, Green AR, Carmargo CA Jr. Seizure visits in the US emergency departments: epidemiology and potential disparities in care. Int J Emerg Med. 2008;1(2):97-105.
2. Huff JS, Melnick ER, Tomaszewski CA, Thiessen ME, Jagoda AS, Fesmire FM; American College of Emergency Physicians. Clinical policy: critical issues in the evaluation and management of adult patients presenting to the emergency department with seizures. Ann Emerg Med. 2014;63(4):437-447.e15. doi:10.1016/j.annemergmed.2014.01.018.
3. Fisher RS, van Emde Boas W, Blume W, et al. Epileptic seizures and epilepsy: definitions proposed by the International League Against Epilepsy (ILAE) and the International Bureau for Epilepsy (IBE). Epilepsia. 2005;46(4):470-472.
4. Webb J, Long B, Koyfman A. An emergency medicine-focused review of seizure mimics. J Emerg Med. 2017;52(5):645-653. doi:10.1016/j.jemermed.2016.11.002.
5. Huff JS, Fountain NB. Pathophysiology and definitions of seizures and status epilepticus. Emerg Med Clin North Am. 2011;29(1):1-13. doi:10.1016/j.emc.2010.08.001.
6. Fisher RS, Cross JH, French JA, et al. Operational classification of seizure types by the International League Against Epilepsy: Position Paper of the ILAE Commission for Classification and Terminology. Epilepsia. 2017;58(4):522-530. doi:10.1111/epi.13670.
7. Kanjwal K, Karabin B, Kanjwal Y, Grubb BP. Differentiation of convulsive syncope from epilepsy with an implantable loop recorder. Int J Med Sci. 2009;6(6):296-300.
8. Ozkara C, Metin B, Kucukoglu S. Convulsive syncope: a condition to be differentiated from epilepsy. Epileptic Disord. 2009;11(4):315-319. doi:10.1684/epd.2009.0281.
9. McCrory PR, Berkovic SF. Concussive convulsions. Incidence in sport and treatment recommendations. Sports Med. 1998;25(2);131-136.
10. Ellis MJ, Wennberg R. Convulsions in a 17-year-old boy after a head injury sustained while playing hockey. CMAJ. 2016;188(6):443-445. doi:10.1503/cmaj.150124.
11. McCrory PR, Bladin PF, Berkovic SF. Retrospective study of concussive convulsions in elite Australian rules and rugby league footballers: phenomenology, aetiology, and outcome. BMJ. 1997;314(7075):171-174.
12. Webb JL, Long B. Seizure mimics: pearls and pitfalls. emDocs Web site. http://www.emdocs.net/seizure-mimics-pearls-pitfalls/. Accessed May 15, 2018.
13. Chen DK, LaFrance WC Jr. Diagnosis and treatment of nonepileptic seizures. Continuum (Mineapp Minn). 2016;22(1):116-131. doi:10.1212/CON.0000000000000282.
14. O’Sullivan SS, Redwood RI, Hunt D, McMahon EM, O’Sullivan S. Recognition of psychogenic non-epileptic seizures: a curable neurophobia? J Neurol Neurosurg Psychiatry. 2013;84(2):228-231. doi:10.1136/jnnp-2012-303062.
15. Clinical policy for the initial approach to patients presenting with a chief complaint of seizure, who are not in status epilepticus. Ann Emerg Med. 1993;22(5):875-883.
16. Reassessment: neuroimaging in the emergency patient presenting with seizure (an evidence-based review): report of the Therapeutics and Technology Assessment Subcommittee of the American Academy of Neurology. Neurology. 2007;69(18):1772-1780.
17. Montouris GD, Jagoda AS. Management of breakthrough seizures in the emergency department: continuity of patient care. Curr Med Res Opin. 2007;23(7):1583-1592.
Hydroxychloroquine throws off Quantiferon-TB Gold results, study finds
ORLANDO – according to investigators from the University of Pennsylvania, Philadelphia.
Among 46 patients with lupus, dermatomyositis, or blistering diseases who had been on hydroxychloroquine within a year of testing, QuantiFERON-TB Gold (QFT-G) – the go-to TB test in many places – yielded indeterminate results in 37%. Meanwhile, just 9.6% of tests were indeterminate among 73 patients with those diseases who had not been on hydroxychloroquine (P less than .001). The findings could not be explained by concomitant use of prednisone and other immunosuppressives; there were no statistically significant differences between the groups. “This was shocking to us. We need to come up with a better screening test in this patient population,” said lead investigator Rebecca Gaffney, a research fellow at the University of Pennsylvania, and a medical student at Robert Wood Johnson Medical School, New Brunswick, NJ.*
It’s widely known that immunosuppressives interfere with QFT-G results, but antimalarials are considered immunomodulators, not immunosuppressives. The new study is probably the first to investigate the issue. The team is now pitting QFT-G against another TB blood test, the T-SPOT, in 100 patients to see if it’s a better option, in a trial that they expect to complete in 2018.
The investigators have a hunch that the T-SPOT might be better because, while QFT-G measures interferon-gamma concentrations in response to TB antigens, the T-SPOT “counts cells first to make sure you have a standard amount of cells, then looks at how many cells are releasing interferon-gamma,” Ms. Gaffney said, adding that “it seems like a more sensitive test,” especially for lymphocytopenic autoimmune patients. “We are really excited to see if there’s a better test for our patients, given all the clinical trials we do. We want to see what’s best, so there’s no barrier to receiving therapy.”
Subjects were around 50 years old on average, and the majority were women. Most were white, and about 20% were black.
There was no industry funding for the work, and Ms. Gaffney reported no disclosures.
*This article was updated on June 13. 2018.
REPORTING FROM ICCLE 2018
Electrocardiography: Flecainide Toxicity
Case
An 86-year-old woman, who recently had been seen in the same facility after a ground level fall, presented to the ED with to a 2- to 3-day history of vague abdominal pain, increasing weakness, nausea, and dry heaves.
Upon examination, the patient was unable to stand due to generalized weakness She arrived at the ED via emergency medical services. Her vital signs at presentation were significant for a systolic blood pressure (BP) of 90 mm Hg with a wide complex tachycardia concerning for ventricular tachycardia. The patient’s other vital signers were: heart rate, 136 beats/min; respiratory rate 20 breaths/min; and pulse oximetry was 94% on 4 liters/min of oxygen via nasal cannula.
The patient’s medical history was significant for atrial fibrillation and an indwelling pacemaker, for which she was chronically on flecai
The initial electrocardiogram (ECG) revealed a wide complex rhythm with pacemaker spikes (Figure 1). Based on these findings, electrodes were placed on the patient in the event she required cardioversion. The patient was started on an amiodarone intravenous (IV) drip for presumptive ventricular tachycardia.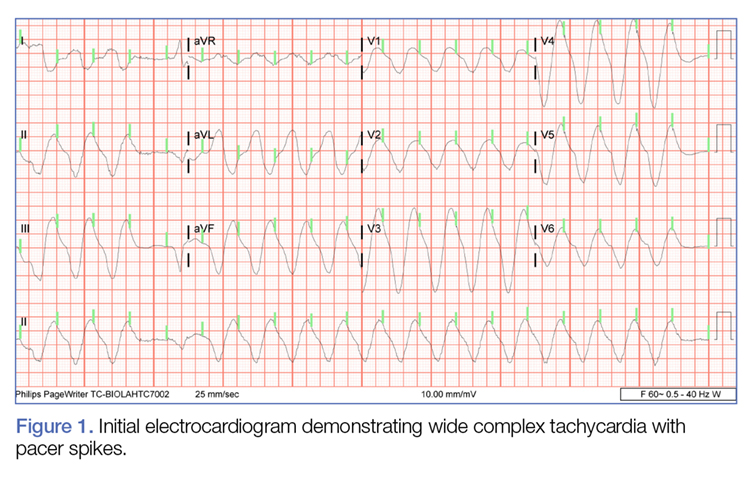
During the patient’s evaluation in the ED, she experienced transient drops in BP, which were responsive to an IV fluid bolus of normal saline, and the amiodarone drip was discontinued. The patient’s ECG findings were compared to previous ECG studies, as was her current medication list and prior health issues. After ruling-out other causes, flecainide toxicity was considered high in the differential, and she was given 1 ampule of bicarbonate IV, after which a second ECG showed heart rhythm converted from a wide-complex tachycardia to a paced rhythm, markedly improved from the initial ECG (Figure 2). Similarly, there was a marked improvement in BP.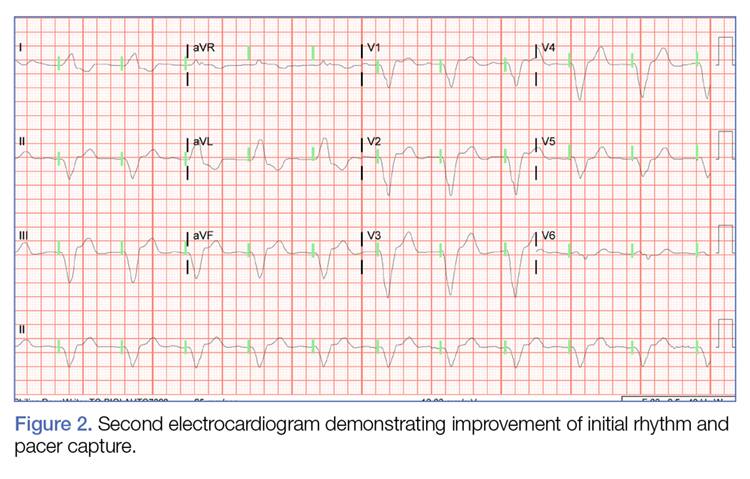
An interrogation of the patient’s pacemaker revealed an atrial flutter with a rate below detection for mode switch, with one-to-one tracking/pacing. The pacemaker was reprogrammed to divide the DDIR mode with detection rate at 120 mm Hg with mode switch activated. This was felt to be consistent with flecainide toxicity precipitating the cardiac conduction issues.
Laboratory studies showed an elevated flecainide level at 1.39 mcg/mL (upper limits of normal of 1 mcg/mL). Other studies showed worsening congestive heart failure, with a brain natriuretic peptide of 8,057 pg/mL and mild dehydration, with serum creatinine increased from her baseline of 0.9 to 1.38 mg/dL.
The patient’s abdominal pain was further evaluated and she was found to have acute cholecystitis. She was admitted to the intensive care unit with cardiology and general surgery consulting.
Discussion
Flecainide acetate was approved by the Food and Drug Administration in 1984.1It is a Vaughan-Williams class IC antiarrhythmic with a sodium channel blocker action used to treat supra ventricular arrhythmias. The CAST trial in 1989 investigated the efficacy of this class of antiarrhythmics, which resulted in a revision of its role.2 Based on this study, flecainide is not recommended for patients with structural heart disease or coronary artery disease.2,3 However, it is recommended as a first-line therapy for pharmacologic cardioversion and maintenance of normal sinus rhythm in patients with atrial fibrillation and supraventricular tachycardia4,5 without the above caveats.
Class IC agents produce a selective block at the sodium (Na+) channels, resulting in the slowing of cardiac conduction.6,7 This high affinity for Na+ channels combined with slow unbinding kinetics during diastole explain the slowing of recovery time and prolongation of the refractory period.6,8,9 These electrophysiologic properties all can increase the PR, QRS, and QT interval duration. The QT interval is not significantly affected, as most of the QT prolongation is due to the QRS widening.6,10,11 Widening of the QRS by greater than 25% as compared to the baseline value is used as the threshold to decrease dosing or discontinue the use of flecainide.3The toxic effects of flecainide on cardiac conduction can produce prolonged QRS duration of up to 50%, and PR interval up to 30%, especially in rapid heart rates. Signs of intoxication are difficult to discern owing to its nonspecific presentation. A well-documented, but under-recognized, presentation of flecainide toxicity is the transformation of atrial fibrillation to atrial flutter.5,7,9,11-13 The reported rate of this pro arrhythmic effect can be as high as 3.5% to 5%.14,15Flecainide toxicity can occur secondary to chronic ingestion and may be precipitated in mild renal failure. The majority of flecainide is renally excreted and the half-life is 20 hours. Maximum therapeutic effect is seen between levels of 0.2 to 1 mcg/mL with levels greater than 0.7 to 1 mcg/mL associated with adverse effects.9 Systemic effects include dizziness and visual disturbances. A high degree of suspicion for flecainide toxicity is required when the patient’s initial presentation is nonspecific. In this circumstance, real-time bedside interrogation of the pacemaker is invaluable. Early diagnosis and treatment minimizes the risk for adverse sequelae, including death. Treatment includes increasing the excretion of flecainide, symptomatic support (including pacemaker placement, intravenous fat emulsion, or extracorporeal circulatory support) and administration of sodium bicarbonate, to transiently reverse the effect of the sodium channel blockade, in severe cases.15-17
1. Hudak JM, Banitt EH, Schmid JR. Discovery and development of flecainide. Am J Cardiol. 1984;53(5):17B-20B.
2. Cardiac Arrhythmia Suppression Trial (CAST) Investigators. Preliminary report: effect of encainide and flecainide on mortality in a randomized trial of arrhythmia suppression after myocardial infarction. The Cardiac Arrhythmia Suppression Trial (CAST). N Engl J Med. 1989;321(6):406-412. doi:10.1056/NEJM198908103210629.
3. Andrikopoulos GK, Pastromas S, Tzeis S. Flecainide: Current status and perspectives in arrhythmia management. World J Cardiol. 2015;7(2):76-85. doi:10.4330/wjc.v7.i2.76.
4. Camm AJ, Lip GY, De Caterina R, et al; ESC Committee for Practice Guidelines (CPG). 2012 focused update of the ESC Guidelines for the management of atrial fibrillation: an update of the 2010 ESC Guidelines for the management of atrial fibrillation. Developed with the special contribution of the European Heart Rhythm Association. Eur Heart J. 2012;33(21):2719-2747. doi:10.1093/eurheartj/ehs253.
5. Courand PY, Sibellas F, Ranc S, Mullier A, Kirkorian G, Bonnefoy E. Arrhythmogenic effect of flecainide toxicity. Cardiol J. 2013;20:203-205. doi:10.5603/CJ.2013.0035.
6. Holmes B, Heel RC. Flecainide. A preliminary review of its pharmacodynamic properties and therapeutic efficacy. Drugs. 1985;29(1):1-33.
7. Taylor R, Gandhi MM, Lloyd G. Tachycardia due to atrial flutter with rapid 1:1 conduction following treatment of atrial fibrillation with flecainide. Br Med J. 2010;340:b4684.
8. Roden DM, Woosley RL. Drug therapy. Flecainide. N Engl J Med. 1986;315(1):36-41.
9. Levis JT. ECG diagnosis: flecainide toxicity. Perm J. 2012;16(4):53.
10. Hellestrand KJ, Bexton RS, Nathan AW, Spurrell RA, Camm AJ. Acute electrophysiological effects of flecainide acetate on cardiac conduction and refractoriness in man. Br Heart J. 1982;48(2):140-148.
11. Rognoni A, Bertolazzi M, Peron M, et al. Electrocardiographic changes in a rare case of flecainide poisoning: a case report. Cases J. 2009;2:9137. doi:10.1186/1757-1626-2-9137.
12. Nabar A, Rodriguez LM, Timmermans C, Smeets JL, Wellens HJ. Radiofrequency ablation of “class IC atrial flutter” in patients with resistant atrial fibrillation. Am J Cardiol. 1999;83(5):785-787, A10.
13. Kola S, Mahata I, Kocheril AG. A case of flecainide toxicity. EP Lab Digest. 2015;15(5).
14. Falk RH. Proarrhythmia in patients treated for atrial fibrillation or flutter. Ann Intern Med. 1992;117(2):141-150.
15. Lloyd T, Zimmerman J, Griffin GD. Irreversible third-degree heart block and pacemaker implant in a case of flecainide toxicity. Am J Emerg Med. 2013;31(9):1418.e1-e2. doi:10.1016/j.ajem.2013.04.025.
16. Corkeron MA, van Heerden PV, Newman SM, Dusci L. Extracorporeal circulatory support in near-fatal flecainide overdose. Anaesth Intensive Care. 1999;27(4):405-408.
17. Ellsworth H, Stellpflug SJ, Cole JB, Dolan JA, Harris CR. A life-threatening flecainide overdose treated with intravenous fat emulsion. Pacing Clin Electrophysiol. 2013;36(3):e87-e89. doi:10.1111/j.1540-8159.2012.03485.x.
Case
An 86-year-old woman, who recently had been seen in the same facility after a ground level fall, presented to the ED with to a 2- to 3-day history of vague abdominal pain, increasing weakness, nausea, and dry heaves.
Upon examination, the patient was unable to stand due to generalized weakness She arrived at the ED via emergency medical services. Her vital signs at presentation were significant for a systolic blood pressure (BP) of 90 mm Hg with a wide complex tachycardia concerning for ventricular tachycardia. The patient’s other vital signers were: heart rate, 136 beats/min; respiratory rate 20 breaths/min; and pulse oximetry was 94% on 4 liters/min of oxygen via nasal cannula.
The patient’s medical history was significant for atrial fibrillation and an indwelling pacemaker, for which she was chronically on flecai
The initial electrocardiogram (ECG) revealed a wide complex rhythm with pacemaker spikes (Figure 1). Based on these findings, electrodes were placed on the patient in the event she required cardioversion. The patient was started on an amiodarone intravenous (IV) drip for presumptive ventricular tachycardia.
During the patient’s evaluation in the ED, she experienced transient drops in BP, which were responsive to an IV fluid bolus of normal saline, and the amiodarone drip was discontinued. The patient’s ECG findings were compared to previous ECG studies, as was her current medication list and prior health issues. After ruling-out other causes, flecainide toxicity was considered high in the differential, and she was given 1 ampule of bicarbonate IV, after which a second ECG showed heart rhythm converted from a wide-complex tachycardia to a paced rhythm, markedly improved from the initial ECG (Figure 2). Similarly, there was a marked improvement in BP.
An interrogation of the patient’s pacemaker revealed an atrial flutter with a rate below detection for mode switch, with one-to-one tracking/pacing. The pacemaker was reprogrammed to divide the DDIR mode with detection rate at 120 mm Hg with mode switch activated. This was felt to be consistent with flecainide toxicity precipitating the cardiac conduction issues.
Laboratory studies showed an elevated flecainide level at 1.39 mcg/mL (upper limits of normal of 1 mcg/mL). Other studies showed worsening congestive heart failure, with a brain natriuretic peptide of 8,057 pg/mL and mild dehydration, with serum creatinine increased from her baseline of 0.9 to 1.38 mg/dL.
The patient’s abdominal pain was further evaluated and she was found to have acute cholecystitis. She was admitted to the intensive care unit with cardiology and general surgery consulting.
Discussion
Flecainide acetate was approved by the Food and Drug Administration in 1984.1It is a Vaughan-Williams class IC antiarrhythmic with a sodium channel blocker action used to treat supra ventricular arrhythmias. The CAST trial in 1989 investigated the efficacy of this class of antiarrhythmics, which resulted in a revision of its role.2 Based on this study, flecainide is not recommended for patients with structural heart disease or coronary artery disease.2,3 However, it is recommended as a first-line therapy for pharmacologic cardioversion and maintenance of normal sinus rhythm in patients with atrial fibrillation and supraventricular tachycardia4,5 without the above caveats.
Class IC agents produce a selective block at the sodium (Na+) channels, resulting in the slowing of cardiac conduction.6,7 This high affinity for Na+ channels combined with slow unbinding kinetics during diastole explain the slowing of recovery time and prolongation of the refractory period.6,8,9 These electrophysiologic properties all can increase the PR, QRS, and QT interval duration. The QT interval is not significantly affected, as most of the QT prolongation is due to the QRS widening.6,10,11 Widening of the QRS by greater than 25% as compared to the baseline value is used as the threshold to decrease dosing or discontinue the use of flecainide.3The toxic effects of flecainide on cardiac conduction can produce prolonged QRS duration of up to 50%, and PR interval up to 30%, especially in rapid heart rates. Signs of intoxication are difficult to discern owing to its nonspecific presentation. A well-documented, but under-recognized, presentation of flecainide toxicity is the transformation of atrial fibrillation to atrial flutter.5,7,9,11-13 The reported rate of this pro arrhythmic effect can be as high as 3.5% to 5%.14,15Flecainide toxicity can occur secondary to chronic ingestion and may be precipitated in mild renal failure. The majority of flecainide is renally excreted and the half-life is 20 hours. Maximum therapeutic effect is seen between levels of 0.2 to 1 mcg/mL with levels greater than 0.7 to 1 mcg/mL associated with adverse effects.9 Systemic effects include dizziness and visual disturbances. A high degree of suspicion for flecainide toxicity is required when the patient’s initial presentation is nonspecific. In this circumstance, real-time bedside interrogation of the pacemaker is invaluable. Early diagnosis and treatment minimizes the risk for adverse sequelae, including death. Treatment includes increasing the excretion of flecainide, symptomatic support (including pacemaker placement, intravenous fat emulsion, or extracorporeal circulatory support) and administration of sodium bicarbonate, to transiently reverse the effect of the sodium channel blockade, in severe cases.15-17
1. Hudak JM, Banitt EH, Schmid JR. Discovery and development of flecainide. Am J Cardiol. 1984;53(5):17B-20B.
2. Cardiac Arrhythmia Suppression Trial (CAST) Investigators. Preliminary report: effect of encainide and flecainide on mortality in a randomized trial of arrhythmia suppression after myocardial infarction. The Cardiac Arrhythmia Suppression Trial (CAST). N Engl J Med. 1989;321(6):406-412. doi:10.1056/NEJM198908103210629.
3. Andrikopoulos GK, Pastromas S, Tzeis S. Flecainide: Current status and perspectives in arrhythmia management. World J Cardiol. 2015;7(2):76-85. doi:10.4330/wjc.v7.i2.76.
4. Camm AJ, Lip GY, De Caterina R, et al; ESC Committee for Practice Guidelines (CPG). 2012 focused update of the ESC Guidelines for the management of atrial fibrillation: an update of the 2010 ESC Guidelines for the management of atrial fibrillation. Developed with the special contribution of the European Heart Rhythm Association. Eur Heart J. 2012;33(21):2719-2747. doi:10.1093/eurheartj/ehs253.
5. Courand PY, Sibellas F, Ranc S, Mullier A, Kirkorian G, Bonnefoy E. Arrhythmogenic effect of flecainide toxicity. Cardiol J. 2013;20:203-205. doi:10.5603/CJ.2013.0035.
6. Holmes B, Heel RC. Flecainide. A preliminary review of its pharmacodynamic properties and therapeutic efficacy. Drugs. 1985;29(1):1-33.
7. Taylor R, Gandhi MM, Lloyd G. Tachycardia due to atrial flutter with rapid 1:1 conduction following treatment of atrial fibrillation with flecainide. Br Med J. 2010;340:b4684.
8. Roden DM, Woosley RL. Drug therapy. Flecainide. N Engl J Med. 1986;315(1):36-41.
9. Levis JT. ECG diagnosis: flecainide toxicity. Perm J. 2012;16(4):53.
10. Hellestrand KJ, Bexton RS, Nathan AW, Spurrell RA, Camm AJ. Acute electrophysiological effects of flecainide acetate on cardiac conduction and refractoriness in man. Br Heart J. 1982;48(2):140-148.
11. Rognoni A, Bertolazzi M, Peron M, et al. Electrocardiographic changes in a rare case of flecainide poisoning: a case report. Cases J. 2009;2:9137. doi:10.1186/1757-1626-2-9137.
12. Nabar A, Rodriguez LM, Timmermans C, Smeets JL, Wellens HJ. Radiofrequency ablation of “class IC atrial flutter” in patients with resistant atrial fibrillation. Am J Cardiol. 1999;83(5):785-787, A10.
13. Kola S, Mahata I, Kocheril AG. A case of flecainide toxicity. EP Lab Digest. 2015;15(5).
14. Falk RH. Proarrhythmia in patients treated for atrial fibrillation or flutter. Ann Intern Med. 1992;117(2):141-150.
15. Lloyd T, Zimmerman J, Griffin GD. Irreversible third-degree heart block and pacemaker implant in a case of flecainide toxicity. Am J Emerg Med. 2013;31(9):1418.e1-e2. doi:10.1016/j.ajem.2013.04.025.
16. Corkeron MA, van Heerden PV, Newman SM, Dusci L. Extracorporeal circulatory support in near-fatal flecainide overdose. Anaesth Intensive Care. 1999;27(4):405-408.
17. Ellsworth H, Stellpflug SJ, Cole JB, Dolan JA, Harris CR. A life-threatening flecainide overdose treated with intravenous fat emulsion. Pacing Clin Electrophysiol. 2013;36(3):e87-e89. doi:10.1111/j.1540-8159.2012.03485.x.
Sarcoidosis Resulting in Exsanguinating Esophageal Variceal Hemorrhage
Sarcoidosis is a systemic disorder of unknown etiology and is characterized by the formation of granulomas throughout various organs in the body. The most common form is pulmonary sarcoidosis, which affects 90% of patients; the second most common form is oculocutaneous sarcoidosis;1 and the third most common form is hepatic sarcoidosis, which affects 63% to 90% of patients.2 Although the liver is frequently involved in all forms of sarcoidosis, only a fraction of patients present with clinically evident liver disease.1 Approximately 20% to 30% of patients have abnormalities on liver function tests, whereas only about 1% of patients show evidence of portal hypertension and cirrhosis.3 In fact, in the English literature, there were 35 reported cases of portal hypertension due to sarcoidosis between 1949 to 2001, of which 16 of the patients had no evidence of cirrhosis.4
The diagnosis of sarcoidosis is usually made by a compilation of clinical signs and symptoms, imaging studies, and biopsies demonstrating noncaseating granulomas. This case report describes a patient who presented with portal hypertension and esophageal variceal bleeding secondary to sarcoidosis of the liver without cirrhotic changes.
Case
A 47-year-old woman presented to the ED via emergency medical services with a 1-hour history of hematemesis and melena. The patient stated that she felt fatigued, nauseated, and light-headed, but had no pain or focal weakness. Her medical history was significant for pulmonary and renal sarcoidosis. She underwent a liver biopsy 1 week prior to presentation, with a 6-day hospitalization period, due to new ascites found on examination.
The patient’s vital signs at presentation were: blood pressure (BP), 72/56 mm Hg; heart rate (HR), 133 beats/min, respiratory rate, 24 breaths/min; and temperature, 97.0oF. Oxygen saturation was 99% on room air. Physical examination revealed an alert and oriented middle-aged woman in extremis who was vomiting dark-colored blood. The cardiac and pulmonary examination revealed no extraneous sounds; the abdominal examination showed ascites with a liver edge palpable 4 cm beneath the right costal margin. The patient had no scleral icterus, palmar erythema, spider angiomata, fetor hepaticus, caput medusa, cutaneous ecchymoses, or any other stigmata of cirrhosis.
Two large-bore peripheral intravenous (IV) catheters were placed and a massive blood transfusion protocol was initiated. Packed red blood cells (PRBCs) from the resuscitation-area refrigerator were infused immediately via a pressurized fluid warmer.
After consultation with gastroenterology and general surgery services, the patient was given 1 g ceftriaxone IV, 1 g tranexamic acid IV, 20 mcg desmopressin IV, 50 mcg octreotide IV, 40 mg pantoprazole IV, 8 mg ondansetron IV, 4 g calcium gluconate IV, and 100 mg hydrocortisone IV.
Throughout the patient’s first 10 minutes in the ED, she remained persistently hypotensive and continued to vomit. Since the patient’s sensorium was intact, the team quickly discussed goals of care with her. The patient’s wishes were for maximal life-sustaining therapy, including endotracheal intubation and chest compressions, if necessary.
After this discussion, the patient was given IV etomidate and rocuronium and was intubated using video-assisted laryngoscopy. Following intubation, she was sedated with an infusion of fentanyl and underwent orogastric tube placement to aspirate stomach contents. A total of 2.5 L of frank blood were drained from the patient’s stomach.
A size 9 French single lumen left-femoral central venous catheter also was placed, through which additional blood products were infused. The patient received a total of 28 U PRBCs, fresh frozen plasma, and platelets over a 3-hour period. During transfusion, the patient’s vital signs improved to a systolic BP ranging between 110 to 120 mm Hg and an HR ranging between 90 to 110 beats/min; she did not experience any further hypotensive episodes throughout her stay in the ED.
Laboratory studies were significant for metabolic acidosis, hyperkalemia, acute on chronic anemia, leukocytosis, and acute on chronic renal failure. Synthetic function of the liver and transaminases appeared normal (Table).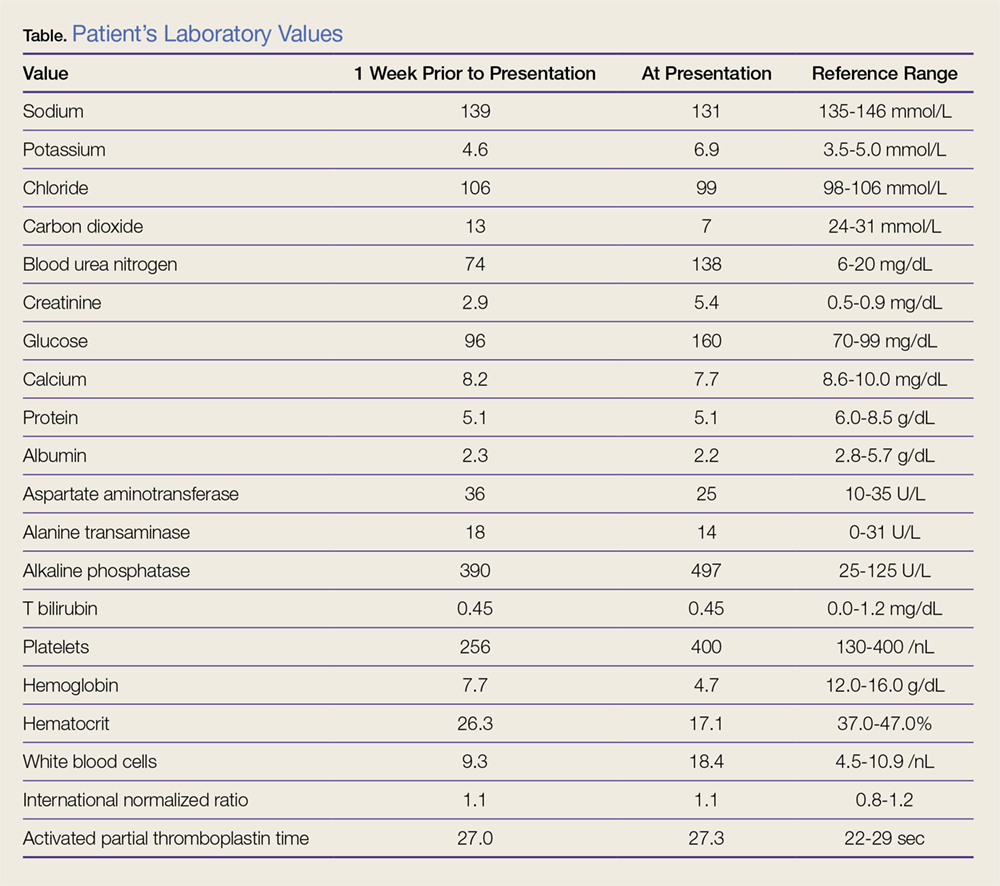
The patient’s hyperkalemia was treated with 1 g calcium chloride IV, 50 g dextrose IV, and 10 U regular insulin IV. A portable chest radiograph showed an appropriately positioned endotracheal tube, and an electrocardiogram revealed sinus tachycardia without signs of hyperkalemia. A computed tomography (CT) scan of the abdomen and pelvis from the patient’s recent hospitalization, 1 week prior to presentation, showed hepatomegaly, liver granulomas, ascites, and periportal lymphadenopathy (Figure 1).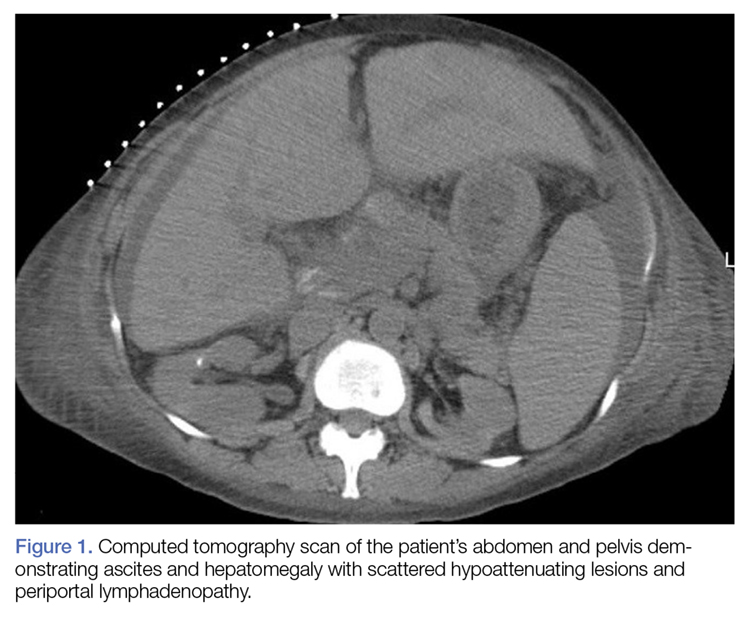
A review of the patient’s recent liver biopsy and ascitic fluid analysis revealed noncaseating granulomas compressing the hepatic sinusoids, and a serum ascites albumin gradient greater than 1.1 g/dL, implying portal hypertension without cirrhosis. The surgical team attempted to place a Sengstaken-Blakemore tube, but the device could not be positioned properly due to the patient’s narrowed esophagus.
The ED nurses cleaned the patient, preserving her dignity; thereafter the patient’s adult children visited with her briefly before she was taken for an upper endoscopy, which was performed in the ED. The endoscopy revealed actively hemorrhaging esophageal varices at the gastroesophageal junction (Figure 2). The varices were treated with endoscopic ligation; the gastroenterologist placed a total of 11 bands, resulting in cessation of bleeding.
After the endoscopy, the patient was admitted to the medical intensive care unit (ICU). Approximately 1.5 hours after arriving at the ICU, she developed renewed hematemesis. Despite efforts to control bleeding and provide hemodynamic support, the patient died 1 hour later.
Discussion
Etiology
Esophageal variceal hemorrhage is caused by pressure elevation in the portal venous system, leading to engorged esophageal veins that can bleed spontaneously. Approximately 90% of portal hypertension is due to liver cirrhosis.5 The remaining 10% of cases are primarily vascular in etiology, with endothelial dysfunction and thrombosis leading to increased portal resistance. Noncirrhotic causes of portal hypertension include malignancy, congenital diseases, viral hepatitides, vascular thromboses or fistulae, constrictive pericarditis, fatty liver of pregnancy, drugs, radiation injury, and infiltrative diseases.5
Sarcoidosis may cause noncaseating granulomas to form in the liver, leading to portal hypertension and fatal exsanguination from esophageal variceal hemorrhage. Although the lesions of sarcoidosis classically form in the lungs, any organ system may be affected.6,7 Frank cirrhosis of the liver occurs in only 1% of sarcoidosis patients; however, radiographic involvement of the liver is seen in 5% to 15% of patients.8
There are several mechanisms which may be responsible for portal hypertension in patients with sarcoidosis, including granulomas causing mass effect on the hepatic sinusoids; arteriovenous shunts within the granuloma; granulomatous phlebitis within the sinusoids; or compressive periportal lymphadenopathy.9 Regardless of the mechanism, a review of the literature demonstrates an association between sarcoidosis and symptomatic portal hypertension.2,4,10,11Although our patient ultimately died, early initiation of massive blood transfusion protocol, airway protection, attention to electrolytes, and endoscopic control of the hemorrhage source provided the best chance for survival.
Medical Therapy
The first priority in managing and treating esophageal varices is to secure the patient’s airways to prevent aspiration. Two large bore IV lines should be placed to permit rapid infusion of crystalloid fluids or blood products. Initiating antibiotics, specifically IV ceftriaxone, to patients with variceal bleeding is a class I recommendation, as this is the only intervention shown to increase patient survival.12 Although proton pump inhibitors (PPI) and somatostatin analogues (typically octreotide) are frequently given, they are both class II recommendations because there is limited evidence supporting the benefit of their use.12 However, current guidelines recommend treating patients for variceal bleeding with an initial bolus of a PPI, followed by a continuous infusion of PPI for 72 hours. As previously noted, multiple studies, have failed to show any decrease in mortality associated with this treatment.12
Other agents that are used to treat variceal bleeding include octreotide and vasopressin. Octreotide, a somatostatin analog, is generally given as an initial IV bolus followed by continuous infusion, and has been shown to decrease transfusion requirements without mortality benefit.12 Vasopressin is generally given to critically ill patients, and is considered a third-line treatment for variceal bleeding.
Since our patient had a history of chronic kidney disease, desmopressin was empirically administered in the event platelet dysfunction was a contributing factor to bleeding.13 The absence of cirrhosis was significant because our patient was unlikely to have a bleeding diathesis caused by coagulation factor deficiency. Therefore, the goal transfusion ratio of blood products should be balanced, similar to that in traumatic exsanguination, rather than favoring an increased ratio of plasma to other blood products. Similarly, tranexamic acid was administered because insufficient tamponade rather than coagulopathy was the presumed cause of sustained hemorrhage.
An additional complicating factor in our patient’s care was the potential effect of the massive transfusion on electrolytes. Packed RBCs have a pH of approximately 6.8 and may carry up to 25 mmol/L of potassium, which may have exacerbated our patient’s underlying hyperkalemia.14 Rapid blood transfusion also places patients at risk for acute hypocalcemia secondary to citrate toxicity; this did not occur in our patient in part because the metabolic function of her liver was preserved and citrate could be broken down in the hepatocyte Krebs cycle.15 Calcium therapy doubled as treatment for the hyperkalemia and as prophylaxis against further hypocalcemia. No dysrhythmias were observed.
Surgical Intervention
Emergency physicians should consult with gastroenterology services so that an endoscopy can be performed as soon as possible to evaluate for and control bleeding. When an endoscopy cannot be performed rapidly, there are multiple balloon tamponade devices available that can be used to temporize the bleeding, such as the Sengstaken-Blakemore tube.12
Although balloon tamponade devices are typically reserved for the last line of therapy, endoscopy rather than transjugular intrahepatic portosystemic shunt (TIPS) was the preferred method of hemorrhage source control in our patient for several reasons. First, although the working diagnosis of varices was based on the patient’s history, we wanted to evaluate for other causes of upper gastrointestinal bleeding since our patient had no history of endoscopy. Therefore, endoscopy had both a therapeutic and diagnostic value. Secondly, though TIPS may decrease pressure within the bleeding varix, only endoscopy permits direct hemostasis. Also, endoscopy also was preferred over TIPS because our patient was too unstable to move to the interventional radiology suite.16
Conclusion
Although life-threatening esophageal variceal hemorrhage is a rare manifestation of an uncommon disease, it should be considered in the differential diagnosis of a patient who has sarcoidosis and presents with gastrointestinal bleeding. Additionally, when caring for a patient with massive hematemesis without evidence of liver cirrhosis, other etiologies of portal hypertension and esophageal varices, such as sarcoidosis, should be considered.
1. Rao DA, Dellaripa PF. Extrapulmonary manifestations of sarcoidosis. Rheum Dis Clin North Am. 2013;39(2):277-297. doi:10.1016/j.rdc.2013.02.007.
2. Mistilis SP, Green JR, Schiff L. Hepatic sarcoidosis with portal hypertension. Am J Med. 1964;36(3):470-475. doi:10.1016/0002-9343(64)90175-5.
3. Tekeste H, Latour F, Levitt RE. Portal hypertension complicating sarcoid liver disease: case report and review of the literature. Am J Gastroenterol. 1984;79(5):389-396.
4. Ivonye C, Elhammali B, Henriques-Forsythe M, Bennett-Gittens R, Oderinde A. Disseminated sarcoidosis resulting in portal hypertension and gastrointestinal bleeding: a rare presentation. Can J Gastroenterol. 2012;26(8):508-509. http://www.ncbi.nlm.nih.gov/pubmed/22891173. Accessed May 16, 2018.
5. Tetangco EP, Silva RG, Lerma EV. Portal hypertension: etiology, evaluation, and management. Dis Mon. 2016;62(12):411-426. doi:10.1016/j.disamonth.2016.08.001.
6. Valeyre D, Prasse A, Nunes H, Uzunhan Y, Brillet PY, Müller-Quernheim J. Sarcoidosis. Lancet. 2014;383(9923):1155-1167. doi:10.1016/S0140-6736(13)60680-7.
7. Al-Kofahi K, Korsten P, Ascoli C, et al. Management of extrapulmonary sarcoidosis: challenges and solutions. Ther Clin Risk Manag. 2016;12:1623-1634. doi:10.2147/TCRM.S74476.
8. Iannuzzi MC, Rybicki BA, Teirstein AS. Sarcoidosis. N Engl J Med. 2007;357(21):2153-2165. doi:10.1056/NEJMra071714.
9. Ebert EC, Kierson M, Hagspiel KD. Gastrointestinal and hepatic manifestations of sarcoidosis. Am J Gastroenterol. 2008;103(12):3184-3192. doi:10.1111/j.1572-0241.2008.02202.x.
10. Fraimow W, Myerson RM. Portal hypertension and bleeding esophageal varices secondary to sarcoidosis of the liver. Am J Med. 1957;23(6):995-998.
11. Saito H, Ohmori M, Iwamuro M, et al. Hepatic and gastric involvement in a case of systemic sarcoidosis presenting with rupture of esophageal varices. Intern Med. 2018;56(19):2583-2588. doi:10.2169/internalmedicine.8768-16.
12. DeLaney M, Greene CJ. Emergency Department evaluation and management of patients with upper gastrointestinal bleeding. Emerg Med Pract. 2015;17(4):1-18; quiz 19.
13. Ozgönenel B, Rajpurkar M, Lusher JM. How do you treat bleeding disorders with desmopressin? Postgrad Med J. 2007;83(977):159-163. doi:10.1136/pgmj.2006.052118.
14. Sümpelmann R, Schürholz T, Thorns E, Hausdörfer J. Acid-base, electrolyte and metabolite concentrations in packed red blood cells for major transfusion in infants. Paediatr Anaesth. 2001;11(2):169-173. doi:10.1046/j.1460-9592.2001.00637.x.
15. Monchi M. Citrate pathophysiology and metabolism. Transfus Apher Sci. 2018;56(1):28-30. doi:10.1016/j.transci.2016.12.013.
16. Shah RP, Sze DY. Complications during transjugular intrahepatic portosystemic shunt creation. Tech Vasc Interv Radiol. 2016;19(1):61-73. doi:10.1053/j.tvir.2016.01.007.
Sarcoidosis is a systemic disorder of unknown etiology and is characterized by the formation of granulomas throughout various organs in the body. The most common form is pulmonary sarcoidosis, which affects 90% of patients; the second most common form is oculocutaneous sarcoidosis;1 and the third most common form is hepatic sarcoidosis, which affects 63% to 90% of patients.2 Although the liver is frequently involved in all forms of sarcoidosis, only a fraction of patients present with clinically evident liver disease.1 Approximately 20% to 30% of patients have abnormalities on liver function tests, whereas only about 1% of patients show evidence of portal hypertension and cirrhosis.3 In fact, in the English literature, there were 35 reported cases of portal hypertension due to sarcoidosis between 1949 to 2001, of which 16 of the patients had no evidence of cirrhosis.4
The diagnosis of sarcoidosis is usually made by a compilation of clinical signs and symptoms, imaging studies, and biopsies demonstrating noncaseating granulomas. This case report describes a patient who presented with portal hypertension and esophageal variceal bleeding secondary to sarcoidosis of the liver without cirrhotic changes.
Case
A 47-year-old woman presented to the ED via emergency medical services with a 1-hour history of hematemesis and melena. The patient stated that she felt fatigued, nauseated, and light-headed, but had no pain or focal weakness. Her medical history was significant for pulmonary and renal sarcoidosis. She underwent a liver biopsy 1 week prior to presentation, with a 6-day hospitalization period, due to new ascites found on examination.
The patient’s vital signs at presentation were: blood pressure (BP), 72/56 mm Hg; heart rate (HR), 133 beats/min, respiratory rate, 24 breaths/min; and temperature, 97.0oF. Oxygen saturation was 99% on room air. Physical examination revealed an alert and oriented middle-aged woman in extremis who was vomiting dark-colored blood. The cardiac and pulmonary examination revealed no extraneous sounds; the abdominal examination showed ascites with a liver edge palpable 4 cm beneath the right costal margin. The patient had no scleral icterus, palmar erythema, spider angiomata, fetor hepaticus, caput medusa, cutaneous ecchymoses, or any other stigmata of cirrhosis.
Two large-bore peripheral intravenous (IV) catheters were placed and a massive blood transfusion protocol was initiated. Packed red blood cells (PRBCs) from the resuscitation-area refrigerator were infused immediately via a pressurized fluid warmer.
After consultation with gastroenterology and general surgery services, the patient was given 1 g ceftriaxone IV, 1 g tranexamic acid IV, 20 mcg desmopressin IV, 50 mcg octreotide IV, 40 mg pantoprazole IV, 8 mg ondansetron IV, 4 g calcium gluconate IV, and 100 mg hydrocortisone IV.
Throughout the patient’s first 10 minutes in the ED, she remained persistently hypotensive and continued to vomit. Since the patient’s sensorium was intact, the team quickly discussed goals of care with her. The patient’s wishes were for maximal life-sustaining therapy, including endotracheal intubation and chest compressions, if necessary.
After this discussion, the patient was given IV etomidate and rocuronium and was intubated using video-assisted laryngoscopy. Following intubation, she was sedated with an infusion of fentanyl and underwent orogastric tube placement to aspirate stomach contents. A total of 2.5 L of frank blood were drained from the patient’s stomach.
A size 9 French single lumen left-femoral central venous catheter also was placed, through which additional blood products were infused. The patient received a total of 28 U PRBCs, fresh frozen plasma, and platelets over a 3-hour period. During transfusion, the patient’s vital signs improved to a systolic BP ranging between 110 to 120 mm Hg and an HR ranging between 90 to 110 beats/min; she did not experience any further hypotensive episodes throughout her stay in the ED.
Laboratory studies were significant for metabolic acidosis, hyperkalemia, acute on chronic anemia, leukocytosis, and acute on chronic renal failure. Synthetic function of the liver and transaminases appeared normal (Table).
The patient’s hyperkalemia was treated with 1 g calcium chloride IV, 50 g dextrose IV, and 10 U regular insulin IV. A portable chest radiograph showed an appropriately positioned endotracheal tube, and an electrocardiogram revealed sinus tachycardia without signs of hyperkalemia. A computed tomography (CT) scan of the abdomen and pelvis from the patient’s recent hospitalization, 1 week prior to presentation, showed hepatomegaly, liver granulomas, ascites, and periportal lymphadenopathy (Figure 1).
A review of the patient’s recent liver biopsy and ascitic fluid analysis revealed noncaseating granulomas compressing the hepatic sinusoids, and a serum ascites albumin gradient greater than 1.1 g/dL, implying portal hypertension without cirrhosis. The surgical team attempted to place a Sengstaken-Blakemore tube, but the device could not be positioned properly due to the patient’s narrowed esophagus.
The ED nurses cleaned the patient, preserving her dignity; thereafter the patient’s adult children visited with her briefly before she was taken for an upper endoscopy, which was performed in the ED. The endoscopy revealed actively hemorrhaging esophageal varices at the gastroesophageal junction (Figure 2). The varices were treated with endoscopic ligation; the gastroenterologist placed a total of 11 bands, resulting in cessation of bleeding.
After the endoscopy, the patient was admitted to the medical intensive care unit (ICU). Approximately 1.5 hours after arriving at the ICU, she developed renewed hematemesis. Despite efforts to control bleeding and provide hemodynamic support, the patient died 1 hour later.
Discussion
Etiology
Esophageal variceal hemorrhage is caused by pressure elevation in the portal venous system, leading to engorged esophageal veins that can bleed spontaneously. Approximately 90% of portal hypertension is due to liver cirrhosis.5 The remaining 10% of cases are primarily vascular in etiology, with endothelial dysfunction and thrombosis leading to increased portal resistance. Noncirrhotic causes of portal hypertension include malignancy, congenital diseases, viral hepatitides, vascular thromboses or fistulae, constrictive pericarditis, fatty liver of pregnancy, drugs, radiation injury, and infiltrative diseases.5
Sarcoidosis may cause noncaseating granulomas to form in the liver, leading to portal hypertension and fatal exsanguination from esophageal variceal hemorrhage. Although the lesions of sarcoidosis classically form in the lungs, any organ system may be affected.6,7 Frank cirrhosis of the liver occurs in only 1% of sarcoidosis patients; however, radiographic involvement of the liver is seen in 5% to 15% of patients.8
There are several mechanisms which may be responsible for portal hypertension in patients with sarcoidosis, including granulomas causing mass effect on the hepatic sinusoids; arteriovenous shunts within the granuloma; granulomatous phlebitis within the sinusoids; or compressive periportal lymphadenopathy.9 Regardless of the mechanism, a review of the literature demonstrates an association between sarcoidosis and symptomatic portal hypertension.2,4,10,11Although our patient ultimately died, early initiation of massive blood transfusion protocol, airway protection, attention to electrolytes, and endoscopic control of the hemorrhage source provided the best chance for survival.
Medical Therapy
The first priority in managing and treating esophageal varices is to secure the patient’s airways to prevent aspiration. Two large bore IV lines should be placed to permit rapid infusion of crystalloid fluids or blood products. Initiating antibiotics, specifically IV ceftriaxone, to patients with variceal bleeding is a class I recommendation, as this is the only intervention shown to increase patient survival.12 Although proton pump inhibitors (PPI) and somatostatin analogues (typically octreotide) are frequently given, they are both class II recommendations because there is limited evidence supporting the benefit of their use.12 However, current guidelines recommend treating patients for variceal bleeding with an initial bolus of a PPI, followed by a continuous infusion of PPI for 72 hours. As previously noted, multiple studies, have failed to show any decrease in mortality associated with this treatment.12
Other agents that are used to treat variceal bleeding include octreotide and vasopressin. Octreotide, a somatostatin analog, is generally given as an initial IV bolus followed by continuous infusion, and has been shown to decrease transfusion requirements without mortality benefit.12 Vasopressin is generally given to critically ill patients, and is considered a third-line treatment for variceal bleeding.
Since our patient had a history of chronic kidney disease, desmopressin was empirically administered in the event platelet dysfunction was a contributing factor to bleeding.13 The absence of cirrhosis was significant because our patient was unlikely to have a bleeding diathesis caused by coagulation factor deficiency. Therefore, the goal transfusion ratio of blood products should be balanced, similar to that in traumatic exsanguination, rather than favoring an increased ratio of plasma to other blood products. Similarly, tranexamic acid was administered because insufficient tamponade rather than coagulopathy was the presumed cause of sustained hemorrhage.
An additional complicating factor in our patient’s care was the potential effect of the massive transfusion on electrolytes. Packed RBCs have a pH of approximately 6.8 and may carry up to 25 mmol/L of potassium, which may have exacerbated our patient’s underlying hyperkalemia.14 Rapid blood transfusion also places patients at risk for acute hypocalcemia secondary to citrate toxicity; this did not occur in our patient in part because the metabolic function of her liver was preserved and citrate could be broken down in the hepatocyte Krebs cycle.15 Calcium therapy doubled as treatment for the hyperkalemia and as prophylaxis against further hypocalcemia. No dysrhythmias were observed.
Surgical Intervention
Emergency physicians should consult with gastroenterology services so that an endoscopy can be performed as soon as possible to evaluate for and control bleeding. When an endoscopy cannot be performed rapidly, there are multiple balloon tamponade devices available that can be used to temporize the bleeding, such as the Sengstaken-Blakemore tube.12
Although balloon tamponade devices are typically reserved for the last line of therapy, endoscopy rather than transjugular intrahepatic portosystemic shunt (TIPS) was the preferred method of hemorrhage source control in our patient for several reasons. First, although the working diagnosis of varices was based on the patient’s history, we wanted to evaluate for other causes of upper gastrointestinal bleeding since our patient had no history of endoscopy. Therefore, endoscopy had both a therapeutic and diagnostic value. Secondly, though TIPS may decrease pressure within the bleeding varix, only endoscopy permits direct hemostasis. Also, endoscopy also was preferred over TIPS because our patient was too unstable to move to the interventional radiology suite.16
Conclusion
Although life-threatening esophageal variceal hemorrhage is a rare manifestation of an uncommon disease, it should be considered in the differential diagnosis of a patient who has sarcoidosis and presents with gastrointestinal bleeding. Additionally, when caring for a patient with massive hematemesis without evidence of liver cirrhosis, other etiologies of portal hypertension and esophageal varices, such as sarcoidosis, should be considered.
1. Rao DA, Dellaripa PF. Extrapulmonary manifestations of sarcoidosis. Rheum Dis Clin North Am. 2013;39(2):277-297. doi:10.1016/j.rdc.2013.02.007.
2. Mistilis SP, Green JR, Schiff L. Hepatic sarcoidosis with portal hypertension. Am J Med. 1964;36(3):470-475. doi:10.1016/0002-9343(64)90175-5.
3. Tekeste H, Latour F, Levitt RE. Portal hypertension complicating sarcoid liver disease: case report and review of the literature. Am J Gastroenterol. 1984;79(5):389-396.
4. Ivonye C, Elhammali B, Henriques-Forsythe M, Bennett-Gittens R, Oderinde A. Disseminated sarcoidosis resulting in portal hypertension and gastrointestinal bleeding: a rare presentation. Can J Gastroenterol. 2012;26(8):508-509. http://www.ncbi.nlm.nih.gov/pubmed/22891173. Accessed May 16, 2018.
5. Tetangco EP, Silva RG, Lerma EV. Portal hypertension: etiology, evaluation, and management. Dis Mon. 2016;62(12):411-426. doi:10.1016/j.disamonth.2016.08.001.
6. Valeyre D, Prasse A, Nunes H, Uzunhan Y, Brillet PY, Müller-Quernheim J. Sarcoidosis. Lancet. 2014;383(9923):1155-1167. doi:10.1016/S0140-6736(13)60680-7.
7. Al-Kofahi K, Korsten P, Ascoli C, et al. Management of extrapulmonary sarcoidosis: challenges and solutions. Ther Clin Risk Manag. 2016;12:1623-1634. doi:10.2147/TCRM.S74476.
8. Iannuzzi MC, Rybicki BA, Teirstein AS. Sarcoidosis. N Engl J Med. 2007;357(21):2153-2165. doi:10.1056/NEJMra071714.
9. Ebert EC, Kierson M, Hagspiel KD. Gastrointestinal and hepatic manifestations of sarcoidosis. Am J Gastroenterol. 2008;103(12):3184-3192. doi:10.1111/j.1572-0241.2008.02202.x.
10. Fraimow W, Myerson RM. Portal hypertension and bleeding esophageal varices secondary to sarcoidosis of the liver. Am J Med. 1957;23(6):995-998.
11. Saito H, Ohmori M, Iwamuro M, et al. Hepatic and gastric involvement in a case of systemic sarcoidosis presenting with rupture of esophageal varices. Intern Med. 2018;56(19):2583-2588. doi:10.2169/internalmedicine.8768-16.
12. DeLaney M, Greene CJ. Emergency Department evaluation and management of patients with upper gastrointestinal bleeding. Emerg Med Pract. 2015;17(4):1-18; quiz 19.
13. Ozgönenel B, Rajpurkar M, Lusher JM. How do you treat bleeding disorders with desmopressin? Postgrad Med J. 2007;83(977):159-163. doi:10.1136/pgmj.2006.052118.
14. Sümpelmann R, Schürholz T, Thorns E, Hausdörfer J. Acid-base, electrolyte and metabolite concentrations in packed red blood cells for major transfusion in infants. Paediatr Anaesth. 2001;11(2):169-173. doi:10.1046/j.1460-9592.2001.00637.x.
15. Monchi M. Citrate pathophysiology and metabolism. Transfus Apher Sci. 2018;56(1):28-30. doi:10.1016/j.transci.2016.12.013.
16. Shah RP, Sze DY. Complications during transjugular intrahepatic portosystemic shunt creation. Tech Vasc Interv Radiol. 2016;19(1):61-73. doi:10.1053/j.tvir.2016.01.007.

Trio of blood biomarkers elevated in children with LRTIs
TORONTO – While C-reactive protein, procalcitonin, and proadrenomedullin are associated with development of severe clinical outcomes in children with lower respiratory tract infections, proadrenomedullin is most strongly associated with disease severity, preliminary results from a prospective cohort study showed.
“Despite the fact that pneumonia guidelines call the site of care decision the most important decision in the management of pediatric pneumonia, no validated risk stratification tools exist for pediatric lower respiratory tract infections (LRTI),” lead study author Todd A. Florin, MD, said at the annual Pediatric Academic Societies meeting. “Biomarkers offer an objective means of classifying disease severity and clinical outcomes.”
PCT is a precursor of calcitonin secreted by the thyroid, lung, and intestine in response to bacterial infections. It also has been shown to be associated with adverse outcomes and mortality in adults, with results generally suggesting that it is a stronger predictor of severity than CRP. “There is limited data on the association of CRP or PCT with severe outcomes in children with LRTIs,” Dr. Florin noted. “One recent U.S. study of 532 children did demonstrate an association of elevated PCT with ICU admission, chest drainage, and hospital length of stay in children with [community-acquired pneumonia] CAP.”
ProADM, meanwhile, is a vasodilatory peptide with antimicrobial and anti-inflammatory functions synthesized during severe infections. It has a half-life of several hours and has been shown to be associated with disease severity in adults with LRTI. Recent studies have shown that it has improved prognostication over WBC, CRP, and PCT. “In two small studies of children with pneumonia, proADM levels were significantly elevated in children with complicated pneumonia, compared to those with uncomplicated pneumonia,” Dr. Florin said. “Although all three of these markers demonstrate promise in predicting severe outcomes in adults with LRTIs, very few studies have examined their association with disease severity in pediatric disease. Therefore, the aim of the current analysis was to determine the association between blood biomarkers and disease severity in children who present to the ED with lower respiratory tract infections.”
In a study known as Catalyzing Ambulatory Research in Pneumonia Etiology and Diagnostic Innovations in Emergency Medicine (CARPE DIEM), he and his associates performed a prospective cohort analysis of children with suspected CAP who were admitted to the Cincinnati Children’s Hospital ED between July 2012 and December 2017. They limited the analysis to children aged 3 months to 18 years with signs and symptoms of an LRTI, and all eligible patients were required to have a chest radiograph ordered for suspicion of CAP. They excluded children hospitalized within 14 days prior to the index ED visit, immunodeficient or immunosuppressed children, those with a history of aspiration or aspiration pneumonia, and those who weighed less than 5 kg because of blood drawing maximums. Biomarkers were measured only in children with focal findings on chest x-ray in the ED. The primary outcome was disease severity: mild (defined as discharged home), moderate (defined as hospitalized, but not severe) and severe (defined as having an ICU length of stay of greater than 48 hours, chest drainage, severe sepsis, noninvasive positive pressure ventilation, intubation, vasoactive infusions, or death). Biomarkers were obtained at the time of presentation to the ED, prior to the occurrence of clinical outcomes.
Over a period of 4.5 years, the researchers enrolled 1,142 patients. Of these, 478 had focal findings on chest x-ray and blood obtained. The median age of these 478 children was 4.4 years, 52% were male, and 82% had all three biomarkers performed. Specifically, 456 had CRP and PCT performed, while 358 had proADM performed. “Not every child had every marker performed due to challenges in obtaining sufficient blood for all three biomarkers in some children,” Dr. Florin explained.
Preliminary data that Dr. Florin presented at PAS found that the median CRP, PCT, and proADM did not differ by gender, race, ethnicity, or insurance status. “In addition, there were not significant differences in the distribution of disease severity by biomarker performed, with approximately 27% of patients being classified as mild, 66% as moderate, and 7% as severe,” he said.
The median CRP was 2.4 ng/mL in those with mild disease, 2.5 ng/mL in those with moderate disease, and 6.25 ng/mL in those with severe disease, with the difference between the two subclasses of nonsevere disease and moderate disease and severe disease reaching statistical significance (P = .002). The median PCT was 0.16 ng/mL in those with mild disease, 0.26 ng/mL in those with moderate disease, and 0.49 ng/mL in those with severe disease, with the difference between the two subclasses of nonsevere disease and moderate disease and severe disease reaching statistical significance (P = .047). Meanwhile, the median proADM was 0.53 ng/mL in those with mild disease, 0.59 ng/mL in those with moderate disease, and 0.81 ng/mL in those with severe disease, with the difference between the two subclasses of nonsevere disease and moderate disease and severe disease also reaching statistical significance (P less than .0001).
Next, the researchers performed logistic regression of each biomarker individually and in combination. They found that and had the best ability to discriminate those developing severe vs. nonsevere disease (area under the receiving operating curve of 0.72, vs. 0.67 and 0.60, respectively). When CRP and PCT markers were combined with proADM, they were no longer associated with severe disease, while a strong association with proADM remained significant.
Dr. Florin acknowledged certain limitations of the study, including the fact that requiring collection of blood samples may have resulted in an enrollment bias toward patients receiving phlebotomy or IV line placement in the ED. “In addition, the children in the moderate-severity group are likely more heterogeneous than the other two severity groups,” he said. “Finally, given that this is a single-center study, we had a relatively small number of outcomes for some of the individual severity measures, which may have limited power and precision.”
He concluded his presentation by saying that he is “cautiously optimistic” about the study results. “As is the case in many biomarker studies, I do not anticipate that any single biomarker will be the magic bullet for predicting disease severity in pediatric CAP,” Dr. Florin said. “It will likely be a combination of clinical factors and several biomarkers that will achieve optimal prognostic ability. That said, our results suggest that similar to adult studies, proADM appears to have the strongest association with severe disease, compared with CRP and PCT. Combinations of biomarkers did not perform better than proADM alone. With the advent of rapid point-of-care diagnostics, these markers may have a role in management and site-of-care decisions for children with LRTI.”
The study received funding support from the Gerber Foundation, the National Institute of Allergy and Infectious Diseases, and Cincinnati Children’s Hospital Medical Center. Dr. Florin reported having no financial disclosures.
AT PAS 18
Key clinical point: Blood biomarkers such as C-reactive protein (CRP), procalcitonin (PCT), and proadrenomedullin (proADM) may have a role in management and site-of-care decisions for children with LRTIs.
Major finding: The proADM alone was associated with the largest odds for severe disease (OR 13.1), compared with CRP alone (OR 1.6) and PCT alone (OR 1.4).
Study details: Preliminary results from prospective cohort analysis of 478 children with suspected community-acquired pneumonia who were admitted to the Cincinnati Children’s Hospital ED.
Disclosures: The study received funding support from the Gerber Foundation, the National Institute of Allergy and Infectious Diseases, and Cincinnati Children’s Hospital Medical Center. Dr. Florin reported having no financial disclosures.