User login
How to pump up the donor heart pool
COLORADO SPRINGS – Diminished left ventricular systolic function alone should not be used as a basis for declining a donor heart for transplantation, Agustin Sibona, MD, asserted at the annual meeting of the Western Thoracic Surgical Association.
“Expansion of the donor pool to include more of these organs is appropriate,” said Dr. Sibona of Loma Linda (Calif.) University.
He presented an analysis of the United Network for Organ Sharing database that encompassed all adult isolated first-time heart transplants in the United States from 2000 through March 2016.
“Carefully selected potential donor hearts with LVEF of 30% or higher should not be excluded from consideration of transplantation on the basis of depressed LVEF alone,” he concluded. “We’re not saying we should use every heart that has an EF of 35% or 45%. We say you should thoroughly evaluate those patients and those hearts and consider them.”
Roughly 500,000 people develop new end-stage heart failure each year. Heart transplantation has long been considered the definitive therapy for this condition. However, heart transplantation rates have remained static at 2,000-2,500 per year in the United States for the past 15 years because of the shortage of donor organs.
Previous work by Dr. Sibona’s senior coinvestigators has documented that 19% of potential donor hearts are not utilized for transplant solely based upon the presence of left ventricular dysfunction. That’s about 1,300 hearts per year.
“About 60% of those hearts had an LVEF greater than 40%. That’s 785 hearts. If only half of those are used, that still represents an increase in the domestic transplant rate of almost 20%,” he observed.
Twenty-one patients in the study received a heart with an LVEF of 20%-29.9%. They had an unacceptably high perioperative mortality.
There was no significant difference between the LVEF groups in terms of race, cause of death, or ischemic time.
Mean transplantation hospital length of stay varied inversely with donor heart LVEF, from 20.3 days in patients with a normal LVEF, to 23.9 days with an LVEF of 40%-49.9%, and 31.1 days with an LVEF of 30%-39.9%.
Dr. Sibona replied that unfortunately the UNOS database is not informative on that score.
Dr. Kwon offered a practical reservation about embracing the use of compromised donor hearts: “Ninety-one percent of programs in the U.S. do less than 30 heart transplants per year, and 76% do less than 20. Smaller programs won’t necessarily have the luxury of 6,000 days to see if their survival statistics bear out. If they have two or three deaths per year, that’s enough to get a notice from UNOS and CMS and private payers. So I would note some caution in that regard.”
He also posed a question: In this new era of highly effective left ventricular assist devices serving as a long-term bridge to transplant, does it make sense to turn to dysfunctional donor hearts?
“Ventricular assist devices are an evolving technology,” Dr. Sibona responded. “Short-term outcomes are equivalent to transplant, but the devices often have complications: GI bleed, stroke, thrombosis, and infections. So we still believe that heart transplantation is the gold standard for treatment. Remember, these patients have end-stage heart failure. Many can’t get out of bed without shortness of breath. So, yes, I would take those hearts.”
He reported having no financial conflicts regarding his study, which was supported by Loma Linda and Stanford universities.
AT THE WTSA ANNUAL MEETING
Key clinical point:
Major finding: Survival of heart transplant recipients whose donor organ had left ventricular systolic dysfunction with an LVEF as low as 30%-39% was not significantly less than for those with a normal donor heart.
Data source: A retrospective study of all of the nearly 31,000 isolated first-time adult heart transplants performed in the U.S. during 2000-March 2016.
Disclosures: Loma Linda and Stanford universities supported the study. The presenter reported having no financial conflicts.
C. difficile travels on the soles of our shoes
NEW ORLEANS – For an explanation to the spread of Clostridium difficile, one needs to look to our soles.
Based on ribosomal analysis, C. difficile often is transmitted from the hospital into the community and back into the hospital on the soles of shoes, researchers have concluded, based on findings from thousands of samples from patients, hospital environments, and shoes.
Dr. Alam of the University of Houston College of Pharmacy and his colleagues collected thousands of samples from the state of Texas to see how C. difficile strains in the community are related to clinical strains in the hospital.
The researchers collected 3,109 stool samples from people hospitalized with C. difficile, another 1,697 swabs taken from environmental surfaces in hospitals across the state, plus another 400 samples taken from the soles of shoes of clinicians and non–health care workers.
C. difficile was found in 44% of clinical stool samples, 13% of high-touch hospital environment surfaces, and 26% of community shoe sole samples. Among these positive C. difficile samples, toxigenic strains were detected in 93% of patient samples, 66% of hospital environment swabs and 64% of shoe samples. Importantly, the most predominant toxigenic strains appeared in all three sample types.
“When we collected some hospital environmental samples, we saw the isolate ribotypes perfectly matched the patient samples,” Dr. Alam said.
Further, “we saw the exact same ribotypes on our shoe bottoms, from these community, nonclinical sources,” Dr. Alam said. “Apparently, it seems, these dangerous pathogens are everywhere.”
In fact, “we may have brought many different strains from all over the world here to this meeting,” he added. “When we are taking antibiotics, we are susceptible to these different strains.”
Hospitals are cleaned daily, “but how many of us care about the shoes” on those who walk through the hospital, he asked. “We are loading the hospital with Clostridium difficile, and the hospital environment is also loaded with Clostridium difficile so we are bringing it into the community. We are spreading it everywhere.”
“Maybe we are blaming the doctors, nurses, and other staff, but [we are] not thinking about our shoes,” Dr. Alam added.
AT ASM MICROBE 2017
Key clinical point: Clostridium difficile transfer between the hospital and community and back could be driven in part by contaminated shoes.
Major finding: Toxigenic strains of C. difficile were found in 93% of patient samples, 66% of hospital environment swabs, and 64% of shoe samples.
Data source: Study of 3,109 stool samples from infected hospitalized patients, 1,697 hospital environmental surface swabs, and 400 samples from the soles of shoes.
Disclosures: Dr. Alam reported having no financial disclosures.
Make the Diagnosis - July 2017
Sweet’s syndrome (acute febrile neutrophilic dermatosis)
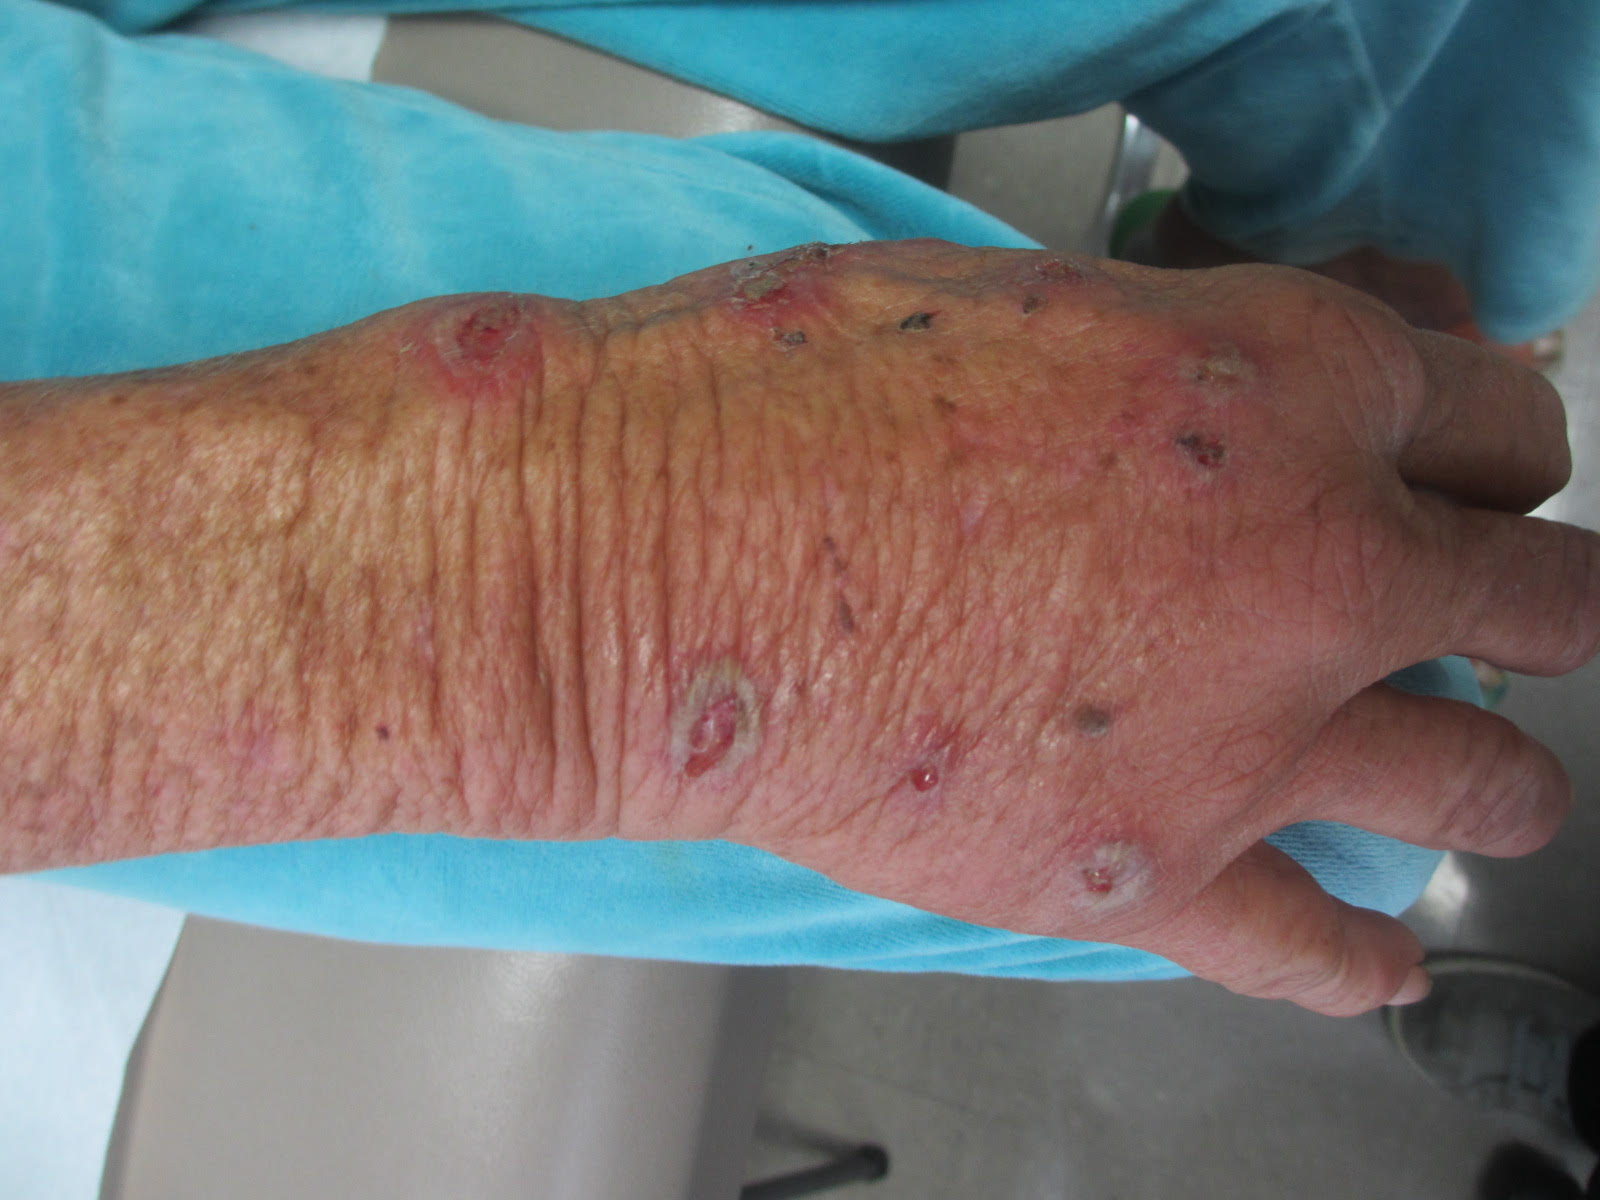
A biopsy revealed an intact epidermis with intense infiltration of neutrophils in the superficial dermis, striking superficial edema, and a few lymphoid cells, consistent with Sweet’s syndrome. The patient was started on prednisone with a slow taper and had resolution of her symptoms.
Sweet’s syndrome (acute febrile neutrophilic dermatosis) is characterized by the sudden manifestation of painful edematous and erythematous papules, plaques, and/or nodules. As may be predicted by the descriptive name, the skin findings are often accompanied by fever, leukocytosis, and other extracutaneous manifestations. Sweet’s syndrome is generally divided into three categories: classical (idiopathic), drug associated, and malignancy associated.
Classical (idiopathic) Sweet’s syndrome
Drug-associated Sweet’s syndrome
Drug-associated Sweet’s syndrome must meet all the diagnostic criteria of the classical variant, as well as a temporal relationship for both the onset and resolution of symptoms associated with the initiation and cessation of a drug, respectively. Signs and symptoms of the disease process typically develop 2 weeks after the initial drug exposure. Granulocyte colony stimulating factor (G-CSF) is the most commonly reported inciting drug; however, an extensive list of potential offenders has been described in the literature. Although most cases will self-resolve within several weeks of drug cessation, treatment with corticosteroids can expedite recovery.
Malignancy-associated Sweet’s syndrome
Malignancy-associated Sweet’s syndrome may occur as the first revelation of an undiagnosed malignancy, as a complication of an already diagnosed malignancy, or as a warning sign of the recurrence of a previously diagnosed malignancy. Association with solid tumors is uncommon, with approximately 85% of reported cases occurring in patients with an underlying hematologic malignancy (most frequently, acute myeloblastic leukemia). The treatment of choice for malignancy-associated Sweet’s syndrome is targeted at eradicating the underlying malignancy; however, most patients will receive a course of corticosteroids to aid in a faster resolution of symptoms. Very few cases of Sweet’s syndrome associated with untreated melanoma have been reported in the literature, as patients with melanoma are much more likely to develop Sweet’s syndrome as a result of anti-neoplastic drug therapy than as a result of the tumor itself.
While it is not completely clear if this patient’s diagnosis was the classical type or malignancy associated, it is more likely the former as the patient improved with oral corticosteroids.
This case and photo are courtesy of Natasha Cowan, University of California, San Diego, and Nick Celano, MD, San Diego Family Dermatology.
Dr. Bilu Martin is a board-certified dermatologist in private practice at Premier Dermatology, MD, in Aventura, Fla. More diagnostic cases are available at edermatologynews.com. To submit a case for possible publication, send an email to dermnews@frontlinemedcom.com.
Sweet’s syndrome (acute febrile neutrophilic dermatosis)
A biopsy revealed an intact epidermis with intense infiltration of neutrophils in the superficial dermis, striking superficial edema, and a few lymphoid cells, consistent with Sweet’s syndrome. The patient was started on prednisone with a slow taper and had resolution of her symptoms.
Sweet’s syndrome (acute febrile neutrophilic dermatosis) is characterized by the sudden manifestation of painful edematous and erythematous papules, plaques, and/or nodules. As may be predicted by the descriptive name, the skin findings are often accompanied by fever, leukocytosis, and other extracutaneous manifestations. Sweet’s syndrome is generally divided into three categories: classical (idiopathic), drug associated, and malignancy associated.
Classical (idiopathic) Sweet’s syndrome
Drug-associated Sweet’s syndrome
Drug-associated Sweet’s syndrome must meet all the diagnostic criteria of the classical variant, as well as a temporal relationship for both the onset and resolution of symptoms associated with the initiation and cessation of a drug, respectively. Signs and symptoms of the disease process typically develop 2 weeks after the initial drug exposure. Granulocyte colony stimulating factor (G-CSF) is the most commonly reported inciting drug; however, an extensive list of potential offenders has been described in the literature. Although most cases will self-resolve within several weeks of drug cessation, treatment with corticosteroids can expedite recovery.
Malignancy-associated Sweet’s syndrome
Malignancy-associated Sweet’s syndrome may occur as the first revelation of an undiagnosed malignancy, as a complication of an already diagnosed malignancy, or as a warning sign of the recurrence of a previously diagnosed malignancy. Association with solid tumors is uncommon, with approximately 85% of reported cases occurring in patients with an underlying hematologic malignancy (most frequently, acute myeloblastic leukemia). The treatment of choice for malignancy-associated Sweet’s syndrome is targeted at eradicating the underlying malignancy; however, most patients will receive a course of corticosteroids to aid in a faster resolution of symptoms. Very few cases of Sweet’s syndrome associated with untreated melanoma have been reported in the literature, as patients with melanoma are much more likely to develop Sweet’s syndrome as a result of anti-neoplastic drug therapy than as a result of the tumor itself.
While it is not completely clear if this patient’s diagnosis was the classical type or malignancy associated, it is more likely the former as the patient improved with oral corticosteroids.
This case and photo are courtesy of Natasha Cowan, University of California, San Diego, and Nick Celano, MD, San Diego Family Dermatology.
Dr. Bilu Martin is a board-certified dermatologist in private practice at Premier Dermatology, MD, in Aventura, Fla. More diagnostic cases are available at edermatologynews.com. To submit a case for possible publication, send an email to dermnews@frontlinemedcom.com.
A 57-year-old homeless white female with history of untreated malignant melanoma presented with a one-week history of an itchy, painful rash on the right side of her body. Physical exam revealed scattered bullous and pustular edematous plaques on the right arm, hand, and lower leg. She had a fever of 101.5F and an elevated white blood cell count.
Sarcopenia and the New ICD-10-CM Code: Screening, Staging, and Diagnosis Considerations
Sarcopenia is an age-related loss of skeletal muscle that may result in diminished muscle strength and functional performance. The prevalence of sarcopenia varies based on the cohort and the assessment criteria. According to the Health Aging and Body Composition (ABC) study, the prevalence of sarcopenia in community-dwelling older adults is about 14% to 18%, whereas the estimate may exceed 30% for those in longterm care.1,2 This geriatric syndrome may disproportionately affect veterans given that they are older than the civilian population and may have disabling comorbid conditions associated with military service.3
Recently, there has been a call to action to systematically address sarcopenia by interdisciplinary organizations such as the European Society for Clinical and Economic Aspects of Osteoporosis and Osteoarthritis (ESCEO) and the International Working Group on Sarcopenia (IWGS).4,5 This call to action is due to the association of sarcopenia with increased health care costs, higher disability incidence, and elevated risk of mortality.6,7 The consequences of sarcopenia may include serious complications, such as hip fracture or a loss of functional independence.8,9 The CDC now recognizes sarcopenia as an independently reportable medical condition. Consequently, physicians, nurse practitioners (NPs), and other associated health professionals within the VA will need to better understand clinically viable and valid methods to screen and diagnose this geriatric syndrome.
The purpose of this paper is to inform practitioners how sarcopenia screening is aided by the new ICD-10-CM code and briefly review recent VA initiatives for proactive care. Additional objectives include identifying common methods used to assess sarcopenia and providing general recommendations to the VHA National Center for Health Promotion and Disease Prevention (NCP) concerning the management of sarcopenia.
Addressing Sarcopenia
While the age-related decline in muscle size and performance has long been recognized by geriatricians, sustained advocacy by several organizations was required to realize the formal recognition of sarcopenia. Aging in Motion (AIM), a coalition of organizations focused on advancing research and treatment for conditions associated with age-related muscle dysfunction, sought the formal recognition of sarcopenia. The CDC established the ICD-10-CM code for sarcopenia in October of 2016, which allowed the syndrome to be designated as a primary or secondary condition.10
The ubiquitous nature of agerelated changes in muscle and the mandate to engage in proactive care by all levels of VA leadership led to the focus on addressing sarcopenia. The recognition of sarcopenia by the CDC comes at an opportune time given recent VA efforts to transform itself from a facilitator mainly of care delivery to an active partner in fostering the health and well-being of veterans. Initiatives that are emblematic of this attempt to shift the organizational culture across the VHA include establishing the VA Center for Innovation (VACI) and issuing guidance documents, such as the Blueprint for Excellence, which was introduced in 2014 by then VA Secretary Robert McDonald.11,12 Many of the following Blueprint themes and strategies potentially impact sarcopenia screening and treatment within the VA:
- Delivering high-quality, veteran-centered care: A major Blueprint theme is attaining the “Triple Aims” of a health care system by promoting better health among veterans, improving the provision of care, and lowering costs through operational efficiency. The management of sarcopenia has clear clinical value given the association of age-related muscle loss with fall risk and decreased mobility.13 Financial value also may be associated with the effort to decrease disability related to sarcopenia and the use of a team approach featuring associated health professionals to help screen for this geriatric syndrome.14,15 (Strategy 2)
- Leveraging health care informatics to optimize individual and population health outcomes: The inclusion of the most basic muscle performance and functional status measures in the electronic medical record (EMR), such as grip strength and gait speed, would help to identify the risk factors and determinants of sarcopenia among the veteran population. (Strategy 3)
- Advancing personalized, proactive health care that fosters a high level of health and well-being: The long-term promotion of musculoskeletal health and optimal management of sarcopenia cannot be sustained through episodic medical interactions. Instead, a contemporary approach to health services marked by the continuous promotion of health education, physical activity and exercise, and proper nutrition has demonstrated value in the management of chronic conditions.16,17 (Strategy 6)
The new sarcopenia ICD-10-CM code along with elements of the VHA Blueprint can serve to support the systematic assessment and management of veterans with age-related muscle dysfunction. Nevertheless, renewed calls for health promotion and screening programs are often counterbalanced by the need for cost containment and the cautionary tales concerning the potential harms or errors associated with some forms of medical screening. The American Board of Internal Medicine Foundation has spearheaded the Choosing Wisely campaign to raise awareness about excessive medical testing. However, the Institute of Medicine has linked the provision of quality health care to a diagnostic process that is both timely and accurate.18 Careful consideration of these health care challenges may help guide practitioners within the VA concerning the screening and diagnosis of sarcopenia.
Sarcopenia Assessment
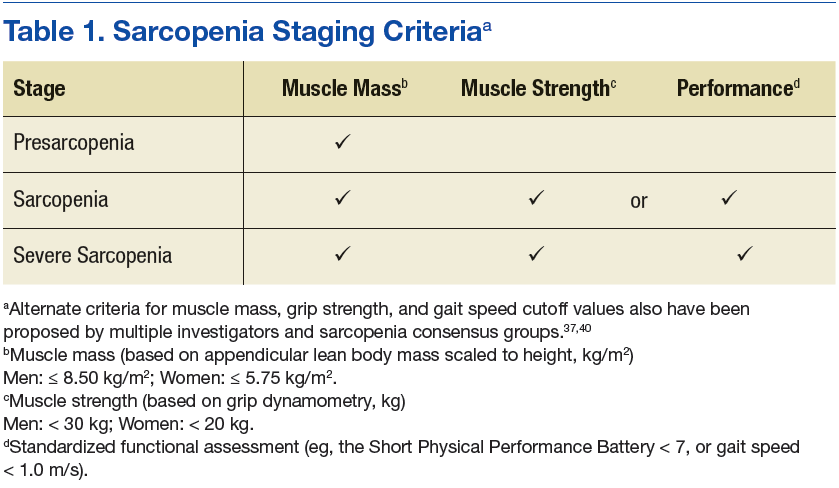
Sarcopenia can have several underlying causes in some individuals and result in varied patterns of clinical presentation and differing degrees of severity. The European Working Group on Sarcopenia in Older People first met in 2009 and used a consensus-based decision-making process to determine operational definitions for sarcopenia and create a staging algorithm for the syndrome.19 This consensus group developed a conceptual staging model with 3 categories: presarcopenia, sarcopenia, and severe sarcopenia (Table 1). The impetus for sarcopenia staging was the emerging research findings suggesting that lean body mass (LBM) alone did not provide a high degree of clinical value in outpatient settings due to the nonlinear relationship between LBM and muscle function in older adults.20,21 Using the consensus model approach, an individual is classified as sarcopenic on presenting with both low LBM and low muscle function.
Screening: A Place to Start
Findings from the Health ABC Study suggested that older adults who maintained high levels of LBM were less likely to become sarcopenic. Whereas, older adults in the cohort with low levels of LBM tended to remain in a sarcopenic state.6 Consequently, the early detection of sarcopenia may have important health promotion implications for older adults. Sarcopenia is a syndrome with a continuum of clinical features; it is not a disease with a clear or singular etiololgy. Therefore, the result of the screening examination should identify those who would most benefit from a formal diagnostic assessment.
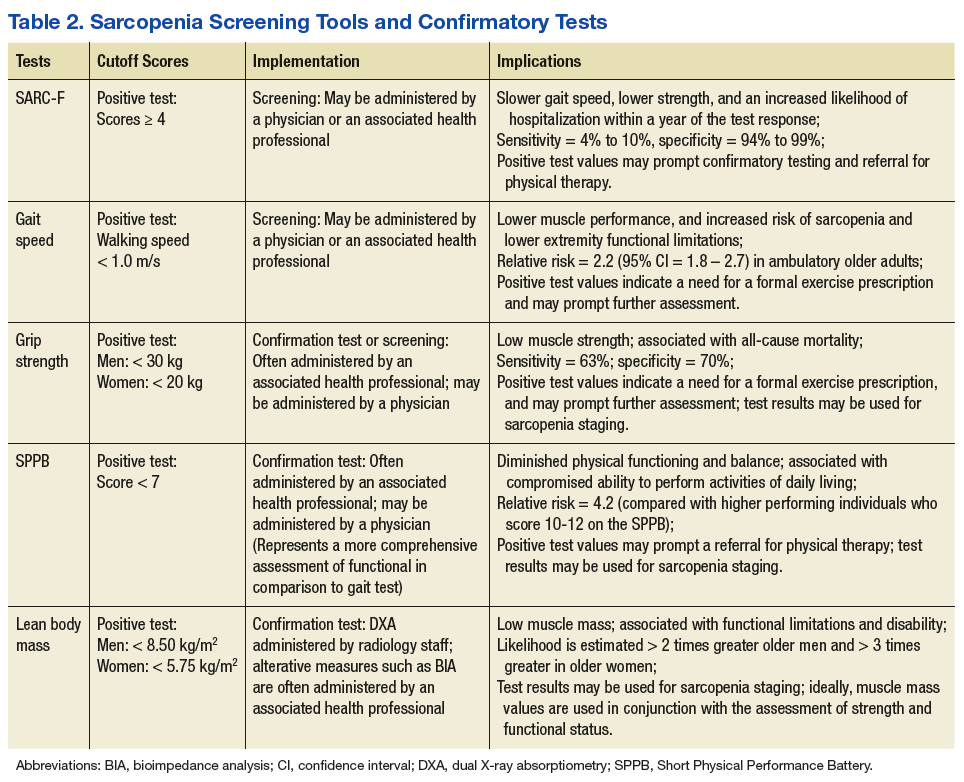
One approach to screening for sarcopenia involves the use of questionnaires, such as the SARC-F (sluggishness, assistance in walking, rise from a chair, climb stairs, falls), which is a brief 5-item questionnaire with Likert scoring for patient responses.13 In a cohort of National Health and Nutrition Examination Survey (NHANES) participants, SARC-F scores ≥ 4 were associated with slower gait speed, lower strength, and an increased likelihood of hospitalization within a year of the test response.22 However, rather than stratify patients by risk, the SARC-F exhibits a high degree of test specificity regarding the major consensus-based sarcopenia classification criteria (specificity = 94.2% to 99.1%; sensitivity = 3.8% to 9.9%).13 Given the known limitations of screening tools with low sensitivity, organizations such as the ESCEO have recommended supplementing the SARC-F questionnaire with other forms of assessment.4 Supplements to the screening examination may range from the use of “red flag” questions concerning changes in nutritional status, body weight, and physical activity, to conducting standard gait speed and grip-strength testing.4,19,23
Performance-based testing, including habitual gait speed and grip-strength dynamometry, also may be used in both the screening and classification of sarcopenia.2 Although walking speed below 1.0 m/s has been used by the IWGS as a criterion to prompt further assessment, many people within the VA health care system may have gait abnormalities independent of LBM status, and others may be nonambulatory.24,25 As a result, grip-strength testing should be considered as a supplementary or alternate screening assessment tool.26,27
Hand-grip dynamometry is often used diagnostically given its previous test validation, low expense, and ease of use.23 Moreover, recent evidence suggests that muscle strength surpasses gait speed as a means of identifying people with sarcopenia. Grip strength is associated with all-cause mortality, even when adjusting for age, sex, and body size,28 while slow gait speed (< .82 m/s) has a reported sensitivity of 63% and specificity of 70% for mortality in population-based studies involving older adults.29
Gait speed (in those who are ambulatory) and grip-strength values could be entered into the EMR evaluation note by the primary care provider (PCP). Elements of the VA EMR, such as the ability to review the diagnosis of sarcopenia on the Problem List or the nominal enhancement of providing LBM estimates within the Cumulative Vitals and Measurements Report would support the management of sarcopenia. See Table 2 for cutoff values for frequently used sarcopenia screening and staging tests.
The pitfalls of excessive or inappropriate screening are well documented. The efforts to screen for prostate cancer have highlighted instances when inappropriate followup tests and treatment fail to alter mortality rates and ultimately yield more harm than good.30 However, there are several points of departure concerning the screening for sarcopenia vs screening for prostate cancer. The screening assessments for sarcopenia are low-cost procedures that are associated with a low patient burden. These procedures may include questionnaires, functional testing, or the assessment of muscle performance. Additionally, there is a low propensity for adverse effects stemming from treatment due to disease misclassification given the common nonpharmacologic approaches used to manage sarcopenia.31 Nonetheless, the best screening examination—even one that has low patient burden and cost—may prove to be a poor use of medical resources if the process is not linked to a viable intervention.
Screening people aged ≥ 65 years may strike a balance between controlling health care expenditures and identifying people with the initial signs of sarcopenia early enough to begin monitoring key outcomes and providing a formalized exercise prescription. Presuming an annual age-related decline in LBM of 1.5%, and considering the standard error measurement of the most frequently used methods of strength and LBM assessment, recurrent screening could occur every 2 years.21,32
Earlier screening may be considered for patient populations with a higher pretest probability. These groups include those with conditions associated with accelerated muscle loss, such as chronic kidney disease, peripheral artery disease, and diabetes mellitus (DM).32 Although accelerated muscle loss characterized by an inflammatory motif (eg, cancer-related cachexia) may share some features of the sarcopenia screening and assessment approach, important differences exist regarding the etiology, medical evaluation, and ICD-10-CM code designation.
Staging and Classification
Staging criteria are generally used to denote the severity of a given disease or syndrome, whereas classification criteria are used to define homogenous patient groups based on specific pathologic or clinical features of a disorder. Although classification schemes may incorporate an element of severity, they are primarily used to characterize fairly distinct phenotypic forms of disease or specific clinical presentation patterns associated with a well-defined syndrome. Although not universally adopted, the European consensus group sarcopenia staging criteria are increasingly used to provide a staging algorithm presumably driven by the severity of the condition.19
The assessment of functional performance for use in sarcopenia staging often involves measuring habitual gait speed or completing the Short Physical Performance Battery (SPPB).23 The SPPB involves a variety of performance-based activities for balance, gait, strength, and endurance. This test has predictive validity for the onset of disability and adverse health events, and it has been extensively used in research and clinical settings.33 Additional tests used to characterize function during the staging or diagnostic process include the timed get up and go test (TGUG) and the timed sit to stand test.34,35 The TGUG provides an estimate of dynamic balance, and the sit to stand test has been used as very basic proxy measure of muscular power.36 The sit to stand test and habitual gait speed are items included in the SPPB.33
Accepted methods to obtain the traditional index measure of sarcopenia—based on estimates of LBM—include bioimpedance analysis (BIA) and dual X-ray absorptiometry (DXA). The BIA uses the electrical impedance of body tissues and its 2 components, resistance and reactance, to derive its body composition estimates.37 Segmental BIA allows for isolated measurements of the limbs, which may be calibrated to DXA appendicular lean body mass (ALM) or magnetic resonance imaging-based estimates of LBM. This instrument is relatively safe for use, inexpensive for medical facilities, and useful for longitudinal studies, but it can be confounded by issues, such as varying levels of hydration, which may affect measurement validity in some instances.
Despite the precision of DXA for estimating densities for whole body composition analysis, the equipment is not very portable and involves low levels of radiation exposure, which limits its utility in some clinical settings. While each body composition assessment method has its advantages and disadvantages, DXA is regarded as an acceptable form of measurement for hospital settings, and BIA is frequently used in outpatient clinics and community settings. Other methods used to estimate LBM with greater accuracy, such as peripheral quantitative computed tomography, doubly labeled water, and whole body gamma ray counting, are not viable for clinical use. Other accessible methods such as anthropometric measures and skinfold measures have not been embraced by sarcopenia classification consensus groups.23,37
Alternative methods of estimating LBM, such as diagnostic ultrasound and multifrequency electrical impedance myography, are featured outcomes in ongoing clinical trials that involve veteran participants. These modalities may soon provide a clinically viable approach to assessing muscle quality via estimates of muscle tissue composition.37,38 Similar to the management of other geriatric syndromes, interprofessional collaboration provides an optimal approach to the assessment of sarcopenia. Physicians and other health care providers may draw on the standardized assessment of strength and function (via the SPPB and hand-grip dynamometry) by physical therapists (PTs), questionnaires administered by nursing staff (the SARC-F), or body composition estimates from other health professionals (ranging from BIA to DXA) to aid the diagnostic process and facilitate appropriate case management (Table 2).
Competing staging and classification definitions have been cited as a primary factor behind the CDC’s delayed recognition of the sarcopenia diagnosis, which in turn posed a barrier to formal clinical recognition by geriatricians.24 However, this reaction to the evolving sarcopenia staging criteria also may reveal the larger misapplication of the staging process to the diagnostic process. The application of classification and staging criteria results in a homogenous group of patients, whereas the application of diagnostic criteria results in a heterogeneous group of patients to account for variations in clinical presentation associated with a given disorder. Classification criteria may be equivalent to objective measures that are used in the diagnostic process when a given disease is characterized by a well-established biomarker.39
However, this is not the case for most geriatric syndromes and other disorders marked by varied clinical presentation patterns. On considering the commonly used sarcopenia staging criteria of LBM ≤ 8.50 kg/m2 or grip strength < 30 kg in men and LBM ≤ 5.75 kg/m2 or grip strength < 20 kg in women, it is easy to understand that such general cutoff values are far from diagnostic.40,41 Moreover, stringent cutoff values associated with classification and staging may not adequately capture those with an atypical presentation of the syndrome (eg, someone who exhibits age-related muscle weakness but has retained adequate LBM). Such criteria often prove to have high specificity and low sensitivity, which may yield a false negative rate that is appropriate for clinical research eligibility and group assignment but inadequate for clinical care.
Screening, staging, and classification criteria with high specificity may indeed be desirable for confirmatory imaging tests associated with radiation exposure concerns or for managing risk in experimental clinical trials involving pharmacologic treatment. For example, a SARC-F score ≥ 4 may prompt the formal assessment of LBM via a DXA examination.4 In contrast, those with a SARC-F score ≤ 3 with low gait speed or grip strength may benefit from consultation regarding regular physical activity and nutrition recommendations. Given the challenges of establishing sarcopenia classification criteria that perform consistently across populations and geographic regions, classification and staging criteria may be best viewed as clinical reasoning tools that supplement, but not supplant, the diagnostic process.7,42
Diagnosis
Geriatric syndromes do not lend themselves to a simple diagnostic process. Syndromes such as frailty and sarcopenia are multifactorial and lack a single distinguishing clinical feature or biomarker. The oft-cited refrain that sarcopenia is an underdiagnosed condition is partially explained by the recent ICD-10-CM code and varied classification and diagnostic criteria.5 This circumstance highlights the need to distinctly contrast the diagnostic process with the screening and staging classifications.
The diagnostic process involves the interpretation of the patient history, signs, and symptoms within the context of individual factors, local or regional disease prevalence, and the results of the best available and most appropriate laboratory tests. After all, a patient that presents with low LBM and a gradual loss of strength without a precipitating event would necessitate further workup to rule out many clinical possibilities under the aegis of a differential diagnosis. Clinical features, such as the magnitude of weakness and pattern of strength loss or muscle atrophy along with the determination of neurologic or autoimmune involvement, are among the key elements of the differential examination for a case involving the observation of frank muscle weakness. Older adults with low muscle strength may have additional risk factors for sarcopenia such as obesity, pain, poor nutrition, previous bone fracture, and a sedentary lifestyle. However, disease etiology with lower probabilities, such as myogenic or neurogenic conditions associated with advancing age, also may be under consideration during the clinical assessment.6
In many instances, the cutoff scores associated with the sarcopenia staging criteria may help to guide the diagnostic process and aid clinical decision making. Since individuals with a positive screening result based on the SARC-F questionnaire (score ≥ 4) have a high likelihood of meeting the staging criteria for severe sarcopenia, a PCP may opt to obtain a confirmatory estimate of LBM both to support the clinical assessment and to monitor change over the course of rehabilitation. Whereas people who present with a decline in strength (ie, grip strength < 30 kg for a male) without an observable loss of function or a positive SARC-F score may benefit from consultation from the physician, NP, or rehabilitation health professional regarding modifiable risk factors associated with sarcopenia.
Incorporating less frequently used sarcopenia classification schemes such as identifying those with sarcopenic obesity or secondary sarcopenia due to mitigating factors such as chronic kidney disease or DM (Table 3) may engender a more comprehensive approach to intervention that targets the primary disease while also addressing important secondary sequelae. Nevertheless, staging or classification criteria cannot be deemed equivalent to diagnostic criteria for sarcopenia due to the challenges posed by syndromes that have a heterogeneous clinical presentation.

The refinement of the staging and classification criteria along with the advances in imaging technology and mechanistic research are not unique to sarcopenia. Practitioners involved in the care of people with rheumatologic conditions or osteoporosis also have contended with continued refinements to their classification criteria and approach to risk stratification.39,43,44 Primary care providers will now have the option to use a new ICD-10-CM code (M62.84) for sarcopenia, which will allow them to properly document the clinical distinctions between people with impaired strength or function largely due to age-related muscle changes and those who have impaired muscle function due to cachexia, inflammatory myopathies, or forms of neuromuscular disease.
The ability to identify and document this geriatric syndrome in veterans will help to better define the scope of the problem within the VA health care system. The median age of veterans is 62 years compared with 43 years for nonveterans.3 Consequently, there may be value in the adoption of a formal approach to screening and diagnosis for sarcopenia among veterans who receive their primary care from VA facilities.7 Indeed, the exchange between the patient and the health professional regarding the screening and diagnostic process will provide valuable opportunities to promote exercise interventions before patients incur significant impairments.
One of the biggest threats burdening global health is noncommunicable diseases, and many chronic conditions, such as sarcopenia, can be prevented and managed with appropriate levels of physical activity.17 Increased physician involvement may prove to be critical given the identification of physical inactivity as a top 5 risk factor for general morbidity and mortality by World Health Organization and consensus group recommendations calling for physicians to serve a more prominent role in the provision of exercise and physical activity recommendations.16,17
This developing health care role should include NPs, PTs, physician assistants, and other associated health professionals. It also should include collaborative efforts between physicians and rehabilitation practitioners concerning provision of the formal exercise prescriptionprescription and monitoring of patient outcomes.
Individuals with severe forms of sarcopenia rarely improve without intervention.6 Although no pharmacologic treatment exists to specifically address sarcopenia, strengthening exercise has been shown to be an effective mode of prevention and conservative management.8 Progressive resistance exercise cannot abate the expected age-related changes in skeletal muscle, but it can significantly reverse the loss of LBM and strength in untrained older adults and slow the age-related decline in muscle performance in older adult athletes and trained individuals.45
Local senior centers and community organizations may prove to be valuable resources concerning group exercise options, and they provide the added benefit of social engagement and peer group accountability. Federal resources include the Go4Life exercise guide and online videos provided by the National Institute on Aging and the MOVE! Weight Management and Health Program provided at select VA community-based outpatient clinics. Ultimately, collaborative efforts with exercise specialists may serve to reduce the PCP burden during the provision of health services, minimize diagnostic errors associated with sarcopenia assessment and help to connect patients to valuable health promotion resources.17,18
Conclusion
While practitioners should remain keenly aware of the pernicious effects of overdiagnosis, sarcopenia has long existed as a known, but undiagnosed, condition. Of course, geriatricians have traditionally managed poor muscle performance and mobility limitations by addressing treatable symptoms and providing referrals to physical medicine specialists when warranted. Nevertheless, the advent of ICD-10-CM code M62.84 provides the VA with an opportunity to take a leading role in systematically addressing this geriatric syndrome within an aging veteran population.
The following items should be considered by NCP for the development of guidelines and recommendations concerning sarcopenia screening:
- Consider screening veterans aged > 65 years for sarcopenia every 2 years. Those with mitigating systemic conditions (eg, chronic kidney disease, DM, or malnutrition) or significant mobility limitations may be screened at any age.
- Sarcopenia screening procedures should include at a minimum the SARC-F questionnaire and gait speed (when appropriate). Including gait speed or grip strength testing in the screening exam is recommended given the low sensitivity of the SARC-F questionnaire.
- Veterans with positive SARC-F results (≥ 4) merit a physical therapy referral. In addition, these veterans should obtain confirmatory standardized assessments for LBM and functional status.
- Veterans at risk for sarcopenia based on patient age, medical history, and the physical examination (eg, obesity, sedentary lifestyle, a previous fracture, self-reported physical decline), but with negative SARC-F results should receive a formal exercise prescription from their PCP. Baseline assessment measures may be used for comparison with serial measures obtained during subsequent screening visits to support long-term case management.
- Interprofessional collaboration involving geriatricians, PTs, nurses, radiologists, and other health care professionals should be involved in the screening, diagnosis, and case management of veterans with sarcopenia.
- The VA EMR should be systematically documented with sarcopenia assessment data obtained from the gait speed tests, SARCF, SPPB, grip strength tests, and LBM estimates to better characterize this condition within the veteran population.
Any expansion in the provision of health care comes with anticipated benefits and potential costs. Broad guidance from NCP may encourage veterans to pursue selected screening tests, promote the appropriate use of preventative services, and facilitate timely treatment when needed.31 Clinicians who are informed about the screening, staging, classification, and diagnostic process for sarcopenia may partner with patients to make reasoned decisions about how to best manage this syndrome within the VA medical center environment.
1. Newman AB, Kupelian V, Visser M, et al; Health ABC Study Investigators. Sarcopenia: alternative definitions and associations with lower extremity function. J Am Geriatr Soc. 2003;51(11):1602-1609.
2. Cruz-Jentoft AJ, Landi F, Schneider SM, et al. Prevalence of and interventions for sarcopenia in ageing adults: a systematic review. Report of the International Sarcopenia Initiative (EWGSOP and IWGS). Age Ageing. 2014;43(6):748-759.
3. U.S. Department of Veterans Affairs, National Center for Veterans Analysis and Statistics. Profile of veterans: 2009. Data from the American Community Survey. http://www.va.gov/vetdata/docs/SpecialReports/Profile_of_Veterans_2009_FINAL.pdf. Published January 2011. Accessed May 18, 2017.
4. Beaudart C, McCloskey E, Bruyère O, et al. Sarcopenia in daily practice: assessment and management. BMC Geriatr. 2016;16(1):170.
5. Fielding RA, Vellas B, Evans WJ, et al. Sarcopenia: an undiagnosed condition in older adults. Current consensus definition: prevalence, etiology, and consequences. International working group on sarcopenia. J Am Med Dir Assoc. 2011;12(4):249-256.
6. Murphy RA, Ip EH, Zhang Q, et al; Health, Aging, and Body Composition Study. Transition to sarcopenia and determinants of transitions in older adults: a population-based study. J Gerontol A Biol Sci Med Sci. 2014;69(6):751-758.
7. Harris-Love MO, Adams B, Hernandez HJ, DiPietro L, Blackman MR. Disparities in the consequences of sarcopenia: implications for African American veterans. Front Physiol. 2014;5:250.
8. Morley JE. Sarcopenia in the elderly. Fam Pract. 2012;29(suppl 1):i44-i48.
9. Fragala MS, Dam TT, Barber V, et al. Strength and function response to clinical interventions of older women categorized by weakness and low lean mass using classifications from the Foundation for the National Institute of Health sarcopenia project. J Gerontol A Biol Sci Med Sci. 2015;70(2):202-209.
10. Aging in Motion. AIM coalition announces establishment of ICD-10-CM Code for Sarcopenia
by the Centers for Disease Control and Prevention [press release]. http://aginginmotion.org/news/2388-2/. Published April 28, 2016. Accessed June 7, 2017.
11. U.S. Department of Veterans Affairs, Veterans Health Administration. Blueprint for excellence. https://www.va.gov/HEALTH/docs/VHA _Blueprint_for_Excellence.pdf. Published September 21, 2014. Accessed June 7, 2017.
12. U.S. Department of Veterans Affairs. VA Center of Innovation 2010–2012 stakeholder report. https://www.innovation.va.gov/docs/VACI_2010-2012_Stakeholder_Report.pdf. Published 2012. Accessed June 14, 2017.
13. Woo J, Leung J, Morley JE. Validating the SARCF: a suitable community screening tool for sarcopenia? J Am Med Dir Assoc. 2014;15(9):630-634.
14. Sousa AS, Guerra RS, Fonseca I, Pichel F, Ferreira S, Amaral TF. Financial impact of sarcopenia on hospitalization costs. Eur J Clin Nutr. 2016;70(9):1046-1051.
15. Janssen I, Shepard DS, Katzmarzyk PT, Roubenoff R. The healthcare costs of sarcopenia in the United States. J Am Geriatr Soc. 2004;52(1):80-85.
16. Ekelund U, Steene-Johannessen J, Brown WJ, et al; Lancet Physical Activity Series 2 Executive Committe; Lancet Sedentary Behaviour Working Group. Does physical activity attenuate, or even eliminate, the detrimental association of sitting time with mortality? A harmonised meta-analysis of data from more than 1 million men and women. Lancet. 2016;388(10051):1302-1310.
17. Thornton JS, Frémont P, Khan K, et al. Physical activity prescription: a critical opportunity to address a modifiable risk factor for the prevention and management of chronic disease: a position statement by the Canadian Academy of Sport and Exercise Medicine. Clin J Sport Med.
2016;26(4):259-265.
18. The National Academies of Sciences, Engineering, and Medicine; Committee on Diagnostic Error in Health Care, Board on Health Care Services; Institute of Medicine. Improving Diagnosis in Health Care. Washington, DC: National Academies Press;2015.
19. Cruz-Jentoft AJ, Baeyens JP, Bauer JM, et al; European Working Group on Sarcopenia in Older People. Sarcopenia: European consensus on definition and diagnosis: report of the European Working Group on Sarcopenia in Older People. Age Ageing. 2010;39(4):412-423.
20. Ferrucci L, Guralnik JM, Buchner D, et al. Departures from linearity in the relationship between measures of muscular strength and physical performance of the lower extremities: the Women’s Health and Aging Study. J Gerontol A Biol Sci Med Sci. 1997;52(5):M275-M285.
21. Goodpaster BH, Park SW, Harris TB, et al. The loss of skeletal muscle strength, mass, and quality in older adults: the Health, Aging and Body Composition Study. J Gerontol A Biol Sci Med Sci. 2006;61(10):1059-1064.
22. Malmstrom TK, Miller DK, Simonsick EM, Ferrucci L, Morley JE. SARC-F: a symptom score to predict persons with sarcopenia at risk for poor functional outcomes. J Cachexia Sarcopenia Muscle. 2016;7(1):28-36.
23. Cooper C, Fielding R, Visser M, et al. Tools in the assessment of sarcopenia. Calcif Tissue Int. 2013;93(3):201-210.
24. Lee WJ, Liu LK, Peng LN, Lin MH, Chen LK; ILAS Research Group. Comparisons of sarcopenia defined by IWGS and EWGSOP criteria among older people: results from the I-Lan longitudinal aging study. J Am Med Dir Assoc. 2013;14(7):528.e1-e7.
25. Cesari M, Kritchevsky SB, Penninx BW, et al. Prognostic value of usual gait speed in well-functioning older people—results from the Health, Aging and Body Composition Study. J Am Geriatr Soc. 2005;53(10):1675-1680.
26. Rossi AP, Fantin F, Micciolo R, et al. Identifying sarcopenia in acute care setting patients. J Am Med Dir Assoc. 2014;15(4):303.e7-e12.
27. Sánchez-Rodríguez D, Marco E, Miralles R, et al. Does gait speed contribute to sarcopenia casefinding in a postacute rehabilitation setting? Arch Gerontol Geriatr. 2015;61(2):176-181.
28. Strand BH, Cooper R, Bergland A, et al. The association of grip strength from midlife onwards with all-cause and cause-specific mortality over 17 years of follow-up in the Tromsø Study. J Epidemiol Community Health. 2016;70:1214-1221.
29. Stanaway FF, Gnjidic D, Blyth FM, et al. How fast does the Grim Reaper walk? Receiver operating characteristics curve analysis in healthy men aged 70 and over. BMJ. 2011;343:d7679.
30. Reiter RE. Risk stratification of prostate cancer 2016. Scand J Clin Lab Invest Suppl. 2016;245:S54-S59.
31. U.S. Department of Veterans Affairs, National Center for Health Promotion and Disease Prevention. Get recommended screening tests and immunizations. https://www.prevention.va.gov/Healthy_Living/Get_Recommended_Screening_Tests_and_Immunizations.asp. Updated September 9, 2016. Accessed June 7, 2017.
32. Buford TW, Anton SD, Judge AR, et al. Models of accelerated sarcopenia: critical pieces for solving the puzzle of age-related muscle atrophy. Ageing Res Rev. 2010;9(4):369-383.
33. Guralnik JM, Simonsick EM, Ferrucci L, et al. A short physical performance battery assessing lower extremity function: association with self-reported disability and prediction of mortality and nursing home admission. J Gerontol. 1994;49(2):M85-M94.
34. Daubney ME, Culham EG. Lower-extremity muscle force and balance performance in adults aged 65 years and older. Phys Ther. 1999;79(12):1177-1185.
35. Bohannon RW. Reference values for the fiverepetition sit-to-stand test: a descriptive metaanalysis of data from elders. Percept Mot Skills. 2006;103(1):215-222.
36. Correa-de-Araujo R, Harris-Love MO, Miljkovic I, Fragala MS, Anthony BW, Manini TM. The need for standardized assessment of muscle quality in skeletal muscle function deficit and other agingrelated muscle dysfunctions: a symposium report. Front Physiol. 2017;8:87.
37. Heymsfield SB, Gonzalez MC, Lu J, Jia G, Zheng J. Skeletal muscle mass and quality: evolution of modern measurement concepts in the context of sarcopenia. Proc Nutr Soc. 2015;74(4):355-366.
38. Harris-Love MO, Monfaredi R, Ismail C, Blackman MR, Cleary K. Quantitative ultrasound: measurement considerations for the assessment of muscular dystrophy and sarcopenia. Front Aging Neurosci. 2014;6:172.
39. Fries JF, Hochberg MC, Medsger TA Jr, Hunder GG, Bombardier C. Criteria for rheumatic disease. Different types and different functions. The American College of Rheumatology Diagnostic and Therapeutic Criteria Committee. Arthritis Rheum. 1994;37(4):454-462.
40. Janssen I, Baumgartner RN, Ross R, Rosenberg IH, Roubenoff R. Skeletal muscle cutpoints associated with elevated physical disability risk in older men and women. Am J Epidemiol.
2004;159(4):413-421.
41. Ismail C, Zabal J, Hernandez HJ, et al. Diagnostic ultrasound estimates of muscle mass and muscle quality discriminate between women with and without sarcopenia. Front Physiol. 2015;6:302.
42. Chen LK, Liu LK, Woo J, et al. Sarcopenia in Asia: consensus report of the Asian Working Group for Sarcopenia. J Am Med Dir Assoc. 2014;15(2):95-101.
43. Aggarwal R, Ringold S, Khanna D, et al. Distinctions between diagnostic and classification criteria? Arthritis Care Res (Hoboken). 2015;67(7):891-897.
44. Licata A. Bone density vs bone quality: what’s a clinician to do? Cleve Clin J Med. 2009;76(6):331-336.
45. Pollock ML, Mengelkoch LJ, Graves JE, et al. Twenty-year follow-up of aerobic power and body composition of older track athletes. J Appl Physiol. 1997;82(5):1508-1516.
Sarcopenia is an age-related loss of skeletal muscle that may result in diminished muscle strength and functional performance. The prevalence of sarcopenia varies based on the cohort and the assessment criteria. According to the Health Aging and Body Composition (ABC) study, the prevalence of sarcopenia in community-dwelling older adults is about 14% to 18%, whereas the estimate may exceed 30% for those in longterm care.1,2 This geriatric syndrome may disproportionately affect veterans given that they are older than the civilian population and may have disabling comorbid conditions associated with military service.3
Recently, there has been a call to action to systematically address sarcopenia by interdisciplinary organizations such as the European Society for Clinical and Economic Aspects of Osteoporosis and Osteoarthritis (ESCEO) and the International Working Group on Sarcopenia (IWGS).4,5 This call to action is due to the association of sarcopenia with increased health care costs, higher disability incidence, and elevated risk of mortality.6,7 The consequences of sarcopenia may include serious complications, such as hip fracture or a loss of functional independence.8,9 The CDC now recognizes sarcopenia as an independently reportable medical condition. Consequently, physicians, nurse practitioners (NPs), and other associated health professionals within the VA will need to better understand clinically viable and valid methods to screen and diagnose this geriatric syndrome.
The purpose of this paper is to inform practitioners how sarcopenia screening is aided by the new ICD-10-CM code and briefly review recent VA initiatives for proactive care. Additional objectives include identifying common methods used to assess sarcopenia and providing general recommendations to the VHA National Center for Health Promotion and Disease Prevention (NCP) concerning the management of sarcopenia.
Addressing Sarcopenia
While the age-related decline in muscle size and performance has long been recognized by geriatricians, sustained advocacy by several organizations was required to realize the formal recognition of sarcopenia. Aging in Motion (AIM), a coalition of organizations focused on advancing research and treatment for conditions associated with age-related muscle dysfunction, sought the formal recognition of sarcopenia. The CDC established the ICD-10-CM code for sarcopenia in October of 2016, which allowed the syndrome to be designated as a primary or secondary condition.10
The ubiquitous nature of agerelated changes in muscle and the mandate to engage in proactive care by all levels of VA leadership led to the focus on addressing sarcopenia. The recognition of sarcopenia by the CDC comes at an opportune time given recent VA efforts to transform itself from a facilitator mainly of care delivery to an active partner in fostering the health and well-being of veterans. Initiatives that are emblematic of this attempt to shift the organizational culture across the VHA include establishing the VA Center for Innovation (VACI) and issuing guidance documents, such as the Blueprint for Excellence, which was introduced in 2014 by then VA Secretary Robert McDonald.11,12 Many of the following Blueprint themes and strategies potentially impact sarcopenia screening and treatment within the VA:
- Delivering high-quality, veteran-centered care: A major Blueprint theme is attaining the “Triple Aims” of a health care system by promoting better health among veterans, improving the provision of care, and lowering costs through operational efficiency. The management of sarcopenia has clear clinical value given the association of age-related muscle loss with fall risk and decreased mobility.13 Financial value also may be associated with the effort to decrease disability related to sarcopenia and the use of a team approach featuring associated health professionals to help screen for this geriatric syndrome.14,15 (Strategy 2)
- Leveraging health care informatics to optimize individual and population health outcomes: The inclusion of the most basic muscle performance and functional status measures in the electronic medical record (EMR), such as grip strength and gait speed, would help to identify the risk factors and determinants of sarcopenia among the veteran population. (Strategy 3)
- Advancing personalized, proactive health care that fosters a high level of health and well-being: The long-term promotion of musculoskeletal health and optimal management of sarcopenia cannot be sustained through episodic medical interactions. Instead, a contemporary approach to health services marked by the continuous promotion of health education, physical activity and exercise, and proper nutrition has demonstrated value in the management of chronic conditions.16,17 (Strategy 6)
The new sarcopenia ICD-10-CM code along with elements of the VHA Blueprint can serve to support the systematic assessment and management of veterans with age-related muscle dysfunction. Nevertheless, renewed calls for health promotion and screening programs are often counterbalanced by the need for cost containment and the cautionary tales concerning the potential harms or errors associated with some forms of medical screening. The American Board of Internal Medicine Foundation has spearheaded the Choosing Wisely campaign to raise awareness about excessive medical testing. However, the Institute of Medicine has linked the provision of quality health care to a diagnostic process that is both timely and accurate.18 Careful consideration of these health care challenges may help guide practitioners within the VA concerning the screening and diagnosis of sarcopenia.
Sarcopenia Assessment
Sarcopenia can have several underlying causes in some individuals and result in varied patterns of clinical presentation and differing degrees of severity. The European Working Group on Sarcopenia in Older People first met in 2009 and used a consensus-based decision-making process to determine operational definitions for sarcopenia and create a staging algorithm for the syndrome.19 This consensus group developed a conceptual staging model with 3 categories: presarcopenia, sarcopenia, and severe sarcopenia (Table 1). The impetus for sarcopenia staging was the emerging research findings suggesting that lean body mass (LBM) alone did not provide a high degree of clinical value in outpatient settings due to the nonlinear relationship between LBM and muscle function in older adults.20,21 Using the consensus model approach, an individual is classified as sarcopenic on presenting with both low LBM and low muscle function.
Screening: A Place to Start
Findings from the Health ABC Study suggested that older adults who maintained high levels of LBM were less likely to become sarcopenic. Whereas, older adults in the cohort with low levels of LBM tended to remain in a sarcopenic state.6 Consequently, the early detection of sarcopenia may have important health promotion implications for older adults. Sarcopenia is a syndrome with a continuum of clinical features; it is not a disease with a clear or singular etiololgy. Therefore, the result of the screening examination should identify those who would most benefit from a formal diagnostic assessment.
One approach to screening for sarcopenia involves the use of questionnaires, such as the SARC-F (sluggishness, assistance in walking, rise from a chair, climb stairs, falls), which is a brief 5-item questionnaire with Likert scoring for patient responses.13 In a cohort of National Health and Nutrition Examination Survey (NHANES) participants, SARC-F scores ≥ 4 were associated with slower gait speed, lower strength, and an increased likelihood of hospitalization within a year of the test response.22 However, rather than stratify patients by risk, the SARC-F exhibits a high degree of test specificity regarding the major consensus-based sarcopenia classification criteria (specificity = 94.2% to 99.1%; sensitivity = 3.8% to 9.9%).13 Given the known limitations of screening tools with low sensitivity, organizations such as the ESCEO have recommended supplementing the SARC-F questionnaire with other forms of assessment.4 Supplements to the screening examination may range from the use of “red flag” questions concerning changes in nutritional status, body weight, and physical activity, to conducting standard gait speed and grip-strength testing.4,19,23
Performance-based testing, including habitual gait speed and grip-strength dynamometry, also may be used in both the screening and classification of sarcopenia.2 Although walking speed below 1.0 m/s has been used by the IWGS as a criterion to prompt further assessment, many people within the VA health care system may have gait abnormalities independent of LBM status, and others may be nonambulatory.24,25 As a result, grip-strength testing should be considered as a supplementary or alternate screening assessment tool.26,27
Hand-grip dynamometry is often used diagnostically given its previous test validation, low expense, and ease of use.23 Moreover, recent evidence suggests that muscle strength surpasses gait speed as a means of identifying people with sarcopenia. Grip strength is associated with all-cause mortality, even when adjusting for age, sex, and body size,28 while slow gait speed (< .82 m/s) has a reported sensitivity of 63% and specificity of 70% for mortality in population-based studies involving older adults.29
Gait speed (in those who are ambulatory) and grip-strength values could be entered into the EMR evaluation note by the primary care provider (PCP). Elements of the VA EMR, such as the ability to review the diagnosis of sarcopenia on the Problem List or the nominal enhancement of providing LBM estimates within the Cumulative Vitals and Measurements Report would support the management of sarcopenia. See Table 2 for cutoff values for frequently used sarcopenia screening and staging tests.
The pitfalls of excessive or inappropriate screening are well documented. The efforts to screen for prostate cancer have highlighted instances when inappropriate followup tests and treatment fail to alter mortality rates and ultimately yield more harm than good.30 However, there are several points of departure concerning the screening for sarcopenia vs screening for prostate cancer. The screening assessments for sarcopenia are low-cost procedures that are associated with a low patient burden. These procedures may include questionnaires, functional testing, or the assessment of muscle performance. Additionally, there is a low propensity for adverse effects stemming from treatment due to disease misclassification given the common nonpharmacologic approaches used to manage sarcopenia.31 Nonetheless, the best screening examination—even one that has low patient burden and cost—may prove to be a poor use of medical resources if the process is not linked to a viable intervention.
Screening people aged ≥ 65 years may strike a balance between controlling health care expenditures and identifying people with the initial signs of sarcopenia early enough to begin monitoring key outcomes and providing a formalized exercise prescription. Presuming an annual age-related decline in LBM of 1.5%, and considering the standard error measurement of the most frequently used methods of strength and LBM assessment, recurrent screening could occur every 2 years.21,32
Earlier screening may be considered for patient populations with a higher pretest probability. These groups include those with conditions associated with accelerated muscle loss, such as chronic kidney disease, peripheral artery disease, and diabetes mellitus (DM).32 Although accelerated muscle loss characterized by an inflammatory motif (eg, cancer-related cachexia) may share some features of the sarcopenia screening and assessment approach, important differences exist regarding the etiology, medical evaluation, and ICD-10-CM code designation.
Staging and Classification
Staging criteria are generally used to denote the severity of a given disease or syndrome, whereas classification criteria are used to define homogenous patient groups based on specific pathologic or clinical features of a disorder. Although classification schemes may incorporate an element of severity, they are primarily used to characterize fairly distinct phenotypic forms of disease or specific clinical presentation patterns associated with a well-defined syndrome. Although not universally adopted, the European consensus group sarcopenia staging criteria are increasingly used to provide a staging algorithm presumably driven by the severity of the condition.19
The assessment of functional performance for use in sarcopenia staging often involves measuring habitual gait speed or completing the Short Physical Performance Battery (SPPB).23 The SPPB involves a variety of performance-based activities for balance, gait, strength, and endurance. This test has predictive validity for the onset of disability and adverse health events, and it has been extensively used in research and clinical settings.33 Additional tests used to characterize function during the staging or diagnostic process include the timed get up and go test (TGUG) and the timed sit to stand test.34,35 The TGUG provides an estimate of dynamic balance, and the sit to stand test has been used as very basic proxy measure of muscular power.36 The sit to stand test and habitual gait speed are items included in the SPPB.33
Accepted methods to obtain the traditional index measure of sarcopenia—based on estimates of LBM—include bioimpedance analysis (BIA) and dual X-ray absorptiometry (DXA). The BIA uses the electrical impedance of body tissues and its 2 components, resistance and reactance, to derive its body composition estimates.37 Segmental BIA allows for isolated measurements of the limbs, which may be calibrated to DXA appendicular lean body mass (ALM) or magnetic resonance imaging-based estimates of LBM. This instrument is relatively safe for use, inexpensive for medical facilities, and useful for longitudinal studies, but it can be confounded by issues, such as varying levels of hydration, which may affect measurement validity in some instances.
Despite the precision of DXA for estimating densities for whole body composition analysis, the equipment is not very portable and involves low levels of radiation exposure, which limits its utility in some clinical settings. While each body composition assessment method has its advantages and disadvantages, DXA is regarded as an acceptable form of measurement for hospital settings, and BIA is frequently used in outpatient clinics and community settings. Other methods used to estimate LBM with greater accuracy, such as peripheral quantitative computed tomography, doubly labeled water, and whole body gamma ray counting, are not viable for clinical use. Other accessible methods such as anthropometric measures and skinfold measures have not been embraced by sarcopenia classification consensus groups.23,37
Alternative methods of estimating LBM, such as diagnostic ultrasound and multifrequency electrical impedance myography, are featured outcomes in ongoing clinical trials that involve veteran participants. These modalities may soon provide a clinically viable approach to assessing muscle quality via estimates of muscle tissue composition.37,38 Similar to the management of other geriatric syndromes, interprofessional collaboration provides an optimal approach to the assessment of sarcopenia. Physicians and other health care providers may draw on the standardized assessment of strength and function (via the SPPB and hand-grip dynamometry) by physical therapists (PTs), questionnaires administered by nursing staff (the SARC-F), or body composition estimates from other health professionals (ranging from BIA to DXA) to aid the diagnostic process and facilitate appropriate case management (Table 2).
Competing staging and classification definitions have been cited as a primary factor behind the CDC’s delayed recognition of the sarcopenia diagnosis, which in turn posed a barrier to formal clinical recognition by geriatricians.24 However, this reaction to the evolving sarcopenia staging criteria also may reveal the larger misapplication of the staging process to the diagnostic process. The application of classification and staging criteria results in a homogenous group of patients, whereas the application of diagnostic criteria results in a heterogeneous group of patients to account for variations in clinical presentation associated with a given disorder. Classification criteria may be equivalent to objective measures that are used in the diagnostic process when a given disease is characterized by a well-established biomarker.39
However, this is not the case for most geriatric syndromes and other disorders marked by varied clinical presentation patterns. On considering the commonly used sarcopenia staging criteria of LBM ≤ 8.50 kg/m2 or grip strength < 30 kg in men and LBM ≤ 5.75 kg/m2 or grip strength < 20 kg in women, it is easy to understand that such general cutoff values are far from diagnostic.40,41 Moreover, stringent cutoff values associated with classification and staging may not adequately capture those with an atypical presentation of the syndrome (eg, someone who exhibits age-related muscle weakness but has retained adequate LBM). Such criteria often prove to have high specificity and low sensitivity, which may yield a false negative rate that is appropriate for clinical research eligibility and group assignment but inadequate for clinical care.
Screening, staging, and classification criteria with high specificity may indeed be desirable for confirmatory imaging tests associated with radiation exposure concerns or for managing risk in experimental clinical trials involving pharmacologic treatment. For example, a SARC-F score ≥ 4 may prompt the formal assessment of LBM via a DXA examination.4 In contrast, those with a SARC-F score ≤ 3 with low gait speed or grip strength may benefit from consultation regarding regular physical activity and nutrition recommendations. Given the challenges of establishing sarcopenia classification criteria that perform consistently across populations and geographic regions, classification and staging criteria may be best viewed as clinical reasoning tools that supplement, but not supplant, the diagnostic process.7,42
Diagnosis
Geriatric syndromes do not lend themselves to a simple diagnostic process. Syndromes such as frailty and sarcopenia are multifactorial and lack a single distinguishing clinical feature or biomarker. The oft-cited refrain that sarcopenia is an underdiagnosed condition is partially explained by the recent ICD-10-CM code and varied classification and diagnostic criteria.5 This circumstance highlights the need to distinctly contrast the diagnostic process with the screening and staging classifications.
The diagnostic process involves the interpretation of the patient history, signs, and symptoms within the context of individual factors, local or regional disease prevalence, and the results of the best available and most appropriate laboratory tests. After all, a patient that presents with low LBM and a gradual loss of strength without a precipitating event would necessitate further workup to rule out many clinical possibilities under the aegis of a differential diagnosis. Clinical features, such as the magnitude of weakness and pattern of strength loss or muscle atrophy along with the determination of neurologic or autoimmune involvement, are among the key elements of the differential examination for a case involving the observation of frank muscle weakness. Older adults with low muscle strength may have additional risk factors for sarcopenia such as obesity, pain, poor nutrition, previous bone fracture, and a sedentary lifestyle. However, disease etiology with lower probabilities, such as myogenic or neurogenic conditions associated with advancing age, also may be under consideration during the clinical assessment.6
In many instances, the cutoff scores associated with the sarcopenia staging criteria may help to guide the diagnostic process and aid clinical decision making. Since individuals with a positive screening result based on the SARC-F questionnaire (score ≥ 4) have a high likelihood of meeting the staging criteria for severe sarcopenia, a PCP may opt to obtain a confirmatory estimate of LBM both to support the clinical assessment and to monitor change over the course of rehabilitation. Whereas people who present with a decline in strength (ie, grip strength < 30 kg for a male) without an observable loss of function or a positive SARC-F score may benefit from consultation from the physician, NP, or rehabilitation health professional regarding modifiable risk factors associated with sarcopenia.
Incorporating less frequently used sarcopenia classification schemes such as identifying those with sarcopenic obesity or secondary sarcopenia due to mitigating factors such as chronic kidney disease or DM (Table 3) may engender a more comprehensive approach to intervention that targets the primary disease while also addressing important secondary sequelae. Nevertheless, staging or classification criteria cannot be deemed equivalent to diagnostic criteria for sarcopenia due to the challenges posed by syndromes that have a heterogeneous clinical presentation.
The refinement of the staging and classification criteria along with the advances in imaging technology and mechanistic research are not unique to sarcopenia. Practitioners involved in the care of people with rheumatologic conditions or osteoporosis also have contended with continued refinements to their classification criteria and approach to risk stratification.39,43,44 Primary care providers will now have the option to use a new ICD-10-CM code (M62.84) for sarcopenia, which will allow them to properly document the clinical distinctions between people with impaired strength or function largely due to age-related muscle changes and those who have impaired muscle function due to cachexia, inflammatory myopathies, or forms of neuromuscular disease.
The ability to identify and document this geriatric syndrome in veterans will help to better define the scope of the problem within the VA health care system. The median age of veterans is 62 years compared with 43 years for nonveterans.3 Consequently, there may be value in the adoption of a formal approach to screening and diagnosis for sarcopenia among veterans who receive their primary care from VA facilities.7 Indeed, the exchange between the patient and the health professional regarding the screening and diagnostic process will provide valuable opportunities to promote exercise interventions before patients incur significant impairments.
One of the biggest threats burdening global health is noncommunicable diseases, and many chronic conditions, such as sarcopenia, can be prevented and managed with appropriate levels of physical activity.17 Increased physician involvement may prove to be critical given the identification of physical inactivity as a top 5 risk factor for general morbidity and mortality by World Health Organization and consensus group recommendations calling for physicians to serve a more prominent role in the provision of exercise and physical activity recommendations.16,17
This developing health care role should include NPs, PTs, physician assistants, and other associated health professionals. It also should include collaborative efforts between physicians and rehabilitation practitioners concerning provision of the formal exercise prescriptionprescription and monitoring of patient outcomes.
Individuals with severe forms of sarcopenia rarely improve without intervention.6 Although no pharmacologic treatment exists to specifically address sarcopenia, strengthening exercise has been shown to be an effective mode of prevention and conservative management.8 Progressive resistance exercise cannot abate the expected age-related changes in skeletal muscle, but it can significantly reverse the loss of LBM and strength in untrained older adults and slow the age-related decline in muscle performance in older adult athletes and trained individuals.45
Local senior centers and community organizations may prove to be valuable resources concerning group exercise options, and they provide the added benefit of social engagement and peer group accountability. Federal resources include the Go4Life exercise guide and online videos provided by the National Institute on Aging and the MOVE! Weight Management and Health Program provided at select VA community-based outpatient clinics. Ultimately, collaborative efforts with exercise specialists may serve to reduce the PCP burden during the provision of health services, minimize diagnostic errors associated with sarcopenia assessment and help to connect patients to valuable health promotion resources.17,18
Conclusion
While practitioners should remain keenly aware of the pernicious effects of overdiagnosis, sarcopenia has long existed as a known, but undiagnosed, condition. Of course, geriatricians have traditionally managed poor muscle performance and mobility limitations by addressing treatable symptoms and providing referrals to physical medicine specialists when warranted. Nevertheless, the advent of ICD-10-CM code M62.84 provides the VA with an opportunity to take a leading role in systematically addressing this geriatric syndrome within an aging veteran population.
The following items should be considered by NCP for the development of guidelines and recommendations concerning sarcopenia screening:
- Consider screening veterans aged > 65 years for sarcopenia every 2 years. Those with mitigating systemic conditions (eg, chronic kidney disease, DM, or malnutrition) or significant mobility limitations may be screened at any age.
- Sarcopenia screening procedures should include at a minimum the SARC-F questionnaire and gait speed (when appropriate). Including gait speed or grip strength testing in the screening exam is recommended given the low sensitivity of the SARC-F questionnaire.
- Veterans with positive SARC-F results (≥ 4) merit a physical therapy referral. In addition, these veterans should obtain confirmatory standardized assessments for LBM and functional status.
- Veterans at risk for sarcopenia based on patient age, medical history, and the physical examination (eg, obesity, sedentary lifestyle, a previous fracture, self-reported physical decline), but with negative SARC-F results should receive a formal exercise prescription from their PCP. Baseline assessment measures may be used for comparison with serial measures obtained during subsequent screening visits to support long-term case management.
- Interprofessional collaboration involving geriatricians, PTs, nurses, radiologists, and other health care professionals should be involved in the screening, diagnosis, and case management of veterans with sarcopenia.
- The VA EMR should be systematically documented with sarcopenia assessment data obtained from the gait speed tests, SARCF, SPPB, grip strength tests, and LBM estimates to better characterize this condition within the veteran population.
Any expansion in the provision of health care comes with anticipated benefits and potential costs. Broad guidance from NCP may encourage veterans to pursue selected screening tests, promote the appropriate use of preventative services, and facilitate timely treatment when needed.31 Clinicians who are informed about the screening, staging, classification, and diagnostic process for sarcopenia may partner with patients to make reasoned decisions about how to best manage this syndrome within the VA medical center environment.
1. Newman AB, Kupelian V, Visser M, et al; Health ABC Study Investigators. Sarcopenia: alternative definitions and associations with lower extremity function. J Am Geriatr Soc. 2003;51(11):1602-1609.
2. Cruz-Jentoft AJ, Landi F, Schneider SM, et al. Prevalence of and interventions for sarcopenia in ageing adults: a systematic review. Report of the International Sarcopenia Initiative (EWGSOP and IWGS). Age Ageing. 2014;43(6):748-759.
3. U.S. Department of Veterans Affairs, National Center for Veterans Analysis and Statistics. Profile of veterans: 2009. Data from the American Community Survey. http://www.va.gov/vetdata/docs/SpecialReports/Profile_of_Veterans_2009_FINAL.pdf. Published January 2011. Accessed May 18, 2017.
4. Beaudart C, McCloskey E, Bruyère O, et al. Sarcopenia in daily practice: assessment and management. BMC Geriatr. 2016;16(1):170.
5. Fielding RA, Vellas B, Evans WJ, et al. Sarcopenia: an undiagnosed condition in older adults. Current consensus definition: prevalence, etiology, and consequences. International working group on sarcopenia. J Am Med Dir Assoc. 2011;12(4):249-256.
6. Murphy RA, Ip EH, Zhang Q, et al; Health, Aging, and Body Composition Study. Transition to sarcopenia and determinants of transitions in older adults: a population-based study. J Gerontol A Biol Sci Med Sci. 2014;69(6):751-758.
7. Harris-Love MO, Adams B, Hernandez HJ, DiPietro L, Blackman MR. Disparities in the consequences of sarcopenia: implications for African American veterans. Front Physiol. 2014;5:250.
8. Morley JE. Sarcopenia in the elderly. Fam Pract. 2012;29(suppl 1):i44-i48.
9. Fragala MS, Dam TT, Barber V, et al. Strength and function response to clinical interventions of older women categorized by weakness and low lean mass using classifications from the Foundation for the National Institute of Health sarcopenia project. J Gerontol A Biol Sci Med Sci. 2015;70(2):202-209.
10. Aging in Motion. AIM coalition announces establishment of ICD-10-CM Code for Sarcopenia
by the Centers for Disease Control and Prevention [press release]. http://aginginmotion.org/news/2388-2/. Published April 28, 2016. Accessed June 7, 2017.
11. U.S. Department of Veterans Affairs, Veterans Health Administration. Blueprint for excellence. https://www.va.gov/HEALTH/docs/VHA _Blueprint_for_Excellence.pdf. Published September 21, 2014. Accessed June 7, 2017.
12. U.S. Department of Veterans Affairs. VA Center of Innovation 2010–2012 stakeholder report. https://www.innovation.va.gov/docs/VACI_2010-2012_Stakeholder_Report.pdf. Published 2012. Accessed June 14, 2017.
13. Woo J, Leung J, Morley JE. Validating the SARCF: a suitable community screening tool for sarcopenia? J Am Med Dir Assoc. 2014;15(9):630-634.
14. Sousa AS, Guerra RS, Fonseca I, Pichel F, Ferreira S, Amaral TF. Financial impact of sarcopenia on hospitalization costs. Eur J Clin Nutr. 2016;70(9):1046-1051.
15. Janssen I, Shepard DS, Katzmarzyk PT, Roubenoff R. The healthcare costs of sarcopenia in the United States. J Am Geriatr Soc. 2004;52(1):80-85.
16. Ekelund U, Steene-Johannessen J, Brown WJ, et al; Lancet Physical Activity Series 2 Executive Committe; Lancet Sedentary Behaviour Working Group. Does physical activity attenuate, or even eliminate, the detrimental association of sitting time with mortality? A harmonised meta-analysis of data from more than 1 million men and women. Lancet. 2016;388(10051):1302-1310.
17. Thornton JS, Frémont P, Khan K, et al. Physical activity prescription: a critical opportunity to address a modifiable risk factor for the prevention and management of chronic disease: a position statement by the Canadian Academy of Sport and Exercise Medicine. Clin J Sport Med.
2016;26(4):259-265.
18. The National Academies of Sciences, Engineering, and Medicine; Committee on Diagnostic Error in Health Care, Board on Health Care Services; Institute of Medicine. Improving Diagnosis in Health Care. Washington, DC: National Academies Press;2015.
19. Cruz-Jentoft AJ, Baeyens JP, Bauer JM, et al; European Working Group on Sarcopenia in Older People. Sarcopenia: European consensus on definition and diagnosis: report of the European Working Group on Sarcopenia in Older People. Age Ageing. 2010;39(4):412-423.
20. Ferrucci L, Guralnik JM, Buchner D, et al. Departures from linearity in the relationship between measures of muscular strength and physical performance of the lower extremities: the Women’s Health and Aging Study. J Gerontol A Biol Sci Med Sci. 1997;52(5):M275-M285.
21. Goodpaster BH, Park SW, Harris TB, et al. The loss of skeletal muscle strength, mass, and quality in older adults: the Health, Aging and Body Composition Study. J Gerontol A Biol Sci Med Sci. 2006;61(10):1059-1064.
22. Malmstrom TK, Miller DK, Simonsick EM, Ferrucci L, Morley JE. SARC-F: a symptom score to predict persons with sarcopenia at risk for poor functional outcomes. J Cachexia Sarcopenia Muscle. 2016;7(1):28-36.
23. Cooper C, Fielding R, Visser M, et al. Tools in the assessment of sarcopenia. Calcif Tissue Int. 2013;93(3):201-210.
24. Lee WJ, Liu LK, Peng LN, Lin MH, Chen LK; ILAS Research Group. Comparisons of sarcopenia defined by IWGS and EWGSOP criteria among older people: results from the I-Lan longitudinal aging study. J Am Med Dir Assoc. 2013;14(7):528.e1-e7.
25. Cesari M, Kritchevsky SB, Penninx BW, et al. Prognostic value of usual gait speed in well-functioning older people—results from the Health, Aging and Body Composition Study. J Am Geriatr Soc. 2005;53(10):1675-1680.
26. Rossi AP, Fantin F, Micciolo R, et al. Identifying sarcopenia in acute care setting patients. J Am Med Dir Assoc. 2014;15(4):303.e7-e12.
27. Sánchez-Rodríguez D, Marco E, Miralles R, et al. Does gait speed contribute to sarcopenia casefinding in a postacute rehabilitation setting? Arch Gerontol Geriatr. 2015;61(2):176-181.
28. Strand BH, Cooper R, Bergland A, et al. The association of grip strength from midlife onwards with all-cause and cause-specific mortality over 17 years of follow-up in the Tromsø Study. J Epidemiol Community Health. 2016;70:1214-1221.
29. Stanaway FF, Gnjidic D, Blyth FM, et al. How fast does the Grim Reaper walk? Receiver operating characteristics curve analysis in healthy men aged 70 and over. BMJ. 2011;343:d7679.
30. Reiter RE. Risk stratification of prostate cancer 2016. Scand J Clin Lab Invest Suppl. 2016;245:S54-S59.
31. U.S. Department of Veterans Affairs, National Center for Health Promotion and Disease Prevention. Get recommended screening tests and immunizations. https://www.prevention.va.gov/Healthy_Living/Get_Recommended_Screening_Tests_and_Immunizations.asp. Updated September 9, 2016. Accessed June 7, 2017.
32. Buford TW, Anton SD, Judge AR, et al. Models of accelerated sarcopenia: critical pieces for solving the puzzle of age-related muscle atrophy. Ageing Res Rev. 2010;9(4):369-383.
33. Guralnik JM, Simonsick EM, Ferrucci L, et al. A short physical performance battery assessing lower extremity function: association with self-reported disability and prediction of mortality and nursing home admission. J Gerontol. 1994;49(2):M85-M94.
34. Daubney ME, Culham EG. Lower-extremity muscle force and balance performance in adults aged 65 years and older. Phys Ther. 1999;79(12):1177-1185.
35. Bohannon RW. Reference values for the fiverepetition sit-to-stand test: a descriptive metaanalysis of data from elders. Percept Mot Skills. 2006;103(1):215-222.
36. Correa-de-Araujo R, Harris-Love MO, Miljkovic I, Fragala MS, Anthony BW, Manini TM. The need for standardized assessment of muscle quality in skeletal muscle function deficit and other agingrelated muscle dysfunctions: a symposium report. Front Physiol. 2017;8:87.
37. Heymsfield SB, Gonzalez MC, Lu J, Jia G, Zheng J. Skeletal muscle mass and quality: evolution of modern measurement concepts in the context of sarcopenia. Proc Nutr Soc. 2015;74(4):355-366.
38. Harris-Love MO, Monfaredi R, Ismail C, Blackman MR, Cleary K. Quantitative ultrasound: measurement considerations for the assessment of muscular dystrophy and sarcopenia. Front Aging Neurosci. 2014;6:172.
39. Fries JF, Hochberg MC, Medsger TA Jr, Hunder GG, Bombardier C. Criteria for rheumatic disease. Different types and different functions. The American College of Rheumatology Diagnostic and Therapeutic Criteria Committee. Arthritis Rheum. 1994;37(4):454-462.
40. Janssen I, Baumgartner RN, Ross R, Rosenberg IH, Roubenoff R. Skeletal muscle cutpoints associated with elevated physical disability risk in older men and women. Am J Epidemiol.
2004;159(4):413-421.
41. Ismail C, Zabal J, Hernandez HJ, et al. Diagnostic ultrasound estimates of muscle mass and muscle quality discriminate between women with and without sarcopenia. Front Physiol. 2015;6:302.
42. Chen LK, Liu LK, Woo J, et al. Sarcopenia in Asia: consensus report of the Asian Working Group for Sarcopenia. J Am Med Dir Assoc. 2014;15(2):95-101.
43. Aggarwal R, Ringold S, Khanna D, et al. Distinctions between diagnostic and classification criteria? Arthritis Care Res (Hoboken). 2015;67(7):891-897.
44. Licata A. Bone density vs bone quality: what’s a clinician to do? Cleve Clin J Med. 2009;76(6):331-336.
45. Pollock ML, Mengelkoch LJ, Graves JE, et al. Twenty-year follow-up of aerobic power and body composition of older track athletes. J Appl Physiol. 1997;82(5):1508-1516.
Proposed Budget Cuts Worry Native Americans
The proposed 2018 budget is raising alarm among Native Americans, according to an article in Voanews.com, the news website of Voice of America. The budget would drastically cut or eliminate agencies and programs that provide critical services to about 2.2 million Native Americans and Alaska Natives. The proposed cuts include the following:
- > $300 million from the Bureau of Indian Affairs
- 31.4% from the Environmental Protection Agency
- 18% from HHS, which houses IHS
- 13.5% from the Department of Education
- 13.2% from Housing and Urban Development
The proposed budget also would eliminate programs such as the Low Income Home Energy Assistance Program (LIHEAP). In 2016, 150 tribal groups and > 43,000 Native households received LIHEAP funds. In Alaska, the Essential Air Service, often the only route to health care in remote areas, also is slated to be cut.
Mark Trahant, journalist, academic, and member of the Shoshone-Bannock tribes, pointed out that “In Indian Country, more than half of all Indian kids who go through Indian Health Service have their insurance through Medicaid. Thirteen percent of Medicaid is Indian care.”
Fawn Sharp, president of the Affiliated Tribes of Northwest Indians, called the proposed cuts “illogical and unreasonable.” They are “cutting into the bone and fail to recognize very real and critically important needs,” she said at a tribal conference.
Lawmakers from states with large Native American populations, including Tom Udall (D-NM), vice chairman of the Senate Committee on Indian Affairs, and Tom Cole (R-OK) a member of the Chickasaw Nation, are speaking against the proposals. Cole says the budget shows the administration “doesn’t care very much about Indian health care.”
However, Trahant notes that releasing the budget is only the first step in a potentially long process, and says it is now up to Congress to rework it.
Idarucizumab reversed dabigatran completely and rapidly in study
One IV 5-g dose of idarucizumab completely, rapidly, and safely reversed the anticoagulant effect of dabigatran, according to final results for 503 patients in the multicenter, prospective, open-label, uncontrolled RE-VERSE AD study.
Uncontrolled bleeding stopped a median of 2.5 hours after 134 patients received idarucizumab. In a separate group of 202 patients, 197 were able to undergo urgent procedures after a median of 1.6 hours, Charles V. Pollack Jr., MD, and his associates reported at the International Society on Thrombosis and Haemostasis congress. The report was simultaneously published in the New England Journal of Medicine.
Idarucizumab was specifically developed to reverse the anticoagulant effect of dabigatran. Many countries have already licensed the humanized monoclonal antibody fragment based on interim results for the first 90 patients enrolled in the Reversal Effects of Idarucizumab on Active Dabigatran (RE-VERSE AD) study (NCT02104947), noted Dr. Pollack, of Thomas Jefferson University, Philadelphia.
The final RE-VERSE AD cohort included 301 patients with uncontrolled gastrointestinal, intracranial, or trauma-related bleeding and 202 patients who needed urgent procedures. Participants from both groups typically were white, in their late 70s (age range, 21-96 years), and receiving 110 mg (75-150 mg) dabigatran twice daily. The primary endpoint was maximum percentage reversal within 4 hours after patients received idarucizumab, based on diluted thrombin time and ecarin clotting time.
The median maximum percentage reversal of dabigatran was 100% (95% confidence interval, 100% to 100%) in more than 98% of patients, and the effect usually lasted 24 hours. Among patients who underwent procedures, intraprocedural hemostasis was considered normal in 93% of cases, mildly abnormal in 5% of cases, and moderately abnormal in 2% of cases, the researchers noted. Seven patients received another dose of idarucizumab after developing recurrent or postoperative bleeding.
A total of 24 patients had an adjudicated thrombotic event within 30 days after receiving idarucizumab. These events included pulmonary embolism, systemic embolism, ischemic stroke, deep vein thrombosis, and myocardial infarction. The fact that many patients did not restart anticoagulation could have contributed to these thrombotic events, the researchers asserted. They noted that idarucizumab had no procoagulant activity in studies of animals and healthy human volunteers.
About 19% of patients in both groups died within 90 days. “Patients enrolled in this study were elderly, had numerous coexisting conditions, and presented with serious index events, such as intracranial hemorrhage, multiple trauma, sepsis, acute abdomen, or open fracture,” the investigators wrote. “Most of the deaths that occurred within 5 days after enrollment appeared to be related to the severity of the index event or to coexisting conditions, such as respiratory failure or multiple organ failure, whereas deaths that occurred after 30 days were more likely to be independent events or related to coexisting conditions.”
Boehringer Ingelheim Pharmaceuticals provided funding. Dr. Pollack disclosed grant support from Boehringer Ingelheim during the course of the study and ties to Daiichi Sankyo, Portola, CSL Behring, Bristol-Myers Squibb/Pfizer, Janssen Pharma, and AstraZeneca. Eighteen coinvestigators also disclosed ties to Boehringer Ingelheim and a number of other pharmaceutical companies. Two coinvestigators had no relevant financial disclosures.
FROM 2017 ISTH CONGRESS
Key clinical point:
Major finding: Uncontrolled bleeding stopped a median of 2.5 hours after 134 patients received idarucizumab. In a separate group, 197 patients were able to undergo urgent procedures after a median of 1.6 hours.
Data source: A multicenter, prospective, open-label study of 503 patients (RE-VERSE AD).
Disclosures: Boehringer Ingelheim Pharmaceuticals provided funding. Dr. Pollack disclosed grant support from Boehringer Ingelheim during the course of the study and ties to Daiichi Sankyo, Portola, CSL Behring, BMS/Pfizer, Janssen Pharma, and AstraZeneca. Eighteen coinvestigators disclosed ties to Boehringer Ingelheim and a number of other pharmaceutical companies. Two coinvestigators had no relevant financial disclosures.
How Well Does Metabolic Syndrome Predict Prognosis of STEMI?
Metabolic syndrome (MetS) is common among patients with coronary artery disease (CAD) and highly prevalent in those with acute ST-elevation myocardial infarction (STEMI). But are all elements of MetS equally good predictors of clinical severity and prognosis?
To find out, researchers from Sestre Milosrdnice University Hospital Center in Zagreb, Croatia, prospectively analyzed data of 250 patients with acute STEMI who were treated with primary percutaneous coronary intervention. Metabolic syndrome was defined according to the revised National Cholesterol Education Program-Adult Treatment Panel III and the International Diabetes Federation.
Patients with and without MetS were analyzed according to obesity indexes: body mass index (BMI); central-body adiposity index (BAI); conicity index (Cindex); visceral adiposity index (VAI); waist circumference (WC); waist-to-hip ratio (WHR); and waist-to-height ratio (WHtR).
During hospitalization, 19 patients died; 231 were included in the 12-month follow-up.
Patients with acute STEMI had high rates of central obesity, increased VAI, WHtR, and very high BAI, dyslipidemia, and hypertension. However, they had lower rates of overall obesity and hyperglycemia.
The researchers found MetS and several obesity indexes were superior to overall obesity BMI in predicting acute STEMI severity: clinical presentation, in-hospital complications, and severity of CAD. Waist circumference and MetS had no influence on prognosis. Moreover, MetS and obesity indexes had no influence on prognosis of major adverse cardiovascular events (MACE).
The researchers also found Cindex > 1.25/1.18, very high BAI, and WHtR ≥ 63/58 increased the risk of total in-hospital complications, dyspnea, and heart failure, respectively. The number of significantly stenosed coronary arteries increased the risk of total MACE. Waist-to-hip ratio independently increased the risk of significant stenosis of the coronary segment 1 and proximal/middle coronary artery (CA) segments.
In a previous study, the researchers had found that MetS patients had longer hospitalization and severe CAD. However, although MetS increased the risk of > 1 significantly stenosed CAs and total in-hospital complications, none of the MetS components per se significantly influenced clinical severity or prognosis; except hyperglycemia, which increased the risk of heart failure. The researchers found that was still true in this study, but Cindex was a stronger predictor of total in-hospital complications. The researchers concluded that VAI is more reliable than WC for predicting clinical severity of acute STEMI.
Source:
Jelavic MM, Barbic Z, Pintaric H. Arch Med Sci. 2017;13(4):795-806.
doi: https://doi.org/10.5114/aoms.2016.59703.
Antibody reduces bleeding in hemophilia A patients with inhibitors

BERLIN—Emicizumab can reduce bleeding in adults and adolescents with hemophilia A and inhibitors to factor VIII, according to a phase 3 trial.
In the HAVEN 1 trial, prophylaxis with emicizumab reduced the treated bleed rate by 87% when compared to no prophylaxis.
Emicizumab reduced the treated bleed rate by 79% when compared to prior prophylaxis with bypassing agents (BPAs).
The incidence of adverse events (AEs) related to emicizumab was 22%, and the incidence of serious AEs was 9%.
There were 3 cases of thrombotic microangiopathy, 2 serious thromboembolic events, and 1 death (from hemorrhage).
These results were presented at the 26th International Society on Thrombosis and Haemostasis (ISTH) Congress and published in NEJM.
The study was funded by F. Hoffmann–La Roche and Chugai Pharmaceutical.
“The HAVEN 1 study is one of the most robust clinical studies conducted to date in people with hemophilia A with inhibitors to factor VIII, including a first-ever intra-patient comparison to prior prophylaxis with bypassing agents,” said study author Johannes Oldenburg, MD, PhD, of the University of Bonn in Bonn, Germany.
“The reduction in bleeding events across all measures seen with emicizumab compared to either on-demand or prophylactic bypassing agents supports that it may be one of the most significant scientific innovations in the treatment of hemophilia A in over 30 years.”
Emicizumab is a bispecific monoclonal antibody designed to bring together factors IXa and X, proteins required to activate the natural coagulation cascade and restore the blood clotting process.
HAVEN 1 is a randomized, phase 3 study of emicizumab that enrolled 109 patients (12 years of age or older) with hemophilia A and inhibitors to factor VIII. The patients were previously treated with BPAs on-demand or as prophylaxis.
Patients previously treated with on-demand BPAs were randomized in a 2:1 fashion to receive emicizumab prophylaxis (Arm A) or no prophylaxis (Arm B).
Patients previously treated with prophylactic BPAs received emicizumab prophylaxis (Arm C). Additional patients previously on BPAs (on-demand or prophylaxis) were also enrolled in a separate arm (Arm D).
On-demand treatment of breakthrough bleeds with BPAs was allowed per protocol in all arms.
Efficacy
The primary endpoint of this study was the number of treated bleeds over time with emicizumab prophylaxis (Arm A) compared with no prophylaxis (Arm B).
There was a significant reduction in treated bleeds of 87% (risk rate [RR]=0.13, P<0.0001) with emicizumab compared with no prophylaxis.
The researchers also performed an intra-patient comparison of bleed rate with emicizumab prophylaxis to bleed rate with prior prophylaxis (with BPAs) for patients in Arm C. A subset of patients in this arm had previously participated in a non-interventional study (NIS), which allowed for the comparison.
The analysis showed a 79% (RR=0.21, P=0.0003) reduction in treated bleeds in patients receiving emicizumab compared with their prior prophylaxis during the NIS.
Additional data on bleeds in Arms A, B, and C are included in the following table.
| Study group | No prophylaxis
(prior episodic BPAs)
(Arm B; n=18) |
Emicizumab prophylaxis
(prior episodic BPAs)
(Arm A; n=35) |
| Treated bleeds annualized bleeding rate (ABR, primary endpoint) | ||
| ABR*
(95% CI) |
23.3
(12.33; 43.89) |
2.9
(1.69; 5.02) |
| % reduction
(RR, P value) |
87% reduction
(RR=0.13, P<0.0001) |
|
| Median ABR
(Interquartile range; IQR) |
18.8
(12.97; 35.08) |
0.0
(0.00; 3.73) |
| % patients with 0 bleeds (95% CI) | 5.6
(0.1; 27.3) |
62.9
(44.9; 78.5) |
| All bleeds ABR (secondary endpoint) | ||
| ABR*
(95% CI) |
28.3
(16.79; 47.76) |
5.5
(3.58; 8.60) |
| % reduction
(RR, P value) |
80% reduction
(RR=0.20, P<0.0001) |
|
| % patients with 0 bleeds (95% CI) | 5.6
(0.1; 27.3) |
37.1
(21.5; 55.1) |
| Treated spontaneous bleeds ABR (secondary endpoint) | ||
| ABR*
(95% CI) |
16.8
(9.94; 28.30) |
1.3
(0.73; 2.19) |
| % reduction
(RR, P value) |
92% reduction
(RR=0.08, P<0.0001) |
|
| % patients with 0 bleeds (95% CI) | 11.1
(1.4; 34.7) |
68.6
(50.7; 83.1) |
| Treated joint bleeds ABR (secondary endpoint) | ||
| ABR*
(95% CI) |
6.7
(1.99; 22.42) |
0.8
(0.26; 2.20) |
| % reduction
(RR, P value) |
89% reduction
(RR=0.11, P=0.0050) |
|
| % patients with 0 bleeds (95% CI) | 50.0
(26.0; 74.0) |
85.7
(69.7; 95.2) |
| Treated target joint bleeds ABR (secondary endpoint) | ||
| ABR*
(95% CI) |
3.0
(0.96; 9.13) |
0.1
(0.03; 0.58) |
| % reduction
(RR, P value) |
95% reduction
(RR=0.05, P=0.0002) |
|
| % patients with 0 bleeds (95% CI) | 50.0
(26.0; 74.0) |
94.3
(80.8; 99.3) |
| Treated bleeds ABR, intra-patient comparison
(Arm C patients who participated in NIS, n=24; secondary endpoint) |
||
| Study group | Prior prophylaxis with a BPA | Emicizumab prophylaxis |
| ABR*
(95% CI) |
15.7
(11.08; 22.29) |
3.3
(1.33; 8.08) |
| % reduction
(RR, P value) |
79% reduction
(RR=0.21, P=0.0003) |
|
| Median ABR
(IQR) |
12.0
(5.73; 24.22) |
0.0
(0.00; 2.23) |
| % patients with 0 bleeds
(95% CI) |
12.5
(2.7; 32.4) |
70.8
(48.9; 87.4) |
*Negative binomial regression model
Safety
Safety results in patients who received emicizumab prophylaxis (n=103) are as follows.
| Total number of AEs | 198 |
| Total number of participants experiencing ≥ 1 AE, n (%) | 73 (70.9) |
| Related AEs | 23 (22.3) |
| Serious AEs | 9 (8.7) |
| Grade ≥3 AEs | 8 (7.8) |
| Local injection site reaction | 15 (14.6) |
| Headache | 12 (11.7) |
| Upper respiratory tract infection | 9 (8.7) |
| Fatigue | 6 (5.8) |
| Joint pain (arthralgia) | 6 (5.8) |
| Thrombotic microangiopathy* | 3 (2.9) |
| Serious thromboembolic event** | 2 (1.9) |
| Death* | 1 (<1) |
*The third thrombotic microangiopathy event occurred after the primary data cut-off. This patient also experienced fatal rectal hemorrhage.
**Serious thromboembolic events consisted of skin necrosis/superficial thrombophlebitis in 1 patient and cavernous sinus thrombosis in a second patient.
None of the patients tested positive for anti-drug antibodies. ![]()
Combo demonstrates activity in CLL/SLL and FL
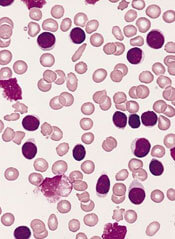
LUGANO, SWITZERLAND—Results of a phase 1 study suggest a 2-drug combination may be safe and effective in patients with chronic lymphocytic leukemia (CLL)/small lymphocytic lymphoma (SLL) and follicular lymphoma (FL).
The ongoing study is a test of the BTK inhibitor BGB-3111 and the anti-CD20 antibody obinutuzumab.
The overall response rate (ORR) with this combination was 81% in the entire study population, 89% in treatment-naïve CLL/SLL patients, 92% in relapsed/refractory CLL/SLL patients, and 73% in relapsed/refractory FL patients.
The rate of serious adverse events (AEs) was 24% in both CLL/SLL and FL patients.
These results were presented at the 14th International Conference on Malignant Lymphoma (ICML). The research was sponsored by BeiGene, Ltd.
“This clinical trial is supported by preclinical work suggesting that BGB-3111 may combine well with antibodies that rely on antibody-dependent cell-mediated cytotoxicity, such as obinutuzumab, because of less off-target inhibition of interleukin-2-inducible T-cell kinase,” said study investigator Constantine Tam, MD, of St. Vincent’s Hospital in Melbourne, Australia.
“The preliminary clinical results to date suggest that the combination is well tolerated and highly active in patients with CLL or SLL and FL. Complete responses have already been observed in patients with both disease types, including CLL or SLL patients with high-risk features, despite a very short follow-up time.”
The trial consists of a dose-escalation phase and a dose-expansion phase in disease-specific cohorts, which include treatment-naive or relapsed/refractory CLL/SLL and relapsed/refractory FL.
The dose-escalation component is testing BGB-3111 at 320 mg once daily or 160 mg twice daily in 28-day cycles, in combination with obinutuzumab. Obinutuzumab is administered in line with standard CLL dosing (3 loading doses of 1000 mg weekly, followed by 1000 mg on day 1 of cycles 2 to 6).
The ongoing dose-expansion component is testing doses of BGB-3111 at 160 mg twice daily with the same obinutuzumab schedule.
As of the data cutoff (March 31, 2017), 45 patients with CLL/SLL and 17 patients with FL were enrolled in the trial.
Patient characteristics
The median age was 68 (range, 28-82) in the CLL/SLL patients and 56 (range, 41-86) in the FL patients.
ECOG performance status was 0 in 42% of CLL/SLL patients, 1 in 56% of these patients, and 2 in 2%. ECOG performance status was 0 in 82% of FL patients, 1 in 12% of these patients, and 2 in 6%.
Twenty CLL/SLL patients were treatment-naïve, and 25 had relapsed/refractory disease. All 17 FL patients had relapsed/refractory disease.
The median number of prior therapies was 1 (range, 1-4) in the relapsed/refractory CLL/SLL patients and 3 (range, 1-7) in the FL patients.
Safety
At the time of the data cutoff, BGB-3111 was deemed well tolerated in patients with CLL/SLL and FL.
The most frequent AEs of any cause occurring in at least 15% of patients with CLL/SLL were petechiae/purpura/contusion (33%), neutropenia (31%), thrombocytopenia (22%), fatigue (18%), pyrexia (18%), upper respiratory tract infection (18%), and diarrhea (16%).
Most of these events were grade 1/2. The exceptions were grade 3/4 neutropenia (20%) and grade 3/4 thrombocytopenia (4%).
The most frequent AEs in FL patients were petechiae/purpura/contusion (35%), fatigue (29%), cough (18%), diarrhea (18%), dizziness (18%), headache (18%), insomnia (18%), nausea (18%), and upper respiratory tract infection (18%). All of these events were grade 1/2.
Serious AEs occurred in 24% of both the CLL/SLL patients and the FL patients.
Infusion-related reactions occurred in 24% of CLL/SLL patients and 6% of FL patients. Nearly all cases were grade 1/2. The exception was 1 grade 4 case in a CLL/SLL patient.
There were no cases of serious hemorrhage (≥ grade 3 hemorrhage or central nervous system hemorrhage of any grade) or atrial fibrillation.
One patient discontinued treatment due to an AE—squamous cell carcinoma. This patient had a prior history of squamous cell carcinoma.
Efficacy
At the time of the data cutoff, 43 patients with CLL/SLL (18 treatment-naive, 25 relapsed/refractory) and 15 patients with relapsed/refractory FL had greater than 12 weeks of follow-up and were evaluable for efficacy.
In treatment-naive CLL/SLL, after a median follow-up of 7.0 months (range, 2.8–11.8 months), the ORR was 89%. The complete response (CR) rate was 22%, the rate of partial response (PR) was 67%, and the rate of stable disease (SD) was 11%.
In relapsed/refractory CLL/SLL, at a median follow-up of 8.0 months (range, 3.8–14.0 months) the ORR was 92%. The CR rate was 16%, the PR rate was 76%, and 4% of patients had SD.
One patient (4%) with relapsed/refractory CLL/SLL had progressive disease (Richter’s transformation).
In relapsed/refractory FL, at a median follow-up of 6.2 months (range, 1.2–10.7 months), the ORR was 73%. The CR rate was 33%, the PR rate was 40%, and 13% of patients had SD.
Two patients (13%) with relapsed/refractory FL had progressive disease.
On the basis of these data, BeiGene plans to expand its global registrational program for BGB-3111 to include a phase 2 trial of BGB-3111 in combination with obinutuzumab compared to obinutuzumab alone in patients with relapsed/refractory FL.
The company is also planning a phase 3 trial comparing BGB-3111 with bendamustine plus rituximab in patients with treatment-naive CLL. ![]()
Vaccine granted orphan designation for MDS
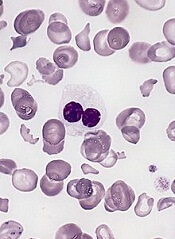
The US Food and Drug Administration (FDA) has granted orphan drug designation to DSP-7888, an investigational cancer peptide vaccine, for the treatment of myelodysplastic syndromes (MDS).
DSP-7888 contains peptides to induce Wilms’ tumor gene 1 (WT1)-specific cytotoxic T lymphocytes and helper T cells, which attack WT1-expressing cancerous cells found in various hematologic and solid tumor malignancies.
DSP-7888 is being developed by Boston Biomedical, Inc.
The first clinical data for DSP-7888, from a phase 1/2 study in patients with MDS who progressed on or after first-line azacitidine treatment, were presented at the 2016 ASH Annual Meeting.
Results were reported in 12 patients—7 with higher-risk MDS and 5 with lower-risk disease.
DSP-7888 was given at doses of 3.5 mg/body (n=6) or 10.5 mg/body (n=6) by intradermal injections every 2 to 4 weeks.
There were no dose-limiting toxicities. The most common adverse event was injection site reactions. Six patients had grade 3 injection site reactions.
There were 5 serious adverse events—3 injection site reactions, 1 case of pyrexia, and 1 case of myocarditis.
Eight patients had stable disease, 2 with hematological improvements.
Cytotoxic T lymphocyte induction was observed in 6 patients, and delayed type hypersensitivity response was observed in 10 patients.
About orphan designation
The FDA grants orphan designation to products intended to treat, diagnose, or prevent diseases/disorders that affect fewer than 200,000 people in the US.
The designation provides incentives for sponsors to develop products for rare diseases. This may include tax credits toward the cost of clinical trials, prescription drug user fee waivers, and 7 years of market exclusivity if the product is approved. ![]()