User login
Woman who faked cancer gets 5 years in prison
A California woman who pretended to have cancer and received more than $100,000 in charitable donations from hundreds of people has been sentenced to 5 years in prison.
Amanda Christine Riley pleaded guilty to one count of wire fraud for soliciting donations from people through various social media sites to help pay for cancer treatments that she never received or needed, according to the U.S. Department of Justice.
In total, the government identified 349 individuals and entities who made contributions totaling $105,513. Ms. Riley was sentenced to 60 months in prison on May 3.
Ms. Riley is hardly the first person to fake a cancer diagnosis for money. In fact, the phenomenon of faking illness online now occurs so often that researchers have given it a name: “Munchausen by internet.” However, few appear to be penalized with prison time.
In this case, the scam began in 2012, when Ms. Riley falsely claimed to have been diagnosed with Hodgkin’s lymphoma. She used Facebook, Instagram, Twitter, and a blog to document her imaginary condition and “aggressively” solicit donations to cover her supposed medical expenses, the DOJ said.
Instead, Ms. Riley used the donations to pay living expenses.
According to the DOJ, Ms. Riley went to “great lengths to maintain her deception.” She shaved her head to appear to be undergoing chemotherapy, faked her medical records, forged physicians’ letters and medical certifications, and convinced family members to back up her false claims.
Ms. Riley’s scheme continued for 7 years, until 2019, when her deception was uncovered by an investigation of the Internal Revenue Service and the San Jose Police Department.
Ms. Riley was charged in July 2020 and pleaded guilty in October 2021.
In addition to serving 5 years in prison, Ms. Riley must pay back the $105,513 and undergo 3 years of supervision after her release.
A version of this article first appeared on Medscape.com.
White children more likely to get imaging in EDs: Study
Non-Hispanic White children were more likely to receive diagnostic imaging at children’s hospitals’ emergency departments across the United States than were Hispanic children and non-Hispanic Black children, according to a large study published in JAMA Network Open.
Researchers found that, the more the percentage of children from minority groups cared for by a hospital increased, the wider the imaging gap between those children and non-Hispanic White children.
The cross-sectional study, led by Margaret E. Samuels-Kalow, MD, MPhil, MSHP, with the department of emergency medicine, Massachusetts General Hospital and Harvard Medical School in Boston, included 38 children’s hospitals and more than 12 million ED visits.
“These findings emphasize the urgent need for interventions at the hospital level to improve equity in imaging in pediatric emergency medicine,” the authors write.
Patients included in the study were younger than 18 and visited an ED from January 2016 through December 2019. Data were pulled from the Pediatric Health Information System.
Of the more than 12 million visits in this study, 3.5 million (28.7%) involved at least one diagnostic imaging test.
Diagnostic imaging was performed in 1.5 million visits (34.2%) for non-Hispanic White children; 790,961 (24.6%) for non-Hispanic Black children; and 907,222 (26.1%) for Hispanic children (P < .001).
Non-Hispanic Black children were consistently less likely to get diagnostic imaging than non-Hispanic White counterparts at every hospital in the study, no matter the imaging modality: radiography, ultrasonography, computed tomography, or magnetic resonance imaging.
Hispanic patients were generally less likely to get imaging than non-Hispanic White patients, though results were less consistent for ultrasound and MRI.
In a sensitivity analysis, when looking at imaging from patients’ first visit across the study cohort, non-Hispanic Black children were significantly less likely to get imaging than non-Hispanic White children (adjusted odds ratio, 0.77; 95% confidence interval, 0.74-0.79).
“This remained significant even after adjustment for a priori specified confounders including hospital propensity to image,” the authors write.
Authors acknowledge that it is possible that some of the differences may be attributable to the patient mix regarding severity of cases or indications for imaging by hospital, but they note that all models were adjusted for diagnosis-related group and other potential confounders.
This study did not assess whether one group is being overtested. Researchers also note that higher rates of imaging do not necessarily indicate higher quality of care.
However, the authors note, previous research has suggested overtesting of non-Hispanic White patients for head CT and chest pain, as well as patterns of overtreatment of non-Hispanic White patients who have bronchiolitis or viral upper respiratory tract infections.
Medell Briggs-Malonson, MD, MPH, chief of health equity, diversity and inclusion for the University of California, Los Angeles, Hospital and Clinic System, who was not part of the study, said in an interview “this all rings true.”
“This is not the first study we have had in either the pediatric or adult populations that shows disparate levels of care as well as health outcomes. Now we are starting to be able to measure it,” she said.
This study is further evidence of medical racism, she says, and highlights that it’s not the hospital choice or the insurance type affecting the numbers, she said.
“When you control for those factors, it looks to be it’s only due to race and that’s because of the very deep levels of implicit bias as well as explicit bias that we still have in our health systems and even in our providers,” said Dr. Briggs-Malonson, who is also an associate professor of emergency medicine at UCLA. “It’s incredibly important to identify and immediately address.”
What can be done?
Changing these patterns starts with knowing the numbers, the authors write.
“Hospitals should measure their own differences in imaging rates and increase awareness of existing areas of differential treatment as a starting point for improvement,” Dr. Samuels-Kalow and coauthors say.
Dr. Briggs-Malonson added that guidelines are very clear about when children should get imaging. Adhering to evidence-based guidelines can help avoid variations in care from external factors.
“If children are not receiving the absolute best comprehensive evaluation in the emergency department that they deserve, we can miss many different illnesses, which can lead to worse outcomes,” she noted.
As for what might motivate lack of imaging, Dr. Briggs-Malonson pointed to longstanding trends of providers thinking complaints raised by minority patients may not be as severe as they report. Conversely, in caring for White patients there may be a feeling that more tests and imaging may be better out of more fear of missing something, she said.
At UCLA, she says, dashboards have been developed to track statistics on care by age, race, ethnicity, language, insurance type, etc., though not specifically in pediatric imaging, to assess and address any care inequities.
Summer L. Kaplan, MD, MS, director of emergency radiology at Children’s Hospital of Philadelphia, who also was not part of the study, said the finding of racial disparities in pediatric ED imaging provides evidence that gaps still exist in providing the best care to all children and families seeking emergency care.
“However, it is important to recognize that more imaging does not equal better care,” she said. “More imaging may be associated with unnecessary, low-value tests that may add radiation and other risks but do not improve care.”
She said higher rates of imaging may occur when patients present early in the course of a disease, when the differential diagnosis remains broad.
If families have delayed seeking care because of time constraints, transportation problems, cost of care, or mistrust of the health system, children may present later in the course of a disease and require less imaging for a diagnosis, she explained.
“This paper offers a valuable look at the inequities that exist in pediatric emergency imaging use, and further research will be essential to understand and address the causes of these differences,” Dr. Kaplan said.
A coauthor reported compensation as a member of a Medical Review Committee for Highmark. Other coauthors reported grants from the U.S. Agency for Healthcare Research and Quality outside the submitted work. Dr. Briggs-Malonson and Dr. Kaplan reported no relevant financial relationships.
FROM JAMA NETWORK OPEN
Informal human-milk donation: How to counsel patients
I have become obsessed with the reality that the unprecedented national shortage of formula is keeping some families from adequately feeding their infants and young children. I am deeply concerned, both as a family medicine physician and a new mother, about the heartbreaking stories that I’ve heard from parents of all socioeconomic backgrounds. New mothers, unable to breastfeed for a multitude of reasons, find themselves standing in front of empty store shelves, in tears.
In recent months, many health care providers have had patients disclose that they are diluting ready-to-feed formula or mixing powdered formula with more water than instructed to make it go further. Some parents are giving cow’s milk to their children at too young an age because they can’t find formula. Others are foregoing milk altogether and feeding their children beverages such as juice or soda. All of these practices can threaten a child’s life, growth, and development.
When breastfeeding isn’t possible
We all know that human milk is the optimal, most nutritionally complete food source for newborn babies and infants. It can improve dental health and neurodevelopmental outcomes, as well as reduce the risk for asthma, eczema, diabetes, and obesity. An added benefit during the COVID-19 pandemic has been providing newborn infants with a boost of immunity before they are able to be vaccinated against SARS-CoV-2 infection.
But lactation and breastfeeding aren’t possible for everyone. Earlier this year, when my daughter was born more than a month prematurely, I worried that I would be unable to breastfeed her. The complications of prematurity can interfere with establishing lactation, and my daughter spent some time in the neonatal intensive care unit (NICU), requiring frequent feedings to treat hypoglycemia. She also lacked the muscle strength or coordination to latch on to the breast, so she was fed my colostrum and donor breast milk by bottle.
Not knowing when my mature milk would come in, my family scoured the retail stores for formula while I was still recovering from delivery. My daughter needed a specific type of high-calorie formula for premature infants. Eventually, my mother found one can of this powdered formula. The hospital also sent us home with 16 oz of ready-to-feed samples and enough donor breastmilk to last 24 hours at home. We considered ourselves lucky. The fear and anxiety about being able to feed my baby still stands out in my mind.
Pumping and sharing
Over the next few months, out of necessity, I became an “exclusively pumping” mother. My daughter, unable to latch, drank my pumped milk from a bottle. My body started to produce more milk than she needed in a day. In an effort to pay it forward and to put my extra milk to use, I became a human-milk donor. I underwent rigorous screening, including testing for infectious diseases such as HIV and hepatitis C. I was approved to donate to our local hospital’s milk bank, helping other families in the NICU feed their babies. Through informal connections on the internet, I also provide expressed milk to another mother in the community who is unable to lactate. To date, I’ve donated more than 1,500 oz of human milk (and counting).
The practice of human-milk donation dates back millennia with wet-nursing, when children were breastfed by someone other than their biological mothers: relatives, friends, or even strangers. The first milk bank in the United States opened in Boston in the early 20th century. In 1980, the World Health Organization and the United Nations Children’s Fund released a joint statement supporting the use of human-donor milk as the first alternative if the biological mother is unable to breastfeed. Donor milk is a safe option for families who cannot provide their own human milk to their children.
Human-milk banks
More than 30 nonprofit milk banks now operate in the United States. Because their mission is primarily to meet the needs of sick and hospitalized children rather than the general public, these milk banks are an impractical solution to the national formula shortage. Although families with healthy children can purchase donor milk with a prescription, supplies are scarce, and insurance doesn’t cover the cost.
Milk provided by formal human-milk banks is considered safe. Certain infections such as HIV and hepatitis can be transmitted through human milk. However, milk banks screen their donors and safely pasteurize and store donated breastmilk, following standard protocols. The risk of contracting an illness from banked donor milk is very low. The American Academy of Pediatrics recommends accepting donor milk only from a milk bank.
Informal human-milk donation
An increasingly popular alternative to formal human-milk banks is informal human-milk sharing. But many people, including health care professionals, hold misconceptions about how informal milk donation works. Today’s informal milk donation looks very different from age-old wet-nursing: Moms in support groups, often via social media, are requesting pumped milk from one another. (Note that this definition of “informal human-milk donation” does not include selling or purchasing human milk.)
Although the safety of sharing pumped human milk this way cannot be guaranteed, a harm-reduction approach is warranted, especially in view of the current formula scarcity.
I believe that medical professionals have a responsibility to raise awareness and dispel myths about donor breast milk. Many physicians acknowledge that informal milk sharing is common but rarely recommend it to patients. Whether they are donors or recipients, families who choose to participate need to be educated about how to go about the process as safely as possible.
Patients who are considering accepting informally donated human milk should ask key questions of the donor to gauge the risk of pathogens or other harmful substances being passed to their babies:
- What medications do you take?
- What supplements do you take?
- What recreational drugs do you take?
- Any recent travel?
- Any tattoos and if so, how recent?
- How much alcohol do you drink and how often?
- Have you been diagnosed with any infections?
- Any recent illness?
- How do you pump your breast milk?
- How do you store your breast milk?
- When was the available milk pumped?
We can help families by offering our medical expertise, allowing them to make an informed decision about whether to accept donated human milk. Clinicians can encourage patients and their families to use resources like the Infant Risk Center, which provides evidence-based information about medication safety and breast milk.
If your lactating patient is considering donating milk through informal channels to a family in need, encourage them to be open and honest about their medical history and lifestyle habits. If they cannot be transparent, they should not donate. A mutual level of respect and honesty can ensure the safety of those they hope to help. It is also important to counsel prospective milk donors to notify their milk recipients of any new illnesses, substance use, medications, travel, tattoos, or changes to their medical history.
Finally, encourage lactating patients who are able to do so to donate their extra milk to local nonprofit milk banks to increase the availability of screened, pasteurized breast milk in the community.
As a physician and mother, I hope that U.S. families will be less vulnerable to future formula shortages. Human milk is an ideal food source, but not everyone can lactate. Though not perfect, human milk donated outside of formal milk banks offers a safer alternative to diluting formula or feeding other unsuitable beverages to infants and children. As health care professionals, we need to counsel our patients about how to engage in this practice safely.
Dr. Mieses Malchuk is assistant professor in the department of family medicine at the University of North Carolina at Chapel Hill and a board-certified family physician and attending physician at UNC Health in Chapel Hill. She has disclosed no relevant financial relationships.
A version of this article first appeared on Medscape.com.
High rates of med student burnout during COVID
NEW ORLEANS –
Researchers surveyed 613 medical students representing all years of a medical program during the last week of the Spring semester of 2021.
Based on the Maslach Burnout Inventory-Student Survey (MBI-SS), more than half (54%) of the students had symptoms of burnout.
Eighty percent of students scored high on emotional exhaustion, 57% scored high on cynicism, and 36% scored low on academic effectiveness.
Compared with male medical students, female medical students were more apt to exhibit signs of burnout (60% vs. 44%), emotional exhaustion (80% vs. 73%), and cynicism (62% vs. 49%).
After adjusting for associated factors, female medical students were significantly more likely to suffer from burnout than male students (odds ratio, 1.90; 95% confidence interval, 1.34-2.70; P < .001).
Smoking was also linked to higher likelihood of burnout among medical students (OR, 2.12; 95% CI, 1.18-3.81; P < .05). The death of a family member from COVID-19 also put medical students at heightened risk for burnout (OR, 1.60; 95% CI, 1.08-2.36; P < .05).
The survey results were presented at the American Psychiatric Association (APA) Annual Meeting.
The findings point to the need to study burnout prevalence in universities and develop strategies to promote the mental health of future physicians, presenter Sofia Jezzini-Martínez, fourth-year medical student, Autonomous University of Nuevo Leon, Monterrey, Mexico, wrote in her conference abstract.
In related research presented at the APA meeting, researchers surveyed second-, third-, and fourth-year medical students from California during the pandemic.
Roughly 80% exhibited symptoms of anxiety and 68% exhibited depressive symptoms, of whom about 18% also reported having thoughts of suicide.
Yet only about half of the medical students exhibiting anxiety or depressive symptoms sought help from a mental health professional, and 20% reported using substances to cope with stress.
“Given that the pandemic is ongoing, we hope to draw attention to mental health needs of medical students and influence medical schools to direct appropriate and timely resources to this group,” presenter Sarthak Angal, MD, psychiatry resident, Kaiser Permanente San Jose Medical Center, California, wrote in his conference abstract.
Managing expectations
Weighing in on medical student burnout, Ihuoma Njoku, MD, department of psychiatry and neurobehavioral sciences, University of Virginia, Charlottesville, noted that, “particularly for women in multiple fields, including medicine, there’s a lot of burden placed on them.”
“Women are pulled in a lot of different directions and have increased demands, which may help explain their higher rate of burnout,” Dr. Njoku commented.
She noted that these surveys were conducted during the COVID-19 pandemic, “a period when students’ education experience was a lot different than what they expected and maybe what they wanted.”
Dr. Njoku noted that the challenges of the pandemic are particularly hard on fourth-year medical students.
“A big part of fourth year is applying to residency, and many were doing virtual interviews for residency. That makes it hard to really get an appreciation of the place you will spend the next three to eight years of your life,” she told this news organization.
A version of this article first appeared on Medscape.com.
FROM APA 2022
Hospital medicine gains popularity among newly minted physicians
In a new study, published in Annals of Internal Medicine, researchers from ABIM reviewed certification data from 67,902 general internists, accounting for 80% of all general internists certified in the United States from 1990 to 2017.
The researchers also used data from Medicare fee-for-service claims from 2008-2018 to measure and categorize practice setting types. The claims were from patients aged 65 years or older with at least 20 evaluation and management visits each year. Practice settings were categorized as hospitalist, outpatient, or mixed.
“ABIM is always working to understand the real-life experience of physicians, and this project grew out of that sort of analysis,” lead author Bradley M. Gray, PhD, a health services researcher at ABIM in Philadelphia, said in an interview. “We wanted to better understand practice setting, because that relates to the kinds of questions that we ask on our certifying exams. When we did this, we noticed a trend toward hospital medicine.”
Overall, the percentages of general internists in hospitalist practice and outpatient-only practice increased during the study period, from 25% to 40% and from 23% to 38%, respectively. By contrast, the percentage of general internists in a mixed-practice setting decreased from 52% to 23%, a 56% decline. Most of the physicians who left the mixed practice setting switched to outpatient-only practices.
Among the internists certified in 2017, 71% practiced as hospitalists, compared with 8% practicing as outpatient-only physicians. Most physicians remained in their original choice of practice setting. For physicians certified in 1999 and 2012, 86% and 85%, respectively, of those who chose hospitalist medicine remained in the hospital setting 5 years later, as did 95% of outpatient physicians, but only 57% of mixed-practice physicians.
The shift to outpatient practice among senior physicians offset the potential decline in outpatient primary care resulting from the increased choice of hospitalist medicine by new internists, the researchers noted.
The study findings were limited by several factors, including the reliance on Medicare fee-for-service claims, the researchers noted.
“We were surprised by both the dramatic shift toward hospital medicine by new physicians and the shift to outpatient only (an extreme category) for more senior physicians,” Dr. Gray said in an interview.
The shift toward outpatient practice among older physicians may be driven by convenience, said Dr. Gray. “I suspect that it is more efficient to specialize in terms of practice setting. Only seeing patients in the outpatient setting means that you don’t have to travel to the hospital, which can be time consuming.
“Also, with fewer new physicians going into primary care, older physicians need to focus on outpatient visits. This could be problematic in the future as more senior physicians retire and are replaced by new physicians who focus on hospital care,” which could lead to more shortages in primary care physicians, he explained.
The trend toward hospital medicine as a career has been going on since before the pandemic, said Dr. Gray. “I don’t think the pandemic will ultimately impact this trend. That said, at least in the short run, there may have been a decreased demand for primary care, but that is just my speculation. As more data flow in we will be able to answer this question more directly.”
Next steps for research included digging deeper into the data to understand the nature of conditions facing hospitalists, Dr. Gray said.
Implications for primary care
“This study provides an updated snapshot of the popularity of hospital medicine,” said Bradley A. Sharpe, MD, of the division of hospital medicine at the University of California, San Francisco. “It is also important to conduct this study now as health systems think about the challenge of providing high-quality primary care with a rapidly decreasing number of internists choosing to practice outpatient medicine.” Dr. Sharpe was not involved in the study.
“The most surprising finding to me was not the increase in general internists focusing on hospital medicine, but the amount of the increase; it is remarkable that nearly three quarters of general internists are choosing to practice as hospitalists,” Dr. Sharpe noted.
“I think there are a number of key factors at play,” he said. “First, as hospital medicine as a field is now more than 25 years old, hospitals and health systems have evolved to create hospital medicine jobs that are interesting, engaging, rewarding (financially and otherwise), doable, and sustainable. Second, being an outpatient internist is incredibly challenging; multiple studies have shown that it is essentially impossible to complete the evidence-based preventive care for a panel of patients on top of everything else. We know burnout rates are often higher among primary care and family medicine providers. On top of that, the expansion of electronic health records and patient access has led to a massive increase in messages to providers; this has been shown to be associated with burnout.”
The potential impact of the pandemic on physicians’ choices and the trend toward hospital medicine is an interested question, Dr. Sharpe said. The current study showed only trends through 2017.
“To be honest, I think it is difficult to predict,” he said. “Hospitalists shouldered much of the burden of COVID care nationally and burnout rates are high. One could imagine the extra work (as well as concern for personal safety) could lead to fewer providers choosing hospital medicine.
“At the same time, the pandemic has driven many of us to reflect on life and our values and what is important and, through that lens, providers might choose hospital medicine as a more sustainable, do-able, rewarding, and enjoyable career choice,” Dr. Sharpe emphasized.
“Additional research could explore the drivers of this clear trend toward hospital medicine. Determining what is motivating this trend could help hospitals and health systems ensure they have the right workforce for the future and, in particular, how to create outpatient positions that are attractive and rewarding,” he said.
The study received no outside funding. The researchers and Dr. Sharpe disclosed no relevant financial relationships.
A version of this article first appeared on Medscape.com.
How do you treat noncompliance?
Mrs. Stevens has migraines. Fortunately, they’re well controlled on nortriptyline, and she’s never had side effects from it. She’s taken it for more than 20 years now.
In that time she and I have had a strange, slow-motion, waltz.
In spite of the medicine helping her, she stops it on her own roughly twice a year, never calling my office in advance. Sometimes it’s to see if the headaches come back (they always do). Other times it’s because of something she read online, or a friend told her, or she overheard in the grocery checkout line.
Whatever the reason, her migraines always come back within a week, and then she calls my office for an urgent appointment.
I’ve never really understood this, as I know her history and am happy to just tell her to restart the medication and call it in. But, for whatever reason, the return of her migraines is something that she wants to discuss with me in person. Since it’s usually a pretty brief visit, my secretary puts her on the schedule and I get paid to tell her what could have been handled by phone. I’m not complaining. I have to make a living, too.
But still, it makes me wonder. She can’t be the only patient out there who does this. Multiply that by the number of doctors, the cost of visits, the time she takes off from work to come in ... it adds up.
So why does this happen?
Believe me, for the past 20 years I’ve spent these occasional visits reminding Mrs. Stevens about the importance of sticking with her medication and calling my office if she has questions. She agrees to, but when she’s thinking about stopping nortriptyline ... she still does it and only tells me after the fact.
I can’t change human nature, or at least not hers. And when multiplied by many like her, it creates entirely unnecessary costs on our health care system. I wish there were a way to stop it.
Dr. Block has a solo neurology practice in Scottsdale, Ariz.
Two years after UCNS switch to continuous certification, major frustrations remain
Headache medicine expert Joel Saper, MD once saw the formation of the United Council for Neurologic Subspecialties as a sign of progress in the field. In 2005, he even helped write their first certification exam for headache medicine.
Now he’s calling fraud.
After Dr. Saper’s initial 10-year certification expired, he paid $1,800 to take a recertification test. Passing this, he earned another decade of diplomate status; or so he thought, until a couple years later, when he received word from the UCNS.
“They were changing the rules,” Dr. Saper said in an interview. “The 10-year certificate was no longer valid. You had to go through another process.”
That process, known as continuous certification, has become the new standard among medical boards. In contrast with a more conventional recertification process that depends upon high-fee, high-stakes exams taken years apart, continuous certification typically involves a relatively small annual fee coupled with online reading and assessments designed to ensure familiarity with advances in the field.
It’s not just the physicians that need to study up. Medical boards are under pressure to ensure that they are maintaining retention, a potentially challenging task with approximately 200 medical certifying boards in the United States competing for attention, and in some cases, credibility.
Pivots to new systems of recertification have been a particular flash point among physicians. In 2015, a Newsweek article described how a group of “nationally known physicians revolted against the American Board of Internal Medicine” after the board “attempted to expand its program for recertifying doctors, adding boatloads of requirements and fees to be paid by physicians.”
In response, ABIM attacked both the journalist and Newsweek, citing a conflict of interest (the journalist was married to a doctor). The journalist went on to uncover some uncomfortable statistics, including the fact that, over a 5-year period, the ABIM Foundation lost $39.8 million while paying senior administrators $125.7 million. Such revelations have likely added to a collective skepticism about medical boards and their motives.
The changing landscape of recertification
According to Brenda Riggott, executive director of the UCNS, the switch to continuous certification was driven by a need to keep up with new standards.

“We really found the landscape of maintaining medical certifications in general was changing,” Ms. Riggott said, highlighting how the UCNS “evaluated 13 different continuous certification models being administered by medical boards” before settling upon the present model.
Continuous certification with the UCNS now requires a $175 annual fee. Each year, diplomates read 10 journal articles, then take a 25-question online quiz to demonstrate their understanding.
“It’s really about patient care,” Ms. Riggott said in an interview. “Medicine changes rapidly. And there are a lot of advances. Evaluating that once a decade is really not enough to verify that somebody is maintaining their skills, their knowledge.”
Dr. Saper, a clinical professor of neurology at Michigan State University, East Lansing, and founder-director of the Michigan Head Pain and Neurological Institute, Ann Arbor, had no inherent qualm with transitioning to this newer process, but he did take umbrage at its execution, since his UCNS certificate still had about 7 years until expiry.
He said the UCNS should have honored existing certificates through their stated duration, citing precedent set by the American Academy of Neurology. When the AAN transitioned from lifetime board certification to a periodic recertification process, they honored the lifetime status of those who already held it, according to Dr. Saper.
“[The AAN] looked at those of us who had been boarded under the premise that we were going to be lifetime boarded ... and they said: ‘We’re going to grandfather you ... because that was the rule under which you took your initial exams.’ ... That’s what UCNS should have done,” Dr. Saper said.
A compromise
Under pressure from Dr. Saper and others, UCNS compromised by endorsing 10-year diplomates until the 5-year mark.
Alan Rapoport, MD, clinical professor of neurology at the University of California, Los Angeles, and the editor-in-chief of Neurology Reviews, was among those who spoke up, only to see the duration of his certification cut in half.
“UCNS obviously realized that they had been wrong,” Dr. Rapoport said, referring to the compromise they made.
At the 5-year mark, physicians who didn’t adopt the new system were deleted from the UCNS online database, eliminating “the only way the public would know whether or not we were certified. This was after UCNS told us we would stay on the list with a note next to our name suggesting our certification was incomplete. They did not care that this might have hurt our reputations,” Dr. Rapoport said.
“To this day, no refunds, partial or full, have been given for the $1,800 we paid for the privilege of sitting for the exam, or for our time studying, or for the expenses accrued from canceling a day in the office and traveling to a testing center,” Dr. Rapoport said. “I did not want the money back; I wanted the certification promised to me. Since they have removed my name from this list, they do owe me the $1,800. They say they do not return their fees if you fail. How about if you pass and they remove you from their list?”
Yet he went on to make clear that the real issue is the principle of the matter. “This is not about money,” Dr. Rapoport said. “This is about what is fair and right.”
“The UCNS issued me a certificate for 10 years of certification in headache medicine; it is unethical and unlawful to break that contract and grant me only 5 years. Worse, they removed my name as though I do not exist. Along with Dr. Saper, I was one of the doctors that spent time and effort to advance headache medicine from October 1979, when I became a headache specialist, to today. I supported the principles of UCNS and took the first exam. I became the President of the International Headache Society and traveled the world promoting headache medicine; and this is how I am treated. Who can respect this type of certification, or this organization?”
Dr. Saper agreed: “It’s not about the money. It’s about the commitment. It’s very fraudulent.”
After the UCNS decision, Dr. Rapoport and Dr. Saper sought legal counsel, but ultimately decided not to sue the UCNS because of the lengthy process it would entail and the cost, estimated to be over $100,000.
“Our lawyers said: ‘It’s going to be years to get through it. You’ll probably win in the end, because it was fraudulent behavior,’ ” Dr. Saper said.
A different viewpoint
Ms. Riggott offered a different viewpoint: Nobody was guaranteed 10 years of certification.
“People do not pay for certification [from the UCNS],” Ms. Riggott said. “They pay to sit for an exam. It’s an exam administration fee. That can be construed as: ‘They paid for 10 years.’ They did not. They paid to sit for an exam. There are people who pay for an exam, and they don’t pass it, and they’re not certified. They don’t get a refund. That’s just the way high-stakes certification exams go.”
Dr. Saper and Dr. Rapoport see it differently. “The inherent reason any of us sit for an exam is to get certified.” Dr. Rapoport added. “Ms. Riggott is not being honest. There was an implied contract that if we passed, we would be granted a 10-year certification because that was what we did previously and that is what they told us would happen. Why would they have sent me this nice certificate for 10 more years of certification if she were telling the truth?”
Profits over promises
Dr. Rapoport estimates that many other neurologists had their certificates cut short and were dropped from this official list, some of them eminent members of the field, including David Watson, MD, professor and chair of neurology at West Virginia University Rockefeller Neuroscience Institute, Morgantown, and Robert Cowan, MD, professor of neurology and chief of the division of headache medicine at Stanford (Calif.) University.
“It is troubling when the organizations charged with maintaining the integrity of our specialization do not act with integrity,” Dr. Watson said. “The UCNS chose profits over promises and has refused to meaningfully engage with those of us whom they have wronged. What was once a point of pride for me (being in the second class of certified headache medicine diplomates) has become a meaningless piece of paper. This makes me sad.”
Dr. Cowan said the UCNS actions angered him while affirming his lifelong skepticism of clubs. “I was very sorry, but not surprised, to see the UCNS change the rules when the opportunity to make more money presented itself, and not surprised they did not honor their contracts. UCNS is just another scam like Best Doctors in the US and similar hypes. Neither are worth another dime of my money nor the time spent discussing them. One thing more: I have no quarrel with efforts to encourage keeping up with the field, although no one I know needs codification or direction as to which articles should be read. My outrage comes when responsible behavior is used as an excuse to line the pockets of dishonest, immoral individuals. I’m done.”
According to Ms. Riggott, the UCNS continuous certification process continues to evolve based on feedback from diplomates. She noted that “change is hard,” although the challenges of the transition appear to be paying off. “Initial retention for continuing certification is much higher than we would have expected from a high-stakes recertification exam,” she said. “So we are very, very happy about that.”
Proprietary tests drive revenue
According to Katie Collins, executive director of the National Board of Physicians and Surgeons, proprietary tests are a key revenue driver for medical boards, casting doubt on their educational motives.
“This isn’t really about maintaining their education, it’s really about having control over what they learn,” Ms. Collins said. “And unfortunately, physicians no longer have control over what they learn.”
NBPAS was formed largely in response to physicians dissatisfied with this situation. For $189 every 2 years, plus $25 for a paper certificate, NBPAS recertifies doctors originally credentialed by the American Board of Medical Specialties or the American Osteopathic Association.
Instead of making physicians take proprietary tests, NBPAS requires them to earn 50 hours of Accreditation Council for Continuing Medical Education–accredited CME every 2 years. Physicians can select where they seek this credit, giving them the agency to “pick and choose where they want to learn more,” Ms. Collins said, noting that this allows physicians to address personal knowledge gaps, instead of mastering the prescriptive lessons issued by other boards.
While this benefits physicians, Ms. Collins added, it also reduces the bottom line.
NBPAS is a “true 501(c)(3),” she said. “We have money for rainy days, but certainly not millions. We don’t have anything close to a million in savings.” Most medical boards are making millions on top of their services, she said. “That’s not for me to rein in, but it’s for me to point out.”
Noah Rosen, MD, associate professor of neurology and psychiatry at Northwell Health, Great Neck, N.Y., and former UCNS board member, said the UCNS was not motivated by money when they decided to switch to continuous recertification.
“The UCNS budget is publicly available,” Dr. Rosen said in an interview. “This is not a money-making organization,” he added, noting that the UCNS has “been basically operating on a breakeven budget,” and that certification “is not really a money-making proposition.”
Public IRS filings from 2019 and 2020 suggest a slightly different picture. In 2019, the UCNS reported net income of $72,256. In 2020, the inaugural year of the continuous certification program, net income jumped almost fivefold to $349,108. Over the same period, total assets held by the UCNS rose from $1.97 million to $2.37 million.
For comparison, NBPAS controls approximately $500,000 in total assets. The ABIM? Just shy of $72 million.
Recertification highlights a generational gap
Dr. Rosen, who was not a voting board member when the UCNS decided to switch to continuous certification, suggested that the transition could have been handled more effectively.
“I think Dr. Rapoport speaks to the frustration of how they made the transition, and that it could have been done in a way that recognizes people that held the certificate in a better way,” Dr. Rosen said.
He said that the departure of Dr. Rapoport and other neurologists from the UCNS points to another trend in the certification space. “I do think it brings up a deeper issue: What’s the value of certification? Dr. Rapoport and other people have brought up the question: What actually does this certificate bring you, if it’s not recognized by the federal government, and actually is not recognized by a lot of state governments, as well, as an official certification?”
He said the answer could depend on age.
“There seems to be a difference between younger people entering into the field and people that are more established in the field already,” Dr. Rosen said. “Younger people entering the field, they see certification as a distinction, something that separates them from the experiences and maybe every other neurologist.”
Ms. Collins independently pointed out the same generational gap. She noted that when the ABMS changed their maintenance model from lifelong to periodic in 2000, approximately 60% of their physicians had to change with the times, while the remainder did not.
“They grandfathered the other 40% – the older, probably more Caucasian male physicians,” she said. “It’s just the field. It’s evolved, it’s become more diverse. They created a divide in the physician community about what is the best means to maintain your board.”
In response to these comments, and despite his negative experiences with the UCNS, Dr. Rapoport emphasized that he still places high value on subspecialty certification.
“I care a lot about certification and that is why I decided to study for and take the only exam offered at the time,” he said, “I do not need it to continue my practice in headache medicine. No one asks me if I am certified in headache medicine. My patients are referred to me because of my reputation. But I have always sought the highest level of certification I could get. What UCNS has done is to cheapen the value of their certification.”
Dr. Rosen and Ms. Collins highlighted the other side of the same conclusion: For younger physicians, board certifications are more of a career consideration than they are for older physicians, as they could mean the difference between landing or losing a job.
“The American Board of Medical Specialties and [their] 24 member boards have really woven board certification into a requirement for employment for hospital privileges and for reimbursement,” Ms. Collins said.
And so, the practical value of board certification may depend most on the tenure of the person holding paper.
“I have not gone back to get any further certification [from the UCNS],” Dr. Saper said.
Even if his name has been removed from the UCNS register, he pointed out that his printed certificate still shows it’s valid until October 31st, 2026: “If anybody asks: ‘Are you certified?’ I say: ‘Here’s my certificate.’ ”
Headache medicine expert Joel Saper, MD once saw the formation of the United Council for Neurologic Subspecialties as a sign of progress in the field. In 2005, he even helped write their first certification exam for headache medicine.
Now he’s calling fraud.
After Dr. Saper’s initial 10-year certification expired, he paid $1,800 to take a recertification test. Passing this, he earned another decade of diplomate status; or so he thought, until a couple years later, when he received word from the UCNS.
“They were changing the rules,” Dr. Saper said in an interview. “The 10-year certificate was no longer valid. You had to go through another process.”
That process, known as continuous certification, has become the new standard among medical boards. In contrast with a more conventional recertification process that depends upon high-fee, high-stakes exams taken years apart, continuous certification typically involves a relatively small annual fee coupled with online reading and assessments designed to ensure familiarity with advances in the field.
It’s not just the physicians that need to study up. Medical boards are under pressure to ensure that they are maintaining retention, a potentially challenging task with approximately 200 medical certifying boards in the United States competing for attention, and in some cases, credibility.
Pivots to new systems of recertification have been a particular flash point among physicians. In 2015, a Newsweek article described how a group of “nationally known physicians revolted against the American Board of Internal Medicine” after the board “attempted to expand its program for recertifying doctors, adding boatloads of requirements and fees to be paid by physicians.”
In response, ABIM attacked both the journalist and Newsweek, citing a conflict of interest (the journalist was married to a doctor). The journalist went on to uncover some uncomfortable statistics, including the fact that, over a 5-year period, the ABIM Foundation lost $39.8 million while paying senior administrators $125.7 million. Such revelations have likely added to a collective skepticism about medical boards and their motives.
The changing landscape of recertification
According to Brenda Riggott, executive director of the UCNS, the switch to continuous certification was driven by a need to keep up with new standards.
“We really found the landscape of maintaining medical certifications in general was changing,” Ms. Riggott said, highlighting how the UCNS “evaluated 13 different continuous certification models being administered by medical boards” before settling upon the present model.
Continuous certification with the UCNS now requires a $175 annual fee. Each year, diplomates read 10 journal articles, then take a 25-question online quiz to demonstrate their understanding.
“It’s really about patient care,” Ms. Riggott said in an interview. “Medicine changes rapidly. And there are a lot of advances. Evaluating that once a decade is really not enough to verify that somebody is maintaining their skills, their knowledge.”
Dr. Saper, a clinical professor of neurology at Michigan State University, East Lansing, and founder-director of the Michigan Head Pain and Neurological Institute, Ann Arbor, had no inherent qualm with transitioning to this newer process, but he did take umbrage at its execution, since his UCNS certificate still had about 7 years until expiry.
He said the UCNS should have honored existing certificates through their stated duration, citing precedent set by the American Academy of Neurology. When the AAN transitioned from lifetime board certification to a periodic recertification process, they honored the lifetime status of those who already held it, according to Dr. Saper.
“[The AAN] looked at those of us who had been boarded under the premise that we were going to be lifetime boarded ... and they said: ‘We’re going to grandfather you ... because that was the rule under which you took your initial exams.’ ... That’s what UCNS should have done,” Dr. Saper said.
A compromise
Under pressure from Dr. Saper and others, UCNS compromised by endorsing 10-year diplomates until the 5-year mark.
Alan Rapoport, MD, clinical professor of neurology at the University of California, Los Angeles, and the editor-in-chief of Neurology Reviews, was among those who spoke up, only to see the duration of his certification cut in half.
“UCNS obviously realized that they had been wrong,” Dr. Rapoport said, referring to the compromise they made.
At the 5-year mark, physicians who didn’t adopt the new system were deleted from the UCNS online database, eliminating “the only way the public would know whether or not we were certified. This was after UCNS told us we would stay on the list with a note next to our name suggesting our certification was incomplete. They did not care that this might have hurt our reputations,” Dr. Rapoport said.
“To this day, no refunds, partial or full, have been given for the $1,800 we paid for the privilege of sitting for the exam, or for our time studying, or for the expenses accrued from canceling a day in the office and traveling to a testing center,” Dr. Rapoport said. “I did not want the money back; I wanted the certification promised to me. Since they have removed my name from this list, they do owe me the $1,800. They say they do not return their fees if you fail. How about if you pass and they remove you from their list?”
Yet he went on to make clear that the real issue is the principle of the matter. “This is not about money,” Dr. Rapoport said. “This is about what is fair and right.”
“The UCNS issued me a certificate for 10 years of certification in headache medicine; it is unethical and unlawful to break that contract and grant me only 5 years. Worse, they removed my name as though I do not exist. Along with Dr. Saper, I was one of the doctors that spent time and effort to advance headache medicine from October 1979, when I became a headache specialist, to today. I supported the principles of UCNS and took the first exam. I became the President of the International Headache Society and traveled the world promoting headache medicine; and this is how I am treated. Who can respect this type of certification, or this organization?”
Dr. Saper agreed: “It’s not about the money. It’s about the commitment. It’s very fraudulent.”
After the UCNS decision, Dr. Rapoport and Dr. Saper sought legal counsel, but ultimately decided not to sue the UCNS because of the lengthy process it would entail and the cost, estimated to be over $100,000.
“Our lawyers said: ‘It’s going to be years to get through it. You’ll probably win in the end, because it was fraudulent behavior,’ ” Dr. Saper said.
A different viewpoint
Ms. Riggott offered a different viewpoint: Nobody was guaranteed 10 years of certification.
“People do not pay for certification [from the UCNS],” Ms. Riggott said. “They pay to sit for an exam. It’s an exam administration fee. That can be construed as: ‘They paid for 10 years.’ They did not. They paid to sit for an exam. There are people who pay for an exam, and they don’t pass it, and they’re not certified. They don’t get a refund. That’s just the way high-stakes certification exams go.”
Dr. Saper and Dr. Rapoport see it differently. “The inherent reason any of us sit for an exam is to get certified.” Dr. Rapoport added. “Ms. Riggott is not being honest. There was an implied contract that if we passed, we would be granted a 10-year certification because that was what we did previously and that is what they told us would happen. Why would they have sent me this nice certificate for 10 more years of certification if she were telling the truth?”
Profits over promises
Dr. Rapoport estimates that many other neurologists had their certificates cut short and were dropped from this official list, some of them eminent members of the field, including David Watson, MD, professor and chair of neurology at West Virginia University Rockefeller Neuroscience Institute, Morgantown, and Robert Cowan, MD, professor of neurology and chief of the division of headache medicine at Stanford (Calif.) University.
“It is troubling when the organizations charged with maintaining the integrity of our specialization do not act with integrity,” Dr. Watson said. “The UCNS chose profits over promises and has refused to meaningfully engage with those of us whom they have wronged. What was once a point of pride for me (being in the second class of certified headache medicine diplomates) has become a meaningless piece of paper. This makes me sad.”
Dr. Cowan said the UCNS actions angered him while affirming his lifelong skepticism of clubs. “I was very sorry, but not surprised, to see the UCNS change the rules when the opportunity to make more money presented itself, and not surprised they did not honor their contracts. UCNS is just another scam like Best Doctors in the US and similar hypes. Neither are worth another dime of my money nor the time spent discussing them. One thing more: I have no quarrel with efforts to encourage keeping up with the field, although no one I know needs codification or direction as to which articles should be read. My outrage comes when responsible behavior is used as an excuse to line the pockets of dishonest, immoral individuals. I’m done.”
According to Ms. Riggott, the UCNS continuous certification process continues to evolve based on feedback from diplomates. She noted that “change is hard,” although the challenges of the transition appear to be paying off. “Initial retention for continuing certification is much higher than we would have expected from a high-stakes recertification exam,” she said. “So we are very, very happy about that.”
Proprietary tests drive revenue
According to Katie Collins, executive director of the National Board of Physicians and Surgeons, proprietary tests are a key revenue driver for medical boards, casting doubt on their educational motives.
“This isn’t really about maintaining their education, it’s really about having control over what they learn,” Ms. Collins said. “And unfortunately, physicians no longer have control over what they learn.”
NBPAS was formed largely in response to physicians dissatisfied with this situation. For $189 every 2 years, plus $25 for a paper certificate, NBPAS recertifies doctors originally credentialed by the American Board of Medical Specialties or the American Osteopathic Association.
Instead of making physicians take proprietary tests, NBPAS requires them to earn 50 hours of Accreditation Council for Continuing Medical Education–accredited CME every 2 years. Physicians can select where they seek this credit, giving them the agency to “pick and choose where they want to learn more,” Ms. Collins said, noting that this allows physicians to address personal knowledge gaps, instead of mastering the prescriptive lessons issued by other boards.
While this benefits physicians, Ms. Collins added, it also reduces the bottom line.
NBPAS is a “true 501(c)(3),” she said. “We have money for rainy days, but certainly not millions. We don’t have anything close to a million in savings.” Most medical boards are making millions on top of their services, she said. “That’s not for me to rein in, but it’s for me to point out.”
Noah Rosen, MD, associate professor of neurology and psychiatry at Northwell Health, Great Neck, N.Y., and former UCNS board member, said the UCNS was not motivated by money when they decided to switch to continuous recertification.
“The UCNS budget is publicly available,” Dr. Rosen said in an interview. “This is not a money-making organization,” he added, noting that the UCNS has “been basically operating on a breakeven budget,” and that certification “is not really a money-making proposition.”
Public IRS filings from 2019 and 2020 suggest a slightly different picture. In 2019, the UCNS reported net income of $72,256. In 2020, the inaugural year of the continuous certification program, net income jumped almost fivefold to $349,108. Over the same period, total assets held by the UCNS rose from $1.97 million to $2.37 million.
For comparison, NBPAS controls approximately $500,000 in total assets. The ABIM? Just shy of $72 million.
Recertification highlights a generational gap
Dr. Rosen, who was not a voting board member when the UCNS decided to switch to continuous certification, suggested that the transition could have been handled more effectively.
“I think Dr. Rapoport speaks to the frustration of how they made the transition, and that it could have been done in a way that recognizes people that held the certificate in a better way,” Dr. Rosen said.
He said that the departure of Dr. Rapoport and other neurologists from the UCNS points to another trend in the certification space. “I do think it brings up a deeper issue: What’s the value of certification? Dr. Rapoport and other people have brought up the question: What actually does this certificate bring you, if it’s not recognized by the federal government, and actually is not recognized by a lot of state governments, as well, as an official certification?”
He said the answer could depend on age.
“There seems to be a difference between younger people entering into the field and people that are more established in the field already,” Dr. Rosen said. “Younger people entering the field, they see certification as a distinction, something that separates them from the experiences and maybe every other neurologist.”
Ms. Collins independently pointed out the same generational gap. She noted that when the ABMS changed their maintenance model from lifelong to periodic in 2000, approximately 60% of their physicians had to change with the times, while the remainder did not.
“They grandfathered the other 40% – the older, probably more Caucasian male physicians,” she said. “It’s just the field. It’s evolved, it’s become more diverse. They created a divide in the physician community about what is the best means to maintain your board.”
In response to these comments, and despite his negative experiences with the UCNS, Dr. Rapoport emphasized that he still places high value on subspecialty certification.
“I care a lot about certification and that is why I decided to study for and take the only exam offered at the time,” he said, “I do not need it to continue my practice in headache medicine. No one asks me if I am certified in headache medicine. My patients are referred to me because of my reputation. But I have always sought the highest level of certification I could get. What UCNS has done is to cheapen the value of their certification.”
Dr. Rosen and Ms. Collins highlighted the other side of the same conclusion: For younger physicians, board certifications are more of a career consideration than they are for older physicians, as they could mean the difference between landing or losing a job.
“The American Board of Medical Specialties and [their] 24 member boards have really woven board certification into a requirement for employment for hospital privileges and for reimbursement,” Ms. Collins said.
And so, the practical value of board certification may depend most on the tenure of the person holding paper.
“I have not gone back to get any further certification [from the UCNS],” Dr. Saper said.
Even if his name has been removed from the UCNS register, he pointed out that his printed certificate still shows it’s valid until October 31st, 2026: “If anybody asks: ‘Are you certified?’ I say: ‘Here’s my certificate.’ ”
Where Does the Hospital Belong? Perspectives on Hospital at Home in the 21st Century
From Medically Home Group, Boston, MA.
Brick-and-mortar hospitals in the United States have historically been considered the dominant setting for providing care to patients. The coordination and delivery of care has previously been bound to physical hospitals largely because multidisciplinary services were only accessible in an individual location. While the fundamental make-up of these services remains unchanged, these services are now available in alternate settings. Some of these services include access to a patient care team, supplies, diagnostics, pharmacy, and advanced therapeutic interventions. Presently, the physical environment is becoming increasingly irrelevant as the core of what makes the traditional hospital—the professional staff, collaborative work processes, and the dynamics of the space—have all been translated into a modern digitally integrated environment. The elements necessary to providing safe, effective care in a physical hospital setting are now available in a patient’s home.
Impetus for the Model
As hospitals reconsider how and where they deliver patient care because of limited resources, the hospital-at-home model has gained significant momentum and interest. This model transforms a home into a hospital. The inpatient acute care episode is entirely substituted with an intensive at-home hospital admission enabled by technology, multidisciplinary teams, and ancillary services. Furthermore, patients requiring post-acute support can be transitioned to their next phase of care seamlessly. Given the nationwide nursing shortage, aging population, challenges uncovered by the COVID-19 pandemic, rising hospital costs, nurse/provider burnout related to challenging work environments, and capacity constraints, a shift toward the combination of virtual and in-home care is imperative. The hospital-at-home model has been associated with superior patient outcomes, including reduced risks of delirium, improved functional status, improved patient and family member satisfaction, reduced mortality, reduced readmissions, and significantly lower costs.1 COVID-19 alone has unmasked major facility-based deficiencies and limitations of our health care system. While the pandemic is not the impetus for the hospital-at-home model, the extended stress of this event has created a unique opportunity to reimagine and transform our health care delivery system so that it is less fragmented and more flexible.
Nursing in the Model
Nursing is central to the hospital-at-home model. Virtual nurses provide meticulous care plan oversight, assessment, and documentation across in-home service providers, to ensure holistic, safe, transparent, and continuous progression toward care plan milestones. The virtual nurse monitors patients using in-home technology that is set up at the time of admission. Connecting with patients to verify social and medical needs, the virtual nurse advocates for their patients and uses these technologies to care and deploy on-demand hands-on services to the patient. Service providers such as paramedics, infusion nurses, or home health nurses may be deployed to provide services in the patient’s home. By bringing in supplies, therapeutics, and interdisciplinary team members, the capabilities of a brick-and-mortar hospital are replicated in the home. All actions that occur wherever the patient is receiving care are overseen by professional nursing staff; in short, virtual nurses are the equivalent of bedside nurses in the brick-and-mortar health care facilities.
Potential Benefits
There are many benefits to the hospital-at-home model (Table). This health care model can be particularly helpful for patients who require frequent admission to acute care facilities, and is well suited for patients with a range of conditions, including those with COVID-19, pneumonia, cellulitis, or congestive heart failure. This care model helps eliminate some of the stressors for patients who have chronic illnesses or other conditions that require frequent hospital admissions. Patients can independently recover at home and can also be surrounded by their loved ones and pets while recovering. This care approach additionally eliminates the risk of hospital-acquired infections and injuries. The hospital-at-home model allows for increased mobility,2 as patients are familiar with their surroundings, resulting in reduced onset of delirium. Additionally, patients with improved mobility performance are less likely to experience negative health outcomes.3 There is less chance of sleep disruption as the patient is sleeping in their own bed—no unfamiliar roommate, no call bells or health care personnel frequently coming into the room. The in-home technology set up for remote patient monitoring is designed with the user in mind. Ease of use empowers the patient to collaborate with their care team on their own terms and center the priorities of themselves and their families.

Positive Outcomes
The hospital-at-home model is associated with positive outcomes. The authors of a systematic review identified 10 randomized controlled trials of hospital-at-home programs (with a total of 1372 patients), but were able to obtain data for only 5 of these trials (with a total of 844 patients).4 They found a 38% reduction in 6-month mortality for patients who received hospital care at home, as well as significantly higher patient satisfaction across a range of medical conditions, including patients with cellulitis and community-acquired pneumonia, as well as elderly patients with multiple medical conditions. The authors concluded that hospital care at home was less expensive than admission to an acute care hospital.4 Similarly, a meta-analysis done by Caplan et al5 that included 61 randomized controlled trials concluded that hospital at home is associated with reductions in mortality, readmission rates, and cost, and increases in patient and caregiver satisfaction. Levine et al2 found reduced costs and utilization with home hospitalization compared to in-hospital care, as well as improved patient mobility status.
The home is the ideal place to empower patients and caregivers to engage in self-management.2 Receiving hospital care at home eliminates the need for dealing with transportation arrangements, traffic, road tolls, and time/scheduling constraints, or finding care for a dependent family member, some of the many stressors that may be experienced by patients who require frequent trips to the hospital. For patients who may not be clinically suitable candidates for hospital at home, such as those requiring critical care intervention and support, the brick-and-mortar hospital is still the appropriate site of care. The hospital-at-home model helps prevent bed shortages in brick-and-mortar hospital settings by allowing hospital care at home for patients who meet preset criteria. These patients can be hospitalized in alternative locations such as their own homes or the residence of a friend. This helps increase health system capacity as well as resiliency.
In addition to expanding safe and appropriate treatment spaces, the hospital-at-home model helps increase access to care for patients during nonstandard hours, including weekends, holidays, or when the waiting time in the emergency room is painfully long. Furthermore, providing care in the home gives the clinical team valuable insight into the patient’s daily life and routine. Performing medication reconciliation with the medicine cabinet in sight and dietary education in a patient’s kitchen are powerful touch points.2 For example, a patient with congestive heart failure who must undergo diuresis is much more likely to meet their care goals when their home diet is aligned with the treatment goal. By being able to see exactly what is in a patient’s pantry and fridge, the care team can create a much more tailored approach to sodium intake and fluid management. Providers can create and execute true patient-centric care as they gain direct insight into the patient’s lifestyle, which is clearly valuable when creating care plans for complex chronic health issues.
Challenges to Implementation and Scaling
Although there are clear benefits to hospital at home, how to best implement and scale this model presents a challenge. In addition to educating patients and families about this model of care, health care systems must expand their hospital-at-home programs and provide education about this model to clinical staff and trainees, and insurers must create reimbursement paradigms. Patients meeting eligibility criteria to enroll in hospital at home is the easiest hurdle, as hospital-at-home programs function best when they enroll and service as many patients as possible, including underserved populations.
Upfront Costs and Cost Savings
While there are upfront costs to set up technology and coordinate services, hospital at home also provides significant total cost savings when compared to coordination associated with brick-and-mortar admission. Hospital care accounts for about one-third of total medical expenditures and is a leading cause of debt.2 Eliminating fixed hospital costs such as facility, overhead, and equipment costs through adoption of the hospital-at-home model can lead to a reduction in expenditures. It has been found that fewer laboratory and diagnostic tests are ordered for hospital-at-home patients when compared to similar patients in brick-and-mortar hospital settings, with comparable or better clinical patient outcomes.6 Furthermore, it is estimated that there are cost savings of 19% to 30% when compared to traditional inpatient care.6 Without legislative action, upon the end of the current COVID-19 public health emergency, the Centers for Medicare & Medicaid Service’s Acute Hospital Care at Home waiver will terminate. This could slow down scaling of the model.However, over the past 2 years there has been enough buy-in from major health systems and patients to continue the momentum of the model’s growth. When setting up a hospital-at-home program, it would be wise to consider a few factors: where in the hospital or health system entity structure the hospital-at-home program will reside, which existing resources can be leveraged within the hospital or health system, and what are the state or federal regulatory requirements for such a program. This type of program continues to fill gaps within the US health care system, meeting the needs of widely overlooked populations and increasing access to essential ancillary services.
Conclusion
It is time to consider our bias toward hospital-first options when managing the care needs of our patients. Health care providers have the option to advocate for holistic care, better experience, and better outcomes. Home-based options are safe, equitable, and patient-centric. Increased costs, consumerism, and technology have pushed us to think about alternative approaches to patient care delivery, and the pandemic created a unique opportunity to see just how far the health care system could stretch itself with capacity constraints, insufficient resources, and staff shortages. In light of new possibilities, it is time to reimagine and transform our health care delivery system so that it is unified, seamless, cohesive, and flexible.
Corresponding author: Payal Sharma, DNP, MSN, RN, FNP-BC, CBN; psharma@medicallyhome.com.
Disclosures: None reported.
1. Cai S, Laurel PA, Makineni R, Marks ML. Evaluation of a hospital-in-home program implemented among veterans. Am J Manag Care. 2017;23(8):482-487.
2. Levine DM, Ouchi K, Blanchfield B, et al. Hospital-level care at home for acutely ill adults: a pilot randomized controlled trial. J Gen Intern Med. 2018;33(5):729-736. doi:10.1007/s11606-018-4307-z
3. Shuman V, Coyle PC, Perera S,et al. Association between improved mobility and distal health outcomes. J Gerontol A Biol Sci Med Sci. 2020;75(12):2412-2417. doi:10.1093/gerona/glaa086
4. Shepperd S, Doll H, Angus RM, et al. Avoiding hospital admission through provision of hospital care at home: a systematic review and meta-analysis of individual patient data. CMAJ. 2009;180(2):175-182. doi:10.1503/cmaj.081491
5. Caplan GA, Sulaiman NS, Mangin DA, et al. A meta-analysis of “hospital in the home”. Med J Aust. 2012;197(9):512-519. doi:10.5694/mja12.10480
6. Hospital at Home. Johns Hopkins Medicine. Healthcare Solutions. Accessed May 20, 2022. https://www.johnshopkinssolutions.com/solution/hospital-at-home/
From Medically Home Group, Boston, MA.
Brick-and-mortar hospitals in the United States have historically been considered the dominant setting for providing care to patients. The coordination and delivery of care has previously been bound to physical hospitals largely because multidisciplinary services were only accessible in an individual location. While the fundamental make-up of these services remains unchanged, these services are now available in alternate settings. Some of these services include access to a patient care team, supplies, diagnostics, pharmacy, and advanced therapeutic interventions. Presently, the physical environment is becoming increasingly irrelevant as the core of what makes the traditional hospital—the professional staff, collaborative work processes, and the dynamics of the space—have all been translated into a modern digitally integrated environment. The elements necessary to providing safe, effective care in a physical hospital setting are now available in a patient’s home.
Impetus for the Model
As hospitals reconsider how and where they deliver patient care because of limited resources, the hospital-at-home model has gained significant momentum and interest. This model transforms a home into a hospital. The inpatient acute care episode is entirely substituted with an intensive at-home hospital admission enabled by technology, multidisciplinary teams, and ancillary services. Furthermore, patients requiring post-acute support can be transitioned to their next phase of care seamlessly. Given the nationwide nursing shortage, aging population, challenges uncovered by the COVID-19 pandemic, rising hospital costs, nurse/provider burnout related to challenging work environments, and capacity constraints, a shift toward the combination of virtual and in-home care is imperative. The hospital-at-home model has been associated with superior patient outcomes, including reduced risks of delirium, improved functional status, improved patient and family member satisfaction, reduced mortality, reduced readmissions, and significantly lower costs.1 COVID-19 alone has unmasked major facility-based deficiencies and limitations of our health care system. While the pandemic is not the impetus for the hospital-at-home model, the extended stress of this event has created a unique opportunity to reimagine and transform our health care delivery system so that it is less fragmented and more flexible.
Nursing in the Model
Nursing is central to the hospital-at-home model. Virtual nurses provide meticulous care plan oversight, assessment, and documentation across in-home service providers, to ensure holistic, safe, transparent, and continuous progression toward care plan milestones. The virtual nurse monitors patients using in-home technology that is set up at the time of admission. Connecting with patients to verify social and medical needs, the virtual nurse advocates for their patients and uses these technologies to care and deploy on-demand hands-on services to the patient. Service providers such as paramedics, infusion nurses, or home health nurses may be deployed to provide services in the patient’s home. By bringing in supplies, therapeutics, and interdisciplinary team members, the capabilities of a brick-and-mortar hospital are replicated in the home. All actions that occur wherever the patient is receiving care are overseen by professional nursing staff; in short, virtual nurses are the equivalent of bedside nurses in the brick-and-mortar health care facilities.
Potential Benefits
There are many benefits to the hospital-at-home model (Table). This health care model can be particularly helpful for patients who require frequent admission to acute care facilities, and is well suited for patients with a range of conditions, including those with COVID-19, pneumonia, cellulitis, or congestive heart failure. This care model helps eliminate some of the stressors for patients who have chronic illnesses or other conditions that require frequent hospital admissions. Patients can independently recover at home and can also be surrounded by their loved ones and pets while recovering. This care approach additionally eliminates the risk of hospital-acquired infections and injuries. The hospital-at-home model allows for increased mobility,2 as patients are familiar with their surroundings, resulting in reduced onset of delirium. Additionally, patients with improved mobility performance are less likely to experience negative health outcomes.3 There is less chance of sleep disruption as the patient is sleeping in their own bed—no unfamiliar roommate, no call bells or health care personnel frequently coming into the room. The in-home technology set up for remote patient monitoring is designed with the user in mind. Ease of use empowers the patient to collaborate with their care team on their own terms and center the priorities of themselves and their families.
Positive Outcomes
The hospital-at-home model is associated with positive outcomes. The authors of a systematic review identified 10 randomized controlled trials of hospital-at-home programs (with a total of 1372 patients), but were able to obtain data for only 5 of these trials (with a total of 844 patients).4 They found a 38% reduction in 6-month mortality for patients who received hospital care at home, as well as significantly higher patient satisfaction across a range of medical conditions, including patients with cellulitis and community-acquired pneumonia, as well as elderly patients with multiple medical conditions. The authors concluded that hospital care at home was less expensive than admission to an acute care hospital.4 Similarly, a meta-analysis done by Caplan et al5 that included 61 randomized controlled trials concluded that hospital at home is associated with reductions in mortality, readmission rates, and cost, and increases in patient and caregiver satisfaction. Levine et al2 found reduced costs and utilization with home hospitalization compared to in-hospital care, as well as improved patient mobility status.
The home is the ideal place to empower patients and caregivers to engage in self-management.2 Receiving hospital care at home eliminates the need for dealing with transportation arrangements, traffic, road tolls, and time/scheduling constraints, or finding care for a dependent family member, some of the many stressors that may be experienced by patients who require frequent trips to the hospital. For patients who may not be clinically suitable candidates for hospital at home, such as those requiring critical care intervention and support, the brick-and-mortar hospital is still the appropriate site of care. The hospital-at-home model helps prevent bed shortages in brick-and-mortar hospital settings by allowing hospital care at home for patients who meet preset criteria. These patients can be hospitalized in alternative locations such as their own homes or the residence of a friend. This helps increase health system capacity as well as resiliency.
In addition to expanding safe and appropriate treatment spaces, the hospital-at-home model helps increase access to care for patients during nonstandard hours, including weekends, holidays, or when the waiting time in the emergency room is painfully long. Furthermore, providing care in the home gives the clinical team valuable insight into the patient’s daily life and routine. Performing medication reconciliation with the medicine cabinet in sight and dietary education in a patient’s kitchen are powerful touch points.2 For example, a patient with congestive heart failure who must undergo diuresis is much more likely to meet their care goals when their home diet is aligned with the treatment goal. By being able to see exactly what is in a patient’s pantry and fridge, the care team can create a much more tailored approach to sodium intake and fluid management. Providers can create and execute true patient-centric care as they gain direct insight into the patient’s lifestyle, which is clearly valuable when creating care plans for complex chronic health issues.
Challenges to Implementation and Scaling
Although there are clear benefits to hospital at home, how to best implement and scale this model presents a challenge. In addition to educating patients and families about this model of care, health care systems must expand their hospital-at-home programs and provide education about this model to clinical staff and trainees, and insurers must create reimbursement paradigms. Patients meeting eligibility criteria to enroll in hospital at home is the easiest hurdle, as hospital-at-home programs function best when they enroll and service as many patients as possible, including underserved populations.
Upfront Costs and Cost Savings
While there are upfront costs to set up technology and coordinate services, hospital at home also provides significant total cost savings when compared to coordination associated with brick-and-mortar admission. Hospital care accounts for about one-third of total medical expenditures and is a leading cause of debt.2 Eliminating fixed hospital costs such as facility, overhead, and equipment costs through adoption of the hospital-at-home model can lead to a reduction in expenditures. It has been found that fewer laboratory and diagnostic tests are ordered for hospital-at-home patients when compared to similar patients in brick-and-mortar hospital settings, with comparable or better clinical patient outcomes.6 Furthermore, it is estimated that there are cost savings of 19% to 30% when compared to traditional inpatient care.6 Without legislative action, upon the end of the current COVID-19 public health emergency, the Centers for Medicare & Medicaid Service’s Acute Hospital Care at Home waiver will terminate. This could slow down scaling of the model.However, over the past 2 years there has been enough buy-in from major health systems and patients to continue the momentum of the model’s growth. When setting up a hospital-at-home program, it would be wise to consider a few factors: where in the hospital or health system entity structure the hospital-at-home program will reside, which existing resources can be leveraged within the hospital or health system, and what are the state or federal regulatory requirements for such a program. This type of program continues to fill gaps within the US health care system, meeting the needs of widely overlooked populations and increasing access to essential ancillary services.
Conclusion
It is time to consider our bias toward hospital-first options when managing the care needs of our patients. Health care providers have the option to advocate for holistic care, better experience, and better outcomes. Home-based options are safe, equitable, and patient-centric. Increased costs, consumerism, and technology have pushed us to think about alternative approaches to patient care delivery, and the pandemic created a unique opportunity to see just how far the health care system could stretch itself with capacity constraints, insufficient resources, and staff shortages. In light of new possibilities, it is time to reimagine and transform our health care delivery system so that it is unified, seamless, cohesive, and flexible.
Corresponding author: Payal Sharma, DNP, MSN, RN, FNP-BC, CBN; psharma@medicallyhome.com.
Disclosures: None reported.
1. Cai S, Laurel PA, Makineni R, Marks ML. Evaluation of a hospital-in-home program implemented among veterans. Am J Manag Care. 2017;23(8):482-487.
2. Levine DM, Ouchi K, Blanchfield B, et al. Hospital-level care at home for acutely ill adults: a pilot randomized controlled trial. J Gen Intern Med. 2018;33(5):729-736. doi:10.1007/s11606-018-4307-z
3. Shuman V, Coyle PC, Perera S,et al. Association between improved mobility and distal health outcomes. J Gerontol A Biol Sci Med Sci. 2020;75(12):2412-2417. doi:10.1093/gerona/glaa086
4. Shepperd S, Doll H, Angus RM, et al. Avoiding hospital admission through provision of hospital care at home: a systematic review and meta-analysis of individual patient data. CMAJ. 2009;180(2):175-182. doi:10.1503/cmaj.081491
5. Caplan GA, Sulaiman NS, Mangin DA, et al. A meta-analysis of “hospital in the home”. Med J Aust. 2012;197(9):512-519. doi:10.5694/mja12.10480
6. Hospital at Home. Johns Hopkins Medicine. Healthcare Solutions. Accessed May 20, 2022. https://www.johnshopkinssolutions.com/solution/hospital-at-home/
The Intersection of Clinical Quality Improvement Research and Implementation Science
The Institute of Medicine brought much-needed attention to the need for process improvement in medicine with its seminal report To Err Is Human: Building a Safer Health System, which was issued in 1999, leading to the quality movement’s call to close health care performance gaps in Crossing the Quality Chasm: A New Health System for the 21st Century.1,2 Quality improvement science in medicine has evolved over the past 2 decades to include a broad spectrum of approaches, from agile improvement to continuous learning and improvement. Current efforts focus on Lean-based process improvement along with a reduction in variation in clinical practice to align practice with the principles of evidence-based medicine in a patient-centered approach.3 Further, the definition of quality improvement under the Affordable Care Act was framed as an equitable, timely, value-based, patient-centered approach to achieving population-level health goals.4 Thus, the science of quality improvement drives the core principles of care delivery improvement, and the rigorous evidence needed to expand innovation is embedded within the same framework.5,6 In clinical practice, quality improvement projects aim to define gaps and then specific steps are undertaken to improve the evidence-based practice of a specific process. The overarching goal is to enhance the efficacy of the practice by reducing waste within a particular domain. Thus, quality improvement and implementation research eventually unify how clinical practice is advanced concurrently to bridge identified gaps.7
System redesign through a patient-centered framework forms the core of an overarching strategy to support system-level processes. Both require a deep understanding of the fields of quality improvement science and implementation science.8 Furthermore, aligning clinical research needs, system aims, patients’ values, and clinical care give the new design a clear path forward. Patient-centered improvement includes the essential elements of system redesign around human factors, including communication, physical resources, and updated information during episodes of care. The patient-centered improvement design is juxtaposed with care planning and establishing continuum of care processes.9 It is essential to note that safety is rooted within the quality domain as a top priority in medicine.10 The best implementation methods and approaches are discussed and debated, and the improvement progress continues on multiple fronts.11 Patient safety systems are implemented simultaneously during the redesign phase. Moreover, identifying and testing the health care delivery methods in the era of competing strategic priorities to achieve the desirable clinical outcomes highlights the importance of implementation, while contemplating the methods of dissemination, scalability, and sustainability of the best evidence-based clinical practice.
The cycle of quality improvement research completes the system implementation efforts. The conceptual framework of quality improvement includes multiple areas of care and transition, along with applying the best clinical practices in a culture that emphasizes continuous improvement and learning. At the same time, the operating principles should include continuous improvement in a simple and continuous system of learning as a core concept. Our proposed implementation approach involves taking simple and practical steps while separating the process from the outcomes measures, extracting effectiveness throughout the process. It is essential to keep in mind that building a proactive and systematic improvement environment requires a framework for safety, reliability, and effective care, as well as the alignment of the physical system, communication, and professional environment and culture (Figure).

In summary, system design for quality improvement research should incorporate the principles and conceptual framework that embody effective implementation strategies, with a focus on operational and practical steps. Continuous improvement will be reached through the multidimensional development of current health care system metrics and the incorporation of implementation science methods.
Corresponding author: Ebrahim Barkoudah, MD, MPH, Department of Medicine, Brigham and Women’s Hospital, Boston, MA; ebarkoudah@bwh.harvard.edu
Disclosures: None reported.
1. Institute of Medicine (US) Committee on Quality of Health Care in America. To Err is Human: Building a Safer Health System. Kohn LT, Corrigan JM, Donaldson MS, editors. Washington (DC): National Academies Press (US); 2000.
2. Institute of Medicine (US) Committee on Quality of Health Care in America. Crossing the Quality Chasm: A New Health System for the 21st Century. Washington (DC): National Academies Press (US); 2001.
3. Berwick DM. The science of improvement. JAMA. 2008;299(10):1182-1184. doi:10.1001/jama.299.10.1182
4. Mazurenko O, Balio CP, Agarwal R, Carroll AE, Menachemi N. The effects of Medicaid expansion under the ACA: a systematic review. Health Affairs. 2018;37(6):944-950. doi: 10.1377/hlthaff.2017.1491
5. Fan E, Needham DM. The science of quality improvement. JAMA. 2008;300(4):390-391. doi:10.1001/jama.300.4.390-b
6. Alexander JA, Hearld LR. The science of quality improvement implementation: developing capacity to make a difference. Med Care. 2011:S6-20. doi:10.1097/MLR.0b013e3181e1709c
7. Rohweder C, Wangen M, Black M, et al. Understanding quality improvement collaboratives through an implementation science lens. Prev Med. 2019;129:105859. doi: 10.1016/j.ypmed.2019.105859
8. Bergeson SC, Dean JD. A systems approach to patient-centered care. JAMA. 2006;296(23):2848-2851. doi:10.1001/jama.296.23.2848
9. Leonard M, Graham S, Bonacum D. The human factor: the critical importance of effective teamwork and communication in providing safe care. Qual Saf Health Care. 2004;13 Suppl 1(Suppl 1):i85-90. doi:10.1136/qhc.13.suppl_1.i85
10. Leape LL, Berwick DM, Bates DW. What practices will most improve safety? Evidence-based medicine meets patient safety. JAMA. 2002;288(4):501-507. doi:10.1001/jama.288.4.501
11. Auerbach AD, Landefeld CS, Shojania KG. The tension between needing to improve care and knowing how to do it. N Engl J Med. 2007;357(6):608-613. doi:10.1056/NEJMsb070738
The Institute of Medicine brought much-needed attention to the need for process improvement in medicine with its seminal report To Err Is Human: Building a Safer Health System, which was issued in 1999, leading to the quality movement’s call to close health care performance gaps in Crossing the Quality Chasm: A New Health System for the 21st Century.1,2 Quality improvement science in medicine has evolved over the past 2 decades to include a broad spectrum of approaches, from agile improvement to continuous learning and improvement. Current efforts focus on Lean-based process improvement along with a reduction in variation in clinical practice to align practice with the principles of evidence-based medicine in a patient-centered approach.3 Further, the definition of quality improvement under the Affordable Care Act was framed as an equitable, timely, value-based, patient-centered approach to achieving population-level health goals.4 Thus, the science of quality improvement drives the core principles of care delivery improvement, and the rigorous evidence needed to expand innovation is embedded within the same framework.5,6 In clinical practice, quality improvement projects aim to define gaps and then specific steps are undertaken to improve the evidence-based practice of a specific process. The overarching goal is to enhance the efficacy of the practice by reducing waste within a particular domain. Thus, quality improvement and implementation research eventually unify how clinical practice is advanced concurrently to bridge identified gaps.7
System redesign through a patient-centered framework forms the core of an overarching strategy to support system-level processes. Both require a deep understanding of the fields of quality improvement science and implementation science.8 Furthermore, aligning clinical research needs, system aims, patients’ values, and clinical care give the new design a clear path forward. Patient-centered improvement includes the essential elements of system redesign around human factors, including communication, physical resources, and updated information during episodes of care. The patient-centered improvement design is juxtaposed with care planning and establishing continuum of care processes.9 It is essential to note that safety is rooted within the quality domain as a top priority in medicine.10 The best implementation methods and approaches are discussed and debated, and the improvement progress continues on multiple fronts.11 Patient safety systems are implemented simultaneously during the redesign phase. Moreover, identifying and testing the health care delivery methods in the era of competing strategic priorities to achieve the desirable clinical outcomes highlights the importance of implementation, while contemplating the methods of dissemination, scalability, and sustainability of the best evidence-based clinical practice.
The cycle of quality improvement research completes the system implementation efforts. The conceptual framework of quality improvement includes multiple areas of care and transition, along with applying the best clinical practices in a culture that emphasizes continuous improvement and learning. At the same time, the operating principles should include continuous improvement in a simple and continuous system of learning as a core concept. Our proposed implementation approach involves taking simple and practical steps while separating the process from the outcomes measures, extracting effectiveness throughout the process. It is essential to keep in mind that building a proactive and systematic improvement environment requires a framework for safety, reliability, and effective care, as well as the alignment of the physical system, communication, and professional environment and culture (Figure).
In summary, system design for quality improvement research should incorporate the principles and conceptual framework that embody effective implementation strategies, with a focus on operational and practical steps. Continuous improvement will be reached through the multidimensional development of current health care system metrics and the incorporation of implementation science methods.
Corresponding author: Ebrahim Barkoudah, MD, MPH, Department of Medicine, Brigham and Women’s Hospital, Boston, MA; ebarkoudah@bwh.harvard.edu
Disclosures: None reported.
1. Institute of Medicine (US) Committee on Quality of Health Care in America. To Err is Human: Building a Safer Health System. Kohn LT, Corrigan JM, Donaldson MS, editors. Washington (DC): National Academies Press (US); 2000.
2. Institute of Medicine (US) Committee on Quality of Health Care in America. Crossing the Quality Chasm: A New Health System for the 21st Century. Washington (DC): National Academies Press (US); 2001.
3. Berwick DM. The science of improvement. JAMA. 2008;299(10):1182-1184. doi:10.1001/jama.299.10.1182
4. Mazurenko O, Balio CP, Agarwal R, Carroll AE, Menachemi N. The effects of Medicaid expansion under the ACA: a systematic review. Health Affairs. 2018;37(6):944-950. doi: 10.1377/hlthaff.2017.1491
5. Fan E, Needham DM. The science of quality improvement. JAMA. 2008;300(4):390-391. doi:10.1001/jama.300.4.390-b
6. Alexander JA, Hearld LR. The science of quality improvement implementation: developing capacity to make a difference. Med Care. 2011:S6-20. doi:10.1097/MLR.0b013e3181e1709c
7. Rohweder C, Wangen M, Black M, et al. Understanding quality improvement collaboratives through an implementation science lens. Prev Med. 2019;129:105859. doi: 10.1016/j.ypmed.2019.105859
8. Bergeson SC, Dean JD. A systems approach to patient-centered care. JAMA. 2006;296(23):2848-2851. doi:10.1001/jama.296.23.2848
9. Leonard M, Graham S, Bonacum D. The human factor: the critical importance of effective teamwork and communication in providing safe care. Qual Saf Health Care. 2004;13 Suppl 1(Suppl 1):i85-90. doi:10.1136/qhc.13.suppl_1.i85
10. Leape LL, Berwick DM, Bates DW. What practices will most improve safety? Evidence-based medicine meets patient safety. JAMA. 2002;288(4):501-507. doi:10.1001/jama.288.4.501
11. Auerbach AD, Landefeld CS, Shojania KG. The tension between needing to improve care and knowing how to do it. N Engl J Med. 2007;357(6):608-613. doi:10.1056/NEJMsb070738
A Quantification Method to Compare the Value of Surgery and Palliative Care in Patients With Complex Cardiac Disease: A Concept
From the Department of Cardiothoracic Surgery, Stanford University, Stanford, CA.
Abstract
Complex cardiac patients are often referred for surgery or palliative care based on the risk of perioperative mortality. This decision ignores factors such as quality of life or duration of life in either surgery or the palliative path. Here, we propose a model to numerically assess and compare the value of surgery vs palliation. This model includes quality and duration of life, as well as risk of perioperative mortality, and involves a patient’s preferences in the decision-making process.
For each pathway, surgery or palliative care, a value is calculated and compared to a normal life value (no disease symptoms and normal life expectancy). The formula is adjusted for the risk of operative mortality. The model produces a ratio of the value of surgery to the value of palliative care that signifies the superiority of one or another. This model calculation presents an objective estimated numerical value to compare the value of surgery and palliative care. It can be applied to every decision-making process before surgery. In general, if a procedure has the potential to significantly extend life in a patient who otherwise has a very short life expectancy with palliation only, performing high-risk surgery would be a reasonable option. A model that provides a numerical value for surgery vs palliative care and includes quality and duration of life in each pathway could be a useful tool for cardiac surgeons in decision making regarding high-risk surgery.
Keywords: high-risk surgery, palliative care, quality of life, life expectancy.
Patients with complex cardiovascular disease are occasionally considered inoperable due to the high risk of surgical mortality. When the risk of perioperative mortality (POM) is predicted to be too high, surgical intervention is denied, and patients are often referred to palliative care. The risk of POM in cardiac surgery is often calculated using large-scale databases, such as the Society of Thoracic Surgeons (STS) records. The STS risk models, which are regularly updated, are based on large data sets and incorporate precise statistical methods for risk adjustment.1 In general, these calculators provide a percentage value that defines the magnitude of the risk of death, and then an arbitrary range is selected to categorize the procedure as low, medium, or high risk or inoperable status. The STS database does not set a cutoff point or range to define “operability.” Assigning inoperable status to a certain risk rate is problematic, with many ethical, legal, and moral implications, and for this reason, it has mostly remained undefined. In contrast, the low- and medium-risk ranges are easier to define. Another limitation encountered in the STS database is the lack of risk data for less common but very high-risk procedures, such as a triple valve replacement.
A common example where risk classification has been defined is in patients who are candidates for surgical vs transcatheter aortic valve replacement. Some groups have described a risk of <4% as low risk, 4% to 8% as intermediate risk, >8% as high risk, and >15% as inoperable2; for some other groups, a risk of POM >50% is considered extreme risk or inoperable.3,4 This procedure-specific classification is a useful decision-making tool and helps the surgeon perform an initial risk assessment to allocate a specific patient to a group—operable or nonoperable—only by calculating the risk of surgical death. However, this allocation method does not provide any information on how and when death occurs in either group. These 2 parameters of how and when death occurs define the quality of life (QOL) and the duration of life (DOL), respectively, and together could be considered as the value of life in each pathway. A survivor of a high-risk surgery may benefit from good quality and extended life (a high value), or, on the other end of the spectrum, a high-risk patient who does not undergo surgery is spared the mortality risk of the surgery but dies sooner (low value) with symptoms due to the natural course of the untreated disease.
The central question is, if a surgery is high risk but has the potential of providing a good value (for those who survive it), what QOL and DOL values are acceptable to risk or to justify accepting and proceeding with a risky surgery? Or how high a POM risk is justified to proceed with surgery rather than the alternative palliative care with a certain quality and duration? It is obvious that a decision-making process that is based on POM cannot compare the value of surgery (Vs) and the value of palliation (Vp). Furthermore, it ignores patient preferences and their input, as these are excluded from this decision-making process.
To be able to include QOL and DOL in any decision making, one must precisely describe these parameters. Both QOL and DOL are used for estimation of disease burden by health care administrators, public health experts, insurance agencies, and others. Multiple models have been proposed and used to estimate the overall burden of the disease. Most of the models for this purpose are created for large-scale economic purposes and not for decision making in individual cases.
An important measure is the quality-adjusted life year (QALY). This is an important parameter since it includes both measures of quality and quantity of life.5,6 QALY is a simplified measure to assess the value of health outcomes, and it has been used in economic calculations to assess mainly the cost-effectiveness of various interventions. We sought to evaluate the utility of a similar method in adding further insight into the surgical decision-making process. In this article, we propose a simple model to compare the value of surgery vs palliative care, similar to QALY. This model includes and adjusts for the quality and the quantity of life, in addition to the risk of POM, in the decision-making process for high-risk patients.
The Model
The 2 decision pathways, surgery and palliative care, are compared for their value. We define the value as the product of QOL and DOL in each pathway and use the severity of the symptoms as a surrogate for QOL. If duration and quality were depicted on the x and y axes of a graph (Figure 1), then the area under the curve would represent the collective value in each situation. Figure 2 shows the timeline and the different pathways with each decision. The value in each situation is calculated in relation to the full value, which is represented as the value of normal life (Vn), that is, life without disease and with normal life expectancy. The values of each decision pathway, the value of surgery (Vs) and the value of palliation (Vp), are then compared to define the benefit for each decision as follows:
If Vs/Vp > 1, the benefit is toward surgery;
If Vs/Vp < 1, the benefit is for palliative care.
 and in different disease pathways taken from a single sample")

Definitions
Both quality and duration of life are presented on a 1-10 scale, 1 being the lowest and 10 the highest value, to yield a product with a value of 100 in normal, disease-free life. Any lower value is presented as a percentage to represent the comparison to the full value. QOL is determined by degradation of full quality with the average level of symptoms. DOL is calculated as a lost time (
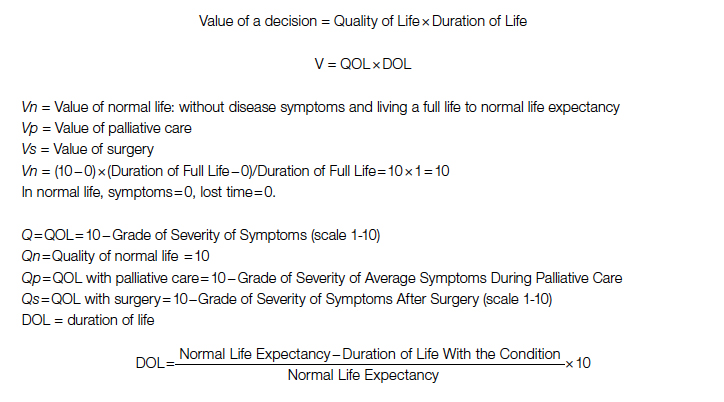
For the DOL under any condition, a 10-year survival rate could be used as a surrogate in this formula. Compared to life expectancy value, using the 10-year survival rate simplifies the calculation since cardiac diseases are more prevalent in older age, close to or beyond the average life expectancy value.
Using the time intervals from the timeline in Figure 2:
dh = time interval from diagnosis to death at life expectancy
dg = time interval from diagnosis to death after successful surgery
df = time interval from diagnosis to death after palliative care
Duration for palliative care:
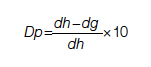
Duration for surgery:
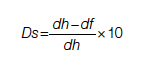
Adjustment: This value is calculated for those who survive the surgery. To adjust for the POM, it is multiplied by the 100 − POM risk.
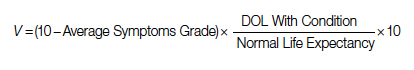
Since value is the base for comparison in this model, and it is the product of 2 equally important factors in the formula (
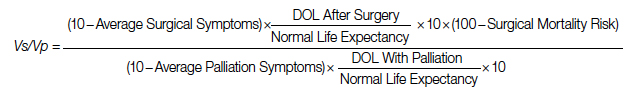
After elimination of normal life expectancy, form the numerator and denominator:
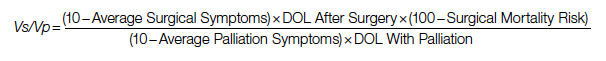
To adjust for surgical outcomes in special circumstances where less than optimal or standard surgical results are expected (eg, in very rare surgeries, limited resource institutions, or suboptimal postoperative surgical care), an optional coefficient R can be added to the numerator (surgical value). This optional coefficient, with values such as 0.8, 0.9 (to degrade the value of surgery) or 1 (standard surgical outcome), adjusts for variability in interinstitutional surgical results or surgeon variability. No coefficient is added to the denominator since palliative care provides minimal differences between clinicians and hospitals. Thus, the final adjusted formula would be as follows:
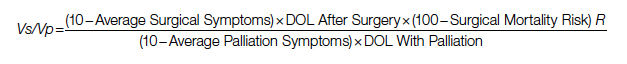
Example
A 60-year-old patient with a 10% POM risk needs to be allocated to surgical or palliative care. With palliative care, if this patient lived 6 years with average symptoms grade 4, the Vp would be 20; that is, 20% of the normal life value (if he lived 18 years instead without the disease).
Using the formula for calculation of value in each pathway:
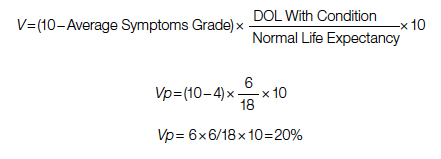
If the same patient undergoes a surgery with a 10% risk of POM, with an average grade 2 related to surgical recovery symptoms for 1 year and then is symptom-free and lives 12 years (instead of 18 years [life expectancy]), his Vs would be 53, or 53% out of the normal life value that is saved if the surgery is 100% successful; adjusted Vs with (chance of survival of 90%) would be 53 × 90% = 48%.
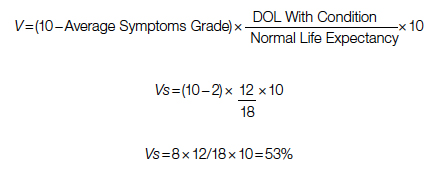
With adjustment of 90% survival chance in surgery, 53 × 90% = 48%. In this example, Vs/Vp = 48/20 = 2.4, showing a significant benefit for surgical care. Notably, the unknown value of normal life expectancy is not needed for the calculation of Vs/Vp, since it is the same in both pathways and it is eliminated by calculation in fraction.
Based on this formula, since the duration of surgical symptoms is short, no matter how severe these are, if the potential duration of life after surgery is high (represented by smaller area under the curve in Figure 1), the numerator becomes larger and the value of the surgery grows. For example, if a patient with a 15% risk of POM, which is generally considered inoperable, lives 5 years, as opposed to 2 years with palliative care with mild symptoms (eg 3/10), Vs/Vp would be 2.7, still showing a significant benefit for surgical care.
Discussion
Any surgical intervention is offered with 2 goals in mind, improving QOL and extending DOL. In a high-risk patient, surgery might be declined due to a high risk of POM, and the patient is offered palliative care, which other than providing symptom relief does not change the course of disease and eventually the patient will die due to the untreated disease. In this decision-making method, mostly completed by a care team only, a potential risk of death due to surgery which possibly could cure the patient is traded for immediate survival; however, the symptomatic course ensues until death. This mostly unilateral decision-making process by a care team, which incorporates minimal input from the patient or ignores patient preferences altogether, is based only on POM risk, and roughly includes a single parameter: years of potential life lost (YPLL). YPLL is a measure of premature mortality, and in the setting of surgical intervention, YPLL is the number of years a patient would lose unless a successful surgery were undertaken. Obviously, patients would live longer if a surgery that was intended to save them failed.
In this article, we proposed a simple method to quantify each decision to decide whether to operate or choose surgical care vs palliative care. Since quality and duration of life are both end factors clinicians and patients aspire to in each decision, they can be considered together as the value of each decision. We believe a numerical framework would provide an objective way to assist both the patient at high risk and the care team in the decision-making process.
The 2 parameters we consider are DOL and QOL. DOL, or survival, can be extracted from large-scale data using statistical methods that have been developed to predict survival under various conditions, such as Kaplan-Meier curves. These methods present the chance of survival in percentages in a defined time frame, such as a 5- or 10-year period.
While the DOL is a numerical parameter and quantifiable, the QOL is a more complex entity. This subjective parameter bears multiple definitions, aspects, and categories, and therefore multiple scales for quantification of QOL have been proposed. These scales have been used extensively for the purpose of health determination in health care policy and economic planning. Most scales acknowledge that QOL is multifactorial and includes interrelated aspects such as mental and socioeconomic factors. We have also noticed that QOL is better determined by the palliative care team than surgeons, so including these care providers in the decision-making process might reduce surgeon bias.
Since our purpose here is only to assist with the decision on medical intervention, we focus on physical QOL. Multiple scales are used to assess health-related QOL, such as the Assessment of Quality of Life (AQoL)-8D,7 EuroQol-5 Dimension (EQ-5D),8 15D,9 and the 36-Item Short Form Survey (SF-36).10 These complex scales are built for systematic reviews, and they are not practical for a clinical user. To simplify and keep this practical, we define QOL by using the severity or grade of symptoms related to the disease the patient has on a scale of 0 to 10. The severity of symptoms can be easily determined using available scales. An applicable scale for this purpose is the Edmonton Symptom Assessment Scale (ESAS), which has been in use for years and has evolved as a useful tool in the medical field.11
Once DOL and QOL are determined on a 1-10 scale, the multiplied value then provides a product that we consider a value. The highest value hoped for in each decision is the achievement of the best QOL and DOL, a value of 100. In Figure 1, a graphic presentation of value in each decision is best seen as the area under the curve. As shown, a successful surgery, even when accompanied by significant symptoms during initial recovery, has a chance (100 – risk of POM%) to gain a larger area under curve (value) by achieving a longer life with no or fewer symptoms. However, in palliative care, progressing disease and even palliated symptoms with a shorter life expectancy impose a large burden on the patient and a much lower value. Note that in this calculation, life expectancy, which is an important but unpredictable factor, is initially included; however, by ratio comparison, it is eliminated, simplifying the calculation further.
Using this formula in different settings reveals that high-risk surgery has a greater potential to reduce YPLL in the general population. Based on this formula, compared to a surgery with potential to significantly extend DOL, a definite shorter and symptomatic life course with palliative care makes it a significantly less favorable option. In fact, in the cardiovascular field, palliative care has minimal or no effect on natural history, as the mechanism of illness is mechanical, such as occlusion of coronary arteries or valve dysfunction, leading eventually to heart failure and death. In a study by Xu et al, although palliative care reduced readmission rates and improved symptoms on a variety of scales, there was no effect on mortality and QOL in patients with heart failure.12
No model in this field has proven to be ideal, and this model bears multiple limitations as well. We have used severity of symptoms as a surrogate for QOL based on the fact that cardiac patients with different pathologies who are untreated will have a common final pathway with development of heart failure symptoms that dictate their QOL. Also, grading QOL is a difficult task at times. Even a model such as QALY, which is one of the most used, is not a perfect model and is not free of problems.6 The difference in surgical results and life expectancy between sexes and ethnic groups might be a source of bias in this formula. Also, multiple factors directly and indirectly affect QOL and DOL and create inaccuracies; therefore, making an exact science from an inexact one naturally relies on multiple assumptions. Although it has previously been shown that most POM occurs in a short period of time after cardiac surgery,13 long-term complications that potentially degrade QOL are not included in this model. By applying this model, one must assume indefinite economic resources. Moreover, applying a single mathematical model in a biologic system and in the general population has intrinsic shortcomings, and it must overlook many other factors (eg, ethical, legal). For example, it will be hard to justify a failed surgery with 15% risk of POM undertaken to eliminate the severe long-lasting symptoms of a disease, while the outcome of a successful surgery with a 20% risk of POM that adds life and quality would be ignored in the current health care system. Thus, regardless of the significant potential, most surgeons would waive a surgery based solely on the percentage rate of POM, perhaps using other terms such as ”peri-nonoperative mortality.”
Conclusion
We have proposed a simple and practical formula for decision making regarding surgical vs palliative care in high-risk patients. By assigning a value that is composed of QOL and DOL in each pathway and including the risk of POM, a ratio of values provides a numerical estimation that can be used to show preference over a specific decision. An advantage of this formula, in addition to presenting an arithmetic value that is easier to understand, is that it can be used in shared decision making with patients. We emphasize that this model is only a preliminary concept at this time and has not been tested or validated for clinical use. Validation of such a model will require extensive work and testing within a large-scale population. We hope that this article will serve as a starting point for the development of other models, and that this formula will become more sophisticated with fewer limitations through larger multidisciplinary efforts in the future.
Corresponding author: Rabin Gerrah, MD, Good Samaritan Regional Medical Center, 3640 NW Samaritan Drive, Suite 100B, Corvallis, OR 97330; rgerrah@stanford.edu.
Disclosures: None reported.
1. O’Brien SM, Feng L, He X, et al. The Society of Thoracic Surgeons 2018 Adult Cardiac Surgery Risk Models: Part 2-statistical methods and results. Ann Thorac Surg. 2018;105(5):1419-1428. doi: 10.1016/j.athoracsur.2018.03.003
2. Hurtado Rendón IS, Bittenbender P, Dunn JM, Firstenberg MS. Chapter 8: Diagnostic workup and evaluation: eligibility, risk assessment, FDA guidelines. In: Transcatheter Heart Valve Handbook: A Surgeons’ and Interventional Council Review. Akron City Hospital, Summa Health System, Akron, OH.
3. Herrmann HC, Thourani VH, Kodali SK, et al; PARTNER Investigators. One-year clinical outcomes with SAPIEN 3 transcatheter aortic valve replacement in high-risk and inoperable patients with severe aortic stenosis. Circulation. 2016;134:130-140. doi:10.1161/CIRCULATIONAHA
4. Ho C, Argáez C. Transcatheter Aortic Valve Implantation for Patients with Severe Aortic Stenosis at Various Levels of Surgical Risk: A Review of Clinical Effectiveness. Ottawa (ON): Canadian Agency for Drugs and Technologies in Health; March 19, 2018.
5. Rios-Diaz AJ, Lam J, Ramos MS, et al. Global patterns of QALY and DALY use in surgical cost-utility analyses: a systematic review. PLoS One. 2016:10;11:e0148304. doi:10.1371/journal.pone.0148304
6. Prieto L, Sacristán JA. Health, Problems and solutions in calculating quality-adjusted life years (QALYs). Qual Life Outcomes. 2003:19;1:80.
7. Centre for Health Economics. Assessment of Quality of Life. 2014. Accessed May 13, 2022. http://www.aqol.com.au/
8. EuroQol Research Foundation. EQ-5D. Accessed May 13, 2022. https://euroqol.org/
9. 15D Instrument. Accessed May 13, 2022. http://www.15d-instrument.net/15d/
10. Rand Corporation. 36-Item Short Form Survey (SF-36).Accessed May 12, 2022. https://www.rand.org/health-care/surveys_tools/mos/36-item-short-form.html
11. Hui D, Bruera E. The Edmonton Symptom Assessment System 25 years later: past, present, and future developments. J Pain Symptom Manage. 2017:53:630-643. doi:10.1016/j.jpainsymman.2016
12. Xu Z, Chen L, Jin S, Yang B, Chen X, Wu Z. Effect of palliative care for patients with heart failure. Int Heart J. 2018:30;59:503-509. doi:10.1536/ihj.17-289
13. Mazzeffi M, Zivot J, Buchman T, Halkos M. In-hospital mortality after cardiac surgery: patient characteristics, timing, and association with postoperative length of intensive care unit and hospital stay. Ann Thorac Surg. 2014;97:1220-1225. doi:10.1016/j.athoracsur.2013.10.040
From the Department of Cardiothoracic Surgery, Stanford University, Stanford, CA.
Abstract
Complex cardiac patients are often referred for surgery or palliative care based on the risk of perioperative mortality. This decision ignores factors such as quality of life or duration of life in either surgery or the palliative path. Here, we propose a model to numerically assess and compare the value of surgery vs palliation. This model includes quality and duration of life, as well as risk of perioperative mortality, and involves a patient’s preferences in the decision-making process.
For each pathway, surgery or palliative care, a value is calculated and compared to a normal life value (no disease symptoms and normal life expectancy). The formula is adjusted for the risk of operative mortality. The model produces a ratio of the value of surgery to the value of palliative care that signifies the superiority of one or another. This model calculation presents an objective estimated numerical value to compare the value of surgery and palliative care. It can be applied to every decision-making process before surgery. In general, if a procedure has the potential to significantly extend life in a patient who otherwise has a very short life expectancy with palliation only, performing high-risk surgery would be a reasonable option. A model that provides a numerical value for surgery vs palliative care and includes quality and duration of life in each pathway could be a useful tool for cardiac surgeons in decision making regarding high-risk surgery.
Keywords: high-risk surgery, palliative care, quality of life, life expectancy.
Patients with complex cardiovascular disease are occasionally considered inoperable due to the high risk of surgical mortality. When the risk of perioperative mortality (POM) is predicted to be too high, surgical intervention is denied, and patients are often referred to palliative care. The risk of POM in cardiac surgery is often calculated using large-scale databases, such as the Society of Thoracic Surgeons (STS) records. The STS risk models, which are regularly updated, are based on large data sets and incorporate precise statistical methods for risk adjustment.1 In general, these calculators provide a percentage value that defines the magnitude of the risk of death, and then an arbitrary range is selected to categorize the procedure as low, medium, or high risk or inoperable status. The STS database does not set a cutoff point or range to define “operability.” Assigning inoperable status to a certain risk rate is problematic, with many ethical, legal, and moral implications, and for this reason, it has mostly remained undefined. In contrast, the low- and medium-risk ranges are easier to define. Another limitation encountered in the STS database is the lack of risk data for less common but very high-risk procedures, such as a triple valve replacement.
A common example where risk classification has been defined is in patients who are candidates for surgical vs transcatheter aortic valve replacement. Some groups have described a risk of <4% as low risk, 4% to 8% as intermediate risk, >8% as high risk, and >15% as inoperable2; for some other groups, a risk of POM >50% is considered extreme risk or inoperable.3,4 This procedure-specific classification is a useful decision-making tool and helps the surgeon perform an initial risk assessment to allocate a specific patient to a group—operable or nonoperable—only by calculating the risk of surgical death. However, this allocation method does not provide any information on how and when death occurs in either group. These 2 parameters of how and when death occurs define the quality of life (QOL) and the duration of life (DOL), respectively, and together could be considered as the value of life in each pathway. A survivor of a high-risk surgery may benefit from good quality and extended life (a high value), or, on the other end of the spectrum, a high-risk patient who does not undergo surgery is spared the mortality risk of the surgery but dies sooner (low value) with symptoms due to the natural course of the untreated disease.
The central question is, if a surgery is high risk but has the potential of providing a good value (for those who survive it), what QOL and DOL values are acceptable to risk or to justify accepting and proceeding with a risky surgery? Or how high a POM risk is justified to proceed with surgery rather than the alternative palliative care with a certain quality and duration? It is obvious that a decision-making process that is based on POM cannot compare the value of surgery (Vs) and the value of palliation (Vp). Furthermore, it ignores patient preferences and their input, as these are excluded from this decision-making process.
To be able to include QOL and DOL in any decision making, one must precisely describe these parameters. Both QOL and DOL are used for estimation of disease burden by health care administrators, public health experts, insurance agencies, and others. Multiple models have been proposed and used to estimate the overall burden of the disease. Most of the models for this purpose are created for large-scale economic purposes and not for decision making in individual cases.
An important measure is the quality-adjusted life year (QALY). This is an important parameter since it includes both measures of quality and quantity of life.5,6 QALY is a simplified measure to assess the value of health outcomes, and it has been used in economic calculations to assess mainly the cost-effectiveness of various interventions. We sought to evaluate the utility of a similar method in adding further insight into the surgical decision-making process. In this article, we propose a simple model to compare the value of surgery vs palliative care, similar to QALY. This model includes and adjusts for the quality and the quantity of life, in addition to the risk of POM, in the decision-making process for high-risk patients.
The Model
The 2 decision pathways, surgery and palliative care, are compared for their value. We define the value as the product of QOL and DOL in each pathway and use the severity of the symptoms as a surrogate for QOL. If duration and quality were depicted on the x and y axes of a graph (Figure 1), then the area under the curve would represent the collective value in each situation. Figure 2 shows the timeline and the different pathways with each decision. The value in each situation is calculated in relation to the full value, which is represented as the value of normal life (Vn), that is, life without disease and with normal life expectancy. The values of each decision pathway, the value of surgery (Vs) and the value of palliation (Vp), are then compared to define the benefit for each decision as follows:
If Vs/Vp > 1, the benefit is toward surgery;
If Vs/Vp < 1, the benefit is for palliative care.
Definitions
Both quality and duration of life are presented on a 1-10 scale, 1 being the lowest and 10 the highest value, to yield a product with a value of 100 in normal, disease-free life. Any lower value is presented as a percentage to represent the comparison to the full value. QOL is determined by degradation of full quality with the average level of symptoms. DOL is calculated as a lost time (
For the DOL under any condition, a 10-year survival rate could be used as a surrogate in this formula. Compared to life expectancy value, using the 10-year survival rate simplifies the calculation since cardiac diseases are more prevalent in older age, close to or beyond the average life expectancy value.
Using the time intervals from the timeline in Figure 2:
dh = time interval from diagnosis to death at life expectancy
dg = time interval from diagnosis to death after successful surgery
df = time interval from diagnosis to death after palliative care
Duration for palliative care:
Duration for surgery:
Adjustment: This value is calculated for those who survive the surgery. To adjust for the POM, it is multiplied by the 100 − POM risk.
Since value is the base for comparison in this model, and it is the product of 2 equally important factors in the formula (
After elimination of normal life expectancy, form the numerator and denominator:
To adjust for surgical outcomes in special circumstances where less than optimal or standard surgical results are expected (eg, in very rare surgeries, limited resource institutions, or suboptimal postoperative surgical care), an optional coefficient R can be added to the numerator (surgical value). This optional coefficient, with values such as 0.8, 0.9 (to degrade the value of surgery) or 1 (standard surgical outcome), adjusts for variability in interinstitutional surgical results or surgeon variability. No coefficient is added to the denominator since palliative care provides minimal differences between clinicians and hospitals. Thus, the final adjusted formula would be as follows:
Example
A 60-year-old patient with a 10% POM risk needs to be allocated to surgical or palliative care. With palliative care, if this patient lived 6 years with average symptoms grade 4, the Vp would be 20; that is, 20% of the normal life value (if he lived 18 years instead without the disease).
Using the formula for calculation of value in each pathway:
If the same patient undergoes a surgery with a 10% risk of POM, with an average grade 2 related to surgical recovery symptoms for 1 year and then is symptom-free and lives 12 years (instead of 18 years [life expectancy]), his Vs would be 53, or 53% out of the normal life value that is saved if the surgery is 100% successful; adjusted Vs with (chance of survival of 90%) would be 53 × 90% = 48%.
With adjustment of 90% survival chance in surgery, 53 × 90% = 48%. In this example, Vs/Vp = 48/20 = 2.4, showing a significant benefit for surgical care. Notably, the unknown value of normal life expectancy is not needed for the calculation of Vs/Vp, since it is the same in both pathways and it is eliminated by calculation in fraction.
Based on this formula, since the duration of surgical symptoms is short, no matter how severe these are, if the potential duration of life after surgery is high (represented by smaller area under the curve in Figure 1), the numerator becomes larger and the value of the surgery grows. For example, if a patient with a 15% risk of POM, which is generally considered inoperable, lives 5 years, as opposed to 2 years with palliative care with mild symptoms (eg 3/10), Vs/Vp would be 2.7, still showing a significant benefit for surgical care.
Discussion
Any surgical intervention is offered with 2 goals in mind, improving QOL and extending DOL. In a high-risk patient, surgery might be declined due to a high risk of POM, and the patient is offered palliative care, which other than providing symptom relief does not change the course of disease and eventually the patient will die due to the untreated disease. In this decision-making method, mostly completed by a care team only, a potential risk of death due to surgery which possibly could cure the patient is traded for immediate survival; however, the symptomatic course ensues until death. This mostly unilateral decision-making process by a care team, which incorporates minimal input from the patient or ignores patient preferences altogether, is based only on POM risk, and roughly includes a single parameter: years of potential life lost (YPLL). YPLL is a measure of premature mortality, and in the setting of surgical intervention, YPLL is the number of years a patient would lose unless a successful surgery were undertaken. Obviously, patients would live longer if a surgery that was intended to save them failed.
In this article, we proposed a simple method to quantify each decision to decide whether to operate or choose surgical care vs palliative care. Since quality and duration of life are both end factors clinicians and patients aspire to in each decision, they can be considered together as the value of each decision. We believe a numerical framework would provide an objective way to assist both the patient at high risk and the care team in the decision-making process.
The 2 parameters we consider are DOL and QOL. DOL, or survival, can be extracted from large-scale data using statistical methods that have been developed to predict survival under various conditions, such as Kaplan-Meier curves. These methods present the chance of survival in percentages in a defined time frame, such as a 5- or 10-year period.
While the DOL is a numerical parameter and quantifiable, the QOL is a more complex entity. This subjective parameter bears multiple definitions, aspects, and categories, and therefore multiple scales for quantification of QOL have been proposed. These scales have been used extensively for the purpose of health determination in health care policy and economic planning. Most scales acknowledge that QOL is multifactorial and includes interrelated aspects such as mental and socioeconomic factors. We have also noticed that QOL is better determined by the palliative care team than surgeons, so including these care providers in the decision-making process might reduce surgeon bias.
Since our purpose here is only to assist with the decision on medical intervention, we focus on physical QOL. Multiple scales are used to assess health-related QOL, such as the Assessment of Quality of Life (AQoL)-8D,7 EuroQol-5 Dimension (EQ-5D),8 15D,9 and the 36-Item Short Form Survey (SF-36).10 These complex scales are built for systematic reviews, and they are not practical for a clinical user. To simplify and keep this practical, we define QOL by using the severity or grade of symptoms related to the disease the patient has on a scale of 0 to 10. The severity of symptoms can be easily determined using available scales. An applicable scale for this purpose is the Edmonton Symptom Assessment Scale (ESAS), which has been in use for years and has evolved as a useful tool in the medical field.11
Once DOL and QOL are determined on a 1-10 scale, the multiplied value then provides a product that we consider a value. The highest value hoped for in each decision is the achievement of the best QOL and DOL, a value of 100. In Figure 1, a graphic presentation of value in each decision is best seen as the area under the curve. As shown, a successful surgery, even when accompanied by significant symptoms during initial recovery, has a chance (100 – risk of POM%) to gain a larger area under curve (value) by achieving a longer life with no or fewer symptoms. However, in palliative care, progressing disease and even palliated symptoms with a shorter life expectancy impose a large burden on the patient and a much lower value. Note that in this calculation, life expectancy, which is an important but unpredictable factor, is initially included; however, by ratio comparison, it is eliminated, simplifying the calculation further.
Using this formula in different settings reveals that high-risk surgery has a greater potential to reduce YPLL in the general population. Based on this formula, compared to a surgery with potential to significantly extend DOL, a definite shorter and symptomatic life course with palliative care makes it a significantly less favorable option. In fact, in the cardiovascular field, palliative care has minimal or no effect on natural history, as the mechanism of illness is mechanical, such as occlusion of coronary arteries or valve dysfunction, leading eventually to heart failure and death. In a study by Xu et al, although palliative care reduced readmission rates and improved symptoms on a variety of scales, there was no effect on mortality and QOL in patients with heart failure.12
No model in this field has proven to be ideal, and this model bears multiple limitations as well. We have used severity of symptoms as a surrogate for QOL based on the fact that cardiac patients with different pathologies who are untreated will have a common final pathway with development of heart failure symptoms that dictate their QOL. Also, grading QOL is a difficult task at times. Even a model such as QALY, which is one of the most used, is not a perfect model and is not free of problems.6 The difference in surgical results and life expectancy between sexes and ethnic groups might be a source of bias in this formula. Also, multiple factors directly and indirectly affect QOL and DOL and create inaccuracies; therefore, making an exact science from an inexact one naturally relies on multiple assumptions. Although it has previously been shown that most POM occurs in a short period of time after cardiac surgery,13 long-term complications that potentially degrade QOL are not included in this model. By applying this model, one must assume indefinite economic resources. Moreover, applying a single mathematical model in a biologic system and in the general population has intrinsic shortcomings, and it must overlook many other factors (eg, ethical, legal). For example, it will be hard to justify a failed surgery with 15% risk of POM undertaken to eliminate the severe long-lasting symptoms of a disease, while the outcome of a successful surgery with a 20% risk of POM that adds life and quality would be ignored in the current health care system. Thus, regardless of the significant potential, most surgeons would waive a surgery based solely on the percentage rate of POM, perhaps using other terms such as ”peri-nonoperative mortality.”
Conclusion
We have proposed a simple and practical formula for decision making regarding surgical vs palliative care in high-risk patients. By assigning a value that is composed of QOL and DOL in each pathway and including the risk of POM, a ratio of values provides a numerical estimation that can be used to show preference over a specific decision. An advantage of this formula, in addition to presenting an arithmetic value that is easier to understand, is that it can be used in shared decision making with patients. We emphasize that this model is only a preliminary concept at this time and has not been tested or validated for clinical use. Validation of such a model will require extensive work and testing within a large-scale population. We hope that this article will serve as a starting point for the development of other models, and that this formula will become more sophisticated with fewer limitations through larger multidisciplinary efforts in the future.
Corresponding author: Rabin Gerrah, MD, Good Samaritan Regional Medical Center, 3640 NW Samaritan Drive, Suite 100B, Corvallis, OR 97330; rgerrah@stanford.edu.
Disclosures: None reported.
1. O’Brien SM, Feng L, He X, et al. The Society of Thoracic Surgeons 2018 Adult Cardiac Surgery Risk Models: Part 2-statistical methods and results. Ann Thorac Surg. 2018;105(5):1419-1428. doi: 10.1016/j.athoracsur.2018.03.003
2. Hurtado Rendón IS, Bittenbender P, Dunn JM, Firstenberg MS. Chapter 8: Diagnostic workup and evaluation: eligibility, risk assessment, FDA guidelines. In: Transcatheter Heart Valve Handbook: A Surgeons’ and Interventional Council Review. Akron City Hospital, Summa Health System, Akron, OH.
3. Herrmann HC, Thourani VH, Kodali SK, et al; PARTNER Investigators. One-year clinical outcomes with SAPIEN 3 transcatheter aortic valve replacement in high-risk and inoperable patients with severe aortic stenosis. Circulation. 2016;134:130-140. doi:10.1161/CIRCULATIONAHA
4. Ho C, Argáez C. Transcatheter Aortic Valve Implantation for Patients with Severe Aortic Stenosis at Various Levels of Surgical Risk: A Review of Clinical Effectiveness. Ottawa (ON): Canadian Agency for Drugs and Technologies in Health; March 19, 2018.
5. Rios-Diaz AJ, Lam J, Ramos MS, et al. Global patterns of QALY and DALY use in surgical cost-utility analyses: a systematic review. PLoS One. 2016:10;11:e0148304. doi:10.1371/journal.pone.0148304
6. Prieto L, Sacristán JA. Health, Problems and solutions in calculating quality-adjusted life years (QALYs). Qual Life Outcomes. 2003:19;1:80.
7. Centre for Health Economics. Assessment of Quality of Life. 2014. Accessed May 13, 2022. http://www.aqol.com.au/
8. EuroQol Research Foundation. EQ-5D. Accessed May 13, 2022. https://euroqol.org/
9. 15D Instrument. Accessed May 13, 2022. http://www.15d-instrument.net/15d/
10. Rand Corporation. 36-Item Short Form Survey (SF-36).Accessed May 12, 2022. https://www.rand.org/health-care/surveys_tools/mos/36-item-short-form.html
11. Hui D, Bruera E. The Edmonton Symptom Assessment System 25 years later: past, present, and future developments. J Pain Symptom Manage. 2017:53:630-643. doi:10.1016/j.jpainsymman.2016
12. Xu Z, Chen L, Jin S, Yang B, Chen X, Wu Z. Effect of palliative care for patients with heart failure. Int Heart J. 2018:30;59:503-509. doi:10.1536/ihj.17-289
13. Mazzeffi M, Zivot J, Buchman T, Halkos M. In-hospital mortality after cardiac surgery: patient characteristics, timing, and association with postoperative length of intensive care unit and hospital stay. Ann Thorac Surg. 2014;97:1220-1225. doi:10.1016/j.athoracsur.2013.10.040