User login
Hospital programs tackle mental health effects of long COVID
There’s little doubt that long COVID is real. Even as doctors and federal agencies struggle to define the syndrome, hospitals and health care systems are opening long COVID specialty treatment programs. As of July 25, there’s at least one long COVID center in almost every state – 48 out of 50, according to the patient advocacy group Survivor Corps.
Among the biggest challenges will be treating the mental health effects of long COVID.

Specialized centers will be tackling these problems even as the United States struggles to deal with mental health needs.
One study of COVID patients found more than one-third of them had symptoms of depression, anxiety, or PTSD 3-6 months after their initial infection. Another analysis of 30 previous studies of long COVID patients found roughly one in eight of them had severe depression – and that the risk was similar regardless of whether people were hospitalized for COVID-19.
“Many of these symptoms can emerge months into the course of long COVID illness,” said Jordan Anderson, DO, a neuropsychiatrist who sees patients at the Long COVID-19 Program at Oregon Health & Science University, Portland. Psychological symptoms are often made worse by physical setbacks like extreme fatigue and by challenges of working, caring for children, and keeping up with daily routines, he said.
“This impact is not only severe, but also chronic for many,” he said.
Like dozens of hospitals around the country, Oregon Health & Science opened its center for long COVID as it became clear that more patients would need help for ongoing physical and mental health symptoms. Today, there’s at least one long COVID center – sometimes called post-COVID care centers or clinics – in every state but Kansas and South Dakota, Survivor Corps said.
Many long COVID care centers aim to tackle both physical and mental health symptoms, said Tracy Vannorsdall, PhD, a neuropsychologist with the Johns Hopkins Post-Acute COVID-19 Team program. One goal at Hopkins is to identify patients with psychological issues that might otherwise get overlooked.
A sizable minority of patients at the Johns Hopkins center – up to about 35% – report mental health problems that they didn’t have until after they got COVID-19, Dr. Vannorsdall says. The most common mental health issues providers see are depression, anxiety, and trauma-related distress.
“Routine assessment is key,” Dr. Vannorsdall said. “If patients are not asked about their mental health symptoms, they may not spontaneously report them to their provider due to fear of stigma or simply not appreciating that there are effective treatments available for these issues.”
Fear that doctors won’t take symptoms seriously is common, says Heather Murray MD, a senior instructor in psychiatry at the University of Colorado at Denver, Aurora.
“Many patients worry their physicians, loved ones, and society will not believe them or will minimize their symptoms and suffering,” said Dr. Murray, who treats patients at the UCHealth Post-COVID Clinic.
Diagnostic tests in long COVID patients often don’t have conclusive results, which can lead doctors and patients themselves to question whether symptoms are truly “physical versus psychosomatic,” she said. “It is important that providers believe their patients and treat their symptoms, even when diagnostic tests are unrevealing.”
Growing mental health crisis
Patients often find their way to academic treatment centers after surviving severe COVID-19 infections. But a growing number of long COVID patients show up at these centers after milder cases. These patients were never hospitalized for COVID-19 but still have persistent symptoms like fatigue, thinking problems, and mood disorders.
Among the major challenges is a shortage of mental health care providers to meet the surging need for care since the start of the pandemic. Around the world, anxiety and depression surged 25% during the first year of the pandemic, according to the World Health Organization.
In the United States, 40% of adults report feelings of anxiety and depression, and one in three high school students have feelings of sadness and hopelessness, according to a March 2022 statement from the White House.
Despite this surging need for care, almost half of Americans live in areas with a severe shortage of mental health care providers, according to the Health Resources and Services Administration. As of 2019, the United States had a shortage of about 6,790 mental health providers. Since then, the shortage has worsened; it’s now about 7,500 providers.
“One of the biggest challenges for hospitals and clinics in treating mental health disorders in long COVID is the limited resources and long wait times to get in for evaluations and treatment,” said Nyaz Didehbani, PhD, a neuropsychologist who treats long COVID patients at the COVID Recover program at the University of Texas Southwestern Medical Center, Dallas.
These delays can lead to worse outcomes, Dr. Didehbani said. “Additionally, patients do not feel that they are being heard, as many providers are not aware of the mental health impact and relationship with physical and cognitive symptoms.” .
Even when doctors recognize that psychological challenges are common with long COVID, they still have to think creatively to come up with treatments that meet the unique needs of these patients, said Thida Thant, MD, an assistant professor of psychiatry at the University of Colorado who treats patients at the UCHealth Post-COVID Clinic.
“There are at least two major factors that make treating psychological issues in long COVID more complex: The fact that the pandemic is still ongoing and still so divisive throughout society, and the fact that we don’t know a single best way to treat all symptoms of long COVID,” she said.
Some common treatments for anxiety and depression, like psychotherapy and medication, can be used for long COVID patients with these conditions. But another intervention that can work wonders for many people with mood disorders – exercise – doesn’t always work for long COVID patients. That’s because many of them struggle with physical challenges like chronic fatigue and what’s known as postexertional malaise, or a worsening of symptoms after even limited physical effort.
“While we normally encourage patients to be active, have a daily routine, and to engage in physical activity as part of their mental health treatment, some long COVID patients find that their symptoms worsen after increased activity,” Dr. Vannorsdall said.
Patients who are able to reach long COVID care centers are much more apt to get mental health problems diagnosed and treated, doctors at many programs around the country agree. But many patients hardest hit by the pandemic – the poor and racial and ethnic minorities – are also less likely to have ready access to hospitals that offer these programs, said Dr. Anderson.
“Affluent, predominantly White populations are showing up in these clinics, while we know that non-White populations have disproportionally high rates of acute infection, hospitalization, and death related to the virus,” he said.
Clinics are also concentrated in academic medical centers and in urban areas, limiting options for people in rural communities who may have to drive for hours to access care, Dr. Anderson said.
“Even before long COVID, we already knew that many people live in areas where there simply aren’t enough mental health services available,” said John Zulueta, MD, an assistant professor of clinical psychiatry at the University of Illinois at Chicago who provides mental health evaluations at the UI Health Post-COVID Clinic.
“As more patients develop mental health issues associated with long COVID, it’s going to put more stress on an already stressed system,” he said.
A version of this article first appeared on WebMD.com.
There’s little doubt that long COVID is real. Even as doctors and federal agencies struggle to define the syndrome, hospitals and health care systems are opening long COVID specialty treatment programs. As of July 25, there’s at least one long COVID center in almost every state – 48 out of 50, according to the patient advocacy group Survivor Corps.
Among the biggest challenges will be treating the mental health effects of long COVID.
Specialized centers will be tackling these problems even as the United States struggles to deal with mental health needs.
One study of COVID patients found more than one-third of them had symptoms of depression, anxiety, or PTSD 3-6 months after their initial infection. Another analysis of 30 previous studies of long COVID patients found roughly one in eight of them had severe depression – and that the risk was similar regardless of whether people were hospitalized for COVID-19.
“Many of these symptoms can emerge months into the course of long COVID illness,” said Jordan Anderson, DO, a neuropsychiatrist who sees patients at the Long COVID-19 Program at Oregon Health & Science University, Portland. Psychological symptoms are often made worse by physical setbacks like extreme fatigue and by challenges of working, caring for children, and keeping up with daily routines, he said.
“This impact is not only severe, but also chronic for many,” he said.
Like dozens of hospitals around the country, Oregon Health & Science opened its center for long COVID as it became clear that more patients would need help for ongoing physical and mental health symptoms. Today, there’s at least one long COVID center – sometimes called post-COVID care centers or clinics – in every state but Kansas and South Dakota, Survivor Corps said.
Many long COVID care centers aim to tackle both physical and mental health symptoms, said Tracy Vannorsdall, PhD, a neuropsychologist with the Johns Hopkins Post-Acute COVID-19 Team program. One goal at Hopkins is to identify patients with psychological issues that might otherwise get overlooked.
A sizable minority of patients at the Johns Hopkins center – up to about 35% – report mental health problems that they didn’t have until after they got COVID-19, Dr. Vannorsdall says. The most common mental health issues providers see are depression, anxiety, and trauma-related distress.
“Routine assessment is key,” Dr. Vannorsdall said. “If patients are not asked about their mental health symptoms, they may not spontaneously report them to their provider due to fear of stigma or simply not appreciating that there are effective treatments available for these issues.”
Fear that doctors won’t take symptoms seriously is common, says Heather Murray MD, a senior instructor in psychiatry at the University of Colorado at Denver, Aurora.
“Many patients worry their physicians, loved ones, and society will not believe them or will minimize their symptoms and suffering,” said Dr. Murray, who treats patients at the UCHealth Post-COVID Clinic.
Diagnostic tests in long COVID patients often don’t have conclusive results, which can lead doctors and patients themselves to question whether symptoms are truly “physical versus psychosomatic,” she said. “It is important that providers believe their patients and treat their symptoms, even when diagnostic tests are unrevealing.”
Growing mental health crisis
Patients often find their way to academic treatment centers after surviving severe COVID-19 infections. But a growing number of long COVID patients show up at these centers after milder cases. These patients were never hospitalized for COVID-19 but still have persistent symptoms like fatigue, thinking problems, and mood disorders.
Among the major challenges is a shortage of mental health care providers to meet the surging need for care since the start of the pandemic. Around the world, anxiety and depression surged 25% during the first year of the pandemic, according to the World Health Organization.
In the United States, 40% of adults report feelings of anxiety and depression, and one in three high school students have feelings of sadness and hopelessness, according to a March 2022 statement from the White House.
Despite this surging need for care, almost half of Americans live in areas with a severe shortage of mental health care providers, according to the Health Resources and Services Administration. As of 2019, the United States had a shortage of about 6,790 mental health providers. Since then, the shortage has worsened; it’s now about 7,500 providers.
“One of the biggest challenges for hospitals and clinics in treating mental health disorders in long COVID is the limited resources and long wait times to get in for evaluations and treatment,” said Nyaz Didehbani, PhD, a neuropsychologist who treats long COVID patients at the COVID Recover program at the University of Texas Southwestern Medical Center, Dallas.
These delays can lead to worse outcomes, Dr. Didehbani said. “Additionally, patients do not feel that they are being heard, as many providers are not aware of the mental health impact and relationship with physical and cognitive symptoms.” .
Even when doctors recognize that psychological challenges are common with long COVID, they still have to think creatively to come up with treatments that meet the unique needs of these patients, said Thida Thant, MD, an assistant professor of psychiatry at the University of Colorado who treats patients at the UCHealth Post-COVID Clinic.
“There are at least two major factors that make treating psychological issues in long COVID more complex: The fact that the pandemic is still ongoing and still so divisive throughout society, and the fact that we don’t know a single best way to treat all symptoms of long COVID,” she said.
Some common treatments for anxiety and depression, like psychotherapy and medication, can be used for long COVID patients with these conditions. But another intervention that can work wonders for many people with mood disorders – exercise – doesn’t always work for long COVID patients. That’s because many of them struggle with physical challenges like chronic fatigue and what’s known as postexertional malaise, or a worsening of symptoms after even limited physical effort.
“While we normally encourage patients to be active, have a daily routine, and to engage in physical activity as part of their mental health treatment, some long COVID patients find that their symptoms worsen after increased activity,” Dr. Vannorsdall said.
Patients who are able to reach long COVID care centers are much more apt to get mental health problems diagnosed and treated, doctors at many programs around the country agree. But many patients hardest hit by the pandemic – the poor and racial and ethnic minorities – are also less likely to have ready access to hospitals that offer these programs, said Dr. Anderson.
“Affluent, predominantly White populations are showing up in these clinics, while we know that non-White populations have disproportionally high rates of acute infection, hospitalization, and death related to the virus,” he said.
Clinics are also concentrated in academic medical centers and in urban areas, limiting options for people in rural communities who may have to drive for hours to access care, Dr. Anderson said.
“Even before long COVID, we already knew that many people live in areas where there simply aren’t enough mental health services available,” said John Zulueta, MD, an assistant professor of clinical psychiatry at the University of Illinois at Chicago who provides mental health evaluations at the UI Health Post-COVID Clinic.
“As more patients develop mental health issues associated with long COVID, it’s going to put more stress on an already stressed system,” he said.
A version of this article first appeared on WebMD.com.
Nonphysician Clinicians in Dermatology Residencies: Cross-sectional Survey on Residency Education
To the Editor:
There is increasing demand for medical care in the United States due to expanded health care coverage; an aging population; and advancements in diagnostics, treatment, and technology.1 It is predicted that by 2050 the number of dermatologists will be 24.4% short of the expected estimate of demand.2
Accordingly, dermatologists are increasingly practicing in team-based care delivery models that incorporate nonphysician clinicians (NPCs), including nurse practitioners and physician assistants.1 Despite recognition that NPCs are taking a larger role in medical teams, there is, to our knowledge, limited training for dermatologists and dermatologists in-training to optimize this professional alliance.
The objectives of this study included (1) determining whether residency programs adequately prepare residents to work with or supervise NPCs and (2) understanding the relationship between NPCs and dermatology residents across residency programs in the United States.
An anonymous cross-sectional, Internet-based survey designed using Google Forms survey creation and administration software was distributed to 117 dermatology residency program directors through email, with a request for further dissemination to residents through self-maintained listserves. Four email reminders about completing and disseminating the survey were sent to program directors between August and November 2020. The study was approved by the Emory University institutional review board. All respondents consented to participate in this survey prior to completing it.
The survey included questions pertaining to demographic information, residents’ experiences working with NPCs, residency program training specific to working with NPCs, and residents’ and residency program directors’ opinions on NPCs’ impact on education and patient care. Program directors were asked to respond N/A to 6 questions on the survey because data from those questions represented residents’ opinions only. Questions relating to residents’ and residency program directors’ opinions were based on a 5-point scale of impact (1=strongly impact in a negative way; 5=strongly impact in a positive way) or importance (1=not at all important; 5=extremely important). The survey was not previously validated.
Descriptive analysis and a paired t test were conducted when appropriate. Missing data were excluded.

There were 81 respondents to the survey. Demographic information is shown Table 1. Thirty-five dermatology residency program directors (29.9% of 117 programs) responded. Of the 45 residents or recent graduates, 29 (64.4%) reported that they foresaw the need to work with or supervise NPCs in the future (Table 2). Currently, 29 (64.4%) residents also reported that (1) they do not feel adequately trained to provide supervision of or to work with NPCs or (2) were uncertain whether they could do so. Sixty-five (80.2%) respondents stated that there was no formalized training in their program for supervising or working with NPCs; 45 (55.6%) respondents noted that they do not think that their program provided adequate training in supervising NPCs.


Regarding NPCs impact on care, residency program directors who completed the survey were more likely to rank NPCs as having a more significant positive impact on patient care than residents (mean score, 3.43 vs 2.78; P=.043; 95% CI, –1.28 to –0.20)(Table 3).

This study demonstrated a lack of dermatology training related to working with NPCs in a professional setting and highlighted residents’ perception that formal education in working with and supervising NPCs could be of benefit to their education. Furthermore, residency directors perceived NPCs as having a greater positive impact on patient care than residents did, underscoring the importance of the continued need to educate residents on working synergistically with NPCs to optimize patient care. Ultimately, these results suggest a potential area for further development of residency curricula.
There are approximately 360,000 NPCs serving as integral members of interdisciplinary medical teams across the United States.3,4 In a 2014 survey, 46% of 2001 dermatologists noted that they already employed 1 or more NPCs, a number that has increased over time and is likely to continue to do so.5 Although the number of NPCs in dermatology has increased, there remain limited formal training and certificate programs for these providers.1,6
Furthermore, the American Academy of Dermatology recommends that “[w]hen practicing in a dermatological setting, non-dermatologist physicians and non-physician clinicians . . . should be directly supervised by a board-certified dermatologist.”7 Therefore, the responsibility for a dermatology-specific education can fall on the dermatologist, necessitating adequate supervision and training of NPCs.
The findings of this study were limited by a small sample size; response bias because distribution of the survey relied on program directors disseminating the instrument to their residents, thereby limiting generalizability; and a lack of predissemination validation of the survey. Additional research in this area should focus on survey validation and distribution directly to dermatology residents, instead of relying on dermatology program directors to disseminate the survey.
- Sargen MR, Shi L, Hooker RS, et al. Future growth of physicians and non-physician providers within the U.S. Dermatology workforce. Dermatol Online J. 2017;23:13030/qt840223q6
- The current and projected dermatology workforce in the United States. J Am Acad Dermatol. 2016;74(suppl 1):AB122. doi:10.1016/j.jaad.2016.02.478
- Nurse anesthetists, nurse midwives, and nurse practitioners.Occupational Outlook Handbook. Washington, DC: US Department of Labor. Updated April 18, 2022. Accessed July 14, 2022. https://www.bls.gov/ooh/health care/nurse-anesthetists-nurse-midwives-and-nurse-practitioners.htm
- Physician assistants. Occupational Outlook Handbook. Washington, DC: US Department of Labor. Updated April 18, 2022. Accessed July 14, 2022. https://www.bls.gov/ooh/healthcare/physician-assistants.htm
- Ehrlich A, Kostecki J, Olkaba H. Trends in dermatology practices and the implications for the workforce. J Am Acad Dermatol. 2017;77:746-752. doi:10.1016/j.jaad.2017.06.030
- Anderson AM, Matsumoto M, Saul MI, et al. Accuracy of skin cancer diagnosis by physician assistants compared with dermatologists in a large health care system. JAMA Dermatol. 2018;154:569-573. doi:10.1001/jamadermatol.2018.0212s
- American Academy of Dermatology Association. Position statement on the practice of dermatology: protecting and preserving patient safety and quality care. Revised May 21, 2016. Accessed July 14, 2022. https://server.aad.org/Forms/Policies/Uploads/PS/PS-Practice of Dermatology-Protecting Preserving Patient Safety Quality Care.pdf?
To the Editor:
There is increasing demand for medical care in the United States due to expanded health care coverage; an aging population; and advancements in diagnostics, treatment, and technology.1 It is predicted that by 2050 the number of dermatologists will be 24.4% short of the expected estimate of demand.2
Accordingly, dermatologists are increasingly practicing in team-based care delivery models that incorporate nonphysician clinicians (NPCs), including nurse practitioners and physician assistants.1 Despite recognition that NPCs are taking a larger role in medical teams, there is, to our knowledge, limited training for dermatologists and dermatologists in-training to optimize this professional alliance.
The objectives of this study included (1) determining whether residency programs adequately prepare residents to work with or supervise NPCs and (2) understanding the relationship between NPCs and dermatology residents across residency programs in the United States.
An anonymous cross-sectional, Internet-based survey designed using Google Forms survey creation and administration software was distributed to 117 dermatology residency program directors through email, with a request for further dissemination to residents through self-maintained listserves. Four email reminders about completing and disseminating the survey were sent to program directors between August and November 2020. The study was approved by the Emory University institutional review board. All respondents consented to participate in this survey prior to completing it.
The survey included questions pertaining to demographic information, residents’ experiences working with NPCs, residency program training specific to working with NPCs, and residents’ and residency program directors’ opinions on NPCs’ impact on education and patient care. Program directors were asked to respond N/A to 6 questions on the survey because data from those questions represented residents’ opinions only. Questions relating to residents’ and residency program directors’ opinions were based on a 5-point scale of impact (1=strongly impact in a negative way; 5=strongly impact in a positive way) or importance (1=not at all important; 5=extremely important). The survey was not previously validated.
Descriptive analysis and a paired t test were conducted when appropriate. Missing data were excluded.
There were 81 respondents to the survey. Demographic information is shown Table 1. Thirty-five dermatology residency program directors (29.9% of 117 programs) responded. Of the 45 residents or recent graduates, 29 (64.4%) reported that they foresaw the need to work with or supervise NPCs in the future (Table 2). Currently, 29 (64.4%) residents also reported that (1) they do not feel adequately trained to provide supervision of or to work with NPCs or (2) were uncertain whether they could do so. Sixty-five (80.2%) respondents stated that there was no formalized training in their program for supervising or working with NPCs; 45 (55.6%) respondents noted that they do not think that their program provided adequate training in supervising NPCs.
Regarding NPCs impact on care, residency program directors who completed the survey were more likely to rank NPCs as having a more significant positive impact on patient care than residents (mean score, 3.43 vs 2.78; P=.043; 95% CI, –1.28 to –0.20)(Table 3).
This study demonstrated a lack of dermatology training related to working with NPCs in a professional setting and highlighted residents’ perception that formal education in working with and supervising NPCs could be of benefit to their education. Furthermore, residency directors perceived NPCs as having a greater positive impact on patient care than residents did, underscoring the importance of the continued need to educate residents on working synergistically with NPCs to optimize patient care. Ultimately, these results suggest a potential area for further development of residency curricula.
There are approximately 360,000 NPCs serving as integral members of interdisciplinary medical teams across the United States.3,4 In a 2014 survey, 46% of 2001 dermatologists noted that they already employed 1 or more NPCs, a number that has increased over time and is likely to continue to do so.5 Although the number of NPCs in dermatology has increased, there remain limited formal training and certificate programs for these providers.1,6
Furthermore, the American Academy of Dermatology recommends that “[w]hen practicing in a dermatological setting, non-dermatologist physicians and non-physician clinicians . . . should be directly supervised by a board-certified dermatologist.”7 Therefore, the responsibility for a dermatology-specific education can fall on the dermatologist, necessitating adequate supervision and training of NPCs.
The findings of this study were limited by a small sample size; response bias because distribution of the survey relied on program directors disseminating the instrument to their residents, thereby limiting generalizability; and a lack of predissemination validation of the survey. Additional research in this area should focus on survey validation and distribution directly to dermatology residents, instead of relying on dermatology program directors to disseminate the survey.
- Sargen MR, Shi L, Hooker RS, et al. Future growth of physicians and non-physician providers within the U.S. Dermatology workforce. Dermatol Online J. 2017;23:13030/qt840223q6
- The current and projected dermatology workforce in the United States. J Am Acad Dermatol. 2016;74(suppl 1):AB122. doi:10.1016/j.jaad.2016.02.478
- Nurse anesthetists, nurse midwives, and nurse practitioners.Occupational Outlook Handbook. Washington, DC: US Department of Labor. Updated April 18, 2022. Accessed July 14, 2022. https://www.bls.gov/ooh/health care/nurse-anesthetists-nurse-midwives-and-nurse-practitioners.htm
- Physician assistants. Occupational Outlook Handbook. Washington, DC: US Department of Labor. Updated April 18, 2022. Accessed July 14, 2022. https://www.bls.gov/ooh/healthcare/physician-assistants.htm
- Ehrlich A, Kostecki J, Olkaba H. Trends in dermatology practices and the implications for the workforce. J Am Acad Dermatol. 2017;77:746-752. doi:10.1016/j.jaad.2017.06.030
- Anderson AM, Matsumoto M, Saul MI, et al. Accuracy of skin cancer diagnosis by physician assistants compared with dermatologists in a large health care system. JAMA Dermatol. 2018;154:569-573. doi:10.1001/jamadermatol.2018.0212s
- American Academy of Dermatology Association. Position statement on the practice of dermatology: protecting and preserving patient safety and quality care. Revised May 21, 2016. Accessed July 14, 2022. https://server.aad.org/Forms/Policies/Uploads/PS/PS-Practice of Dermatology-Protecting Preserving Patient Safety Quality Care.pdf?
Practice Points
- Most dermatology residency programs do not offer training on working with and supervising nonphysician clinicians.
- Dermatology residents think that formal training in supervising nonphysician clinicians would be a beneficial addition to the residency curriculum.
‘Reassuring’ safety data on PPI therapy
In a novel analysis accounting for protopathic bias, proton pump inhibitor (PPI) therapy was not associated with increased risk for death due to digestive disease, cancer, cardiovascular disease (CVD), or any cause, although the jury is out on renal disease.
“There have been several studies suggesting that PPIs can cause long-term health problems and may be associated with increased mortality,” Andrew T. Chan, MD, MPH, gastroenterologist and professor of medicine, Massachusetts General Hospital and Harvard Medical School, both in Boston, told this news organization.
“We conducted this study to examine this issue using data that were better able to account for potential biases in those prior studies. We found that PPIs were generally not associated with an increased risk of mortality,” Dr. Chan said.
The study was published online in Gastroenterology.
‘Reassuring’ data
The findings are based on data collected between 2004 and 2018 from 50,156 women enrolled in the Nurses’ Health Study and 21,731 men enrolled from the Health Professionals Follow-up Study.
During the study period, 10,998 women (21.9%) and 2,945 men (13.6%) initiated PPI therapy, and PPI use increased over the study period from 6.1% to 10.0% in women and from 2.5% to 7.0% in men.
The mean age at baseline was 68.9 years for women and 68.0 years for men. During a median follow-up of 13.8 years, a total of 22,125 participants died – 4,592 of cancer, 5,404 of CVD, and 12,129 of other causes.
Unlike other studies, the researchers used a modified lag-time approach to minimize reverse causation (protopathic bias).
“Using this approach, any increased PPI use during the excluded period, which could be due to comorbid conditions prior to death, will not be considered in the quantification of the exposure, and thus, protopathic bias would be avoided,” they explain.
In the initial analysis that did not take into account lag times, PPI users had significantly higher risks for all-cause mortality and mortality due to cancer, CVD, respiratory diseases, and digestive diseases, compared with nonusers.
However, when applying lag times of up to 6 years, the associations were largely attenuated and no longer statistically significant, which “highlights the importance of carefully controlling for the influence of protopathic bias,” the researchers write.
However, despite applying lag times, PPI users remained at a significantly increased risk for mortality due to renal diseases (hazard ratio, 2.45; 95% confidence interval, 1.59-3.78).
The researchers caution, however, that they did not have reliable data on renal diseases and therefore could not adjust for confounding in the models. They call for further studies examining the risk for mortality due to renal diseases in patients using PPI therapy.
The researchers also looked at duration of PPI use and all-cause and cause-specific mortality.
For all-cause mortality and mortality due to cancer, CVD, respiratory diseases, and digestive diseases, the greatest risks were seen mostly in those who reported PPI use for 1-2 years. Longer duration of PPI use did not confer higher risk for mortality for these endpoints.
In contrast, a potential trend toward greater risk with longer duration of PPI use was observed for mortality due to renal disease. The hazard ratio was 1.68 (95% CI, 1.19-2.38) for 1 to 2 years of use and gradually increased to 2.42 (95% CI, 1.23-4.77) for 7 or more years of use.
Notably, when mortality risks were compared among PPI users and histamine H2 receptor antagonist (H2RA) users without lag time, PPI users were at increased risk for all-cause mortality and mortality due to causes other than cancer and CVD, compared with H2RA users.
But again, the strength of the associations decreased after lag time was introduced.
“This confirmed our main findings and suggested PPIs might be preferred over H2RAs in sicker patients with comorbid conditions,” the researchers write.
‘Generally safe’ when needed
Summing up, Dr. Chan said, “We think our results should be reassuring to clinicians that recommending PPIs to patients with appropriate indications will not increase their risk of death. These are generally safe drugs that when used appropriately can be very beneficial.”
Offering perspective on the study, David Johnson, MD, professor of medicine and chief of gastroenterology at the Eastern Virginia School of Medicine, Norfolk, noted that a “major continuing criticism of the allegations of harm by PPIs has been that these most commonly come from retrospective analyses of databases that were not constructed to evaluate these endpoints of harm.”
“Accordingly, these reports have multiple potentials for stratification bias and typically have low odds ratios for supporting the purported causality,” Dr. Johnson told this news organization.
“This is a well-done study design with a prospective database analysis that uses a modified lag-time approach to minimize reverse causation, that is, protopathic bias, which can occur when a pharmaceutical agent is inadvertently prescribed for an early manifestation of a disease that has not yet been diagnostically detected,” Dr. Johnson explained.
Echoing Dr. Chan, Dr. Johnson said the finding that PPI use was not associated with higher risk for all-cause mortality and mortality due to major causes is “reassuring.”
“Recognizably, too many people are taking PPIs chronically when they are not needed. If needed and appropriate, these data on continued use are reassuring,” Dr. Johnson added.
This work was supported by the National Institutes of Health and the Crohn’s and Colitis Foundation. Dr. Chan has consulted for OM1, Bayer Pharma AG, and Pfizer for topics unrelated to this study, as well as Boehringer Ingelheim for litigation related to ranitidine and cancer. Dr. Johnson reports no relevant financial relationships.
A version of this article first appeared on Medscape.com.
FROM GASTROENTEROLOGY

Biologics for IBD may come with added risks in Hispanic patients
Biologic agents may not be as safe or effective in Hispanic patients with inflammatory bowel disease (IBD) as they are in non-Hispanic patients, suggest new data published online in Clinical Gastroenterology and Hepatology.
To compare risk for hospitalization, surgery, and serious infections, Nghia H. Nguyen, MD, and his team at the Inflammatory Bowel Disease Center at the University of California, San Diego, included a multicenter, electronic health record–based cohort of biologic-treated Hispanic and non-Hispanic patients with IBD and used 1:4 propensity score matching.
They compared 240 Hispanic patients (53% male; 45% with ulcerative colitis; 73% treated with tumor necrosis factor alpha [TNF-alpha] antagonist; 20% with prior biologic exposure) with 960 non-Hispanic patients (51% male; 44% with ulcerative colitis; 67% treated with TNF-alpha antagonist; 27% with prior biologic exposure). Patients were new users of biologics (TNF-alpha antagonist, ustekinumab, or vedolizumab).
Compared with non-Hispanic patients, Hispanic patients had a higher risk for all-cause hospitalization (31% vs. 23%) within 1 year of starting a biologic agent.
Hispanic patients also had almost twice the risk for IBD-related surgeries (7% vs. 4.6%, respectively) and trended toward a higher risk for serious infection (8.8% vs. 4.9%, respectively).
The findings are particularly important because incidence and prevalence of IBD in Hispanic adults are increasing rapidly, according to the authors.
“Currently, 1.2% of Hispanic adults in the United States report having IBD, and this number is expected to increase progressively over the next few years with global immigration patterns and changing demographics of the United States,” the authors write.
Potential drivers of disparities
Hispanic patients have been underrepresented in clinical trials of biologic agents in IBD, making up fewer than 5% of participants, the authors note. This has resulted in limited data and created challenges in discerning reasons for the disparity.
The authors note the potential role of genetics in the effectiveness of some biologic agents, although that has not been well studied in Hispanic patients.
Additionally, according to this study, Hispanic patients with IBD lived with more negative social determinants of health, particularly related to food insecurity (27%) and lack of adequate social support (83%), compared with non-Hispanic patients (unpublished data).
“In other studies on health care utilization, Hispanic patients were found to have limited access to appropriate specialist care and lack of insurance coverage,” the authors point out.
The authors acknowledge that limitations of their study include the inability to pinpoint the primary reason for hospitalization because data on primary versus secondary discharge diagnoses were not available. Also, they relied on prescription information in electronic health records and could not confirm that medications were dispensed or that patients took them.
They also acknowledged selection bias as a limitation, because the focus was only on patients treated with biologics and not on outcomes for those who may have warranted a biologic treatment but were unable to receive it.
“Future studies are needed to investigate the biological, social, and environmental drivers of these differences,” the authors write.
The authors’ complete financial disclosures are available with the full text of the paper.
A version of this article first appeared on Medscape.com.
FROM CLINICAL GASTROENTEROLOGY AND HEPATOLOGY
Smartphone tool helps gauge bowel prep quality before colonoscopy
An artificial intelligence (AI) tool that runs on a smartphone can help patients scheduled for a colonoscopy evaluate independently how well they do with bowel cleansing and may be an alternative approach for evaluating bowel preparation quality before the colonoscopy, especially in the COVID-19 era.
The AI tool is a “manpower-saving” option that reduces the need for nurses to evaluate the quality of bowel preparation, say Wei Gong, MD, Southern Medical University, Shenzhen, China, and colleagues.
Having the tool on a patient’s smartphone means caregivers and nurses would not be required to assess the adequacy of bowel cleansing for patients, which, in turn, would reduce person-to-person contact and the spread of infectious diseases, they add.
The study was published online in the American Journal of Gastroenterology.
Better than do-it-yourself evaluation?
The study was conducted at two hospitals in China among consecutive patients prepping for colonoscopy. All participants received standard bowel preparation instructions and were given a leaflet with general guidelines on bowel preparation.
The leaflet included photos representing bowel preparation quality and informed patients that their stool should eventually be a yellowish clear liquid; if any cloudiness (including turbid liquid, particles, or small amounts of feces) is observed in the liquid stool, the bowel preparation is not complete.
All patients were prescribed standard polyethylene glycol electrolyte solution for bowel cleansing 4-6 hours before the colonoscopy.
After consuming the solution, all patients scanned a QR (quick response) code with a smartphone for randomization into an experimental group using the AI-convolutional neural network (AI-CNN) model or a control group using self-evaluation.
The system gave instructions for using the application, taking photos of their feces, and uploading the images.
After uploading the images, the 730 patients in the AI-CNN group automatically received a “pass” or “not pass” alert, which indicated whether their bowel preparation was adequate or not.
The 704 patients in the control group evaluated the adequacy of bowel preparation on their own according to the leaflet instructions after uploading their images.
Colonoscopists and nurses were blinded to the bowel evaluation method that each patient used.
According to the investigators, evaluation results (“pass” or “not pass”) in terms of adequacy of bowel preparation as represented by Boston Bowel Preparation Scale (BBPS) scores were consistent between the two methods (AI-CNN or self-evaluation).
Overall, there were no significant differences in the two methods in terms of mean BBPS scores, polyp detection rate, or adenoma detection rate.
In subgroup analysis, however, the mean BBPS score of patients with “pass” results was significantly higher in the AI-CNN group than in the self-evaluation control group.
This suggests that the AI-CNN model may further improve the quality of bowel preparation in patients exhibiting adequate bowel preparation, the researchers say.
The results also suggest improved bowel preparation quality of the right colon under the aid of the AI-CNN model, which may be crucial for the prevention of interval colorectal cancer.
The study did not investigate the user acceptability of the AI-CNN model.
“To improve the model and broaden its application in routine practice, evaluating its convenience, accessibility, aspects that cause users difficulty, and user satisfaction is crucial,” the study team concludes.
The study was supported by the Xiamen Medical Health Science and Technology Project and the Xiamen Chang Gung Hospital Science Project. The authors have declared no relevant financial relationships.
A version of this article first appeared on Medscape.com.
FROM THE AMERICAN JOURNAL OF GASTROENTEROLOGY
Metabolic syndrome raises dementia risk in under-60s
The more components of metabolic syndrome a person has in midlife seems to raise their risk of dementia, although that relationship seems to go away after age 70, a post hoc analysis of data from a major European cohort study has found.
A team of European researchers reported online in the journal Diabetes Care that the follow-up of the Whitehall II cohort study, a study of more than 10,000 civil servants in London that was established in the late 1980s, also found that cardiovascular disease (CVD) may only partially contribute to the risk of dementia in study participants.
They found that each additional metabolic syndrome component before age 60 years was linked to a 13% rise in the risk of dementia (hazard ratio, 1.13; 95% confidence interval [CI], 1.05-1.23) and, from age 60 to 70, the risk rose 8% (HR, 1.08; 95% CI, 1.00-1.16). However, in people aged 70 years and older, the relationship wasn’t statistically significant (HR, 1.04; 95% CI, 0.96-1.13]).
The study used “the latest harmonized definition” of metabolic syndrome; that is, participants were classified as having metabolic syndrome if they had three or more of the five components. As lead author Marcos D. Machado-Fragua, PhD, noted in an email interview, those components are abdominal obesity, high triglycerides, low HDL cholesterol levels, high blood pressure, and high fasting glucose.

“Our research question was on the association between metabolic syndrome and late-life dementia. We found that the presence of one metabolic syndrome component and the presence of metabolic risk before age 60, but not after, is associated with higher risk of dementia,” said Dr. Machado-Fragua, a post-doctoral researcher at the French Institute for Health and Medical Research in Paris.
The study cohort consisted of 10,308 London-based civil servants aged 35-55 years. Every 4-5 years after enrollment, from 1991 through 2016, they completed a questionnaire and had a clinical examination. The U.K. National Health Service electronic health record system tracked outcomes for all but 10 participants through March 2019.
The study identified the individual metabolic syndrome components that posed the highest risk for dementia in these three age groups:
- Age < 60 years: elevated waist circumference (HR 1.39 [95% CI 1.07, 1.81]), low HDL-C, (HR 1.30 [95% CI 1.02, 1.66]), and elevated blood pressure (HR 1.34 [95% CI 1.09, 1.63]).
- Age 60-70 years: low HDL-C (HR 1.26 [95% CI 1.02, 1.57]) and elevated fasting glucose (HR 1.40 [95% CI 1.12, 1.74]).
- Age >70 years: elevated fasting glucose (HR 1.38 [95% CI 1.07, 1.79]).
The study found that the dementia risk was significantly high in study participants under age 60 who had at least one (HR 1.99 [95% CI 1.08, 3.66]) or two (HR 1.69 [95% CI 1.12, 2.56]) metabolic syndrome components even when they didn’t have CVD.
“The present study adds to the understanding of the association between metabolic syndrome and dementia due to three novel features,” Dr. Machado-Fragua said. “First, we tested alternative thresholds to define ‘high metabolic risk,’ and findings show increased risk of dementia to start with the presence of one metabolic syndrome component. Second, assessment of metabolic syndrome components in midlife and later life allowed the examination of the role of age at prevalence of metabolic risk for incident dementia at older ages. Third, our findings showed high dementia risk in those free of cardiovascular disease during follow-up, suggesting that the association between high metabolic risk and incident dementia is not fully explained by cardiovascular disease.”
Dr. Machado-Fragua added, “For now, a cure for dementia remains elusive, making it important to think of prevention strategies. Our findings support targeting the components of the metabolic syndrome in midlife, even in those who have fewer than three of the metabolic syndrome components.”
Applicability ‘confusing’
In an interview, Yehuda Handelsman, MD, questioned the applicability of the study findings in the clinic. “Metabolic syndrome is a clinical manifestation of insulin resistance,” he said. “The more metabolic syndrome criteria a person has, the more insulin resistant that person will be. There is literature that is [suggesting] that insulin resistance is an important cause of dementia.”

The finding of a higher dementia risk before age 70, compared to afterward, makes the applicability “even more confusing,” he said. The results are even more muddled for U.S. physicians, who have moved away from the term metabolic syndrome in favor of cardiometabolic syndrome, said Dr. Handelsman, medical director and principal investigator at the Metabolic Institute of America and president of the Diabetes CardioRenal & Metabolism Institute, both in Tarzana, Calif.
Confusion also surrounds one of the components of metabolic syndrome: Waist circumference, per the harmonized definition the study used, and body mass index, which the more traditional definition uses.
Nonetheless, metabolic syndrome can be used as “kind of a risk calculator” for CVD, diabetes, and dementia, he said. One strength of the study, Dr. Handelsman said, is its size and scope, following 28 years of data. But a weakness was its observational design. “It doesn’t evaluate any true intervention to modify risk,” he said.
Dr. Machado-Fragua and coauthors have no disclosures.
The more components of metabolic syndrome a person has in midlife seems to raise their risk of dementia, although that relationship seems to go away after age 70, a post hoc analysis of data from a major European cohort study has found.
A team of European researchers reported online in the journal Diabetes Care that the follow-up of the Whitehall II cohort study, a study of more than 10,000 civil servants in London that was established in the late 1980s, also found that cardiovascular disease (CVD) may only partially contribute to the risk of dementia in study participants.
They found that each additional metabolic syndrome component before age 60 years was linked to a 13% rise in the risk of dementia (hazard ratio, 1.13; 95% confidence interval [CI], 1.05-1.23) and, from age 60 to 70, the risk rose 8% (HR, 1.08; 95% CI, 1.00-1.16). However, in people aged 70 years and older, the relationship wasn’t statistically significant (HR, 1.04; 95% CI, 0.96-1.13]).
The study used “the latest harmonized definition” of metabolic syndrome; that is, participants were classified as having metabolic syndrome if they had three or more of the five components. As lead author Marcos D. Machado-Fragua, PhD, noted in an email interview, those components are abdominal obesity, high triglycerides, low HDL cholesterol levels, high blood pressure, and high fasting glucose.
“Our research question was on the association between metabolic syndrome and late-life dementia. We found that the presence of one metabolic syndrome component and the presence of metabolic risk before age 60, but not after, is associated with higher risk of dementia,” said Dr. Machado-Fragua, a post-doctoral researcher at the French Institute for Health and Medical Research in Paris.
The study cohort consisted of 10,308 London-based civil servants aged 35-55 years. Every 4-5 years after enrollment, from 1991 through 2016, they completed a questionnaire and had a clinical examination. The U.K. National Health Service electronic health record system tracked outcomes for all but 10 participants through March 2019.
The study identified the individual metabolic syndrome components that posed the highest risk for dementia in these three age groups:
- Age < 60 years: elevated waist circumference (HR 1.39 [95% CI 1.07, 1.81]), low HDL-C, (HR 1.30 [95% CI 1.02, 1.66]), and elevated blood pressure (HR 1.34 [95% CI 1.09, 1.63]).
- Age 60-70 years: low HDL-C (HR 1.26 [95% CI 1.02, 1.57]) and elevated fasting glucose (HR 1.40 [95% CI 1.12, 1.74]).
- Age >70 years: elevated fasting glucose (HR 1.38 [95% CI 1.07, 1.79]).
The study found that the dementia risk was significantly high in study participants under age 60 who had at least one (HR 1.99 [95% CI 1.08, 3.66]) or two (HR 1.69 [95% CI 1.12, 2.56]) metabolic syndrome components even when they didn’t have CVD.
“The present study adds to the understanding of the association between metabolic syndrome and dementia due to three novel features,” Dr. Machado-Fragua said. “First, we tested alternative thresholds to define ‘high metabolic risk,’ and findings show increased risk of dementia to start with the presence of one metabolic syndrome component. Second, assessment of metabolic syndrome components in midlife and later life allowed the examination of the role of age at prevalence of metabolic risk for incident dementia at older ages. Third, our findings showed high dementia risk in those free of cardiovascular disease during follow-up, suggesting that the association between high metabolic risk and incident dementia is not fully explained by cardiovascular disease.”
Dr. Machado-Fragua added, “For now, a cure for dementia remains elusive, making it important to think of prevention strategies. Our findings support targeting the components of the metabolic syndrome in midlife, even in those who have fewer than three of the metabolic syndrome components.”
Applicability ‘confusing’
In an interview, Yehuda Handelsman, MD, questioned the applicability of the study findings in the clinic. “Metabolic syndrome is a clinical manifestation of insulin resistance,” he said. “The more metabolic syndrome criteria a person has, the more insulin resistant that person will be. There is literature that is [suggesting] that insulin resistance is an important cause of dementia.”
The finding of a higher dementia risk before age 70, compared to afterward, makes the applicability “even more confusing,” he said. The results are even more muddled for U.S. physicians, who have moved away from the term metabolic syndrome in favor of cardiometabolic syndrome, said Dr. Handelsman, medical director and principal investigator at the Metabolic Institute of America and president of the Diabetes CardioRenal & Metabolism Institute, both in Tarzana, Calif.
Confusion also surrounds one of the components of metabolic syndrome: Waist circumference, per the harmonized definition the study used, and body mass index, which the more traditional definition uses.
Nonetheless, metabolic syndrome can be used as “kind of a risk calculator” for CVD, diabetes, and dementia, he said. One strength of the study, Dr. Handelsman said, is its size and scope, following 28 years of data. But a weakness was its observational design. “It doesn’t evaluate any true intervention to modify risk,” he said.
Dr. Machado-Fragua and coauthors have no disclosures.
FROM DIABETES CARE
New update focuses on NAFLD in lean people
Ongoing follow-up and lifestyle interventions are needed in lean patients with nonalcoholic fatty liver disease (NAFLD), suggests a panel of experts in a recent review.
They also urge screening for NAFLD in individuals who are older than 40 years with type 2 diabetes, even if they are not overweight.
NAFLD is a leading cause of chronic liver disease that affects more than 25% of the United States and worldwide populations, note lead author Michelle T. Long, MD, Boston Medical Center, Boston University, and colleagues.

They add that around one-quarter of those affected have nonalcoholic steatohepatitis, which is associated with significant morbidity and mortality due to complications of liver cirrhosis, hepatic decompensation, and hepatocellular carcinoma.
Although NAFLD occurs primarily in individuals with obesity or type 2 diabetes, between 7%-20% have a lean body habitus, they write.
There are differences in rates of disease progression, associated conditions, and diagnostic and management approaches between lean and non-lean patients, the authors note, but there is limited guidance on the appropriate clinical evaluation of the former group.
The American Gastroenterological Association therefore commissioned an expert review to provide best practice advice on key clinical issues relating to the diagnosis, risk stratification, and treatment of NAFLD in lean individuals.
Their review was published online in Gastroenterology.
Evidence-based approaches
The 15 best practice advice statements covered a wide range of clinical areas, first defining lean as a body mass index (BMI) less than 25 in non-Asian persons and less than 23 in Asian persons.
The authors go on to stipulate, for example, that lean individuals in the general population should not be screened for NAFLD but that screening should be considered for individuals older than 40 years with type 2 diabetes.
More broadly, they write that the condition should be considered in lean individuals with metabolic diseases, such as type 2 diabetes, dyslipidemia, and hypertension, as well as elevated values on liver biochemical tests or incidentally noted hepatic steatosis.
After other causes of liver diseases are ruled out, the authors note that clinicians should consider liver biopsy as the reference test if uncertainties remain about liver injury causes and/or liver fibrosis staging.
They also write that the NAFLD fibrosis score and Fibrosis-4 score, along with imaging techniques, may be used as alternatives to biopsy for staging and during follow-up.
The authors, who provide a diagnosis and management algorithm to aid clinicians, suggest that lean patients with NAFLD follow lifestyle interventions, such as exercise, diet modification, and avoidance of fructose- and sugar-sweetened drinks, to achieve weight loss of 3%-5%.
Vitamin E may be considered, they continue, in patients with biopsy-confirmed nonalcoholic steatohepatitis but without type 2 diabetes or cirrhosis. Additionally, oral pioglitazone may be considered in lean persons with biopsy-confirmed nonalcoholic steatohepatitis without cirrhosis.
In contrast, they write that the role of glucagonlike peptide 1 agonists and sodium-glucose cotransporter 2 inhibitors requires further investigation.
The advice also says that lean patients with NAFLD should be routinely evaluated for comorbid conditions, such as type 2 diabetes, dyslipidemia, and hypertension, and risk-stratified for hepatic fibrosis to identify those with advanced fibrosis or cirrhosis.
For lean patients with NAFLD and clinical markers compatible with liver cirrhosis, twice-yearly surveillance for hepatocellular carcinoma is also advised.
Fatty liver disease in lean people with metabolic conditions
Approached for comment, Liyun Yuan, MD, PhD, assistant professor of clinical medicine, University of Southern California, Los Angeles, said it is very important to have uniform guidelines for general practitioners and other specialties on NAFLD in lean individuals.
Dr. Yuan, who was not involved in the review, told this news organization that it is crucial to raise awareness of NAFLD, just like awareness of breast cancer screening among women of a certain age was increased, so that individuals are screened for metabolic conditions regardless of whether they have obesity or overweight.
Zobair Younossi, MD, MPH, professor of medicine, Virginia Commonwealth University, Inova Campus, Falls Church, Va., added that there is a lack of awareness that NAFLD occurs in lean individuals, especially in those who have diabetes.
He said in an interview that although it is accurate to define individuals as being lean in terms of their BMI, the best way is to look not only at BMI but also at waist circumference.
Dr. Younossi said that he and his colleagues have shown that when BMI is combined with waist circumference, the prediction of mortality risk in NAFLD is affected, such that lean individuals with an obese waist circumference have a higher risk for all-cause mortality.
Dr. Long is supported in part by the National Institute of Diabetes and Digestive and Kidney Diseases, Doris Duke Charitable Foundation, Gilead Sciences Research Scholars Award, Boston University School of Medicine Department of Medicine Career Investment Award, and Boston University Clinical Translational Science Institute. Dr. Long declares relationships with Novo Nordisk, Echosens Corporation, and Gilead Sciences. Dr. Yuan declares relationships with Genfit, Intercept, and Gilead Sciences. Dr. Younossi declares no relevant relationships.
A version of this article first appeared on Medscape.com.
*This article was updated on July 27, 2022.
Ongoing follow-up and lifestyle interventions are needed in lean patients with nonalcoholic fatty liver disease (NAFLD), suggests a panel of experts in a recent review.
They also urge screening for NAFLD in individuals who are older than 40 years with type 2 diabetes, even if they are not overweight.
NAFLD is a leading cause of chronic liver disease that affects more than 25% of the United States and worldwide populations, note lead author Michelle T. Long, MD, Boston Medical Center, Boston University, and colleagues.
They add that around one-quarter of those affected have nonalcoholic steatohepatitis, which is associated with significant morbidity and mortality due to complications of liver cirrhosis, hepatic decompensation, and hepatocellular carcinoma.
Although NAFLD occurs primarily in individuals with obesity or type 2 diabetes, between 7%-20% have a lean body habitus, they write.
There are differences in rates of disease progression, associated conditions, and diagnostic and management approaches between lean and non-lean patients, the authors note, but there is limited guidance on the appropriate clinical evaluation of the former group.
The American Gastroenterological Association therefore commissioned an expert review to provide best practice advice on key clinical issues relating to the diagnosis, risk stratification, and treatment of NAFLD in lean individuals.
Their review was published online in Gastroenterology.
Evidence-based approaches
The 15 best practice advice statements covered a wide range of clinical areas, first defining lean as a body mass index (BMI) less than 25 in non-Asian persons and less than 23 in Asian persons.
The authors go on to stipulate, for example, that lean individuals in the general population should not be screened for NAFLD but that screening should be considered for individuals older than 40 years with type 2 diabetes.
More broadly, they write that the condition should be considered in lean individuals with metabolic diseases, such as type 2 diabetes, dyslipidemia, and hypertension, as well as elevated values on liver biochemical tests or incidentally noted hepatic steatosis.
After other causes of liver diseases are ruled out, the authors note that clinicians should consider liver biopsy as the reference test if uncertainties remain about liver injury causes and/or liver fibrosis staging.
They also write that the NAFLD fibrosis score and Fibrosis-4 score, along with imaging techniques, may be used as alternatives to biopsy for staging and during follow-up.
The authors, who provide a diagnosis and management algorithm to aid clinicians, suggest that lean patients with NAFLD follow lifestyle interventions, such as exercise, diet modification, and avoidance of fructose- and sugar-sweetened drinks, to achieve weight loss of 3%-5%.
Vitamin E may be considered, they continue, in patients with biopsy-confirmed nonalcoholic steatohepatitis but without type 2 diabetes or cirrhosis. Additionally, oral pioglitazone may be considered in lean persons with biopsy-confirmed nonalcoholic steatohepatitis without cirrhosis.
In contrast, they write that the role of glucagonlike peptide 1 agonists and sodium-glucose cotransporter 2 inhibitors requires further investigation.
The advice also says that lean patients with NAFLD should be routinely evaluated for comorbid conditions, such as type 2 diabetes, dyslipidemia, and hypertension, and risk-stratified for hepatic fibrosis to identify those with advanced fibrosis or cirrhosis.
For lean patients with NAFLD and clinical markers compatible with liver cirrhosis, twice-yearly surveillance for hepatocellular carcinoma is also advised.
Fatty liver disease in lean people with metabolic conditions
Approached for comment, Liyun Yuan, MD, PhD, assistant professor of clinical medicine, University of Southern California, Los Angeles, said it is very important to have uniform guidelines for general practitioners and other specialties on NAFLD in lean individuals.
Dr. Yuan, who was not involved in the review, told this news organization that it is crucial to raise awareness of NAFLD, just like awareness of breast cancer screening among women of a certain age was increased, so that individuals are screened for metabolic conditions regardless of whether they have obesity or overweight.
Zobair Younossi, MD, MPH, professor of medicine, Virginia Commonwealth University, Inova Campus, Falls Church, Va., added that there is a lack of awareness that NAFLD occurs in lean individuals, especially in those who have diabetes.
He said in an interview that although it is accurate to define individuals as being lean in terms of their BMI, the best way is to look not only at BMI but also at waist circumference.
Dr. Younossi said that he and his colleagues have shown that when BMI is combined with waist circumference, the prediction of mortality risk in NAFLD is affected, such that lean individuals with an obese waist circumference have a higher risk for all-cause mortality.
Dr. Long is supported in part by the National Institute of Diabetes and Digestive and Kidney Diseases, Doris Duke Charitable Foundation, Gilead Sciences Research Scholars Award, Boston University School of Medicine Department of Medicine Career Investment Award, and Boston University Clinical Translational Science Institute. Dr. Long declares relationships with Novo Nordisk, Echosens Corporation, and Gilead Sciences. Dr. Yuan declares relationships with Genfit, Intercept, and Gilead Sciences. Dr. Younossi declares no relevant relationships.
A version of this article first appeared on Medscape.com.
*This article was updated on July 27, 2022.
FROM GASTROENTEROLOGY
Mental health assessment for gender-diverse patients
Over the past several years, the number of patients seeking gender-affirming services has exponentially increased.1 Unfortunately, the number of patients presenting for treatment has exceeded evidence-based guidelines, research, and the number of providers familiar with gender-affirming care. Many institutions and associations such as the American College of Obstetricians and Gynecologists and the World Professional Association for Transgender Health (WPATH) advocate for training of providers; however, many patients will be seen by providers who are not qualified in diagnosing gender dysphoria. As a result, many practitioners rely on the mental health evaluation of gender-diverse individuals prior to prescribing hormonal therapy or before planning surgery.
Practitioners qualified to provide mental health services can include persons within in the field of psychology, psychiatry, social work, licensed professional counseling, nursing, or family medicine (with specific training in mental health).2 WPATH also defines specific criteria as part of the mental health assessment. For example, providers should have a master’s degree or higher in clinical behavioral science, competence in using the DSM/ICD, the ability to recognize and diagnose coexisting mental health concerns, and undergo continuing education in the treatment of gender dysphoria.2 Unfortunately, the demand for gender-competent mental health professionals exceeds the number available, and many patients are seen by therapists lacking experience within this field.3 This discrepancy can present an additional barrier to the health needs of transgender patients and sometimes inhibit access to hormone therapy, or even more catastrophically, compromise their presurgical assessment and surgical outcome.

For patients seeking chest surgery (mastectomy or breast augmentation), one letter from a mental health provider is necessary. If a patient is interested in pursuing genital surgery or the removal or reproductive organs, two letters from two separate mental health providers are required. Typically, one letter is from the patient’s primary therapist, and the other is often a second opinion. These letters must include a patient’s general characteristics, psychosocial assessment results, duration of the mental health professional’s relationship with the client, an explanation that the criteria for surgery have been met, a statement supporting the patient’s request for surgery and that informed consent was obtained, and a statement that the mental health professional is available for coordination of care.2 It is crucial to delineate that while a mental health evaluation is mandated, psychotherapy is not.
A therapist’s letter is not essential prior to initiating hormones; however, it is recommended if practitioners are unfamiliar with gender-diverse patients and current standards of care. If a provider such as a family physician, endocrinologist, or obstetrician/gynecologist is knowledgeable about the diagnostic criteria for gender dysphoria, they can prescribe hormones without a therapist’s letter. Additional considerations include establishing whether a patient has persistent gender dysphoria, has the capacity to give informed consent, and has “reasonably well-controlled” mental illness.3 The prevalence of both depression and anxiety is exceptionally high in this population, whereas rates of bipolar disorder and schizophrenia mirror that of the general population.3 Mental illness is not a contraindication to hormone therapy because there is sufficient evidence to support the benefits of gender-affirming hormones in reducing both anxiety and depression.
In contrast, concurrent severe psychiatric illness (i.e., bipolar disorder, schizophrenia, borderline personality disorder) that is not well controlled could prohibit patients from undergoing gender-affirming surgeries. Even the most well-educated patients do not truly understand the process of surgery and the rigorous postoperative care required, particularly after genital surgery. Many patients underestimate the need for a support system in the postoperative period and cannot predict their emotional response after undergoing such complex procedures. During a surgical consultation, the surgeon can help identify any mental, physical, monetary, or social constraints patients may have and work closely with other providers, including a well-trained mental health professional, to optimize a patient’s surgical recovery. Ideally, patients undergoing surgery are seen at multidisciplinary centers with the capabilities of addressing these concerns.
The patient’s perspective on the need for a therapist is often mixed. Historically, therapist letters have been viewed by patients as a form of “gatekeeping” and an additional barrier they are forced to overcome to receive treatment. However, the role of a mental health provider who specializes in gender-affirming care cannot be overstated. In the context of surgery, I often try to reframe the role the therapist as an integral part of the multidisciplinary team. Mental health assessments preoperatively can better prepare patients for their upcoming surgery. More importantly, this multidisciplinary approach can help identify potential issues with coping strategies or exacerbations of other mental health conditions that may arise in the immediate postoperative period.
There is no question that exceptional gender-affirming care requires a multidisciplinary approach. Establishing strong relationships between hormone prescribers, surgeons, and behavioral health specialists in an essential step toward providing competent patient-centered care.
Dr. Brandt is an ob.gyn. and fellowship-trained gender-affirming surgeon in West Reading, Pa.
References
1. Ettner R. Mental health evaluation for gender confirmation surgery. Clin Plastic Surg. 2018;45(3):307-11.
2. Karasic D. Mental health care for the adult transgender patient. In: Ferrando CA, ed. Comprehensive Care of the Transgender Patient. Philadelphia: Elsevier; 2020:8-11.
3. World Professional Association for Transgender Health. Standards of care for the health of transsexual, transgender, and gender nonconforming people. 7th ed. Minneapolis: WPATH; 2012.
Over the past several years, the number of patients seeking gender-affirming services has exponentially increased.1 Unfortunately, the number of patients presenting for treatment has exceeded evidence-based guidelines, research, and the number of providers familiar with gender-affirming care. Many institutions and associations such as the American College of Obstetricians and Gynecologists and the World Professional Association for Transgender Health (WPATH) advocate for training of providers; however, many patients will be seen by providers who are not qualified in diagnosing gender dysphoria. As a result, many practitioners rely on the mental health evaluation of gender-diverse individuals prior to prescribing hormonal therapy or before planning surgery.
Practitioners qualified to provide mental health services can include persons within in the field of psychology, psychiatry, social work, licensed professional counseling, nursing, or family medicine (with specific training in mental health).2 WPATH also defines specific criteria as part of the mental health assessment. For example, providers should have a master’s degree or higher in clinical behavioral science, competence in using the DSM/ICD, the ability to recognize and diagnose coexisting mental health concerns, and undergo continuing education in the treatment of gender dysphoria.2 Unfortunately, the demand for gender-competent mental health professionals exceeds the number available, and many patients are seen by therapists lacking experience within this field.3 This discrepancy can present an additional barrier to the health needs of transgender patients and sometimes inhibit access to hormone therapy, or even more catastrophically, compromise their presurgical assessment and surgical outcome.
For patients seeking chest surgery (mastectomy or breast augmentation), one letter from a mental health provider is necessary. If a patient is interested in pursuing genital surgery or the removal or reproductive organs, two letters from two separate mental health providers are required. Typically, one letter is from the patient’s primary therapist, and the other is often a second opinion. These letters must include a patient’s general characteristics, psychosocial assessment results, duration of the mental health professional’s relationship with the client, an explanation that the criteria for surgery have been met, a statement supporting the patient’s request for surgery and that informed consent was obtained, and a statement that the mental health professional is available for coordination of care.2 It is crucial to delineate that while a mental health evaluation is mandated, psychotherapy is not.
A therapist’s letter is not essential prior to initiating hormones; however, it is recommended if practitioners are unfamiliar with gender-diverse patients and current standards of care. If a provider such as a family physician, endocrinologist, or obstetrician/gynecologist is knowledgeable about the diagnostic criteria for gender dysphoria, they can prescribe hormones without a therapist’s letter. Additional considerations include establishing whether a patient has persistent gender dysphoria, has the capacity to give informed consent, and has “reasonably well-controlled” mental illness.3 The prevalence of both depression and anxiety is exceptionally high in this population, whereas rates of bipolar disorder and schizophrenia mirror that of the general population.3 Mental illness is not a contraindication to hormone therapy because there is sufficient evidence to support the benefits of gender-affirming hormones in reducing both anxiety and depression.
In contrast, concurrent severe psychiatric illness (i.e., bipolar disorder, schizophrenia, borderline personality disorder) that is not well controlled could prohibit patients from undergoing gender-affirming surgeries. Even the most well-educated patients do not truly understand the process of surgery and the rigorous postoperative care required, particularly after genital surgery. Many patients underestimate the need for a support system in the postoperative period and cannot predict their emotional response after undergoing such complex procedures. During a surgical consultation, the surgeon can help identify any mental, physical, monetary, or social constraints patients may have and work closely with other providers, including a well-trained mental health professional, to optimize a patient’s surgical recovery. Ideally, patients undergoing surgery are seen at multidisciplinary centers with the capabilities of addressing these concerns.
The patient’s perspective on the need for a therapist is often mixed. Historically, therapist letters have been viewed by patients as a form of “gatekeeping” and an additional barrier they are forced to overcome to receive treatment. However, the role of a mental health provider who specializes in gender-affirming care cannot be overstated. In the context of surgery, I often try to reframe the role the therapist as an integral part of the multidisciplinary team. Mental health assessments preoperatively can better prepare patients for their upcoming surgery. More importantly, this multidisciplinary approach can help identify potential issues with coping strategies or exacerbations of other mental health conditions that may arise in the immediate postoperative period.
There is no question that exceptional gender-affirming care requires a multidisciplinary approach. Establishing strong relationships between hormone prescribers, surgeons, and behavioral health specialists in an essential step toward providing competent patient-centered care.
Dr. Brandt is an ob.gyn. and fellowship-trained gender-affirming surgeon in West Reading, Pa.
References
1. Ettner R. Mental health evaluation for gender confirmation surgery. Clin Plastic Surg. 2018;45(3):307-11.
2. Karasic D. Mental health care for the adult transgender patient. In: Ferrando CA, ed. Comprehensive Care of the Transgender Patient. Philadelphia: Elsevier; 2020:8-11.
3. World Professional Association for Transgender Health. Standards of care for the health of transsexual, transgender, and gender nonconforming people. 7th ed. Minneapolis: WPATH; 2012.
‘Alarming’ global rise in NAFLD
The global prevalence of fatty liver disease not caused by alcohol is considerably higher than previously estimated and is continuing to increase at an alarming rate, report researchers from Canada.
Their analysis suggests nearly one-third of the global general adult population has nonalcoholic fatty liver disease (NAFLD), with men much more likely to have the disease than women.
“Greater awareness of NAFLD and the development of cost-effective risk stratification strategies are needed to address the growing burden NAFLD,” wrote Abdel-Aziz Shaheen, MBBCh, MSc, and colleagues with the University of Calgary (Alta.).
The study was published online in Lancet Gastroenterology and Hepatology.
NAFLD is the most common liver disease worldwide and a leading cause of liver-related illness and death. Yet, high-quality reports on the epidemiology of NAFLD at a global level are scarce and temporal trends of the NAFLD burden, including by gender, have not been described, until now.
Using MEDLINE, EMBASE, Scopus, and Web of Science, the Calgary team identified reports on NAFLD incidence and prevalence in study populations representative of the general adult population published between the date of database inception to May 25, 2021.
In total, 72 publications, with a sample population of more than 1 million adults from 17 countries, were included in the prevalence analysis, and 16 publications, with a sample population of nearly 382,000 individuals from five countries, were included in the incidence analysis.
By their estimates, the overall global prevalence of NAFLD is 32.4%, with prevalence increasing steadily and significantly over time, from 25.5% in or before 2005 to 37.8% in 2016 or later. The overall prevalence is significantly higher in men than in women (39.7% vs. 25.6%).
These figures contrast with recent meta-analyses and systematic reviews that put the global prevalence of NAFLD at between 25.2% and 29.8%. However, these studies had “considerable” limitations with “potentially biased inferences,” Dr. Shaheen and colleagues noted.
By region, their data put the prevalence of NAFLD at 31.6% in Asia, 32.6% in Europe, 47.8% in North America, and 56.8% in Africa.
Dr. Shaheen and colleagues estimate the overall incidence of NAFLD to be 46.9 cases per 1,000 person-years, with a higher incidence in men than women (70.8 vs. 29.6 cases per 1000 person-years), in line with the gender differences in prevalence.
They caution that there was “considerable” heterogeneity between studies in both NAFLD prevalence and incidence (I2 = 99.9%) and few “high-quality” studies.
Despite these limitations, Dr. Shaheen and colleagues said the rise in NAFLD prevalence “should drive enhanced awareness of NAFLD at the level of primary care physicians, public health specialists, and health policy makers to encourage the development of more effective preventive policies.”
Funding for the study was provided by the Canadian Institutes of Health. Dr. Shaheen has received research grants from Gilead and Intercept, and honoraria from SCOPE Canada.
A version of this article first appeared on Medscape.com.
FROM LANCET GASTROENTEROLOGY AND HEPATOLOGY
Children and COVID: Many parents see vaccine as the greater risk
New COVID-19 cases rose for the second week in a row as cumulative cases among U.S. children passed the 14-million mark, but a recent survey shows that more than half of parents believe that the vaccine is a greater risk to children under age 5 years than the virus.
In a Kaiser Family Foundation survey conducted July 7-17, 53% of parents with children aged 6 months to 5 years said that the vaccine is “a bigger risk to their child’s health than getting infected with COVID-19, compared to 44% who say getting infected is the bigger risk,” KFF reported July 26.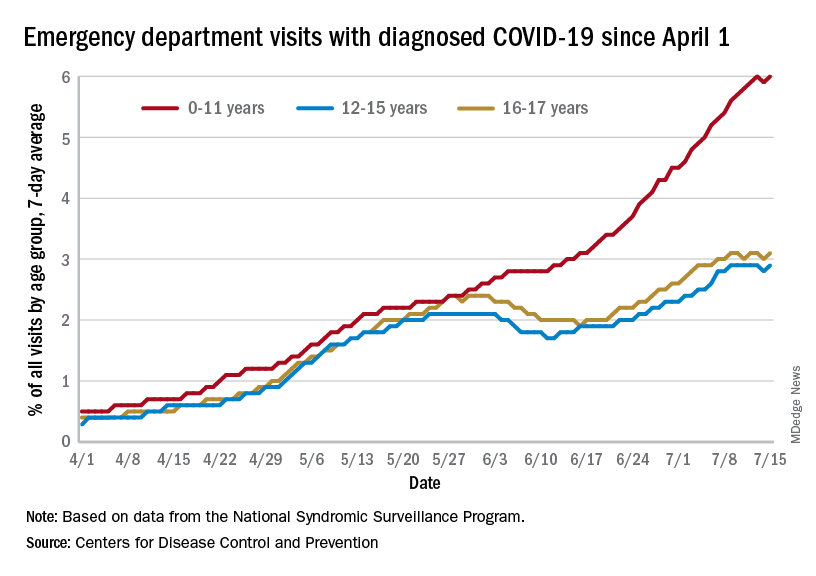
More than 4 out of 10 of respondents (43%) said that they will “definitely not” get their eligible children vaccinated, while only 7% said that their children had already received it and 10% said their children would get it as soon as possible, according to the KFF survey, which had an overall sample size of 1,847 adults, including an oversample of 471 parents of children under age 5.
Vaccine initiation has been slow in the first month since it was approved for the youngest children. Just 2.8% of all eligible children under age 5 had received an initial dose as of July 19, compared with first-month uptake figures of more than 18% for the 5- to 11-year-olds and 27% for those aged 12-15, based on data from the Centers for Disease Control and Prevention.
The current rates for vaccination in those aged 5 and older look like this: 70.2% of 12- to 17-year-olds have received at least one dose, versus 37.1% of those aged 5-11. Just over 60% of the older children were fully vaccinated as of July 19, as were 30.2% of the 5- to 11-year-olds, the CDC reported on its COVID Data Tracker.
Number of new cases hits 2-month high
Despite the vaccine, SARS-CoV-2 and its various mutations have continued with their summer travels. With 92,000 newly infected children added for the week of July 15-21, there have now been a total of 14,003,497 pediatric cases reported since the start of the pandemic, which works out to 18.6% of cases in all ages, the American Academy of Pediatrics and the Children’s Hospital Association said in their weekly COVID-19 report.
The 92,000 new cases represent an increase of almost 22% over the previous week and mark the highest 1-week count since May, when the total passed 100,000 for 2 consecutive weeks. More recently the trend had seemed more stable as weekly cases dropped twice and rose twice as the total hovered around 70,000, based on the data collected by the AAP and CHA from state and territorial health departments.
A different scenario has played out for emergency department visits and hospital admissions, which have risen steadily since the beginning of April. The admission rate for children aged 0-17, which was just 0.13 new patients per 100,000 population on April 11, was up to 0.44 per 100,000 on July 21. By comparison, the highest rate reached last year during the Delta surge was 0.47 per 100,000, based on CDC data.
The 7-day average of emergency dept. visits among the youngest age group, 0-11 years, shows the same general increase as hospital admissions, but the older children have diverged form that path (see graph). For those aged 12-15 and 16-17, hospitalizations started dropping in late May and into mid-June before climbing again, although more slowly than for the youngest group, the CDC data show.
The ED visit rate with diagnosed COVID among those aged 0-11, measured at 6.1% of all visits on July 19, is, in fact, considerably higher than at any time during the Delta surge last year, when it never passed 4.0%, although much lower than peak Omicron (14.1%). That 6.1% was also higher than any other age group on that day, adults included, the CDC said.