User login
Genetics and epigenetics could predict response to RA therapies
Machine-based learning of genetic and epigenetic characteristics of patients with rheumatoid arthritis could help to predict who is likely to benefit from the biologic drugs adalimumab and etanercept, according to results from a longitudinal, observational cohort study.
In the study, machine learning models created by researchers from Utrecht University in the Netherlands using different parameters predicted true-positive rates for response to adalimumab ranging from 76% to 90% and true-negative rates ranging from 70% to 89%, while for etanercept true-positive rates ranged from about 60% to 80% and true-negative rates ranged from about 82% to 98%.
“These results suggest that we can accurately predict the clinical response before adalimumab and etanercept treatment using molecular signatures-based machine learning models, although the prediction accuracy of these molecular signatures differs between cell types and treatments, underlining the need to study more than one drug, cell type, or epigenetic layers,” first author Weiyang Tao and colleagues wrote in Arthritis & Rheumatology. The ability to predict which tumor necrosis factor inhibitor (TNFi) is the first choice for treatment would be highly beneficial in reducing the time to effective treatment, which has been extensively proven to be a paramount factor for achieving long-sustained disease remission, they noted.
The researchers analyzed gene expression and epigenetic signatures in 80 patients with rheumatoid arthritis prior to treatment with adalimumab or etanercept and then examined patients’ response to treatment at 6 months. They then used that information to build a machine learning model to try to predict treatment response.
Overall, 47.5% of patients were treated with adalimumab, and 52.5% were treated with etanercept. Among the adalimumab group, 53% had a good or moderate response to treatment at 6 months, and among those treated with etanercept, 45% had a good or moderate response.
While there were no differences in baseline clinical parameters between responders and nonresponders, the study found significant genetic and epigenetic differences between patients.
They identified 549 genes that showed significantly different levels of expression between responders and nonresponders treated with adalimumab – in particular, genes involved in DNA and nucleotide binding – and 460 genes that were differentially expressed between etanercept responders and nonresponders, including genes involved in TNF-receptor signaling. However, only 2% of these differentially expressed genes were common in both the adalimumab and etanercept groups, suggesting treatment responses for these two medications have distinct gene signatures.
Looking at DNA methylation, researchers found 16,141 CpG positions – sites of DNA methylation – that were differentially methylated between adalimumab responders and nonresponders, 46% of which were hypermethylated among responders but not nonresponders. In the etanercept group, there were 17,026 differentially methylated sites in responders and nonresponders, 76.3% of which were hypermethylated among responders.
The researchers also noted that among the adalimumab responders, the hypermethylated sites were more likely to be found in the upstream and promoter regions of genes, and on CpG islands.
“Thus, on epigenetic level, we observed a distinct hypermethylation pattern between adalimumab and etanercept responders, suggesting the role of epigenetics in defining response towards adalimumab and to etanercept in PBMCs [peripheral blood mononuclear cells],” the authors wrote.
Given the differences in gene signatures seen in the adalimumab responders and etanercept responders, researchers speculated that different cell types might be involved in the responses to these two treatments. They undertook RNA sequencing on the variety of immune cell types known to be involved in rheumatoid arthritis, which revealed gene-expression differences between adalimumab responders and nonresponders in their CD4+ T cells but not in monocytes. However, the gene-expression differences between etanercept responders and nonresponders were seen in both CD4+ T cells and monocytes.
The study was supported by AbbVie, which manufactures adalimumab, and two authors were supported by the China Scholarship Council and the Netherlands Organization for Scientific Research. No conflicts of interest were declared.
SOURCE: Tao W et al. Arthritis Rheumatol. 2020 Sep 10. doi: 10.1002/art.41516.
FROM ARTHRITIS & RHEUMATOLOGY
FDA adds polyarticular-course JIA to approved indications for tofacitinib
The Food and Drug Administration has (pJIA).

The approval, announced Sept. 28 by tofacitinib’s manufacturer, Pfizer, marks the first JAK inhibitor to be approved for the condition in the United States and is the fourth indication to be approved for the drug after approvals in adult patients with moderate to severe rheumatoid arthritis following methotrexate failure, active psoriatic arthritis after disease-modifying antirheumatic drug failure, and moderate to severe ulcerative colitis after failure on a tumor necrosis factor inhibitor.
The agency based its approval on a phase 3, multinational, randomized, double-blind, controlled withdrawal study that had an 18-week, open-label, run-in phase involving 225 patients who twice daily took either a 5-mg tablet or, in patients under 40 kg, a weight-based lower dose in the form of a 1 mg/mL oral solution, according to the company press release. A total of 173 patients from this phase met JIA American College of Rheumatology 30 response criteria, defined as 30% or greater improvement in three of six JIA core set variables and worsening in no more than one of the core set variables; they were then randomized in part 2 of the study to continue the same dose of tofacitinib or receive placebo until 44 weeks. By the end of this period, 31% who received tofacitinib had a disease flare, compared with 55% on placebo (P = .0007). Disease flare was defined as a 30% or greater worsening in at least three of the six variables of the JIA core set, with no more than one of the remaining JIA core response variables improving by 30% or more after randomization.
The types of adverse drug reactions in patients with pJIA were consistent with those seen in adult rheumatoid arthritis patients, according to Pfizer. Serious adverse drug reactions have most commonly been serious infections that may lead to hospitalization or death, and most patients who developed these infections were taking concomitant immunosuppressants, such as methotrexate or corticosteroids. Common adverse drug reactions reported in 2% or more of patients during the first 3 months in controlled clinical trials in patients with rheumatoid arthritis taking tofacitinib at 5 mg twice daily were upper respiratory tract infection, nasopharyngitis, diarrhea, headache, and hypertension.
While the 5-mg tablet formulation is already available, Pfizer said it expects the oral solution to be available by the end of the first quarter in 2021.
Prescribing information can be found on the FDA website.
The Food and Drug Administration has (pJIA).
The approval, announced Sept. 28 by tofacitinib’s manufacturer, Pfizer, marks the first JAK inhibitor to be approved for the condition in the United States and is the fourth indication to be approved for the drug after approvals in adult patients with moderate to severe rheumatoid arthritis following methotrexate failure, active psoriatic arthritis after disease-modifying antirheumatic drug failure, and moderate to severe ulcerative colitis after failure on a tumor necrosis factor inhibitor.
The agency based its approval on a phase 3, multinational, randomized, double-blind, controlled withdrawal study that had an 18-week, open-label, run-in phase involving 225 patients who twice daily took either a 5-mg tablet or, in patients under 40 kg, a weight-based lower dose in the form of a 1 mg/mL oral solution, according to the company press release. A total of 173 patients from this phase met JIA American College of Rheumatology 30 response criteria, defined as 30% or greater improvement in three of six JIA core set variables and worsening in no more than one of the core set variables; they were then randomized in part 2 of the study to continue the same dose of tofacitinib or receive placebo until 44 weeks. By the end of this period, 31% who received tofacitinib had a disease flare, compared with 55% on placebo (P = .0007). Disease flare was defined as a 30% or greater worsening in at least three of the six variables of the JIA core set, with no more than one of the remaining JIA core response variables improving by 30% or more after randomization.
The types of adverse drug reactions in patients with pJIA were consistent with those seen in adult rheumatoid arthritis patients, according to Pfizer. Serious adverse drug reactions have most commonly been serious infections that may lead to hospitalization or death, and most patients who developed these infections were taking concomitant immunosuppressants, such as methotrexate or corticosteroids. Common adverse drug reactions reported in 2% or more of patients during the first 3 months in controlled clinical trials in patients with rheumatoid arthritis taking tofacitinib at 5 mg twice daily were upper respiratory tract infection, nasopharyngitis, diarrhea, headache, and hypertension.
While the 5-mg tablet formulation is already available, Pfizer said it expects the oral solution to be available by the end of the first quarter in 2021.
Prescribing information can be found on the FDA website.
Preserving civility in trying times
Recently I was in a minor car accident. No injuries, just some bent metal and scratched paint from a low-speed parking lot mishap.

The other driver and I got out of our cars, made sure we were both okay, and then I said “Let’s exchange insurance information.” We got our insurance cards out; I took a picture of her card, and she wrote down my info. Then we drove off and went on with our days. The whole thing took a few minutes.
Why am I writing about this?
Because it was all handled very politely. There were no angry words, name calling, or heated exchanges. We checked the damage, made sure the other was okay, and exchanged insurance cards ... without a single impolite phrase or gesture.
To me this is a good thing. In a world in which people yell (and sometimes brandish weapons) over imagined and minor offenses, in which political candidates exchange crude insults rather then debate policy, and in which an opposing viewpoint is treated as blasphemy rather than an honest difference of opinion, it was nice to have a polite, adult, exchange under unpleasant circumstances.
Perhaps it’s sad to find relief in such a minor event, but it’s also reassuring. In medicine (especially hospital work) we often see people at their very worst, and dealing with them can be a challenge. We live in a world of at-times seemingly endless rudeness, one-upping, and “problem-solving” with yelling, threats, and intimidation.
So I was glad the minor incident resulted in nothing more serious at the time than a brief, polite, conversation.
Dr. Block has a solo neurology practice in Scottsdale, Arizona. He has nothing to disclose.
Recently I was in a minor car accident. No injuries, just some bent metal and scratched paint from a low-speed parking lot mishap.
The other driver and I got out of our cars, made sure we were both okay, and then I said “Let’s exchange insurance information.” We got our insurance cards out; I took a picture of her card, and she wrote down my info. Then we drove off and went on with our days. The whole thing took a few minutes.
Why am I writing about this?
Because it was all handled very politely. There were no angry words, name calling, or heated exchanges. We checked the damage, made sure the other was okay, and exchanged insurance cards ... without a single impolite phrase or gesture.
To me this is a good thing. In a world in which people yell (and sometimes brandish weapons) over imagined and minor offenses, in which political candidates exchange crude insults rather then debate policy, and in which an opposing viewpoint is treated as blasphemy rather than an honest difference of opinion, it was nice to have a polite, adult, exchange under unpleasant circumstances.
Perhaps it’s sad to find relief in such a minor event, but it’s also reassuring. In medicine (especially hospital work) we often see people at their very worst, and dealing with them can be a challenge. We live in a world of at-times seemingly endless rudeness, one-upping, and “problem-solving” with yelling, threats, and intimidation.
So I was glad the minor incident resulted in nothing more serious at the time than a brief, polite, conversation.
Dr. Block has a solo neurology practice in Scottsdale, Arizona. He has nothing to disclose.
AGA issues recommendations for pre-endoscopy coronavirus testing
The American Gastroenterological Association (AGA) has issued guidance for pre-endoscopy coronavirus testing based on a review of existing literature and a survey of endoscopist risk tolerance.
While serologic antibody testing is not recommended for any patients, use of nucleic acid amplification testing (NAAT) for viral RNA should be informed by local prevalence of asymptomatic individuals, reported lead guideline panelist Shahnaz Sultan, MD, of the University of Minnesota in Minneapolis and colleagues.
“The two main concerns with a pretesting strategy are the false positives and false negatives,” the panelists wrote in Gastroenterology. When performing endoscopy in a false-negative patient, health care providers who wear a surgical mask instead of an N95/N99 respirator may have an increased risk of infection, and the patient undergoing the procedure may be falsely reassured that they are not contagious, the panelists wrote.
Among false-positive individuals, “implications for the patient include cancellation of the procedure, self-quarantine for 14 days, apprehension, and loss of work.”
Because of these concerns, the panelists concluded that pretesting strategies should be tailored to the local prevalence of asymptomatic infection because this rate is associated with likelihood of encountering false-positive and false-negative patients.
To determine appropriate prevalence thresholds, Dr. Sultan and colleagues first conducted a meta-analysis of 12 studies comparing the accuracy of various NAAT tests. This revealed a pooled sensitivity of 0.941 and a pooled specificity of 0.971. These figures remained consistent when only studies with low risk bias were considered; pooled sensitivity and specificity were 0.929 and 0.968, respectively.
“An important caveat of these studies is that tests were validated in samples from symptomatic individuals and it is likely that in asymptomatic individuals the tests may not perform as well and have lower sensitivity and specificity,” the panelists noted.
Next, Dr. Sultan and colleagues conducted an online survey of U.S. endoscopists to determine their tolerance for risk of coronavirus transmission, with proposed risk thresholds ranging from 1/40,000 to 1/1,000. Out of 74 respondents, 28 (37.8%) said that they would be willing to accept a risk level of 1/40,000, whereas 27 (36.5%) would accept risks between 1/10,000 and 1/2,500, and 19 (25.7%) would accept a risk level of 1/1,000. Among clinicians expressing the highest risk tolerance (1/1,000), almost two-thirds (63.2%) were private practitioners.
Drawing on these findings, the panelists issued three tiered recommendations for pretesting based on local prevalence of asymptomatic infection.
- Low prevalence (less than 0.5%): Pretesting is not recommended.
- Intermediate prevalence (0.5-2%): Pretesting is recommended.
- High prevalence (greater than 2%): Pretesting is not recommended.
The panelists recommended against pretesting in low and high prevalence settings because of the likelihood of false positives and false negatives, respectively. For “hotspot” areas, in which hospital capacity is acutely burdened, the panelists noted that “resumption of outpatient endoscopy may depend on availability of PPE.”
In areas of intermediate prevalence, the pretesting recommendation stands only if “testing is feasible and there is less perceived burden on patients, and when the benefits outweigh the downsides (e.g., false positives do not significantly outnumber the true positives).” According to the guidance, when performing upper and lower endoscopies on negative patients in areas of intermediate prevalence, surgical masks are appropriate for endoscopists and staff, with the caveat that those unwilling to accept any increased risk may still wear an N95/N99 respirator or a powered air-purifying respirator (PAPR).
Finally, the panelists made a recommendation against pretesting for antibodies in all areas, regardless of asymptomatic infection prevalence.
“Evidence supporting the role of seroconversion for return to work or hospital staffing policies is also lacking,” they added.
All recommendations were based on low or very low certainty evidence.
To help endoscopy centers determine an appropriate pretesting strategy, the AGA has created an online interactive tool that allows for input of diagnostic test accuracy and local prevalence rate.The investigators reported no conflicts of interest.
Instructions for using the tool, along with additional COVID-19 guidance, can be found on the AGA website: www.gastro.org/COVID.
The investigators reported no conflicts of interest.
This story was updated on 10/13/2020 and on 11/6/2020.
SOURCE: Sultan S et al. Gastroenterology. 2020 Jul 28. doi: 10.1053/j.gastro.2020.07.043.
FROM GASTROENTEROLOGY
Nearly half of brachial plexus injury cases occur without shoulder dystocia
according to research published in Obstetrics & Gynecology.
Grace J. Johnson, MD, and colleagues at Baylor College of Medicine in Houston performed a medical review of 41,525 deliveries at Texas Children’s Hospital between March 2012 and July 2019, identifying cases of brachial plexus injury, with and without shoulder dystocia, occurring and persisting. The researchers also evaluated whether clinical experience (5 years or fewer, 6-15 years, or more than 15 years since training) and education impacted the risk of children developing shoulder dystocia or brachial plexus injury.
There were 547 cases of shoulder dystocia in 26,163 vaginal births (2.1%) and 9 cases in 15,362 cesarean births (0.06%), while 33 cases of brachial plexus injury occurred overall. Nearly all brachial plexus injuries were in vaginal deliveries (30 cases; 0.1%), while 3 cases occurred in cesarean deliveries (0.02%). Of these, 14 cases (42%) of brachial plexus injury did not co-occur with shoulder dystocia. Brachial plexus injury that persisted to discharge was similar for children with shoulder dystocia (17 of 19 cases; 89%) and without shoulder dystocia (10 of 14 cases; 71%). In the 27 children with persistent brachial plexus injury, 2 of 23 children who received follow-up care continued to experience persistent brachial plexus injury at 9 months (1 case with shoulder dystocia) and 12 months (1 case without shoulder dystocia).
“The frequent co-occurrence of shoulder dystocia and brachial plexus injury coupled with the equally frequent occurrence of isolated brachial plexus injury suggests that both brachial plexus injury and shoulder dystocia often reflect two causally unrelated complications of uterine forces driving a fetus through the birth canal in the presence of disproportion between the passage and the shoulder girdle of the passenger,” Dr. Johnson and colleagues wrote.
Results unchanged by clinician experience
Factors that impacted the risk of brachial plexus injury in children without shoulder dystocia were lack of maternal diabetes (0 women vs. 6 women; P = .03) and second-stage labor length (mean 103 minutes vs. 53 minutes; P = .08). Dr. Johnson and colleagues found no significant between-group differences regarding operative delivery, maternal age, or gestational age.
The researchers also examined the experience of the clinician who delivered children with brachial plexus injuries, and discovered there were no significant differences in children who had transient as opposed to persistent brachial plexus injury based on the number of years a clinician had been in practice (P = .97). There also were no significant changes in the “ratios of brachial plexus injury per total deliveries, brachial plexus injury per vaginal deliveries, and brachial plexus injury per shoulder dystocia” despite the presence of education and training for shoulder dystocia.
Questions require further study
Torri Metz, MD, MS, a maternal-fetal medicine subspecialist and associate professor of obstetrics and gynecology at University of Utah Health in Salt Lake City, said in an interview that the review by Johnson and colleagues was able to address limitations in previous studies by looking at the medical records of shoulder dystocia cases at a single tertiary care center.
“Brachial plexus injury occurs both with and without a diagnosis of shoulder dystocia. The finding that the non–shoulder dystocia brachial plexus injuries were associated with a longer second stage of labor suggests that these injuries can occur even prior to delivery of the fetal head and are often not related to maneuvers employed by an obstetrician during delivery,” Dr. Metz said.
The findings that brachial plexus injury severity was unrelated to clinician experience suggests “the occurrence, severity, and persistence of brachial plexus injury may be unrelated to maneuvers by the practitioner at the time of delivery,” she said.
Although Johnson et al. found education and training initiatives did not significantly impact the ratio of brachial plexus injury cases, “importantly, there are likely many other benefits to shoulder dystocia simulation including team communication and comfort of the practitioner in an obstetrical emergency. Thus, the conclusion should not be that simulation training should be abandoned,” Dr. Metz explained.
The results of the study should be confirmed in future research, she noted. “Despite looking at all cases of shoulder dystocia at a tertiary center over a 7-year period, the incidence of brachial plexus injury is low enough that only 33 cases were evaluated. As such, many questions about obstetrical management and the risk of brachial plexus injury still require further study,” said Dr. Metz, who was asked to comment on the study.
The authors reported no relevant financial disclosures. Dr. Metz is an editorial board member for Obstetrics and Gynecology. She was not involved in the review of this manuscript or the decision to publish it.
SOURCE: Johnson GJ et al. Obstet Gynecol. 2020 Oct. doi: 10.1097/AOG.0000000000004013.
FROM OBSTETRICS & GYNECOLOGY

Fellowship procedure logs: A word of advice for fellows and a call to action for fellowship programs
As a GI fellow, I never would have imagined I would be writing an article on GI fellowship procedure logs. At the time, in my naiveté, I looked at the procedure log as a necessary evil and part of the “red tape” imposed on fellowship programs by the Accreditation Council for Graduate Medical Education (ACGME). While the importance of keeping a log was highlighted and enforced by my program, the large majority of the recommended numbers were easily achievable. As a result, even my sporadic tracking of completed procedures was sufficient to meet the requirements. My poor compliance wasn’t because I was lazy or careless, but rather because of the absence of a formal system, which resulted in homegrown methods that were highly inaccurate. I wasn’t alone in my follies. As I discussed this issue with fellows across the nation, I learned that these sentiments were universally shared. It seemed that everyone had come up with their own unique way of keeping a log – from Word and Excel documents, to a binder of patient stickers, to a daily folded sheet of paper with scribbled technical notes – all of which were an inconvenience to trainees already stretched thin. However, when the time came for employee credentialing, I came to realize the importance of keeping an accurate record. This once-neglected document would become the ultimate record of my capabilities for independent practice. The pitfalls and shortcomings of how we currently log procedures is why it was the first thing I worked on improving once I was an academic faculty member. There had to be a better way!

I started by reviewing what ACGME actually mandates trainees in GI to track, and to my surprise, they no longer set minimum procedure requirements, but rather competencies. The current requirements state that “Fellows must demonstrate competence in performance of ... procedures”1 and specifically state that competence should “not be based solely on a minimum number of procedures performed.” So, where does the need for a procedure log and minimum numbers come from? Your fellowship programs’ review committee. Programs recognize that, in order to approve requests for independent practice privileges, they need to substantiate the competency of the fellow, which ultimately is best evidenced through procedure logs. Therefore, the committee sets the minimum number of cases they believe is necessary for trainees to practice safely and independently.2 Our program leadership at UConn Health in Farmington, Conn., annually assesses our procedure activity and, over the years, has settled on the procedure guideline numbers provided to fellows at orientation and reviewed with them semiannually.
Once I understood exactly why we need procedure logs, I started looking at how other specialties handle them, particularly surgical programs in which accurate procedure logs are vitally important. It turns out that they universally use, and look favorably on, the ACGME Case Log System - an online, all encompassing, tracking software. This system is provided to surgical programs despite ACGME’s focus on competencies rather than numbers. Why this system is not offered for GI programs is unclear. However, in my endeavor, I was able to find the American Gastroenterological Association (AGA) Procedure Log system. When we reviewed the system in 2015 for use in our program, it was more of a concept than an all-encompassing tool. Fortunately, the AGA Information Technology (IT) and Training departments were kind enough to work with us to develop a complete online tracking tool that could be used nationally by all trainees in GI. Finally, we had a system to keep an accurate, secure log online and in real time.
A plea to fellows
With this, understand that in today’s document driven and litigious world, your procedure log is as vital to endoscopy as the scope itself. Without it, you may not be granted permission to do x, y, or z procedure. Indirectly, it can lead to delays in patient care and may prevent you from performing certain tasks and ultimately lead to repetitive training. Treat it as an official legal document of what you’ve done and what you are capable of doing. Recognize that it will be used by your mentors as supporting evidence regarding your competency for independent practice. Ask your training program to provide a clear list of expectations and requirements for graduation and a method for you to accurately track them, such as the AGA Procedure Log. An online, mobile system will allow you to document cases immediately after you finish while the procedure is fresh in your mind. Taking an extra minute after each case will prevent headaches down the road. The faculty and your cofellows all know of the end of the year “procedure scavenger” (i.e., the fellow who searches for procedures and takes them from others to make sure they meet their numbers for graduation). Please don’t be that person.
A request for program directors
As GI educators, we all know the mention of procedure logs to fellows is typically accompanied by eye rolls. It doesn’t have to be that way. Provide your fellows with clear expectations and a quick, easy, and accurate way to track their accomplishments. Help them recognize the importance of an accurate and complete procedure log. Consider an online tracking system such as the AGA Procedure Log. Studies have demonstrated that a computer-based system increases compliance and accuracy.3 Not providing one will surely lead to difficulties in the long run and is a disservice to those we work to empower, educate, and prepare for success.
References
1. ACGME Program Requirements for Graduate Medical Education in Gastroenterology. Accreditation Council for Graduate Medical Education. 2020 Jul 1. pp 21, 28. Accessed Sept. 13, 2020. https://www.acgme.org/Portals/0/PFAssets/ProgramRequirements/144_Gastroenterology_2020.pdf.
2. Steven J et al. J Grad Med Educat. 2012;4(2):257-60.
3. Rowe BH et al. Can Fam Physician. 1995;41:2113–20.
Dr. Rezaizadeh is an assistant professor of medicine, associate program director, gastroenterology fellowship program, UConn Health, Farmington, Conn.
As a GI fellow, I never would have imagined I would be writing an article on GI fellowship procedure logs. At the time, in my naiveté, I looked at the procedure log as a necessary evil and part of the “red tape” imposed on fellowship programs by the Accreditation Council for Graduate Medical Education (ACGME). While the importance of keeping a log was highlighted and enforced by my program, the large majority of the recommended numbers were easily achievable. As a result, even my sporadic tracking of completed procedures was sufficient to meet the requirements. My poor compliance wasn’t because I was lazy or careless, but rather because of the absence of a formal system, which resulted in homegrown methods that were highly inaccurate. I wasn’t alone in my follies. As I discussed this issue with fellows across the nation, I learned that these sentiments were universally shared. It seemed that everyone had come up with their own unique way of keeping a log – from Word and Excel documents, to a binder of patient stickers, to a daily folded sheet of paper with scribbled technical notes – all of which were an inconvenience to trainees already stretched thin. However, when the time came for employee credentialing, I came to realize the importance of keeping an accurate record. This once-neglected document would become the ultimate record of my capabilities for independent practice. The pitfalls and shortcomings of how we currently log procedures is why it was the first thing I worked on improving once I was an academic faculty member. There had to be a better way!
I started by reviewing what ACGME actually mandates trainees in GI to track, and to my surprise, they no longer set minimum procedure requirements, but rather competencies. The current requirements state that “Fellows must demonstrate competence in performance of ... procedures”1 and specifically state that competence should “not be based solely on a minimum number of procedures performed.” So, where does the need for a procedure log and minimum numbers come from? Your fellowship programs’ review committee. Programs recognize that, in order to approve requests for independent practice privileges, they need to substantiate the competency of the fellow, which ultimately is best evidenced through procedure logs. Therefore, the committee sets the minimum number of cases they believe is necessary for trainees to practice safely and independently.2 Our program leadership at UConn Health in Farmington, Conn., annually assesses our procedure activity and, over the years, has settled on the procedure guideline numbers provided to fellows at orientation and reviewed with them semiannually.
Once I understood exactly why we need procedure logs, I started looking at how other specialties handle them, particularly surgical programs in which accurate procedure logs are vitally important. It turns out that they universally use, and look favorably on, the ACGME Case Log System - an online, all encompassing, tracking software. This system is provided to surgical programs despite ACGME’s focus on competencies rather than numbers. Why this system is not offered for GI programs is unclear. However, in my endeavor, I was able to find the American Gastroenterological Association (AGA) Procedure Log system. When we reviewed the system in 2015 for use in our program, it was more of a concept than an all-encompassing tool. Fortunately, the AGA Information Technology (IT) and Training departments were kind enough to work with us to develop a complete online tracking tool that could be used nationally by all trainees in GI. Finally, we had a system to keep an accurate, secure log online and in real time.
A plea to fellows
With this, understand that in today’s document driven and litigious world, your procedure log is as vital to endoscopy as the scope itself. Without it, you may not be granted permission to do x, y, or z procedure. Indirectly, it can lead to delays in patient care and may prevent you from performing certain tasks and ultimately lead to repetitive training. Treat it as an official legal document of what you’ve done and what you are capable of doing. Recognize that it will be used by your mentors as supporting evidence regarding your competency for independent practice. Ask your training program to provide a clear list of expectations and requirements for graduation and a method for you to accurately track them, such as the AGA Procedure Log. An online, mobile system will allow you to document cases immediately after you finish while the procedure is fresh in your mind. Taking an extra minute after each case will prevent headaches down the road. The faculty and your cofellows all know of the end of the year “procedure scavenger” (i.e., the fellow who searches for procedures and takes them from others to make sure they meet their numbers for graduation). Please don’t be that person.
A request for program directors
As GI educators, we all know the mention of procedure logs to fellows is typically accompanied by eye rolls. It doesn’t have to be that way. Provide your fellows with clear expectations and a quick, easy, and accurate way to track their accomplishments. Help them recognize the importance of an accurate and complete procedure log. Consider an online tracking system such as the AGA Procedure Log. Studies have demonstrated that a computer-based system increases compliance and accuracy.3 Not providing one will surely lead to difficulties in the long run and is a disservice to those we work to empower, educate, and prepare for success.
References
1. ACGME Program Requirements for Graduate Medical Education in Gastroenterology. Accreditation Council for Graduate Medical Education. 2020 Jul 1. pp 21, 28. Accessed Sept. 13, 2020. https://www.acgme.org/Portals/0/PFAssets/ProgramRequirements/144_Gastroenterology_2020.pdf.
2. Steven J et al. J Grad Med Educat. 2012;4(2):257-60.
3. Rowe BH et al. Can Fam Physician. 1995;41:2113–20.
Dr. Rezaizadeh is an assistant professor of medicine, associate program director, gastroenterology fellowship program, UConn Health, Farmington, Conn.
Children’s share of new COVID-19 cases is on the rise
The cumulative percentage of COVID-19 cases reported in children continues to climb, but “the history behind that cumulative number shows substantial change,” according to a new analysis of state health department data.
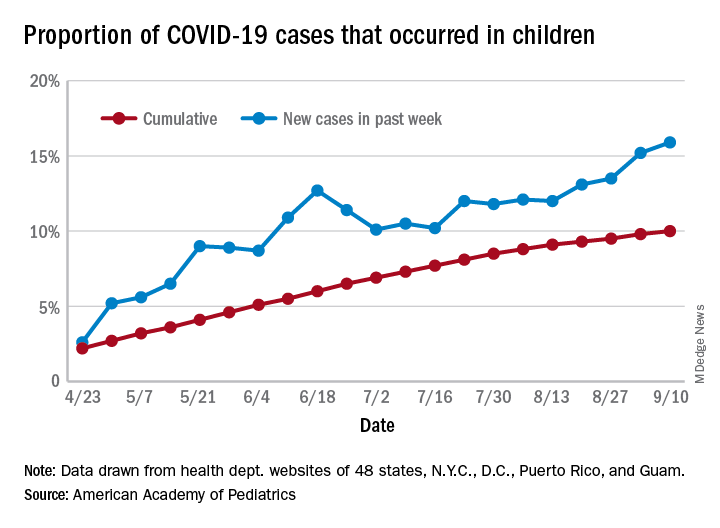
As of Sept. 10, the 549,432 cases in children represented 10.0% of all reported COVID-19 cases in the United States following a substantial rise over the course of the pandemic – the figure was 7.7% on July 16 and 3.2% on May 7, Blake Sisk, PhD, of the American Academy of Pediatrics and associates reported Sept. 29 in Pediatrics.
Unlike the cumulative number, the weekly proportion of cases in children fell early in the summer but then started climbing again in late July. Dr. Sisk and associates wrote.
Despite the increase, however, the proportion of pediatric COVID-19 cases is still well below children’s share of the overall population (22.6%). Also, “it is unclear how much of the increase in child cases is due to increased testing capacity, although CDC data from public and commercial laboratories show the share of all tests administered to children ages 0-17 has remained stable at 5%-7% since late April,” they said.
Data for the current report were drawn from 49 state health department websites (New York state does not report ages for COVID-19 cases), along with New York City, the District of Columbia, Puerto Rico, and Guam. Alabama changed its definition of a child case in August and was not included in the trend analysis (see graph), the investigators explained.
Those data show “substantial variation in case growth by region: in April, a preponderance of cases was in the Northeast. In June, cases surged in the South and West, followed by mid-July increases in the Midwest,” Dr. Sisk and associates said.
The increase among children in Midwest states is ongoing with the number of new cases reaching its highest level yet during the week ending Sept. 10, they reported.
SOURCE: Sisk B et al. Pediatrics. 2020 Sep 29. doi: 10.1542/peds.2020-027425.
The cumulative percentage of COVID-19 cases reported in children continues to climb, but “the history behind that cumulative number shows substantial change,” according to a new analysis of state health department data.
As of Sept. 10, the 549,432 cases in children represented 10.0% of all reported COVID-19 cases in the United States following a substantial rise over the course of the pandemic – the figure was 7.7% on July 16 and 3.2% on May 7, Blake Sisk, PhD, of the American Academy of Pediatrics and associates reported Sept. 29 in Pediatrics.
Unlike the cumulative number, the weekly proportion of cases in children fell early in the summer but then started climbing again in late July. Dr. Sisk and associates wrote.
Despite the increase, however, the proportion of pediatric COVID-19 cases is still well below children’s share of the overall population (22.6%). Also, “it is unclear how much of the increase in child cases is due to increased testing capacity, although CDC data from public and commercial laboratories show the share of all tests administered to children ages 0-17 has remained stable at 5%-7% since late April,” they said.
Data for the current report were drawn from 49 state health department websites (New York state does not report ages for COVID-19 cases), along with New York City, the District of Columbia, Puerto Rico, and Guam. Alabama changed its definition of a child case in August and was not included in the trend analysis (see graph), the investigators explained.
Those data show “substantial variation in case growth by region: in April, a preponderance of cases was in the Northeast. In June, cases surged in the South and West, followed by mid-July increases in the Midwest,” Dr. Sisk and associates said.
The increase among children in Midwest states is ongoing with the number of new cases reaching its highest level yet during the week ending Sept. 10, they reported.
SOURCE: Sisk B et al. Pediatrics. 2020 Sep 29. doi: 10.1542/peds.2020-027425.
FROM PEDIATRICS
Pandemic drives demand for self-managed abortions
Requests for self-managed abortion via a telemedicine service increased by 27% from March 20, 2020, to April 11, 2020, in the United States in the wake of widespread lockdowns and shelter-in-place directives because of the COVID-19 pandemic, based on data from a provider of such services.

Access to abortion care is challenging in many areas under ordinary circumstances, but the disruption of the COVID-19 pandemic led to many states suspending or limiting in-clinic services, wrote Abigail R.A. Aiken, MD, PhD, of the University of Texas at Austin and colleagues.
“As a result, people may increasingly be seeking self-managed abortion outside the formal health care system,” they said.
In a research letter published in Obstetrics & Gynecology, the investigators reviewed request data from Aid Access, a telemedicine service that provides medication for abortion at up to 10 weeks’ gestation for users who complete an online consultation form. They also collected data on the implementation and scope of COVID-19–related abortion restrictions by state.
The analysis included all 49,935 requests made between January 1, 2019, and April 11, 2020.
Overall, the rate of requests for self-managed medical abortions increased significantly, by 27%, during the period from March 20, 2020, to April 11, 2020, which reflected the average period after clinic restrictions or closures at the state level. A total of 11 states showed individually significant increases in requests for self-managed medical abortions, with the highest of 94% in Texas and the lowest of 22% in Ohio. In these 11 states, the median time spent at home was 5% higher than in states without significant increases in requests for self-managed medical abortions during the same period. These states also had “particularly high COVID-19 rates or more severe COVID-19–related restrictions on in-clinic abortion access,” the researchers noted.
Patients want alternatives to in-person care
“Our results may reflect two distinct phenomena,” Dr. Aiken and associates wrote. “First, more people may be seeking abortion through all channels, whether due to COVID-19 risks during pregnancy, reduced access to prenatal care, or the pandemic-related economic downturn. Second, there may be shift in demand from in-clinic to self-managed abortion during the pandemic, possibly owing to fear of infection during in-person care or inability to get to a clinic because of childcare and transit disruptions,” they explained.
The study findings were limited by the inability to measure all options for women to achieve self-managed abortions and a lack of power to detect changes in states with low request numbers or where restrictions were implemented at later dates, the researchers noted. However, the results suggest that telemedicine services for medication abortion should be a policy priority because patients may continue to seek alternatives while in-clinic services remain restricted, they said.
In fact, “the World Health Organization recommends telemedicine and self-management abortion-care models during the pandemic, and the United Kingdom has temporarily implemented fully remote provision of abortion medications,” the researchers wrote. However, similar strategies in the United States “would depend on sustained changes to the U.S. Food and Drug Administration’s Risk Evaluation and Mitigation Strategy, which requires patients to collect mifepristone at a hospital or medical facility, as well as changes to state-specific laws that prohibit remote provider consultation,” Dr. Aiken and associates concluded.
Lift barriers to protect patients
Eve Espey, MD, of the University of New Mexico, Albuquerque, said in an interview.
“As background, state abortion restrictions have increased exponentially over the last decade, while research over the same time period has demonstrated the safety of telemedicine abortion – a form of self-managed abortion – with no in-person visit for appropriate candidates,” she said.
“Enter the coronavirus pandemic with safety concerns related to in-person medical visits and certain states leveraging the opportunity to enact even more stringent abortion restrictions. Unsurprisingly, the result, as documented in this excellent research report, is a significant increase in requests for telemedicine abortion in many states, particularly the most restrictive, from the single online service in the United States, Aid Access,” said Dr. Espey.
“Barriers to self-managed abortion include the [FDA] Risk Evaluation and Mitigation Strategy for mifepristone, a set of unnecessary restrictions requiring that providers meet certain qualifications and dispense the medication only in a clinic, office, or hospital,” she said. “The REMS precludes the use of telemedicine abortion; Aid Access and the FDA are in legal proceedings,” she noted.
“Most recently, the [American Civil Liberties Union] sued the FDA on behalf of a coalition of medical experts led by [American College of Obstetricians and Gynecologists] to suspend the REMS for mifepristone during the COVID public health emergency, to allow patients to receive the medications for early abortion without a visit to a health care provider,” Dr. Espey said. “Fortunately, a federal district court required the temporary suspension of the in-person dispensing restriction. Although this is a great step to improve abortion access during the pandemic, a permanent removal of the REMS would pave the way for ongoing safe, effective, and patient-centered early abortion care,” noted Dr. Espey, who was asked to comment on the research letter.
Dr. Aiken disclosed serving as a consultant for Agile Therapeutics, and a coauthor is the founder and director of Aid Access. Dr. Espey had no financial conflicts to disclose. She is a member of the Ob.Gyn. News Editorial Advisory Board.
SOURCE: Aiken ARA et al. Obstet Gynecol. 2020 Jul 21. doi: 10.1097/AOG.0000000000004081.
Requests for self-managed abortion via a telemedicine service increased by 27% from March 20, 2020, to April 11, 2020, in the United States in the wake of widespread lockdowns and shelter-in-place directives because of the COVID-19 pandemic, based on data from a provider of such services.
Access to abortion care is challenging in many areas under ordinary circumstances, but the disruption of the COVID-19 pandemic led to many states suspending or limiting in-clinic services, wrote Abigail R.A. Aiken, MD, PhD, of the University of Texas at Austin and colleagues.
“As a result, people may increasingly be seeking self-managed abortion outside the formal health care system,” they said.
In a research letter published in Obstetrics & Gynecology, the investigators reviewed request data from Aid Access, a telemedicine service that provides medication for abortion at up to 10 weeks’ gestation for users who complete an online consultation form. They also collected data on the implementation and scope of COVID-19–related abortion restrictions by state.
The analysis included all 49,935 requests made between January 1, 2019, and April 11, 2020.
Overall, the rate of requests for self-managed medical abortions increased significantly, by 27%, during the period from March 20, 2020, to April 11, 2020, which reflected the average period after clinic restrictions or closures at the state level. A total of 11 states showed individually significant increases in requests for self-managed medical abortions, with the highest of 94% in Texas and the lowest of 22% in Ohio. In these 11 states, the median time spent at home was 5% higher than in states without significant increases in requests for self-managed medical abortions during the same period. These states also had “particularly high COVID-19 rates or more severe COVID-19–related restrictions on in-clinic abortion access,” the researchers noted.
Patients want alternatives to in-person care
“Our results may reflect two distinct phenomena,” Dr. Aiken and associates wrote. “First, more people may be seeking abortion through all channels, whether due to COVID-19 risks during pregnancy, reduced access to prenatal care, or the pandemic-related economic downturn. Second, there may be shift in demand from in-clinic to self-managed abortion during the pandemic, possibly owing to fear of infection during in-person care or inability to get to a clinic because of childcare and transit disruptions,” they explained.
The study findings were limited by the inability to measure all options for women to achieve self-managed abortions and a lack of power to detect changes in states with low request numbers or where restrictions were implemented at later dates, the researchers noted. However, the results suggest that telemedicine services for medication abortion should be a policy priority because patients may continue to seek alternatives while in-clinic services remain restricted, they said.
In fact, “the World Health Organization recommends telemedicine and self-management abortion-care models during the pandemic, and the United Kingdom has temporarily implemented fully remote provision of abortion medications,” the researchers wrote. However, similar strategies in the United States “would depend on sustained changes to the U.S. Food and Drug Administration’s Risk Evaluation and Mitigation Strategy, which requires patients to collect mifepristone at a hospital or medical facility, as well as changes to state-specific laws that prohibit remote provider consultation,” Dr. Aiken and associates concluded.
Lift barriers to protect patients
Eve Espey, MD, of the University of New Mexico, Albuquerque, said in an interview.
“As background, state abortion restrictions have increased exponentially over the last decade, while research over the same time period has demonstrated the safety of telemedicine abortion – a form of self-managed abortion – with no in-person visit for appropriate candidates,” she said.
“Enter the coronavirus pandemic with safety concerns related to in-person medical visits and certain states leveraging the opportunity to enact even more stringent abortion restrictions. Unsurprisingly, the result, as documented in this excellent research report, is a significant increase in requests for telemedicine abortion in many states, particularly the most restrictive, from the single online service in the United States, Aid Access,” said Dr. Espey.
“Barriers to self-managed abortion include the [FDA] Risk Evaluation and Mitigation Strategy for mifepristone, a set of unnecessary restrictions requiring that providers meet certain qualifications and dispense the medication only in a clinic, office, or hospital,” she said. “The REMS precludes the use of telemedicine abortion; Aid Access and the FDA are in legal proceedings,” she noted.
“Most recently, the [American Civil Liberties Union] sued the FDA on behalf of a coalition of medical experts led by [American College of Obstetricians and Gynecologists] to suspend the REMS for mifepristone during the COVID public health emergency, to allow patients to receive the medications for early abortion without a visit to a health care provider,” Dr. Espey said. “Fortunately, a federal district court required the temporary suspension of the in-person dispensing restriction. Although this is a great step to improve abortion access during the pandemic, a permanent removal of the REMS would pave the way for ongoing safe, effective, and patient-centered early abortion care,” noted Dr. Espey, who was asked to comment on the research letter.
Dr. Aiken disclosed serving as a consultant for Agile Therapeutics, and a coauthor is the founder and director of Aid Access. Dr. Espey had no financial conflicts to disclose. She is a member of the Ob.Gyn. News Editorial Advisory Board.
SOURCE: Aiken ARA et al. Obstet Gynecol. 2020 Jul 21. doi: 10.1097/AOG.0000000000004081.
FROM OBSTETRICS & GYNECOLOGY

MS Highlights from AAN & CMSC
- Initial high-efficacy MS therapy is associated with less disability later
- Serum NfL in early MS can help predict clinical course
- No benefit of three commonly used medications for MS fatigue
- Telerehabilitation may be effective in MS
- CMSC MRI guidelines evolve into international consensus protocol
- Newest oral DMTs haven’t yet made a big impact in the MS world
Read the supplement.
Pandemic poses new challenges for rural doctors
These include struggling with seeing patients virtually and treating patients who have politicized the virus. Additionally, the pandemic has exposed rural practices to greater financial difficulties.
Before the pandemic some rurally based primary care physicians were already working through big challenges, such as having few local medical colleagues to consult and working in small practices with lean budgets. In fact, data gathered by the National Rural Health Association showed that there are only 40 primary care physicians per 100,000 patients in rural regions, compared with 53 in urban areas – and the number of physicians overall is 13 per 10,000 in rural areas, compared with 31 in cities.
In the prepandemic world, for some doctors, the challenges were balanced by the benefits of practicing in these sparsely populated communities with scenic, low-traffic roads. Some perks of practicing in rural areas touted by doctors included having a fast commute, being able to swim in a lake near the office before work, having a low cost of living, and feeling like they are making a difference in their communities as they treat generations of the families they see around town.
But today, new hurdles to practicing medicine in rural America created by the COVID-19 pandemic have caused the hardships to feel heavier than the joys at times for some physicians interviewed by MDedge.
Many independent rural practices in need of assistance were not able to get much from the federal Provider Relief Funds, said John M. Westfall, MD, who is director of the Robert Graham Center for Policy Studies in Family Medicine and Primary Care, in an interview.
“Rural primary care doctors function independently or in smaller critical access hospitals and community health centers,” said Dr. Westfall, who previously practiced family medicine in a small town in Colorado. “Many of these have much less financial reserves so are at risk of cutbacks and closure.”
Jacqueline W. Fincher, MD, an internist based in a tiny Georgia community along the highway between Atlanta and Augusta, said her small practice works on really thin margins and doesn’t have much cushion. At the beginning of the pandemic, all visits were down, and her practice operated at a loss. To help, Dr. Fincher and her colleagues applied for funding from the Small Business Administration’s Paycheck Protection Program (PPP) through the CARES Act.
“COVID-19 has had a tremendous impact especially on primary care practices. We live and die by volume. … Our volume in mid-March to mid-May really dropped dramatically,” explained Dr. Fincher, who is also president of the American College of Physicians. “The PPP sustained us for 2 months, enabling us to pay our staff and to remain open and get us up and running on telehealth.”
Starting up telemedicine
Experiencing spotty or no access to broadband Internet is nothing new to rural physicians, but having this problem interfere with their ability to provide care to patients is.
As much of the American health system rapidly embraced telehealth during the pandemic, obtaining access to high-speed Internet has been a major challenge for rural patients, noted Dr. Westfall.
“Some practices were able to quickly adopt some telehealth capacity with phone and video. Changes in payment for telehealth helped. But in some rural communities there was not adequate Internet bandwidth for quality video connections. And some patients did not have the means for high-speed video connections,” Dr. Westfall said.
Indeed, according to a 2019 Pew Research Center survey, 63% of rural Americans say they can access the Internet through a broadband connection at home, compared with 75% and 79% in suburban and urban areas, respectively.
In the Appalachian town of Zanesville, Ohio, for example, family physician Shelly L. Dunmyer, MD, and her colleagues discovered that many patients don’t have Internet access at home. Dr. Fincher has to go to the office to conduct telehealth visits because her own Internet access at home is unpredictable. As for patients, it may take 15 minutes for them to work out technical glitches and find good Internet reception, said Dr. Fincher. For internist Y. Ki Shin, MD, who practices in the coastal town of Montesano in Washington state, about 25% of his practice’s telehealth visits must be conducted by phone because of limitations on video, such as lack of high-speed access.
But telephone visits are often insufficient replacements for appointments via video, according to several rural physicians interviewed for this piece.
“Telehealth can be frustrating at times due to connectivity issues which can be difficult at times in the rural areas,” said Dr. Fincher. “In order for telehealth to be reasonably helpful to patients and physicians to care for people with chronic problems, the patients must have things like blood pressure monitors, glucometers, and scales to address problems like hypertension, diabetes myelitis, and congestive heart failure.”
“If you have the audio and video and the data from these devices, you’re good. If you don’t have these data, and/or don’t have the video you just can’t provide good care,” she explained.
Dr. Dunmyer and her colleagues at Medical Home Primary Care Center in Zanesville, Ohio, found a way to get around the problem of patients not being able to access Internet to participate in video visits from their homes. This involved having her patients drive into her practice’s parking lot to participate in modified telehealth visits. Staffers gave iPads to patients in their cars, and Dr. Dunmyer conducted visits from her office, about 50 yards away.
“We were even doing Medicare wellness visits: Instead of asking them to get up and move around the room, we would sit at the window and wave at them, ask them to get out, walk around the car. We were able to check mobility and all kinds of things that we’d normally do in the office,” Dr. Dunmyer explained in an interview.
The family physician noted that her practice is now conducting fewer parking lot visits since her office is allowing in-person appointments, but that they’re still an option for her patients.
Treating political adversaries
Some rural physicians have experienced strained relationships with patients for reasons other than technology – stark differences in opinion over the pandemic itself. Certain patients are following President Trump’s lead and questioning everything from the pandemic death toll to preventive measures recommended by scientists and medical experts, physicians interviewed by MDedge said.
Patients everywhere share these viewpoints, of course, but research and election results confirm that rural areas are more receptive to conservative viewpoints. In 2018, a Pew Research Center survey reported that rural and urban areas are “becoming more polarized politically,” and “rural areas tend to have a higher concentration of Republicans and Republican-leaning independents.” For example, 40% of rural respondents reported “very warm” or “somewhat warm” feelings toward Donald Trump, compared with just 19% in urban areas.
Dr. Shin has struggled to cope with patients who want to argue about pandemic safety precautions like wearing masks and seem to question whether systemic racism exists.
“We are seeing a lot more people who feel that this pandemic is not real, that it’s a political and not-true infection,” he said in an interview. “We’ve had patients who were angry at us because we made them wear masks, and some were demanding hydroxychloroquine and wanted to have an argument because we’re not going to prescribe it for them.”
In one situation, which he found especially disturbing, Dr. Shin had to leave the exam room because a patient wouldn’t stop challenging him regarding the pandemic. Things have gotten so bad that Dr. Shin has even questioned whether he wants to continue his long career in his small town because of local political attitudes such as opposition to mask-wearing and social distancing.
“Mr. Trump’s misinformation on this pandemic made my job much more difficult. As a minority, I feel less safe in my community than ever,” said Dr. Shin, who described himself as Asian American.
Despite these new stressors, Dr. Shin has experienced some joyful moments while practicing medicine in the pandemic.

He said a recent home visit to a patient who had been hospitalized for over 3 months and nearly died helped him put political disputes with his patients into perspective.
“He was discharged home but is bedbound. He had gangrene on his toes, and I could not fully examine him using video,” Dr. Shin recalled. “It was tricky to find the house, but a very large Trump sign was very helpful in locating it. It was a good visit: He was happy to see me, and I was happy to see that he was doing okay at home.”
“I need to remind myself that supporting Mr. Trump does not always mean that my patient supports Mr. Trump’s view on the pandemic and the race issues in our country,” Dr. Shin added.
The Washington-based internist said he also tells himself that, even if his patients refuse to follow his strong advice regarding pandemic precautions, it does not mean he has failed as a doctor.
“I need to continue to educate patients about the dangers of COVID infection but cannot be angry if they don’t choose to follow my recommendations,” he noted.
Dr. Fincher says her close connection with patients has allowed her to smooth over politically charged claims about the pandemic in the town of Thomson, Georgia, with a population 6,800.
“I have a sense that, even though we may differ in our understanding of some basic facts, they appreciate what I say since we have a long-term relationship built on trust,” she said. This kind of trust, Dr. Fincher suggested, may be more common than in urban areas where there’s a larger supply of physicians, and patients don’t see the same doctors for long periods of time.
“It’s more meaningful when it comes from me, rather than doctors who are [new to patients] every year when their employer changes their insurance,” she noted.
These include struggling with seeing patients virtually and treating patients who have politicized the virus. Additionally, the pandemic has exposed rural practices to greater financial difficulties.
Before the pandemic some rurally based primary care physicians were already working through big challenges, such as having few local medical colleagues to consult and working in small practices with lean budgets. In fact, data gathered by the National Rural Health Association showed that there are only 40 primary care physicians per 100,000 patients in rural regions, compared with 53 in urban areas – and the number of physicians overall is 13 per 10,000 in rural areas, compared with 31 in cities.
In the prepandemic world, for some doctors, the challenges were balanced by the benefits of practicing in these sparsely populated communities with scenic, low-traffic roads. Some perks of practicing in rural areas touted by doctors included having a fast commute, being able to swim in a lake near the office before work, having a low cost of living, and feeling like they are making a difference in their communities as they treat generations of the families they see around town.
But today, new hurdles to practicing medicine in rural America created by the COVID-19 pandemic have caused the hardships to feel heavier than the joys at times for some physicians interviewed by MDedge.
Many independent rural practices in need of assistance were not able to get much from the federal Provider Relief Funds, said John M. Westfall, MD, who is director of the Robert Graham Center for Policy Studies in Family Medicine and Primary Care, in an interview.
“Rural primary care doctors function independently or in smaller critical access hospitals and community health centers,” said Dr. Westfall, who previously practiced family medicine in a small town in Colorado. “Many of these have much less financial reserves so are at risk of cutbacks and closure.”
Jacqueline W. Fincher, MD, an internist based in a tiny Georgia community along the highway between Atlanta and Augusta, said her small practice works on really thin margins and doesn’t have much cushion. At the beginning of the pandemic, all visits were down, and her practice operated at a loss. To help, Dr. Fincher and her colleagues applied for funding from the Small Business Administration’s Paycheck Protection Program (PPP) through the CARES Act.
“COVID-19 has had a tremendous impact especially on primary care practices. We live and die by volume. … Our volume in mid-March to mid-May really dropped dramatically,” explained Dr. Fincher, who is also president of the American College of Physicians. “The PPP sustained us for 2 months, enabling us to pay our staff and to remain open and get us up and running on telehealth.”
Starting up telemedicine
Experiencing spotty or no access to broadband Internet is nothing new to rural physicians, but having this problem interfere with their ability to provide care to patients is.
As much of the American health system rapidly embraced telehealth during the pandemic, obtaining access to high-speed Internet has been a major challenge for rural patients, noted Dr. Westfall.
“Some practices were able to quickly adopt some telehealth capacity with phone and video. Changes in payment for telehealth helped. But in some rural communities there was not adequate Internet bandwidth for quality video connections. And some patients did not have the means for high-speed video connections,” Dr. Westfall said.
Indeed, according to a 2019 Pew Research Center survey, 63% of rural Americans say they can access the Internet through a broadband connection at home, compared with 75% and 79% in suburban and urban areas, respectively.
In the Appalachian town of Zanesville, Ohio, for example, family physician Shelly L. Dunmyer, MD, and her colleagues discovered that many patients don’t have Internet access at home. Dr. Fincher has to go to the office to conduct telehealth visits because her own Internet access at home is unpredictable. As for patients, it may take 15 minutes for them to work out technical glitches and find good Internet reception, said Dr. Fincher. For internist Y. Ki Shin, MD, who practices in the coastal town of Montesano in Washington state, about 25% of his practice’s telehealth visits must be conducted by phone because of limitations on video, such as lack of high-speed access.
But telephone visits are often insufficient replacements for appointments via video, according to several rural physicians interviewed for this piece.
“Telehealth can be frustrating at times due to connectivity issues which can be difficult at times in the rural areas,” said Dr. Fincher. “In order for telehealth to be reasonably helpful to patients and physicians to care for people with chronic problems, the patients must have things like blood pressure monitors, glucometers, and scales to address problems like hypertension, diabetes myelitis, and congestive heart failure.”
“If you have the audio and video and the data from these devices, you’re good. If you don’t have these data, and/or don’t have the video you just can’t provide good care,” she explained.
Dr. Dunmyer and her colleagues at Medical Home Primary Care Center in Zanesville, Ohio, found a way to get around the problem of patients not being able to access Internet to participate in video visits from their homes. This involved having her patients drive into her practice’s parking lot to participate in modified telehealth visits. Staffers gave iPads to patients in their cars, and Dr. Dunmyer conducted visits from her office, about 50 yards away.
“We were even doing Medicare wellness visits: Instead of asking them to get up and move around the room, we would sit at the window and wave at them, ask them to get out, walk around the car. We were able to check mobility and all kinds of things that we’d normally do in the office,” Dr. Dunmyer explained in an interview.
The family physician noted that her practice is now conducting fewer parking lot visits since her office is allowing in-person appointments, but that they’re still an option for her patients.
Treating political adversaries
Some rural physicians have experienced strained relationships with patients for reasons other than technology – stark differences in opinion over the pandemic itself. Certain patients are following President Trump’s lead and questioning everything from the pandemic death toll to preventive measures recommended by scientists and medical experts, physicians interviewed by MDedge said.
Patients everywhere share these viewpoints, of course, but research and election results confirm that rural areas are more receptive to conservative viewpoints. In 2018, a Pew Research Center survey reported that rural and urban areas are “becoming more polarized politically,” and “rural areas tend to have a higher concentration of Republicans and Republican-leaning independents.” For example, 40% of rural respondents reported “very warm” or “somewhat warm” feelings toward Donald Trump, compared with just 19% in urban areas.
Dr. Shin has struggled to cope with patients who want to argue about pandemic safety precautions like wearing masks and seem to question whether systemic racism exists.
“We are seeing a lot more people who feel that this pandemic is not real, that it’s a political and not-true infection,” he said in an interview. “We’ve had patients who were angry at us because we made them wear masks, and some were demanding hydroxychloroquine and wanted to have an argument because we’re not going to prescribe it for them.”
In one situation, which he found especially disturbing, Dr. Shin had to leave the exam room because a patient wouldn’t stop challenging him regarding the pandemic. Things have gotten so bad that Dr. Shin has even questioned whether he wants to continue his long career in his small town because of local political attitudes such as opposition to mask-wearing and social distancing.
“Mr. Trump’s misinformation on this pandemic made my job much more difficult. As a minority, I feel less safe in my community than ever,” said Dr. Shin, who described himself as Asian American.
Despite these new stressors, Dr. Shin has experienced some joyful moments while practicing medicine in the pandemic.
He said a recent home visit to a patient who had been hospitalized for over 3 months and nearly died helped him put political disputes with his patients into perspective.
“He was discharged home but is bedbound. He had gangrene on his toes, and I could not fully examine him using video,” Dr. Shin recalled. “It was tricky to find the house, but a very large Trump sign was very helpful in locating it. It was a good visit: He was happy to see me, and I was happy to see that he was doing okay at home.”
“I need to remind myself that supporting Mr. Trump does not always mean that my patient supports Mr. Trump’s view on the pandemic and the race issues in our country,” Dr. Shin added.
The Washington-based internist said he also tells himself that, even if his patients refuse to follow his strong advice regarding pandemic precautions, it does not mean he has failed as a doctor.
“I need to continue to educate patients about the dangers of COVID infection but cannot be angry if they don’t choose to follow my recommendations,” he noted.
Dr. Fincher says her close connection with patients has allowed her to smooth over politically charged claims about the pandemic in the town of Thomson, Georgia, with a population 6,800.
“I have a sense that, even though we may differ in our understanding of some basic facts, they appreciate what I say since we have a long-term relationship built on trust,” she said. This kind of trust, Dr. Fincher suggested, may be more common than in urban areas where there’s a larger supply of physicians, and patients don’t see the same doctors for long periods of time.
“It’s more meaningful when it comes from me, rather than doctors who are [new to patients] every year when their employer changes their insurance,” she noted.