User login
Match Day 2018: Big increases for neurology
Neurology helped to make the 2018 Main Residency Match the largest ever as the specialty offered and filled over 12% more residency slots than in 2017, according to the National Resident Matching Program (NRMP).
The third consecutive year with a double-digit increase in PGY-1 positions enabled neurology to bring 552 slots to the Match Day party this year: 50.7% were filled with U.S. graduates and the overall fill rate was 97.6%. For all specialties, U.S. graduates filled 58.7% of the record-high 30,232 available spots, and the overall fill rate was 96.1%, the NRMP said in its 2018 Main Residency Match report.
The total number of child neurology PGY-1 positions offered rose to 134, of which 96.3% were filled (75.4% by U.S. graduates). Another seven of eight PGY-2 child neurology positions were filled. Of 26 PGY-2 physician positions offered for child neurology, 12 were filled.
The 2018 Match also set new highs for total positions offered (up 4.4% over last year), total (up 4.7%) and PGY-1 positions (up 4.9%) filled, and total applicants (up 1.7%). “The results of the Match are closely watched because they can be predictors of future physician workforce supply. There also is significant interest in the competitiveness of specialties, as measured by the percentage of positions filled overall and the percentage filled by senior students in U.S. allopathic medical schools,” the NRMP said.
Match Day 2018: A slow year for pediatrics
Pediatrics saw modest gains in residency slots and matches in what was the largest Match Day on record, according to the National Resident Matching Program (NRMP).

The 2018 Match also set new highs for total positions offered (up 4.4% over last year), total positions and PGY-1 positions filled (up 4.7% and 4.9%, respectively), and total applicants (up 1.7%). “The results of the Match are closely watched because they can be predictors of future physician workforce supply. There also is significant interest in the competitiveness of specialties, as measured by the percentage of positions filled overall and the percentage filled by senior students in U.S. allopathic medical schools,” the NRMP said.
Pediatrics saw modest gains in residency slots and matches in what was the largest Match Day on record, according to the National Resident Matching Program (NRMP).
The 2018 Match also set new highs for total positions offered (up 4.4% over last year), total positions and PGY-1 positions filled (up 4.7% and 4.9%, respectively), and total applicants (up 1.7%). “The results of the Match are closely watched because they can be predictors of future physician workforce supply. There also is significant interest in the competitiveness of specialties, as measured by the percentage of positions filled overall and the percentage filled by senior students in U.S. allopathic medical schools,” the NRMP said.
Match Day 2018: Surgery increases positions and matches
Surgery helped to make the 2018 Main Residency Match the largest ever as the specialty offered and filled 3% more residency slots than it did in 2017, according to the National Resident Matching Program (NRMP).
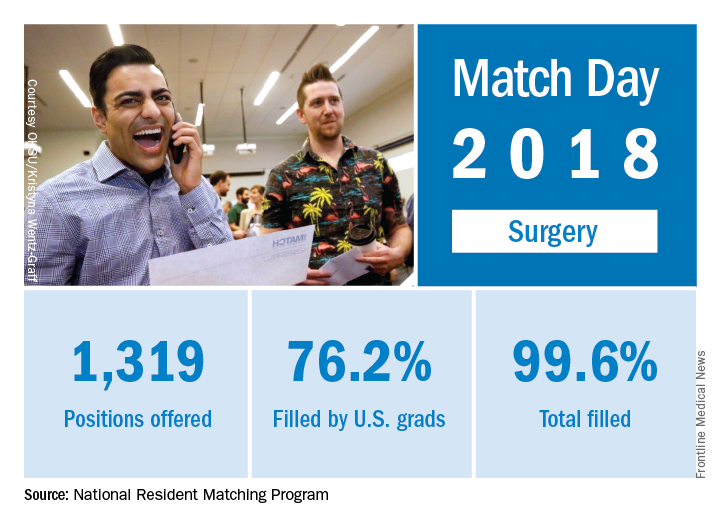
The 2018 Match also set new highs for total positions offered (up 4.4% over last year), total positions and PGY-1 positions filled (up 4.7% and 4.9%, respectively), and total applicants (up 1.7%). “The results of the Match are closely watched because they can be predictors of future physician workforce supply. There also is significant interest in the competitiveness of specialties, as measured by the percentage of positions filled overall and the percentage filled by senior students in U.S. allopathic medical schools,” the NRMP said.
Surgery helped to make the 2018 Main Residency Match the largest ever as the specialty offered and filled 3% more residency slots than it did in 2017, according to the National Resident Matching Program (NRMP).
The 2018 Match also set new highs for total positions offered (up 4.4% over last year), total positions and PGY-1 positions filled (up 4.7% and 4.9%, respectively), and total applicants (up 1.7%). “The results of the Match are closely watched because they can be predictors of future physician workforce supply. There also is significant interest in the competitiveness of specialties, as measured by the percentage of positions filled overall and the percentage filled by senior students in U.S. allopathic medical schools,” the NRMP said.
Match Day 2018: Family medicine increases positions, matches
as the specialty increased residency slots by 8% and accepted 9% more applicants, compared with 2017, according to the National Resident Matching Program (NRMP).
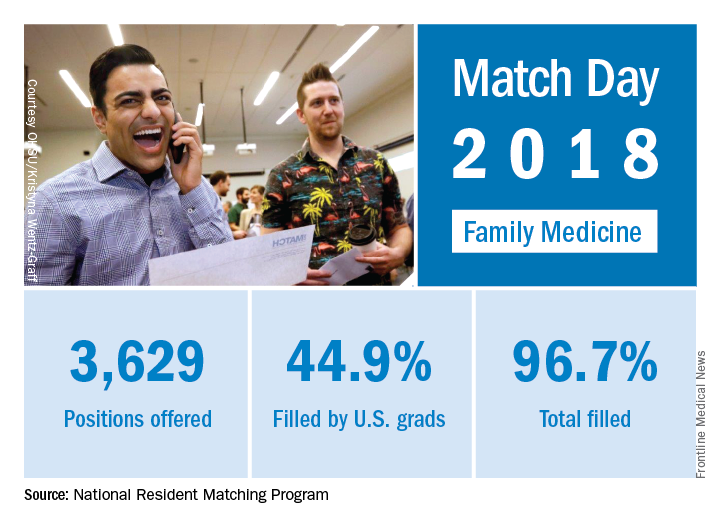
The 2018 Match also set new highs for total positions offered (up 4.4% over last year), total positions and PGY-1 positions filled (up 4.7% and 4.9%, respectively), and total applicants (up 1.7%). “The results of the Match are closely watched because they can be predictors of future physician workforce supply. There also is significant interest in the competitiveness of specialties, as measured by the percentage of positions filled overall and the percentage filled by senior students in U.S. allopathic medical schools,” the NRMP said.
as the specialty increased residency slots by 8% and accepted 9% more applicants, compared with 2017, according to the National Resident Matching Program (NRMP).
The 2018 Match also set new highs for total positions offered (up 4.4% over last year), total positions and PGY-1 positions filled (up 4.7% and 4.9%, respectively), and total applicants (up 1.7%). “The results of the Match are closely watched because they can be predictors of future physician workforce supply. There also is significant interest in the competitiveness of specialties, as measured by the percentage of positions filled overall and the percentage filled by senior students in U.S. allopathic medical schools,” the NRMP said.
Febuxostat increases cardiovascular mortality in CARES trial
ORLANDO – Long-term treatment with febuxostat in gout patients with comorbid cardiovascular disease conferred significantly higher risks of both cardiovascular death and all-cause mortality, compared with allopurinol, in the Food and Drug Administration–mandated postmarketing CARES trial, William B. White, MD, reported at the annual meeting of the American College of Cardiology.
CARES (Cardiovascular Safety of Febuxostat or Allopurinol in Patients with Gout and Cardiovascular Disease) was a prospective, double-blind, 320-center North American clinical trial in which 6,190 patients were randomized to febuxostat (Uloric) at 40-80 mg once daily or 200-600 mg of allopurinol once daily. The postmarketing safety study was required by the FDA as a condition of marketing approval for febuxostat in light of preapproval evidence suggestive of a possible increased risk of cardiovascular events, explained Dr. White, professor of medicine and chief of the division of hypertension and clinical pharmacology at the University of Connecticut, Farmington.
The warning klaxon sounded when investigators scrutinized the individual components of the primary endpoint. They found that the 4.3% cardiovascular death rate in the febuxostat group was significantly higher than the 3.2% rate in the allopurinol group, representing a statistically significant 34% increase in relative risk. The event curves began to separate roughly 30 months into the trial. Moreover, all-cause mortality was also significantly increased in the febuxostat group, by a margin of 7.8% to 6.4%, for a 22% increase in risk.
The increased cardiovascular mortality in the febuxostat group was driven by a higher adjudicated sudden cardiac death rate: 2.7%, compared with 1.8% in the allopurinol group.
In a prespecified per protocol analysis of cardiovascular events occurring while patients were actually on treatment or within 1 month after discontinuation, the key findings remained unchanged: no between-group difference in the primary composite endpoint, but a 49% increase in the relative risk of cardiovascular death in the febuxostat-treated patients.
A hefty 45% of participants stopped taking their assigned drug early. Dr. White said this isn’t unusual; high dropout rates are common in clinical trials of patients with painful conditions. Because of the high lost-to-follow-up rate, however, the investigators hired a private investigator to scour the country looking for missed deaths among enrollees. This turned up an extra 199 deaths. When those were added to the total, all-cause mortality in the febuxostat group was no longer significantly higher than for allopurinol.
The puzzle over nonfatal events
A puzzling key study finding was that except for cardiovascular death, the other components of the primary composite endpoint – that is, nonfatal MI, nonfatal stroke, and urgent revascularization due to unstable angina – were all either neutral or numerically favored febuxostat.
“That’s been the biggest challenge in the trial: The nonfatal events didn’t go in the same direction as the fatal events. And we don’t have a real mechanism to explain why,” Dr. White told a panel of discussants.
“I scanned the medical literature over the last 4 decades, and I did not see another prospective, randomized, double-blind trial in which mortality was increased when none of the nonfatal events were increased. The finding is unique. Statistically there is only a 4% chance that the mortality finding is wrong,” the cardiologist said.
The CARES leadership included rheumatologists and nephrologists as well as cardiologists. Dr. White said he and the others were at a loss to come up with an explanation for the findings.
Patients in the febuxostat arm were significantly more likely to achieve serum urate levels below 6 and 5 mg/dL. Their flare rate was 0.68 events per person-year, similar to the 0.63 per person-year rate in the allopurinol group.
Among the pieces of the study puzzle: The majority of cardiovascular deaths occurred in patients who were no longer on therapy, yet investigators could find no evidence of a legacy effect. The mortality risk was 2.3-fold greater with febuxostat than with allopurinol among patients on NSAID therapy, but there was no significant between-group difference among patients not taking NSAIDs. There was a trend for more cardiovascular deaths with febuxostat than allopurinol among patients not on low-dose aspirin. And the cardiovascular mortality was 2.2-fold greater in the febuxostat arm than with allopurinol in patients on colchicine during the study.
Notably, prior to febuxostat’s marketing approval there were extensive studies of the drug’s potential effect on left ventricular function, thrombotic potential, possible arrhythmogenic effects, and impact upon atherosclerosis. Among these investigations was a QT-interval study conducted using febuxostat doses four times higher than the maximum therapeutic dose, which was prescient given the increased sudden cardiac death rate in the subsequent CARES trial. Yet no concerning signals were seen in any of this work, he continued.
“We’re still looking at some correlates that might have an impact. For example, my rheumatologist colleagues feel very strongly that we need to look really extensively at gout flares, even though rates were not that different between the two treatment groups. Gout flares are known to increase oxidative stress and perhaps cause temporary increases in endothelial dysfunction and possibly vasomotor abnormalities,” Dr. White said.
One would think, though, that if gout flares figured in the increase in cardiovascular mortality they would also have been associated with more urgent revascularization for unstable angina, when in fact the rate was actually numerically lower in the febuxostat group, he noted.
Discussant Athena Poppas, MD, director of the Lifespan Cardiovascular Institute at Rhode Island Hospital, Providence, said she couldn’t determine how much of the increased cardiovascular mortality in the febuxostat patients was due to the drug and how much resulted from the suboptimal use of guideline-directed medical therapy across both study arms. At baseline, only 60% of study participants – all by definition at high cardiovascular risk – were on aspirin, just under 75% were on lipid-lowering therapy, 58% were on a beta blocker, and 70% were on a renin-angiotensin system blocker, even though the majority of subjects had stage 3 chronic kidney disease.
Implications of findings and FDA’s next steps
Another discussant, C. Noel Bairey Merz, MD, called the CARES findings “curious.” But despite the lack of a plausible mechanistic explanation for the results, she said, the implications are clear.
“I would conclude that because your modified intention-to-treat as well as your per protocol analyses were consistent for the death endpoint, then despite the high dropout rate, that finding is relatively robust and probably should be used to inform policy,” said Dr. Merz, director of the Women’s Heart Center and the Preventive and Rehabilitative Cardiac Center in the Cedars-Sinai Heart Institute and professor of medicine at the University of California, Los Angeles.
At a press conference, Dr. White said the FDA will spend several months poring over the CARES results and that it would be premature to speculate on what action the agency might take on febuxostat. The drug is prescribed far less frequently than allopurinol for the nation’s estimated 8.2 million gout patients.
“I would certainly be concerned about our findings. However, rheumatologists take care of very ill patients and all the drugs they use have morbidity. So if they’re having substantial efficacy and the person has been on febuxostat for 8 years, I suspect they’re going to continue to give that drug to him,” he said.
Simultaneously with Dr. White’s presentation at ACC 2018, the CARES results were published in the New England Journal of Medicine (N Engl J Med. 2018 Mar 12. doi: 10.1056/NEJMoa1710895).
The CARES trial was funded by Takeda. Dr. White reported serving as a consultant to that company and Novartis and receiving research funding from the National Institutes of Health.
SOURCE: White W et al. ACC 18.
REPORTING FROM ACC 18
Key clinical point: Gout patients on febuxostat were 34% more likely to die of cardiovascular causes than were those on allopurinol.
Major finding: Death due to cardiovascular causes occurred in 4.3% of febuxostat-treated patients and 3.2% assigned to allopurinol.
Study details: This prospective, randomized, double-blind, 320-center clinical trial included nearly 6,200 gout patients with comorbid cardiovascular disease.
Disclosures: The FDA-mandated CARES trial was sponsored by Takeda. The study presenter is a consultant to the company.
Source: White W et al. ACC 18.
Prevalence and Impact of Self-Citation in Academic Orthopedic Surgery
ABSTRACT
The h-index is a commonly utilized metric for academic productivity. Previous studies have proposed that self-citation may limit the utility of the h-index. The purpose of this study is to evaluate the impact of self-citation on the h-index among orthopedic investigators. The study cohort consisted of program directors, chairpersons, and faculty at orthopedic surgery residency programs in the United States. The Scopus database was used to determine the h-index and number of citations ± self-citations. The total number of publications was correlated with the change in the h-index via self-citation. A total of 463 researchers were included (198 National Institutes of Health-funded faculty, 147 chairpersons, 118 program directors). Of these researchers, 83.8% cited previous work at least once (mean, 123.9 ± 277.6). Self-citations accounted for 5.8% of all citations. Including these citations increased the author h-index from 18.5 ± 14.9 to 19.2 ± 15.6 (P < .001). A minority of researchers (36.3%, P < .001) had increased their h-index via self-citation (range, 0-11). The proportional increase in the h-index via self-citation was positively related to the number of publications (P < .001). While the practice of self-citation is prevalent in orthopedics, its impact on the h-index is minimal for most researchers. With more publications, researchers can increase their h-index to a greater degree via self-citation.
Continue to: The competitive nature of academic research...
The competitive nature of academic research requires objective metrics to define career end points, such as promotion and funding procurement. While various criteria are used to assess performance in academia, publications and research funding are particularly regarded.1 Quantifying research dollars is relatively straightforward, but measuring research productivity is more complex. Not all articles are created equal, and disparities exist regarding effort and the ultimate impact of articles. In 2005, a physicist created the h-index to measure both research impact and productivity.2 As a bibliometric, the h-index equals the number of publications h that have been cited at least h times. Given its simplicity, the h-index has gained wide popularity in diverse medical specialties, including orthopedic surgery.3 Other recent studies have applied the h-index to hand surgery and spine surgery.4,5
Importantly, some authors have raised concerns regarding potential limitations of the h-index. One potentially significant limitation is the ability of authors to artificially inflate their h-index via self-citation. The impact of this practice is of particular interest as the h-index becomes widely adopted as a metric for promotion at many academic institutions.6-7 Furthermore, scholarly productivity has remained a critical component of successful grant funding procurement, and future grant funding applications may evaluate the h-index.8-10
The purpose of this study is to determine the prevalence and impact of self-citation on the h-index in a large cohort of orthopedic investigators. Given their high level of investment in academic orthopedic surgery, we focused on program directors, chairpersons, and National Institutes of Health (NIH)-funded research faculty at orthopedic surgery residency programs.
METHODS
INCLUSION CRITERIA
This study qualified as non-human and non-animal research and received exemption per the standing policy of the Institutional Review Board. The Fellowship and Residency Electronic Interactive Database (FREIDA) was accessed to generate a list of orthopedic residency program directors.11 This database was also used to generate a list of allopathic orthopedic surgery residency programs. Official program websites were accessed to generate a list of orthopedic chairpersons. Lastly, the NIH RePORTER was used to generate a list of basic science orthopedic investigators who received funding anytime during 2011 to 2014.12 This methodology was used due to the lack of reporting of basic science investigators on program websites. A list of NIH-funded orthopedic investigators was cross-referenced via an online search to isolate a cohort of PhD investigators.
Orthopedic faculty were defined as chairpersons, program directors, or NIH-funded investigators. In cases of overlap, preference was given in that order. Orthopedic investigators who had not published an article after 1995 were excluded (6 chairpersons, 1 program director).
BIBLIOMETRIC ANALYSIS
While several resources exist to calculate the h-index, the Scopus database (Elsevier) is one of the easiest programs to use.13 Author entries are created via institutional affiliations, thereby alleviating the need for manual reconciliations. Investigators were identified on Scopus via “author last name” and “first name, middle initial.” For each author, publications were screened for relevance to the field of orthopedics. Affiliated institutions were cross-referenced with information obtained from individual program websites. The “view h-graph” feature was used to calculate the number of publications, h-index, and number of citations. Then, the “Exclude self-citations” feature was used to calculate the number of corrected citations and the h-index excluding self-citations. Metrics were calculated over a 2-day period.
Continue to: STATISTICAL ANALYSIS
STATISTICAL ANALYSIS
Bibliometric analyses were presented descriptively with means ± standard deviation. After testing for normality, differences in the h-index between groups were assessed via analysis of variance tests. The proportional increase in the number of citations and the h-index were calculated by dividing the difference between the before and after exclusion of self-citations by the total number of citations before exclusion. The relationship between the number of publications and the proportional change in the h-index was assessed via calculation of the Spearman correlation coefficient. The independent variable was the number of publications, and the proportional increase in the h-index via self-citation was the dependent variable. Statistical tests were performed on STATA 13 (StataCorp) and the results considered significant if P < .05. Figures were created using GraphPad Prism 6.02 Software.
RESULTS
A total of 463 orthopedic investigators were included (147 chairpersons, 118 program directors, and 198 NIH-funded faculty) (Table 1). On average, these researchers produced 72.3 ± 83.0 articles and referenced 2139 ± 3222 articles (mean, 29.6 references per article). The cumulative h-index was 19.2 ± 15.6, and was the highest among NIH-funded researchers (24.3 ± 17.0) (P < .001). In all, 83.8% of orthopedic investigators self-cited their previous work at least once, and the total number of self-citations was highest among NIH-funded investigators (221 ± 355) (P < .001). After these self-citations were excluded, the h-index changed by 0.6 ± 1.1 for all investigators, and this change was greatest among NIH-funded researchers (1.1 ± 1.3) (P < .001).
Table 1. Effect of Self-Citation on NIH-funded Investigators, Chairpersons, and Program Directors in Orthopedics
| Investigator | N (%) | Articles, n (mean ± SD) |
Total Citations (mean ± SD)
| h-index | Self-Citations (mean ± SD) | Corrected h-index | ∆ h-index |
| NIH-funded | 198 (42.8) | 87.6 ± 84.9 | 3086 ± 3799 | 24.3 ± 17.0 | 221 ± 355 | 23.2 ± 16.3 | 1.1 ± 1.3 |
| Chairperson | 147 (31.7) | 85.3 ± 95.5 | 2151 ± 3098 | 19.9 ± 15.0 | 85.2 ± 221 | 19.5 ± 14.5 | 0.4 ± 0.8 |
| Program Director | 118 (25.5) | 30.5 ± 35.9 | 536.8 ± 785 | 9.6 ± 7.2 | 8.8 ± 19.9 | 9.5 ± 7.1 | 0.1 ± 0.3 |
| Total | 463 (100) | 72.3 ± 83.0 | 2139 ± 3222 | 19.2 ± 15.6 | 123.9 ± 277.6 | 18.5 ± 14.9 | 0.6 ± 1.1 |
Abbreviation: NIH, National Institutes of Health.
Most orthopedic investigators did not increase their h-index via self-citation (63.7%, P < .001). Table 2 categorizes investigators by changes in their h-index after excluding self-citations (range, 0-11). The maximal change in the h-index was seen in the most prolific group of investigators, who produced 261.0 ± 149.3 articles. In this group, the h-index increased by 11.1% ± 5.2%. The Figure investigates the relationship between the number of articles and the proportional increase in the h-index. The number of publications was positively correlated with the change in h-index after self-citations were excluded (r = 0.448, P < .001).
Table 2. Stratification of Orthopedic Researcher Investigators by Change in h-index After Self-Citation
∆ h-index
| N (%) |
Articles (mean ± SD)
| Self-Citations (mean ± SD) |
h-index (mean ± SD) | % Increase in h-index |
| 0 | 295 (63.7) | 43.8 ± 51.3 | 27.6 ± 58.4 | 13.1 ± 10.7 | 0 |
| 1 | 101 (21.8) | 87.9 ± 68.3 | 126.0 ± 130.6 | 24.0 ± 13.3 | 5.9 ± 4.1 |
| 2 | 42 (9.1) | 141.9 ± 111.1 | 331.6 ± 318.0 | 32.4 ± 16.6 | 8.4 ± 5.5 |
| 3 | 14 (3.0) | 203.1 ± 92.6 | 611.6 ± 332.9 | 45.4 ± 14.9 | 7.6 ± 3.6 |
| 4+ | 11 (2.4) | 261.0 ± 149.3 | 1277.1 ± 692.4 | 53.1 ± 18.9 | 11.1 ± 5.2 |
DISCUSSION
The practice of self-citation is widely prevalent among experienced orthopedic investigators. However, this practice seems to have minimal impact on the h-index for most investigators. Self-citation had a measurable impact on the h-index only after an investigator had many publications. At a mean of 87.9 ± 68.3 articles, investigators had a ∆h-index of 1. This represented a mean 5.9% increase. Overall, these findings underscore the utility of the h-index in assessing scholarly impact and ameliorate concerns over bibliometric manipulation.

Among a large group of experienced orthopedic investigators, self-citation has minimal effect on the h-index. Importantly, most investigators (63.7%) did not experience a full integer increase in their h-index. At a threshold of ∆ h-index increase of 1, investigators had impressive h-indices (24.0 ± 13.3), which eclipsed those of recent studies of hand surgeons (10.2 ± 9.9) and spine surgeons (13.6 ± 8.7).4,5 This finding suggests that committees for academic promotion in orthopedic surgery may disregard the impact of self-citation on the h-index. While the thresholds for promotion have not been defined in the orthopedic literature, a study in plastic surgery established an h-index threshold of 14.5 for promotion from associate to full professor.14 It may be, however, that h-indices are higher among orthopedic surgeons, as a previous study reported an h-index of 20 among full professors.15 Future research is needed to determine thresholds for promotion within orthopedic surgery, as the h-index varies by specialty according to unique citation patterns.
Continue to: It is worth highlighting...
It is worth highlighting the academic performance of NIH-funded PhD researchers in orthopedics. Even including training grant awardees in this group, this cohort exceeded the academic productivity of their orthopedic chairpersons, as measured by the h-index. Previous studies in urology, neurosurgery, and otolaryngology have demonstrated the impact of NIH-funding on academic productivity.8-10 Ultimately, orthopedic departments could increase academic productivity by recruiting more PhD investigators with NIH funding.
In contrast to academic radiology,16 this study demonstrated a correlation between the number of publications and the increase in h-index via self-citation. Several reasons may help explain this disparity. The first reason is a technical one, as at the time of this study, the Scopus database had been updated to include citations before 1996. Considering that the h-index increases over time as older publications are cited, the exclusion of older articles is a significant limitation of previous h-index studies. Applying the same logic, the mean h-index for chairpersons of 19.9 quoted in this study contradicts a recent study, which quoted a mean h-index of 15.3.3 This previous study utilized citations that were limited to articles published after 1996.
Previous work on self-citation in the field of orthopedics has been limited to its influence on journal impact factors. Our results build on this literature in several important ways. Firstly, the calculation of a journal’s impact factor is a highly scrutinized process, and authors have criticized the mechanisms employed by editors to inflate impact factors.17 One study reported that 20% of authors have been encouraged to cite a journal during the revision process.18 Self-citation practices have been demonstrated in journals of cardiology,19 diabetes,20 anesthesia,21 and medicine.22 A study using a hypothetical model to assess the maximum potential for h-index increase by self-citation demonstrated an h-index inflation of 5 points over 20 years (5/14, 35.7%) by publishing 3 papers per year with 3 self-citations each.23 This study highlights a potential limitation of the h-index, but our study observed an h-index inflation of ≥4 in only 11 researchers (2.4%). Thus, results from our study ameliorate self-citation concerns in academic orthopedic surgery.
There are several limitations to this study that offer future areas of research. First, the validity of the h-index academic promotion in orthopedic surgery has not been evaluated. This was a motivation for the present study, and the authors have ongoing efforts to characterize the h-index in a larger cohort of orthopedic investigators. Importantly, an appropriate amount of self-citation was not established. It may be necessary for orthopedic researchers to cite their works as they become experts on a specific topic. Lastly, our analyses are prone to limitations inherent in the h-index, which does not account for author contribution or journal impact factors. Despite these limitations, we show that for most orthopedic researchers, the practice of self-citation does not impact the h-index.
In summary, self-citation is a widely prevalent practice among orthopedic investigators, but this practice has minimal impact on an author’s h-index. Approximately one third of orthopedic faculty in our study had a higher h-index due to self-citation. Greater h-index inflation through self-citation correlated with more publications. For the majority of orthopedic faculty, however, self-citation did not inflate the h-index, suggesting that promotional committees may disregard this concern when using the h-index as an adjunct measure for career advancement.
1. Atasoylu AA, Wright SM, Beasley BW, et al. Promotion criteria for clinician-educators. J Gen Intern Med. 2003;18(9):711-716.
2. Hirsch JE. An index to quantify an individual's scientific research output. Proc Natl Acad Sci U S A. 2005;102(46):16569-16572.
3. Stavrakis AI, Patel AD, Burke ZD, et al. The role of chairman and research director in influencing scholarly productivity and research funding in academic orthopaedic surgery. J Orthop Res. 2015;33(10)1407-1411. doi:10.1002/jor.22919.
4. Lopez J, Susarla SM, Swanson EW, Calotta N, Lifchez SD. The association of the H-index and academic rank among full-time academic hand surgeons affiliated with fellowship programs. J Hand Surg Am. 2015;40(7):1434-1441. doi:10.1016/j.jhsa.2015.03.026.
5. Schoenfeld AJ, Bhalla A, George J, Harris MB, Bono CM. Academic productivity and contributions to the literature among spine surgery fellowship faculty. Spine J. 2015;15(10)2126-2131. doi:10.1016/j.spinee.2015.03.026.
6. Jackson JB. Promotion at the Johns Hopkins School of Medicine. Johns Hopkins Medicine. https://www.hopkinsmedicine.org/gim/useful_links/PPC%20Promotion.pdf. Accessed February 1, 2015.
7. Appointments, promotion, and tenure. The Ohio State University School of Medicine. https://oaa.osu.edu/sites/default/files/uploads/governance-documents/college-of-medicine/surgery/Surgery_APT_5-20-14.pdf. Accessed February 1, 2015.
8. Colaco M, Svider PF, Mauro KM, Eloy JA, Jackson-Rosario I. Is there a relationship between National Institutes of Health funding and research impact on academic urology? J Urol .2013;190(3):999-1003. doi:10.1016/j.juro.2013.02.3186.
9. Svider PF, Husain Q, Folbe AJ, Couldwell WT, Liu JK, Eloy JA. Assessing National Institutes of Health funding and scholarly impact in neurological surgery. J Neurosurg. 2014;120(1):191-196. doi:10.3171/2013.8.JNS13938.
10. Svider PF, Mauro KM, Sanghvi S, Setzen M, Baredes S, Eloy JA. Is NIH funding predictive of greater research productivity and impact among academic otolaryngologists? Laryngoscope. 2013;123(1):118-122. doi:10.1002/lary.23659.
11. American Medical Association. FREIDA Online. http://www.ama-assn.org/ama/pub/education-careers/graduate-medical-education/freida-online.page? Accessed February 1, 2015.
12. NIH. Research Portfolio Online Reporting Tools. https://projectreporter.nih.gov/reporter.cfm. Accessed February 1, 2015.
13. Falagas ME, Pitsouni EI, Malietzis GA, Pappas G. Comparison of PubMed, Scopus, Web of Science, and Google Scholar: strengths and weaknesses. FASEB Journal. 2008;22(2):338-342. doi:10.1096/fj.07-9492LSF.
14. Gast KM, Kuzon WM Jr, Waljee JF. Bibliometric indices and academic promotion within plastic surgery. Plast Reconstr Surg. 2014;134(5):838e-844e. doi:10.1097/PRS.0000000000000594.
15. Svider PF, Pashkova AA, Choudhry Z, et al. Comparison of scholarly impact among surgical specialties: an examination of 2429 academic surgeons. Laryngoscope. 2013;123(4):884-889. doi:10.1002/lary.23951.
16. Rad AE, Shahgholi L, Kallmes D. Impact of self-citation on the H index in the field of academic radiology. Acad Radiol. 2012;19(4):455-457. doi:10.1016/j.acra.2011.11.013.
17. Hakkalamani S, Rawal A, Hennessy MS, Parkinson RW. The impact factor of seven orthopaedic journals: factors influencing it. J Bone Joint Surg Br. 2006;88(2):159-162. doi:10.1302/0301-620X.88B2.16983.
18. Foley JA, Della Sala S. The impact of self-citation. Cortex. 2010;46(6):802-810. doi:10.1016/j.cortex.2010.01.004.
19. Opthof T. Inflation of impact factors by journal self-citation in cardiovascular science. Neth Heart J. 2013;21(4):163-165. doi:10.1007/s12471-013-0384-0.
20. Gami AS, Montori VM, Wilczynski NL, Haynes RB. Author self-citation in the diabetes literature. CMAJ. 2004;170(13):1925-1927.
21. Fassoulaki A, Paraskeva A, Papilas K, Karabinis G. Self-citations in six anaesthesia journals and their significance in determining the impact factor. Br J Anaesth. 2000;84(2):266-269.
22. Kulkarni AV, Aziz B, Shams I, Busse JW. Author self-citation in the general medicine literature. PloS One. 2011;6(6): e20885. doi:10.1371/journal.pone.0020885.
23. Bartneck C, Kokkelmans S. Detecting h-index manipulation through self-citation analysis. Scientometrics. 2011;87(1):85-98. doi:10.1007/s11192-010-0306-5.
ABSTRACT
The h-index is a commonly utilized metric for academic productivity. Previous studies have proposed that self-citation may limit the utility of the h-index. The purpose of this study is to evaluate the impact of self-citation on the h-index among orthopedic investigators. The study cohort consisted of program directors, chairpersons, and faculty at orthopedic surgery residency programs in the United States. The Scopus database was used to determine the h-index and number of citations ± self-citations. The total number of publications was correlated with the change in the h-index via self-citation. A total of 463 researchers were included (198 National Institutes of Health-funded faculty, 147 chairpersons, 118 program directors). Of these researchers, 83.8% cited previous work at least once (mean, 123.9 ± 277.6). Self-citations accounted for 5.8% of all citations. Including these citations increased the author h-index from 18.5 ± 14.9 to 19.2 ± 15.6 (P < .001). A minority of researchers (36.3%, P < .001) had increased their h-index via self-citation (range, 0-11). The proportional increase in the h-index via self-citation was positively related to the number of publications (P < .001). While the practice of self-citation is prevalent in orthopedics, its impact on the h-index is minimal for most researchers. With more publications, researchers can increase their h-index to a greater degree via self-citation.
Continue to: The competitive nature of academic research...
The competitive nature of academic research requires objective metrics to define career end points, such as promotion and funding procurement. While various criteria are used to assess performance in academia, publications and research funding are particularly regarded.1 Quantifying research dollars is relatively straightforward, but measuring research productivity is more complex. Not all articles are created equal, and disparities exist regarding effort and the ultimate impact of articles. In 2005, a physicist created the h-index to measure both research impact and productivity.2 As a bibliometric, the h-index equals the number of publications h that have been cited at least h times. Given its simplicity, the h-index has gained wide popularity in diverse medical specialties, including orthopedic surgery.3 Other recent studies have applied the h-index to hand surgery and spine surgery.4,5
Importantly, some authors have raised concerns regarding potential limitations of the h-index. One potentially significant limitation is the ability of authors to artificially inflate their h-index via self-citation. The impact of this practice is of particular interest as the h-index becomes widely adopted as a metric for promotion at many academic institutions.6-7 Furthermore, scholarly productivity has remained a critical component of successful grant funding procurement, and future grant funding applications may evaluate the h-index.8-10
The purpose of this study is to determine the prevalence and impact of self-citation on the h-index in a large cohort of orthopedic investigators. Given their high level of investment in academic orthopedic surgery, we focused on program directors, chairpersons, and National Institutes of Health (NIH)-funded research faculty at orthopedic surgery residency programs.
METHODS
INCLUSION CRITERIA
This study qualified as non-human and non-animal research and received exemption per the standing policy of the Institutional Review Board. The Fellowship and Residency Electronic Interactive Database (FREIDA) was accessed to generate a list of orthopedic residency program directors.11 This database was also used to generate a list of allopathic orthopedic surgery residency programs. Official program websites were accessed to generate a list of orthopedic chairpersons. Lastly, the NIH RePORTER was used to generate a list of basic science orthopedic investigators who received funding anytime during 2011 to 2014.12 This methodology was used due to the lack of reporting of basic science investigators on program websites. A list of NIH-funded orthopedic investigators was cross-referenced via an online search to isolate a cohort of PhD investigators.
Orthopedic faculty were defined as chairpersons, program directors, or NIH-funded investigators. In cases of overlap, preference was given in that order. Orthopedic investigators who had not published an article after 1995 were excluded (6 chairpersons, 1 program director).
BIBLIOMETRIC ANALYSIS
While several resources exist to calculate the h-index, the Scopus database (Elsevier) is one of the easiest programs to use.13 Author entries are created via institutional affiliations, thereby alleviating the need for manual reconciliations. Investigators were identified on Scopus via “author last name” and “first name, middle initial.” For each author, publications were screened for relevance to the field of orthopedics. Affiliated institutions were cross-referenced with information obtained from individual program websites. The “view h-graph” feature was used to calculate the number of publications, h-index, and number of citations. Then, the “Exclude self-citations” feature was used to calculate the number of corrected citations and the h-index excluding self-citations. Metrics were calculated over a 2-day period.
Continue to: STATISTICAL ANALYSIS
STATISTICAL ANALYSIS
Bibliometric analyses were presented descriptively with means ± standard deviation. After testing for normality, differences in the h-index between groups were assessed via analysis of variance tests. The proportional increase in the number of citations and the h-index were calculated by dividing the difference between the before and after exclusion of self-citations by the total number of citations before exclusion. The relationship between the number of publications and the proportional change in the h-index was assessed via calculation of the Spearman correlation coefficient. The independent variable was the number of publications, and the proportional increase in the h-index via self-citation was the dependent variable. Statistical tests were performed on STATA 13 (StataCorp) and the results considered significant if P < .05. Figures were created using GraphPad Prism 6.02 Software.
RESULTS
A total of 463 orthopedic investigators were included (147 chairpersons, 118 program directors, and 198 NIH-funded faculty) (Table 1). On average, these researchers produced 72.3 ± 83.0 articles and referenced 2139 ± 3222 articles (mean, 29.6 references per article). The cumulative h-index was 19.2 ± 15.6, and was the highest among NIH-funded researchers (24.3 ± 17.0) (P < .001). In all, 83.8% of orthopedic investigators self-cited their previous work at least once, and the total number of self-citations was highest among NIH-funded investigators (221 ± 355) (P < .001). After these self-citations were excluded, the h-index changed by 0.6 ± 1.1 for all investigators, and this change was greatest among NIH-funded researchers (1.1 ± 1.3) (P < .001).
Table 1. Effect of Self-Citation on NIH-funded Investigators, Chairpersons, and Program Directors in Orthopedics
| Investigator | N (%) | Articles, n (mean ± SD) |
Total Citations (mean ± SD)
| h-index | Self-Citations (mean ± SD) | Corrected h-index | ∆ h-index |
| NIH-funded | 198 (42.8) | 87.6 ± 84.9 | 3086 ± 3799 | 24.3 ± 17.0 | 221 ± 355 | 23.2 ± 16.3 | 1.1 ± 1.3 |
| Chairperson | 147 (31.7) | 85.3 ± 95.5 | 2151 ± 3098 | 19.9 ± 15.0 | 85.2 ± 221 | 19.5 ± 14.5 | 0.4 ± 0.8 |
| Program Director | 118 (25.5) | 30.5 ± 35.9 | 536.8 ± 785 | 9.6 ± 7.2 | 8.8 ± 19.9 | 9.5 ± 7.1 | 0.1 ± 0.3 |
| Total | 463 (100) | 72.3 ± 83.0 | 2139 ± 3222 | 19.2 ± 15.6 | 123.9 ± 277.6 | 18.5 ± 14.9 | 0.6 ± 1.1 |
Abbreviation: NIH, National Institutes of Health.
Most orthopedic investigators did not increase their h-index via self-citation (63.7%, P < .001). Table 2 categorizes investigators by changes in their h-index after excluding self-citations (range, 0-11). The maximal change in the h-index was seen in the most prolific group of investigators, who produced 261.0 ± 149.3 articles. In this group, the h-index increased by 11.1% ± 5.2%. The Figure investigates the relationship between the number of articles and the proportional increase in the h-index. The number of publications was positively correlated with the change in h-index after self-citations were excluded (r = 0.448, P < .001).
Table 2. Stratification of Orthopedic Researcher Investigators by Change in h-index After Self-Citation
∆ h-index
| N (%) |
Articles (mean ± SD)
| Self-Citations (mean ± SD) |
h-index (mean ± SD) | % Increase in h-index |
| 0 | 295 (63.7) | 43.8 ± 51.3 | 27.6 ± 58.4 | 13.1 ± 10.7 | 0 |
| 1 | 101 (21.8) | 87.9 ± 68.3 | 126.0 ± 130.6 | 24.0 ± 13.3 | 5.9 ± 4.1 |
| 2 | 42 (9.1) | 141.9 ± 111.1 | 331.6 ± 318.0 | 32.4 ± 16.6 | 8.4 ± 5.5 |
| 3 | 14 (3.0) | 203.1 ± 92.6 | 611.6 ± 332.9 | 45.4 ± 14.9 | 7.6 ± 3.6 |
| 4+ | 11 (2.4) | 261.0 ± 149.3 | 1277.1 ± 692.4 | 53.1 ± 18.9 | 11.1 ± 5.2 |
DISCUSSION
The practice of self-citation is widely prevalent among experienced orthopedic investigators. However, this practice seems to have minimal impact on the h-index for most investigators. Self-citation had a measurable impact on the h-index only after an investigator had many publications. At a mean of 87.9 ± 68.3 articles, investigators had a ∆h-index of 1. This represented a mean 5.9% increase. Overall, these findings underscore the utility of the h-index in assessing scholarly impact and ameliorate concerns over bibliometric manipulation.
Among a large group of experienced orthopedic investigators, self-citation has minimal effect on the h-index. Importantly, most investigators (63.7%) did not experience a full integer increase in their h-index. At a threshold of ∆ h-index increase of 1, investigators had impressive h-indices (24.0 ± 13.3), which eclipsed those of recent studies of hand surgeons (10.2 ± 9.9) and spine surgeons (13.6 ± 8.7).4,5 This finding suggests that committees for academic promotion in orthopedic surgery may disregard the impact of self-citation on the h-index. While the thresholds for promotion have not been defined in the orthopedic literature, a study in plastic surgery established an h-index threshold of 14.5 for promotion from associate to full professor.14 It may be, however, that h-indices are higher among orthopedic surgeons, as a previous study reported an h-index of 20 among full professors.15 Future research is needed to determine thresholds for promotion within orthopedic surgery, as the h-index varies by specialty according to unique citation patterns.
Continue to: It is worth highlighting...
It is worth highlighting the academic performance of NIH-funded PhD researchers in orthopedics. Even including training grant awardees in this group, this cohort exceeded the academic productivity of their orthopedic chairpersons, as measured by the h-index. Previous studies in urology, neurosurgery, and otolaryngology have demonstrated the impact of NIH-funding on academic productivity.8-10 Ultimately, orthopedic departments could increase academic productivity by recruiting more PhD investigators with NIH funding.
In contrast to academic radiology,16 this study demonstrated a correlation between the number of publications and the increase in h-index via self-citation. Several reasons may help explain this disparity. The first reason is a technical one, as at the time of this study, the Scopus database had been updated to include citations before 1996. Considering that the h-index increases over time as older publications are cited, the exclusion of older articles is a significant limitation of previous h-index studies. Applying the same logic, the mean h-index for chairpersons of 19.9 quoted in this study contradicts a recent study, which quoted a mean h-index of 15.3.3 This previous study utilized citations that were limited to articles published after 1996.
Previous work on self-citation in the field of orthopedics has been limited to its influence on journal impact factors. Our results build on this literature in several important ways. Firstly, the calculation of a journal’s impact factor is a highly scrutinized process, and authors have criticized the mechanisms employed by editors to inflate impact factors.17 One study reported that 20% of authors have been encouraged to cite a journal during the revision process.18 Self-citation practices have been demonstrated in journals of cardiology,19 diabetes,20 anesthesia,21 and medicine.22 A study using a hypothetical model to assess the maximum potential for h-index increase by self-citation demonstrated an h-index inflation of 5 points over 20 years (5/14, 35.7%) by publishing 3 papers per year with 3 self-citations each.23 This study highlights a potential limitation of the h-index, but our study observed an h-index inflation of ≥4 in only 11 researchers (2.4%). Thus, results from our study ameliorate self-citation concerns in academic orthopedic surgery.
There are several limitations to this study that offer future areas of research. First, the validity of the h-index academic promotion in orthopedic surgery has not been evaluated. This was a motivation for the present study, and the authors have ongoing efforts to characterize the h-index in a larger cohort of orthopedic investigators. Importantly, an appropriate amount of self-citation was not established. It may be necessary for orthopedic researchers to cite their works as they become experts on a specific topic. Lastly, our analyses are prone to limitations inherent in the h-index, which does not account for author contribution or journal impact factors. Despite these limitations, we show that for most orthopedic researchers, the practice of self-citation does not impact the h-index.
In summary, self-citation is a widely prevalent practice among orthopedic investigators, but this practice has minimal impact on an author’s h-index. Approximately one third of orthopedic faculty in our study had a higher h-index due to self-citation. Greater h-index inflation through self-citation correlated with more publications. For the majority of orthopedic faculty, however, self-citation did not inflate the h-index, suggesting that promotional committees may disregard this concern when using the h-index as an adjunct measure for career advancement.
1. Atasoylu AA, Wright SM, Beasley BW, et al. Promotion criteria for clinician-educators. J Gen Intern Med. 2003;18(9):711-716.
2. Hirsch JE. An index to quantify an individual's scientific research output. Proc Natl Acad Sci U S A. 2005;102(46):16569-16572.
3. Stavrakis AI, Patel AD, Burke ZD, et al. The role of chairman and research director in influencing scholarly productivity and research funding in academic orthopaedic surgery. J Orthop Res. 2015;33(10)1407-1411. doi:10.1002/jor.22919.
4. Lopez J, Susarla SM, Swanson EW, Calotta N, Lifchez SD. The association of the H-index and academic rank among full-time academic hand surgeons affiliated with fellowship programs. J Hand Surg Am. 2015;40(7):1434-1441. doi:10.1016/j.jhsa.2015.03.026.
5. Schoenfeld AJ, Bhalla A, George J, Harris MB, Bono CM. Academic productivity and contributions to the literature among spine surgery fellowship faculty. Spine J. 2015;15(10)2126-2131. doi:10.1016/j.spinee.2015.03.026.
6. Jackson JB. Promotion at the Johns Hopkins School of Medicine. Johns Hopkins Medicine. https://www.hopkinsmedicine.org/gim/useful_links/PPC%20Promotion.pdf. Accessed February 1, 2015.
7. Appointments, promotion, and tenure. The Ohio State University School of Medicine. https://oaa.osu.edu/sites/default/files/uploads/governance-documents/college-of-medicine/surgery/Surgery_APT_5-20-14.pdf. Accessed February 1, 2015.
8. Colaco M, Svider PF, Mauro KM, Eloy JA, Jackson-Rosario I. Is there a relationship between National Institutes of Health funding and research impact on academic urology? J Urol .2013;190(3):999-1003. doi:10.1016/j.juro.2013.02.3186.
9. Svider PF, Husain Q, Folbe AJ, Couldwell WT, Liu JK, Eloy JA. Assessing National Institutes of Health funding and scholarly impact in neurological surgery. J Neurosurg. 2014;120(1):191-196. doi:10.3171/2013.8.JNS13938.
10. Svider PF, Mauro KM, Sanghvi S, Setzen M, Baredes S, Eloy JA. Is NIH funding predictive of greater research productivity and impact among academic otolaryngologists? Laryngoscope. 2013;123(1):118-122. doi:10.1002/lary.23659.
11. American Medical Association. FREIDA Online. http://www.ama-assn.org/ama/pub/education-careers/graduate-medical-education/freida-online.page? Accessed February 1, 2015.
12. NIH. Research Portfolio Online Reporting Tools. https://projectreporter.nih.gov/reporter.cfm. Accessed February 1, 2015.
13. Falagas ME, Pitsouni EI, Malietzis GA, Pappas G. Comparison of PubMed, Scopus, Web of Science, and Google Scholar: strengths and weaknesses. FASEB Journal. 2008;22(2):338-342. doi:10.1096/fj.07-9492LSF.
14. Gast KM, Kuzon WM Jr, Waljee JF. Bibliometric indices and academic promotion within plastic surgery. Plast Reconstr Surg. 2014;134(5):838e-844e. doi:10.1097/PRS.0000000000000594.
15. Svider PF, Pashkova AA, Choudhry Z, et al. Comparison of scholarly impact among surgical specialties: an examination of 2429 academic surgeons. Laryngoscope. 2013;123(4):884-889. doi:10.1002/lary.23951.
16. Rad AE, Shahgholi L, Kallmes D. Impact of self-citation on the H index in the field of academic radiology. Acad Radiol. 2012;19(4):455-457. doi:10.1016/j.acra.2011.11.013.
17. Hakkalamani S, Rawal A, Hennessy MS, Parkinson RW. The impact factor of seven orthopaedic journals: factors influencing it. J Bone Joint Surg Br. 2006;88(2):159-162. doi:10.1302/0301-620X.88B2.16983.
18. Foley JA, Della Sala S. The impact of self-citation. Cortex. 2010;46(6):802-810. doi:10.1016/j.cortex.2010.01.004.
19. Opthof T. Inflation of impact factors by journal self-citation in cardiovascular science. Neth Heart J. 2013;21(4):163-165. doi:10.1007/s12471-013-0384-0.
20. Gami AS, Montori VM, Wilczynski NL, Haynes RB. Author self-citation in the diabetes literature. CMAJ. 2004;170(13):1925-1927.
21. Fassoulaki A, Paraskeva A, Papilas K, Karabinis G. Self-citations in six anaesthesia journals and their significance in determining the impact factor. Br J Anaesth. 2000;84(2):266-269.
22. Kulkarni AV, Aziz B, Shams I, Busse JW. Author self-citation in the general medicine literature. PloS One. 2011;6(6): e20885. doi:10.1371/journal.pone.0020885.
23. Bartneck C, Kokkelmans S. Detecting h-index manipulation through self-citation analysis. Scientometrics. 2011;87(1):85-98. doi:10.1007/s11192-010-0306-5.
TAKE-HOME POINTS
- In all, 83.8% of orthopedic surgeons cite previous work at least once.
- Self-citations account for only 5.8% of all citations.
- Including self-citations increases the mean h-index from 18.5 ± 14.9 to 19.2 ± 15.6 (P < .001).
- The magnitude of increase in h-index via self-citation is proportional to the career number of publications.
- Overall, while prevalent, the practice of self-citation has minimal impact on an academic orthopedic surgeon’s h-index.

Uterosacral ligament colpopexy: The way we do it
The way we do it

Visit the Society of Gynecologic Surgeons online: sgsonline.org
Additional videos from SGS are available here, including these recent offerings:
Visit the Society of Gynecologic Surgeons online: sgsonline.org
Additional videos from SGS are available here, including these recent offerings:
Visit the Society of Gynecologic Surgeons online: sgsonline.org
Additional videos from SGS are available here, including these recent offerings:
The way we do it
The way we do it
This video is brought to you by![]()
When should nutritional support be implemented in a hospitalized patient?
Case
A 60-year-old male with a history of head & neck cancer, treated with radical neck dissection and radiation 5 years prior is admitted with community-acquired pneumonia and anasarca. Prior to admission, he was on a soft dysphagia diet and reports increased difficulty with solid foods and weight loss from 70 kg to 55 kg over 2.5 years. Should nutritional support be initiated?
Background

Malnutrition is associated with increased hospital mortality, decreased functional status and quality of life, infections, longer length of stay, higher hospital costs, and more frequent nonelective readmissions.1,2
Identifying patients who are malnourished or at risk for malnutrition
An international consensus committee recommended the following criteria for the diagnosis of undernutrition if two of six are present3:
- Insufficient energy intake.
- Weight loss.
- Loss of muscle mass.
- Loss of subcutaneous fat.
- Localized or generalized fluid accumulation that may sometimes mask weight loss.
- Diminished functional status as measured by handgrip strength.
The joint commission requires that all patients admitted to acute care hospitals be screened for risk of malnutrition within 24 hours. The American College of Gastroenterologists recommends using a validated score to assess nutritional risk, such as the Nutritional Risk Score (NRS) 2002 or the NUTRIC (Nutrition Risk in the Critically Ill) Score, which use a combination of nutritional status and diet-related factors – weight loss, body mass index, and food intake – and also severity of illness measurements.4

- Starvation-related malnutrition, such as anorexia nervosa, presents with a deficiency in calories and protein without inflammation, .
- Chronic disease–related malnutrition, such as that caused chronic obstructive pulmonary disease, cancer, and obesity, presents with mild to moderate inflammation.
- Acute disease or injury–related malnutrition, such as that caused by sepsis, burns, and trauma, presents with acute and severe inflammation.
Laboratory indicators such as albumin, prealbumin, and transferrin are not recommended for the determination of nutritional status. Instead, as negative acute-phase reactants, they can be used as surrogate markers of nutritional risk and degree of inflammation.4
Overview of the data
What are the indications for initiating nutritional support, and what is the optimal timing for initiation?
Patients who are malnourished or at significant risk for becoming malnourished should receive specialized nutrition support. Early enteral nutrition should be initiated within 24-48 hours of admission in critically ill patients with high nutritional risk who are unable to maintain volitional intake.6 In the absence of preexisting malnutrition, nutritional support should be provided for patients with inadequate oral intake for 7-14 days or for those in whom inadequate oral intake is expected over the same time period.7
How should nutritional support be administered?
Dietary modification and supplementation
In patients who can tolerate an oral diet, dietary modifications may be made in order to facilitate the provision of essential nutrients in a well-tolerated form. Modifications may include adjusting the consistency of foods, energy value of foods, types of nutrients consumed, and number and frequency of meals.8 Commercial meal replacement beverages are widely used to support a standard oral diet, but there is no data to support their routine use.7
Enteral nutrition
Enteral nutrition (EN) is the method of choice for administering nutrition support. Contraindications to enteral feeding include diffuse peritonitis, intestinal obstruction, and gastrointestinal ischemia.9 The potential advantages of EN over parenteral nutrition (PN) include decreased infection rate, decreased total complications, and shorter length of stay, but there has been no observed difference in mortality. EN is also suggested to have nonnutritional benefits related to providing luminal nutrients – these include maintaining gut integrity, beneficial immune responses, and favorable metabolic responses that help maintain euglycemia and enhance more physiologic fuel utilization.4
Enteral feeding can be administered through the following routes of access:
- Nasogastric tubes: A nasogastric or orogastric tube with radiologic confirmation of positioning is the first line of enteral access. Gastric feeding is preferred because it is well tolerated in the majority of patients, is more physiological, requires a lower level of expertise, and minimizes any delay in initiation of feeding.
- Postpyloric tubes: Postpyloric feeding tubes are indicated if gastric feeding is poorly tolerated or if the patient is at high risk for aspiration because jejunal feedings decrease the incidence of reflux, regurgitation, and aspiration.
- Percutaneous access: When long-term enteral access is required – that is, for greater than 4 weeks – a percutaneous enteral access device should be placed. Prolonged use of a nasoenteric tube may be associated with erosion of the nares and an increase in the incidence of aspiration pneumonia, sinusitis, and esophageal ulceration or stricture. Patients who have had a stroke are the most likely to benefit from percutaneous endoscopic gastrostomy placement, as 40% of patients can have continued dysphagia as long as 1 year after.4,10 Absolute contraindications for PEG placement include serious coagulation disorders (international normalized ratio greater than 1.5; fewer than 50,000 platelets/mcL), sepsis, abdominal wall infections, marked peritoneal carcinomatosis, peritonitis, severe gastroparesis, gastric outlet obstruction, or a history of total gastrectomy. Risks often outweigh benefits in patients who have cirrhosis with ascites, patients undergoing peritoneal dialysis, and patients who have portal hypertension with gastric varices, but PEG can be considered on a case-by-case basis.11
Parenteral nutrition
Parenteral nutrition is reserved for patients in whom enteral feeding is contraindicated or who fail to meet their nutritional needs with enteral feedings. If EN is not feasible, then parenteral nutrition should be initiated as soon as possible in patients who had high nutritional risk on admission. Otherwise, PN should not be initiated during the first week of hospitalization because there is evidence to suggest net harm when initiated early. Supplemental PN may be considered for patients already on EN who are unable to meet more than 60% of their energy and protein requirements by the enteral route alone, but again, this should only be considered after 7-10 days on EN. PN is generally stopped when the patients achieve more than 60% of their energy and protein goals from EN.4
How should patients be monitored while receiving nutritional support?
If a patient is severely malnourished and refeeding is initiated, serious complications can occur, which are summarized in Table 1; these complications can include severe electrolyte disorders, fluid shifts, and even death.12 Refeeding syndrome occurs in the first few days of initiating a diet in severely malnourished patients, and its severity is directly related to the severity of malnutrition prior to refeeding. The National Institute of Health and Clinical Excellence created criteria to identify patients at risk for refeeding syndrome; these criteria include having a BMI less than 18.5 kg/m2; unintentional weight loss of greater than 10% in the previous 3-6 months; little or no nutritional intake for more than 5 days; low levels of potassium, phosphorus, or magnesium before refeeding; and a history of alcohol misuse or taking certain drugs, such as insulin, chemotherapy, antacids, or diuretics.9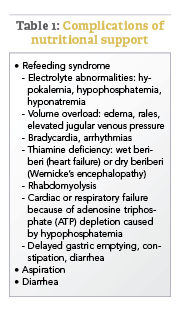
Aspiration is a risk with enteral feeding – the risk factors include being older than 70 years, altered mental status, supine position, and bolus rather than continuous infusion.4 Postpyloric feeding may reduce the risk of aspiration. Expert consensus suggests elevating the head of the bed by 30°-40° for all intubated patients receiving EN, as well as administering chlorhexidine mouthwash twice daily.6
Diarrhea is very common in patients receiving EN. After evaluating for other etiologies of diarrhea, tube feeding–associated diarrhea may be managed first by using a fiber-containing formulation. Fiber should be avoided in patients at risk for bowel ischemia or severe dysmotility. If diarrhea persists despite fiber, small peptide formulations, also known as elemental tube feeds, may be used.4,6
Gastric residual volume (GRV) is commonly monitored in patients receiving enteral nutrition. However, the American College of Gastroenterology does not recommend using GRVs to monitor EN feeding because it is a poor marker of clinically meaningful variables, such as gastric emptying, risk of aspiration, and risk of poor outcomes, and increases the risk of tube clogging and inadequate delivery of EN. If GRVs are being monitored, tube feedings should not be withheld because of high GRVs when there are no other signs of intolerance.4 Nausea may be managed by changing a patient from bolus to continuous feedings or by adding promotility agents such as metoclopramide or erythromycin.6
Special considerations in common conditions treated by hospitalists
The principles outlined above are general guidelines that are applicable to most patients requiring nutrition support. We have highlighted special considerations for common conditions in hospitalized patients who require nutritional support below.
Critical Illness
- Defer enteral nutrition until patient is fully resuscitated and hemodynamically stable.
- Severely malnourished or high nutritional-risk patients should be advanced toward goals as quickly as can be tolerated over 24-48 hours.
- Patients with acute respiratory distress syndrome or acute lung injury, or those expected to require mechanical ventilation for more than 72 hours, should receive trophic feeds or full nutrition by enteral route.6
Pancreatitis
- Oral feeding should be attempted as soon as abdominal pain is decreasing and inflammatory markers are improving.13
- A regular solid, low-fat diet should be initiated, rather than slowly advancing from a clear liquid diet.13
- In severe acute pancreatitis, initiation of enteral nutrition within 48 hours of presentation is associated with improved outcomes.13
- There is no difference in outcomes between gastric and postpyloric feeding.14
- Initiation of parenteral nutrition may be delayed for up to 5 days to allow for a trial of oral or enteral feeding.13
Surgical patients
- Consider postponing surgery to provide 7-10 days of preoperative nutrition supplementation in patients with risk of severe undernutrition.16
- Consider postoperative nutritional support if patients are at risk for severe undernutrition, are unable to eat for more than 7 days perioperatively, or are unable to maintain oral intake above 60% of recommended intake for more than 10 days.16
- Consider total parenteral nutrition in cases of impaired gastrointestinal function and absorption, high output enterocutaneous fistulae, obstructive lesions that do not allow enteral refeeding, or prolonged gastrointestinal failure.16
Prolonged Starvation
- Because of the high risk of refeeding syndrome, patients greater than 30% below ideal body weight should be hospitalized for close monitoring during refeeding.12
- Typical goal for weight gain is no greater than 2-3 pounds per week.10
- Total parenteral nutrition should be reserved for extreme cases, and if used, carbohydrate intake should not exceed 7 mg/kg/min.12
Stroke
- Enteral nutrition should be initiated within 24-48 hours of initial hospitalization if a patient is estimated to require feeding for more than 5 days and/or remain nil per os for 5-7 days.
- If a patient is intubated with increased intracranial pressure, this could delay gastric motility requiring a postpyloric tube placement.
- Initial placement of percutaneous endoscopic gastrostomy tubes can be considered if the hospitalized patient is expected to require nutritional support for greater than 30 days. Most patients will have improved dysphagia symptoms within 1 month of their acute stroke, although as many as 40% can have continued dysphagia up to 1 year.10
Back to the Case
The patient was admitted for a common general medical condition, but it is important to recognize that malnutrition was present on admission with weight loss and generalized fluid overload. Furthermore, he is at high nutritional risk because of his low body weight, poor oral intake, and dysphagia. Additionally, the acute inflammation from pneumonia places him in an increased catabolic state.
He was able to maintain some volitional oral intake, but after 7 days of close monitoring by a licensed dietician, it was determined that he was unable to meet his nutritional needs via the oral route. A percutaneous endoscopic gastrostomy tube was placed, and tube feeds were initiated, because his dysphagia – which was a significant factor contributing to his inability to meet his nutritional needs orally – was expected to persist for greater than 30 days.
Bottom Line
Nutrition support should be initiated in this patient with malnutrition on admission and high nutritional risk.
Dr. Abalos is an assistant professor at Georgetown University Medical Center in Washington. Dr. Corbett is an assistant professor at the University of Oklahoma Health Sciences Center in Oklahoma City.
References
1. Correia MI et al. The impact of malnutrition on morbidity, mortality, length of hospital stay and costs evaluated through a multivariate model analysis. Clin Nutr. 2003 Jun;22(3):235-9.
2. Felder S et al. Association of nutritional risk and adverse medical outcomes across different medical inpatient populations. Nutrition. 2015 Nov-Dec;31(11-12):1385-93.
3. White JV et al. Consensus statement of the Academy of Nutrition and Dietetics/American Society for Parenteral and Enteral Nutrition: Characteristics recommended for the identification and documentation of adult malnutrition (undernutrition). J Acad Nutr Diet. 2012 May;112(5):730-8.
4. McClave SA et al. ACG clinical guideline: Nutrition therapy in the adult hospitalized patient. Am J Gastroenterol. 2016 Mar;111(3):315-334.
5. Mueller C et al. A.S.P.E.N. clinical guidelines: Nutrition screening, assessment, and intervention in adults. JPEN J Parenter Enter Nutr. 2011 Jan;35(1):16-24.
6. McClave SA et al. Guidelines for the provision and assessment of nutrition support therapy in the adult critically ill patient. JPEN J Parenter Enter Nutr. 2016 Feb;40(2):159-211.
7. August D et al. Guidelines for the use of parenteral and enteral nutrition in adult and pediatric patients. JPEN J Parenter Enter Nutr. 2002 Jan-Feb:26(1):SUPPL:1SA-138SA.
8. Kirkland LL et al. Nutrition in the hospitalized patient. J Hosp Med. 2013 Jan;8(1):52-8.
9. National Collaborating Centre for Acute Care, February 2006. Nutrition support in adults Oral nutrition support, enteral tube feeding and parenteral nutrition. National Collaborating Centre for Acute Care, London. Available from www.rcseng.ac.uk.
10. Corrigan ML et al. Nutrition in the stroke patient. Nutr Clin Pract. 2011 Jun;26(3):242-52.
11. Loser C et al. ESPEN guidelines on artificial enteral nutrition – Percutaneous endoscopic gastrostomy (PEG). Clin Nutr. 2005 Oct;24(5):848-61.
12. Mehler PS et al. Nutritional rehabilitation: Practical guidelines for refeeding the anorectic patient. J Nutr Metab. 2010. doi: 10.1155/2010/625782.
13. Working Group IAP/APA Acute Pancreatitis Guidelines. IAP/APA evidence-based guidelines for the management of acute pancreatitis. Pancreatology. 2013 Jul-Aug;13(4 Suppl 2):e1-15.
14. Singh N et al. Evaluation of early enteral feeding through nasogastric and nasojejunal tube in severe acute pancreatitis: A noninferiority randomized controlled trial. Pancreas. 2012 Jan;41(1):153-9.
15. Braga M et al. ESPEN guidelines on parenteral nutrition: Surgery. Clin Nutr. 2009 Aug;28(4):378-86.
16. Weimann A et al. ESPEN Guidelines on enteral nutrition: Surgery including organ transplantation. Clin Nutr. 2006 Apr;25(2):224-44.
Additional reading
- Kirkland LL et al. Nutrition in the Hospitalized Patient. J Hosp Med. 2013 Jan;8(1):52-8.
- McClave SA et al. ACG Clinical Guideline: Nutrition Therapy in the Adult Hospitalized Patient. Am J Gastroenterol. 2016 Mar;111(3):315-334.
Quiz: Recognizing Malnutrition
Which of the following is not a criteria for the diagnosis of malnutrition?
A. Weight loss
B. Insufficient energy intake
C. Prealbumin
D. Diminished handgrip strength
Answer: C. Prealbumin. Laboratory indicators of nutrition, such as albumin, prealbumin, and transferrin, and markers of infection or inflammation are not recommended for the determination of nutritional status. Because negative acute-phase reactants, they instead can be used as surrogate markers of nutritional risk and degree of inflammation
Key Points
- At the time of admission to the hospital, malnutrition is present in 20-50% of patients. All hospitalized patients should be screened for nutritional risk and nutritional support should be considered if patients are not expected to be able to meet nutritional needs for more than 7 days.
- Patients with severe malnutrition on admission, severe critical illness, or severe acute pancreatitis should be provided nutritional support within 24-48 hours.
- Use the gut! Nutritional support should be provided via the most physiologic route possible. Total parenteral nutrition (TPN) should be reserved for patients in whom adequate nutrition cannot be provided enterally.
- Consider a percutaneous endoscopic gastrostomy (PEG) tube if the patient is expected to require tube feedings for more than 30 days.
- Patients with severe malnutrition who are given nutritional support are at high risk of developing refeeding syndrome, which manifests as electrolyte depletions and heart failure or volume overload.
Case
A 60-year-old male with a history of head & neck cancer, treated with radical neck dissection and radiation 5 years prior is admitted with community-acquired pneumonia and anasarca. Prior to admission, he was on a soft dysphagia diet and reports increased difficulty with solid foods and weight loss from 70 kg to 55 kg over 2.5 years. Should nutritional support be initiated?
Background
Malnutrition is associated with increased hospital mortality, decreased functional status and quality of life, infections, longer length of stay, higher hospital costs, and more frequent nonelective readmissions.1,2
Identifying patients who are malnourished or at risk for malnutrition
An international consensus committee recommended the following criteria for the diagnosis of undernutrition if two of six are present3:
- Insufficient energy intake.
- Weight loss.
- Loss of muscle mass.
- Loss of subcutaneous fat.
- Localized or generalized fluid accumulation that may sometimes mask weight loss.
- Diminished functional status as measured by handgrip strength.
The joint commission requires that all patients admitted to acute care hospitals be screened for risk of malnutrition within 24 hours. The American College of Gastroenterologists recommends using a validated score to assess nutritional risk, such as the Nutritional Risk Score (NRS) 2002 or the NUTRIC (Nutrition Risk in the Critically Ill) Score, which use a combination of nutritional status and diet-related factors – weight loss, body mass index, and food intake – and also severity of illness measurements.4
- Starvation-related malnutrition, such as anorexia nervosa, presents with a deficiency in calories and protein without inflammation, .
- Chronic disease–related malnutrition, such as that caused chronic obstructive pulmonary disease, cancer, and obesity, presents with mild to moderate inflammation.
- Acute disease or injury–related malnutrition, such as that caused by sepsis, burns, and trauma, presents with acute and severe inflammation.
Laboratory indicators such as albumin, prealbumin, and transferrin are not recommended for the determination of nutritional status. Instead, as negative acute-phase reactants, they can be used as surrogate markers of nutritional risk and degree of inflammation.4
Overview of the data
What are the indications for initiating nutritional support, and what is the optimal timing for initiation?
Patients who are malnourished or at significant risk for becoming malnourished should receive specialized nutrition support. Early enteral nutrition should be initiated within 24-48 hours of admission in critically ill patients with high nutritional risk who are unable to maintain volitional intake.6 In the absence of preexisting malnutrition, nutritional support should be provided for patients with inadequate oral intake for 7-14 days or for those in whom inadequate oral intake is expected over the same time period.7
How should nutritional support be administered?
Dietary modification and supplementation
In patients who can tolerate an oral diet, dietary modifications may be made in order to facilitate the provision of essential nutrients in a well-tolerated form. Modifications may include adjusting the consistency of foods, energy value of foods, types of nutrients consumed, and number and frequency of meals.8 Commercial meal replacement beverages are widely used to support a standard oral diet, but there is no data to support their routine use.7
Enteral nutrition
Enteral nutrition (EN) is the method of choice for administering nutrition support. Contraindications to enteral feeding include diffuse peritonitis, intestinal obstruction, and gastrointestinal ischemia.9 The potential advantages of EN over parenteral nutrition (PN) include decreased infection rate, decreased total complications, and shorter length of stay, but there has been no observed difference in mortality. EN is also suggested to have nonnutritional benefits related to providing luminal nutrients – these include maintaining gut integrity, beneficial immune responses, and favorable metabolic responses that help maintain euglycemia and enhance more physiologic fuel utilization.4
Enteral feeding can be administered through the following routes of access:
- Nasogastric tubes: A nasogastric or orogastric tube with radiologic confirmation of positioning is the first line of enteral access. Gastric feeding is preferred because it is well tolerated in the majority of patients, is more physiological, requires a lower level of expertise, and minimizes any delay in initiation of feeding.
- Postpyloric tubes: Postpyloric feeding tubes are indicated if gastric feeding is poorly tolerated or if the patient is at high risk for aspiration because jejunal feedings decrease the incidence of reflux, regurgitation, and aspiration.
- Percutaneous access: When long-term enteral access is required – that is, for greater than 4 weeks – a percutaneous enteral access device should be placed. Prolonged use of a nasoenteric tube may be associated with erosion of the nares and an increase in the incidence of aspiration pneumonia, sinusitis, and esophageal ulceration or stricture. Patients who have had a stroke are the most likely to benefit from percutaneous endoscopic gastrostomy placement, as 40% of patients can have continued dysphagia as long as 1 year after.4,10 Absolute contraindications for PEG placement include serious coagulation disorders (international normalized ratio greater than 1.5; fewer than 50,000 platelets/mcL), sepsis, abdominal wall infections, marked peritoneal carcinomatosis, peritonitis, severe gastroparesis, gastric outlet obstruction, or a history of total gastrectomy. Risks often outweigh benefits in patients who have cirrhosis with ascites, patients undergoing peritoneal dialysis, and patients who have portal hypertension with gastric varices, but PEG can be considered on a case-by-case basis.11
Parenteral nutrition
Parenteral nutrition is reserved for patients in whom enteral feeding is contraindicated or who fail to meet their nutritional needs with enteral feedings. If EN is not feasible, then parenteral nutrition should be initiated as soon as possible in patients who had high nutritional risk on admission. Otherwise, PN should not be initiated during the first week of hospitalization because there is evidence to suggest net harm when initiated early. Supplemental PN may be considered for patients already on EN who are unable to meet more than 60% of their energy and protein requirements by the enteral route alone, but again, this should only be considered after 7-10 days on EN. PN is generally stopped when the patients achieve more than 60% of their energy and protein goals from EN.4
How should patients be monitored while receiving nutritional support?
If a patient is severely malnourished and refeeding is initiated, serious complications can occur, which are summarized in Table 1; these complications can include severe electrolyte disorders, fluid shifts, and even death.12 Refeeding syndrome occurs in the first few days of initiating a diet in severely malnourished patients, and its severity is directly related to the severity of malnutrition prior to refeeding. The National Institute of Health and Clinical Excellence created criteria to identify patients at risk for refeeding syndrome; these criteria include having a BMI less than 18.5 kg/m2; unintentional weight loss of greater than 10% in the previous 3-6 months; little or no nutritional intake for more than 5 days; low levels of potassium, phosphorus, or magnesium before refeeding; and a history of alcohol misuse or taking certain drugs, such as insulin, chemotherapy, antacids, or diuretics.9
Aspiration is a risk with enteral feeding – the risk factors include being older than 70 years, altered mental status, supine position, and bolus rather than continuous infusion.4 Postpyloric feeding may reduce the risk of aspiration. Expert consensus suggests elevating the head of the bed by 30°-40° for all intubated patients receiving EN, as well as administering chlorhexidine mouthwash twice daily.6
Diarrhea is very common in patients receiving EN. After evaluating for other etiologies of diarrhea, tube feeding–associated diarrhea may be managed first by using a fiber-containing formulation. Fiber should be avoided in patients at risk for bowel ischemia or severe dysmotility. If diarrhea persists despite fiber, small peptide formulations, also known as elemental tube feeds, may be used.4,6
Gastric residual volume (GRV) is commonly monitored in patients receiving enteral nutrition. However, the American College of Gastroenterology does not recommend using GRVs to monitor EN feeding because it is a poor marker of clinically meaningful variables, such as gastric emptying, risk of aspiration, and risk of poor outcomes, and increases the risk of tube clogging and inadequate delivery of EN. If GRVs are being monitored, tube feedings should not be withheld because of high GRVs when there are no other signs of intolerance.4 Nausea may be managed by changing a patient from bolus to continuous feedings or by adding promotility agents such as metoclopramide or erythromycin.6
Special considerations in common conditions treated by hospitalists
The principles outlined above are general guidelines that are applicable to most patients requiring nutrition support. We have highlighted special considerations for common conditions in hospitalized patients who require nutritional support below.
Critical Illness
- Defer enteral nutrition until patient is fully resuscitated and hemodynamically stable.
- Severely malnourished or high nutritional-risk patients should be advanced toward goals as quickly as can be tolerated over 24-48 hours.
- Patients with acute respiratory distress syndrome or acute lung injury, or those expected to require mechanical ventilation for more than 72 hours, should receive trophic feeds or full nutrition by enteral route.6
Pancreatitis
- Oral feeding should be attempted as soon as abdominal pain is decreasing and inflammatory markers are improving.13
- A regular solid, low-fat diet should be initiated, rather than slowly advancing from a clear liquid diet.13
- In severe acute pancreatitis, initiation of enteral nutrition within 48 hours of presentation is associated with improved outcomes.13
- There is no difference in outcomes between gastric and postpyloric feeding.14
- Initiation of parenteral nutrition may be delayed for up to 5 days to allow for a trial of oral or enteral feeding.13
Surgical patients
- Consider postponing surgery to provide 7-10 days of preoperative nutrition supplementation in patients with risk of severe undernutrition.16
- Consider postoperative nutritional support if patients are at risk for severe undernutrition, are unable to eat for more than 7 days perioperatively, or are unable to maintain oral intake above 60% of recommended intake for more than 10 days.16
- Consider total parenteral nutrition in cases of impaired gastrointestinal function and absorption, high output enterocutaneous fistulae, obstructive lesions that do not allow enteral refeeding, or prolonged gastrointestinal failure.16
Prolonged Starvation
- Because of the high risk of refeeding syndrome, patients greater than 30% below ideal body weight should be hospitalized for close monitoring during refeeding.12
- Typical goal for weight gain is no greater than 2-3 pounds per week.10
- Total parenteral nutrition should be reserved for extreme cases, and if used, carbohydrate intake should not exceed 7 mg/kg/min.12
Stroke
- Enteral nutrition should be initiated within 24-48 hours of initial hospitalization if a patient is estimated to require feeding for more than 5 days and/or remain nil per os for 5-7 days.
- If a patient is intubated with increased intracranial pressure, this could delay gastric motility requiring a postpyloric tube placement.
- Initial placement of percutaneous endoscopic gastrostomy tubes can be considered if the hospitalized patient is expected to require nutritional support for greater than 30 days. Most patients will have improved dysphagia symptoms within 1 month of their acute stroke, although as many as 40% can have continued dysphagia up to 1 year.10
Back to the Case
The patient was admitted for a common general medical condition, but it is important to recognize that malnutrition was present on admission with weight loss and generalized fluid overload. Furthermore, he is at high nutritional risk because of his low body weight, poor oral intake, and dysphagia. Additionally, the acute inflammation from pneumonia places him in an increased catabolic state.
He was able to maintain some volitional oral intake, but after 7 days of close monitoring by a licensed dietician, it was determined that he was unable to meet his nutritional needs via the oral route. A percutaneous endoscopic gastrostomy tube was placed, and tube feeds were initiated, because his dysphagia – which was a significant factor contributing to his inability to meet his nutritional needs orally – was expected to persist for greater than 30 days.
Bottom Line
Nutrition support should be initiated in this patient with malnutrition on admission and high nutritional risk.
Dr. Abalos is an assistant professor at Georgetown University Medical Center in Washington. Dr. Corbett is an assistant professor at the University of Oklahoma Health Sciences Center in Oklahoma City.
References
1. Correia MI et al. The impact of malnutrition on morbidity, mortality, length of hospital stay and costs evaluated through a multivariate model analysis. Clin Nutr. 2003 Jun;22(3):235-9.
2. Felder S et al. Association of nutritional risk and adverse medical outcomes across different medical inpatient populations. Nutrition. 2015 Nov-Dec;31(11-12):1385-93.
3. White JV et al. Consensus statement of the Academy of Nutrition and Dietetics/American Society for Parenteral and Enteral Nutrition: Characteristics recommended for the identification and documentation of adult malnutrition (undernutrition). J Acad Nutr Diet. 2012 May;112(5):730-8.
4. McClave SA et al. ACG clinical guideline: Nutrition therapy in the adult hospitalized patient. Am J Gastroenterol. 2016 Mar;111(3):315-334.
5. Mueller C et al. A.S.P.E.N. clinical guidelines: Nutrition screening, assessment, and intervention in adults. JPEN J Parenter Enter Nutr. 2011 Jan;35(1):16-24.
6. McClave SA et al. Guidelines for the provision and assessment of nutrition support therapy in the adult critically ill patient. JPEN J Parenter Enter Nutr. 2016 Feb;40(2):159-211.
7. August D et al. Guidelines for the use of parenteral and enteral nutrition in adult and pediatric patients. JPEN J Parenter Enter Nutr. 2002 Jan-Feb:26(1):SUPPL:1SA-138SA.
8. Kirkland LL et al. Nutrition in the hospitalized patient. J Hosp Med. 2013 Jan;8(1):52-8.
9. National Collaborating Centre for Acute Care, February 2006. Nutrition support in adults Oral nutrition support, enteral tube feeding and parenteral nutrition. National Collaborating Centre for Acute Care, London. Available from www.rcseng.ac.uk.
10. Corrigan ML et al. Nutrition in the stroke patient. Nutr Clin Pract. 2011 Jun;26(3):242-52.
11. Loser C et al. ESPEN guidelines on artificial enteral nutrition – Percutaneous endoscopic gastrostomy (PEG). Clin Nutr. 2005 Oct;24(5):848-61.
12. Mehler PS et al. Nutritional rehabilitation: Practical guidelines for refeeding the anorectic patient. J Nutr Metab. 2010. doi: 10.1155/2010/625782.
13. Working Group IAP/APA Acute Pancreatitis Guidelines. IAP/APA evidence-based guidelines for the management of acute pancreatitis. Pancreatology. 2013 Jul-Aug;13(4 Suppl 2):e1-15.
14. Singh N et al. Evaluation of early enteral feeding through nasogastric and nasojejunal tube in severe acute pancreatitis: A noninferiority randomized controlled trial. Pancreas. 2012 Jan;41(1):153-9.
15. Braga M et al. ESPEN guidelines on parenteral nutrition: Surgery. Clin Nutr. 2009 Aug;28(4):378-86.
16. Weimann A et al. ESPEN Guidelines on enteral nutrition: Surgery including organ transplantation. Clin Nutr. 2006 Apr;25(2):224-44.
Additional reading
- Kirkland LL et al. Nutrition in the Hospitalized Patient. J Hosp Med. 2013 Jan;8(1):52-8.
- McClave SA et al. ACG Clinical Guideline: Nutrition Therapy in the Adult Hospitalized Patient. Am J Gastroenterol. 2016 Mar;111(3):315-334.
Quiz: Recognizing Malnutrition
Which of the following is not a criteria for the diagnosis of malnutrition?
A. Weight loss
B. Insufficient energy intake
C. Prealbumin
D. Diminished handgrip strength
Answer: C. Prealbumin. Laboratory indicators of nutrition, such as albumin, prealbumin, and transferrin, and markers of infection or inflammation are not recommended for the determination of nutritional status. Because negative acute-phase reactants, they instead can be used as surrogate markers of nutritional risk and degree of inflammation
Key Points
- At the time of admission to the hospital, malnutrition is present in 20-50% of patients. All hospitalized patients should be screened for nutritional risk and nutritional support should be considered if patients are not expected to be able to meet nutritional needs for more than 7 days.
- Patients with severe malnutrition on admission, severe critical illness, or severe acute pancreatitis should be provided nutritional support within 24-48 hours.
- Use the gut! Nutritional support should be provided via the most physiologic route possible. Total parenteral nutrition (TPN) should be reserved for patients in whom adequate nutrition cannot be provided enterally.
- Consider a percutaneous endoscopic gastrostomy (PEG) tube if the patient is expected to require tube feedings for more than 30 days.
- Patients with severe malnutrition who are given nutritional support are at high risk of developing refeeding syndrome, which manifests as electrolyte depletions and heart failure or volume overload.
Myasthenia Gravis: Challenges and Burdens of Disease
Click Here to Read Supplement.
In a new supplement to Neurology Reviews, expert Richard J. Nowak, MD, MS, discusses the burden of myasthenia gravis and challenges in treating the disease.
Topics in this supplement include:
- Pathophysiology of Myasthenia Gravis
- Treatment Resistant Myasthenia Gravis
- Burden and Cost
Click Here to Read Supplement.
US/UNB-gMG/18/0033
Click Here to Read Supplement.
In a new supplement to Neurology Reviews, expert Richard J. Nowak, MD, MS, discusses the burden of myasthenia gravis and challenges in treating the disease.
Topics in this supplement include:
- Pathophysiology of Myasthenia Gravis
- Treatment Resistant Myasthenia Gravis
- Burden and Cost
Click Here to Read Supplement.
US/UNB-gMG/18/0033
Chlamydia infections associated with more than a doubling of ovarian cancer risk
Pelvic inflammatory disease caused by chlamydia appears to significantly increase the risk of ovarian cancer, according to research to be presented at the annual meeting of the American Association for Cancer Research.
The finding, replicated in two large databases, suggests that promptly treating the infection might reduce the lifetime risk of developing ovarian cancer, Britton Trabert, PhD, said during a press briefing held in advance of the meeting.
The study portends both promise and challenge, according to Elaine R. Mardis, PhD, who comoderated the session.
“Ovarian cancer is typically diagnosed at a late stage and therefore has a poor prognosis,” said Dr. Mardis of The Nationwide Hospital, Columbus, Ohio. “Chlamydia will be an important point of study here, both because of the frequency of this infection, and because it is quite difficult to detect, due to its asymptomatic nature. But the most important take-home point is that we might be able to go a long way in terms of preventing ovarian cancer by routinely screening for infective agents.”
Pelvic inflammatory disease is known to be associated with ovarian cancer, and chlamydia is a leading cause of the disease, noted Dr. Trabert. “But chlamydia infections can be asymptomatic and persist for months or even years, so ascertainment of past chlamydia infections is challenging.”
To investigate the potential link between these infections and ovarian cancer, Dr. Trabert and her colleagues examined associations between antibodies to several infectious agents, including chlamydia, in two large ovarian cancer databases: a population-based case/control study in Poland and a case-control study nested into the U.S. Prostate, Lung, Colorectal, and Ovarian (PLCO) Cancer Screening Trial.
The researchers screened for antibodies to chlamydia, Mycoplasma genitalium, Epstein-Barre virus, human papillomavirus, herpes simplex virus-1 and -2, polyomavirus, hepatitis B and C, and cytomegalovirus. The chlamydia antibody selected was plasmid-encoded Pgp3 protein, considered the gold standard measurement for prior or existing chlamydia infections.
The patient cohorts comprised 278 cases vs. 556 controls from the Polish study, and 160 cases vs. 159 controls from the PLCO study. Serum samples were collected at the time of ovarian cancer diagnosis in the Polish cohort, and before diagnosis in the PLCO cohort.
Dr. Trabert presented odds ratios for a Pgp3 antibody titer cut point indicative of past chlamydia infection, and a “more stringent” higher cut point indicative of current or chronic infection. She and her colleagues found statistically significant associations for each cut point in both studies.
In the Polish cohort, the lower Pgp3 cut point was associated with a 63% increased risk of ovarian cancer (odds ratio, 1.63). The higher cut point was associated with a doubling of risk (OR, 2.0).
In the PLCO cohort, the lower cut point was associated with a 43% increased risk (OR, 1.43). The higher cut point more than doubled the risk of ovarian cancer (OR, 2.25).
Neither cohort showed any significant association of ovarian cancer with any of the other antibodies, Dr. Trabert said.
The NCI Intramural Research Program supported the study. Dr. Trabert and her colleagues declared no conflicts of interest.
SOURCE: Trabert et al. Abstract 4942.
FROM THE AACR ANNUAL MEETING
Key clinical point: Chlamydia infections appear to increase the risk of ovarian cancer.
Major finding: The presence of an antibody to chlamydia increased the chance of ovarian cancer by up to 2.25-fold (OR 2.25).
Study details: The cohorts comprised 278 cases vs. 556 controls from a Polish study, and 160 cases vs. 159 controls from a U.S. study.
Disclosures: The NCI Intramural Research Program supported the study. The researchers declared no conflicts of interest.
Source: Trabet et al. Abstract 4942.