User login
Aspirin blunts early stroke risk from preeclampsia
LOS ANGELES – Women with a history of preeclampsia have a significantly increased risk for an early-onset stroke, but that risk is blunted in women taking aspirin, an epidemiologic analysis of data from more than 83,000 women in the California Teachers Study showed.
Among the 4,072 women in the study with a history of preeclampsia, 3,003 were not on aspirin, and during follow-up they had a greater than 1% incidence of stroke – ischemic and hemorrhagic combined – before turning 60 years of age. Their incidence rate was 40% higher than in the roughly 60,000 women without a preeclampsia history who were not taking aspirin, a statistically significant difference after adjustment for demographics, smoking, obesity, diabetes, and hypertension, Eliza C. Miller, MD, said at the International Stroke Conference, sponsored by the American Heart Association.![]()
Her analysis used data drawn from more than 133,000 women enrolled starting in 1995 in the California Teachers Study. She focused on 83,790 women who entered the study when they were younger than 60 years old, who had no history of stroke, and who provided data on their history of preeclampsia. The prevalence of a preeclampsia history was 4.9% overall, and 6.1% among women who had been pregnant at least once, an incidence rate similar to what has been found in other large populations of women, Dr. Miller said.
The average age of the women with preeclampsia was 44, and 46 for those without preeclampsia. The women with a history of preeclampsia also had a higher prevalence rate of obesity, hypertension, diabetes, and chronic kidney disease. Roughly a quarter of all women were regularly taking aspirin.
After adjustment of the data for demographic and clinical differences, women with a history of preeclampsia had a 20% higher overall rate of a subsequent stroke before reaching age 60 years, but this difference was not significant in an analysis that included both women taking aspirin and those not on the drug. When the analysis focused only on the women not on aspirin, the increased stroke rate linked with a preeclampsia history rose to 40% higher than in women without a preeclampsia history, a statistically significant difference. In contrast, among the quarter of women on aspirin, the two subgroups – with a preeclampsia history and without – had similar rates of incident strokes.
SOURCE: Miller E et al. International Stroke Conference 2018, A174 (Stroke. 2018 Jan;49[Suppl1]:A174).
REPORTING FROM ISC 2018
Key clinical point: Aspirin use dampened the rise in early-onset strokes seen after preeclampsia.
Major finding: Study details: A review of data collected from 83,790 women enrolled in the California Teachers Study.
Disclosures: Dr. Miller had no relevant financial disclosures.
Source: Miller E et al. International Stroke Conference 2018, A174 (Stroke. 2018 Jan;49[Suppl 1]:A174).
President’s Report
As I sit here and write this article, it is hard to fathom that a quarter of my year as the President of CHEST has passed by. Thanks again for this incredibly humbling opportunity to serve as your President.
I hope many who read this were able to get to Toronto and experience CHEST 2017. Special thanks to our Program Chair, Peter Mazzone, and to his Co-Chair Diane Lougheed from the Canadian Thoracic Society; the Scientific Program Committee; our excellent and committed CHEST 2017 faculty, who give their valuable time to ensure we are delivering the best clinical education possible; and our incredibly talented CHEST staff for all their work to make this meeting a reality.
What a great opportunity to learn and stay up to date while exposed to such meaningful content from so many outstanding clinical educators in so many traditional and innovative ways. For those who were able to be there, I hope you were able to experience the value of learning in a highly interactive setting while taking the opportunity to build and nurture old and new friendships and relationships.
As we move forward, there is so much going on:
1. The Editor in Chief Search Task Force, under the leadership of Dr.. David Gutterman and Nicki Augustyn, is hard at work with their diverse and talented colleagues on this critically important task.
2. The Scientific Program Committee, under Dr. David Schulman’s direction, is hard at work building October’s CHEST 2018 in San Antonio. It is so exciting to watch this group plan and create, in new and innovative ways, the content for this meeting to be held October 6-10.
3. By the publication date of this article, your Board of Regents most likely will have put the finishing touches, under the leadership of Jenny Nemkovich, our Chief of Staff, on our next 5-year strategic plan.
4. The Board of Regents is also moving forward with a uniform, business-like process and approach in delivering international education offerings and meeting opportunities. Special thanks to Bob Musacchio, our COO and the SVP of Strategy and Innovation, Sue Reimbold, wearing her hat of Market Growth; and Chad Jackson, VP of Innovation and Development, for their direction in this area.
5. Thanks to the Diversity/Inclusion Task Force for their continued work to ensure that the principles of diversity of thought and inclusion permeate all of our conversations and work on the volunteer and professional sides of CHEST.
6. Thanks also to our Training and Transitions Committee and their leadership, Drs. Gabe Bosslet and Matt Miles, and the support of Dr. Richard Irwin and our CHEST® journal for the introduction of the CHEST Teaching, Education, and Career Hub in the journal, which made its debut in January.
7. Also, emphasizing the critical importance of relationships, thanks to our colleagues and partners with so many sister societies with whom we are working closely to help advance the practice of chest medicine. I am confident that we are building better relationships built on common goals, transparency, communication, and trust than we have in many years.
8. Last, and certainly not least, one of the jobs of President I am most looking forward to is serving on the Board of Trustees of the CHEST Foundation as an ex officio member. Having served on this Board for about 10 years, I am so glad to be joining my CF family once again. What an amazing group of volunteers, leaders, and staff serving CHEST and our patients in such amazing ways.
These are but a few of so many things that are transpiring at CHEST. People have asked me if it is intimidating to take on this responsibility. With the support of such diversely talented leaders in our Presidential line; an incredibly mature and engaged BOR; and a CEO, senior leadership, and diverse and talented staff that we have at CHEST, all characterized by incredible intellect and energy, it is pretty easy to be just another member of a great team.
Thanks again for your unwavering support of CHEST and our mission.
New model predicts survival in atezolizumab-treated advanced urothelial carcinoma
A new model containing six basic laboratory and imaging factors predicts survival of patients with advanced urothelial carcinoma who are given the immune checkpoint inhibitor atezolizumab(Tecentriq), investigators reported in a press briefing in advance of the 2018 Genitourinary Cancers Symposium.
“In the past couple of years, there have been five new programmed death 1 [PD-1] and programmed death ligand 1 [PD-L1] inhibitors [checkpoint-inhibitors] approved by the U.S. FDA [Food and Drug Administration] for patients with advanced urothelial carcinoma that progressed during or after platinum-based chemotherapy, and one of these is atezolizumab,” said lead study author Gregory R. Pond, PhD, of McMaster University, Hamilton, Ont.
However, “there is no available prognostic model for predicting which patients will have improved overall survival in this setting,” he said. “At the moment, we don’t know which therapy to give to which patient. These sorts of prognostic models will help us identify which patients might benefit the most from which therapy.”
Dr. Pond and colleagues analyzed data from patients with advanced urothelial carcinoma treated with atezolizumab in the postplatinum setting. They developed and trained the model in a cohort of 310 patients from the phase 2 IMvigor210 trial and validated it in a cohort of 95 patients from the phase 1 PCD4989g trial.
The model ultimately contained six prognostic factors: elevated neutrophil-lymphocyte ratio (5 or higher), impaired functional status (Eastern Cooperative Oncology Group performance status of 1 or higher), elevated platelet count (400 x 109/L or higher), anemia (hemoglobin level less than 10 g/dL), elevated lactate dehydrogenase level (280 U/L or higher), and the presence of liver metastasis.
Main results showed that median overall survival for patients with 0-1, 2-3, and 4 or more factors was 19.6, 5.9, and 2.8 months in the IMvigor210 cohort, and 19.4, 7.2, and 2.6 months in the PCD4989g cohort, respectively.
“We have developed a prognostic model for overall survival, which we now propose for patients with advanced urothelial carcinoma receiving postplatinum atezolizumab,” Dr. Pond summarized. “The initial results of our study are very promising in both the training and validation datasets.
“The model does require further evaluation and further refinements,” he acknowledged. “For example, we need to look at and evaluate how the model performs in larger sample sizes, and we also want to see how it works with other checkpoint inhibitors.” The investigators also plan to assess its performance relative to that of a PD-L1 immunohistochemical assay.
Full results of the study will be reported later this week at the symposium, which is sponsored by the American Society of Clinical Oncology, ASTRO, and the Society of Urologic Oncology.
Findings in context
Response of advanced urothelial carcinoma to immune checkpoint inhibitors ranges widely, with one-quarter of patients or fewer seeing tumor shrinkage, and a small proportion seeing longer-term survival, according to ASCO expert and presscast moderator Sumanta K. Pal, MD.
“Until the results of this study, there was no way to easily discern prognosis and identify who might stand to benefit most,” he said. “This easily applied score developed by Dr. Pond and colleagues based on parameters readily available in the patient’s chart provides tremendous input.
“While I would not necessarily withhold therapy on the basis of an anticipated poor prognosis, I would consider using this information in counseling patients who want to be better informed about potential outcomes with immunotherapy,” commented Dr. Pal, who is a medical oncologist and codirector of the Kidney Cancer Program at City of Hope, Duarte, Calif.
Many studies are assessing combinations of immunotherapies with one another and with chemotherapy, he noted. “If these studies are positive, there would be a massive paradigm shift in how we manage advanced bladder cancer. At that point in time, we would have to determine if the model established by Dr. Pond and colleagues remains relevant in that climate.”
Dr. Pond disclosed that an immediate family member is an employee of Roche Canada. Genentech provided data for this study.
SOURCE: Pond GR et al. GU Cancers Symposium, Abstract 413
REPORTING FROM GUCS 2018
Key clinical point:
Major finding: Median overall survival for patients with 0-1, 2-3, and 4 or more factors was 19.6, 5.9, and 2.8 months in the development cohort, and 19.4, 7.2 and 2.6 months in the validation cohort, respectively.
Data source: A study among patients given atezolizumab for advanced urothelial carcinoma with a development cohort (310 patients from the phase 2 IMvigor210 trial) and a validation cohort (95 patients from the phase 1 PCD4989g trial).
Disclosures: Dr. Pond disclosed that an immediate family member is an employee of Roche Canada. Genentech provided data for this study.
Source: Pond GR et al. GU Cancers Symposium Abstract 413
Decline in non-Hodgkin lymphoma deaths to continue in 2018
Mortality from non-Hodgkin lymphoma is expected to be about 6.1 per 100,000 population in 2018, with the highest rate in Maine and West Virginia and the lowest in Utah.
in its Cancer Facts & Figures 2018, based on analysis of 2001-2015 data from the National Center for Health Statistics. That figure is down from the 20,140 predicted for 2017, as the trend in the death rate since 2006 has been a decline of about 2% per year.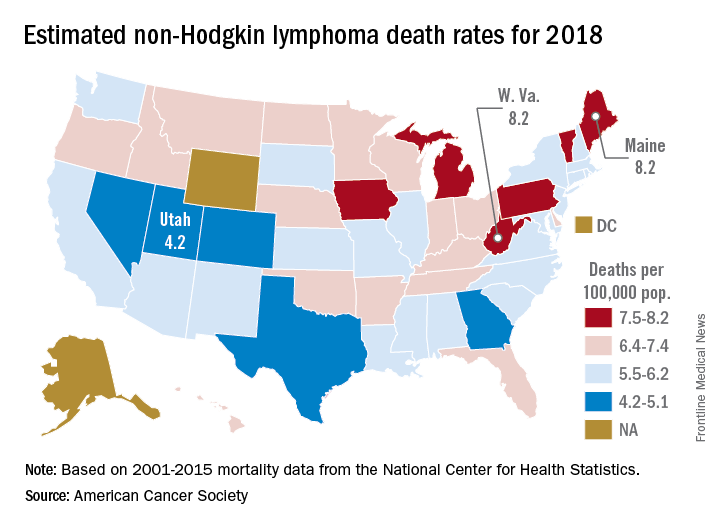
Nationally, death rates for NHL were 7.4 per 100,000 for males and 4.5 for females for 2011-2015, and incidence rates were 22.9 per 100,000 for males and 15.8 for females for 2010-2014, the ACS reported.
Over time, the relative survival rate for NHL has gone from 47% in 1975-1977 to 51% in 1987-1989 to 73% in 2007-2013, although there is some disparity between whites, whose respective rates are 47%, 51%, and 74%, and blacks, who have rates of 49%, 46%, and 67%, respectively, the ACS said.
HCV screening, care inadequate for young adults who use opioids nonmedically
Younger adults aged 18-23 years who used opioids nonmedically were less likely to receive hepatitis C virus screening than their older peers aged 24-29 years, according to results from the Rhode Island Young Adults Prescription Drug Study (RAPIDS). Overall, those young adults screening positive for HCV received what the researchers deemed was inadequate follow-up, education, and care.
The study was carried out between January 2015 and February 2016 and assessed the self-reported HCV screening, confirmatory testing, and care experience of 196 young adults (aged between 18-29 years) who used opioids nonmedically, according to Ayorinde I. Soipe, MD, Rhode Island Hospital, Providence, and his colleagues.
Among the total of 154 participants who reported being screened, 18 (11.7%) reported a positive test result. Of those who tested positive, only 72% received a follow-up confirmatory blood test, 67% received referral for specialty HCV care, 50% received education about living with HCV, and 56% were given education about how not to transmit HCV to someone else.
A significantly higher proportion of the older participants reported being screened (90%) vs. 60% of the younger participants (P less than .001).
Multivariate analysis showed that age, history of injected drug use, and a history of ever being hospitalized for a psychiatric illness or depression were all significantly associated with HCV screening.
Self-reported barriers to screening and testing included health insurance status, discrimination experienced from the health care community, comorbid psychiatric illness, including depression, and access to drug addiction services.
“This study demonstrates the need to not only screen at-risk patients, but to also ensure adequate follow-up after referral to care. Establishing comprehensive integrated care programs that incorporate peer support, counselors, case managers, and educators is recommended to improve follow-up care,” the researchers concluded.
The authors reported that they had no disclosures. The study was sponsored by an National Institutes of Health grant.
SOURCE: Soipe AI et al. J Adolescent Health 2018;62:114-7.
FROM THE JOURNAL OF ADOLESCENT HEALTH
Key clinical point: Young adults who used nonmedical opioids received less HCV screening and treatment than older drug users.
Major finding: Nearly a third of young adults with a positive HCV screening were not referred to care.
Study details: Self-reported interview data from 196 participants in the Rhode Island Young Adults Prescription Drug Study.
Disclosures: The authors reported that they had no disclosures. The study was sponsored by a National Institutes of Health grant.
Source: Soipe AI et al. J Adolescent Health 2018;62:114-7.
MDedge Daily News: Indiana’s Medicaid waiver could slice enrollment
The video associated with this article is no longer available on this site. Please view all of our videos on the MDedge YouTube channel
An Indiana Medicaid waiver could slice enrollment, rivaroxaban plus aspirin slashed ischemic strokes, embracing Life’s Simple 7 reduced peripheral arterial disease risk, and why all pregnant women should be screened for syphilis.
Listen to the MDedge Daily News podcast for all the details on today’s top news.

From angst to analytics: lessons learned from an oncology care model internal pilot
In March 2016, 13 practices affiliated with the US Oncology Network (USON) were invited to participate in the Oncology Care Model (OCM) proposed by the Center for Medicare and Medicaid Services (CMS) and Center for Medicare and Medicaid Innovation (CMMI). The OCM, a novel value-based care model, was designed to provide higher-quality and better-coordinated oncology care at a lower cost to CMS.1 Of the 13 practices, 12 agreed to participate with a start date for the program of July 1, 2016. At least 40% of the practices’ patients were insured by Medicare, and any eligible patients with active cancer were offered an opportunity to enter the program. USON practices treat more than 25,000 patients with a qualifying episode per year and the overall OCM program sees more than 150,000 beneficiaries per year,2 so we anticipated that the OCM would have a substantial impact on each of the 12 practices on USON.
Faced with the scenario of having only 3 months between notification of approval and launch of the OCM, it was imperative that all the practices be proactive in planning and preparing to launch the OCM. With this goal in mind, representatives from all OCM candidate practices convened to anticipate the needs of the OCM and chart out a program to meet those needs. In this article, we discuss the requirements and scope of the OCM, the development of an internal pilot project, the anticipated gains from the pilot, and the results and findings from the pilot, both expected and unexpected.
The road to the Oncology Care Model
The government and oncology practices have been on separate trajectories to the OCM. In the last 15 years, the major intersections of these trajectories had to do with price and not patient outcomes. In 2003, the Medicare Prescription Drug Improvement and Modernization Act (MMA) focused on drug price reductions from an average wholesale price–based schedule to an average sales price–based schedule.3 There was the sequester in 2013,4 and more recently a proposal to restructure the payment for Part B drugs. In the background, recurrent negotiations to fix the calculation for the sustainable growth rate allowed for periodic draconian cuts to the prices of services. The cumulative effect of these price reductions has been to put economic pressure on community oncologists such that many have moved to a hospital environment.5
This contentious relationship with community oncology began to change with the passage of the Affordable Care Act (ACA) in 2010.6 Section 3022 of the ACA established the Medicare Shared Savings Program (MSSP) with the charge to create a new type of health care entity that was responsible for achieving the triple aim of improving population health, improving individual patient care, and bending the cost curve.7 Additional programs, such as the Pioneer Accountable Care Organization (ACO) program and the Comprehensive Primary Care Initiative were established to test alternative payment models.8-10
The ACA also funded the CMMI with a mandate to “test innovative payment and service delivery models” to achieve the triple aim; US$10 billion were appropriated for the years 2011-2019 for this purpose. The CMMI funded a pilot project for cancer care, the COME HOME [Community Oncology MEdical HOME] initiative, to test whether some aspects of care could be transformed or augmented to reduce overall costs or at least reduce the rate of increase. Findings from COME HOME have helped inform the OCM program.11
Over the same period, practices belonging to the USON were paving a path toward value. An electronic health record (EHR) for the entire network was adopted in 2005. A pathways program in which chemotherapy regimens were assessed on cost as well as benefits and toxicity, was started in 2006. Higher-cost regimens with no additional benefits comparable with other evidence-based regimens were deselected for initial treatment choices at the time of initial decision support. This process was streamlined using web-based technology that improved pathways compliance and tracking of off-pathways exceptions.12 Retrospective studies indicated that pathways had the potential to bend the cost curve by reducing drug spending.13,14 USON and its practices also tested a nurse call system (Innovent Oncology) funded by a monthly management fee. This program guided patients through chemotherapy with regular telephonic symptom assessment and discussion of patient-centered values and advance care planning. Results of these programs indicated relative reductions in both drug and hospital expenses.15
Additional experience has come from participation in the United Healthcare Episodes of Care (EOC) initiative, which eliminated the chemotherapy drug incentives, compensating physicians on a per-episode basis instead. This study showed a significant reduction in the total cost of cancer therapy after modifying the fee-for-service system and incorporating feedback data and financial incentives to reward improved outcomes and cost efficiency.16
The Oncology Care Model represents a convergence of purchaser demand and provider readiness. The purchaser holds providers accountable for cost and quality. The data on outcomes and costs will provide an extensive database that can be analyzed by the participating practices to address variations and reduce unnecessary care and preventable costs. Best practices are rewarded.17
The OCM and practice readiness
As a part of the CMS proposal process, practices were required to submit implementation plans by June 30, 2015. The purpose of the implementation plan was to define how a practice could transform over 6 broad domains: 24/7 coverage; EHR certification; navigation and care coordination; continuous quality improvement; incorporation of the Institute of Medicine’s (IOM’s) Care Management Plan; and adherence to nationally recognized guidelines. The periods of patient eligibility for the program were 6-month treatment episodes triggered by a cancer diagnosis, a provider encounter claim, and a Part B or D drug claim specifically identified as a cancer treatment. The episodes could be repeated if the 3 criteria continued to be met. All charges continued to be billed as fee-for-service as before, but in addition, participating practices could bill a monthly enhanced oncology services (MEOS) payment for the duration of an episode. Reducing the total cost of care while meeting performance metrics thresholds would also qualify a practice for performance-based payments.
Of the primary components, EHR certification and adherence to guidelines had been addressed previously, but the other domains represented significant challenges. Although 24/7 physician coverage with access to an EHR is standard for all practices, most practice sites do not have an insight into the frequency of hospital admissions, the ability to efficiently add sick patients to the daily schedule, or a routine call system to assess chemotherapy toxicity.
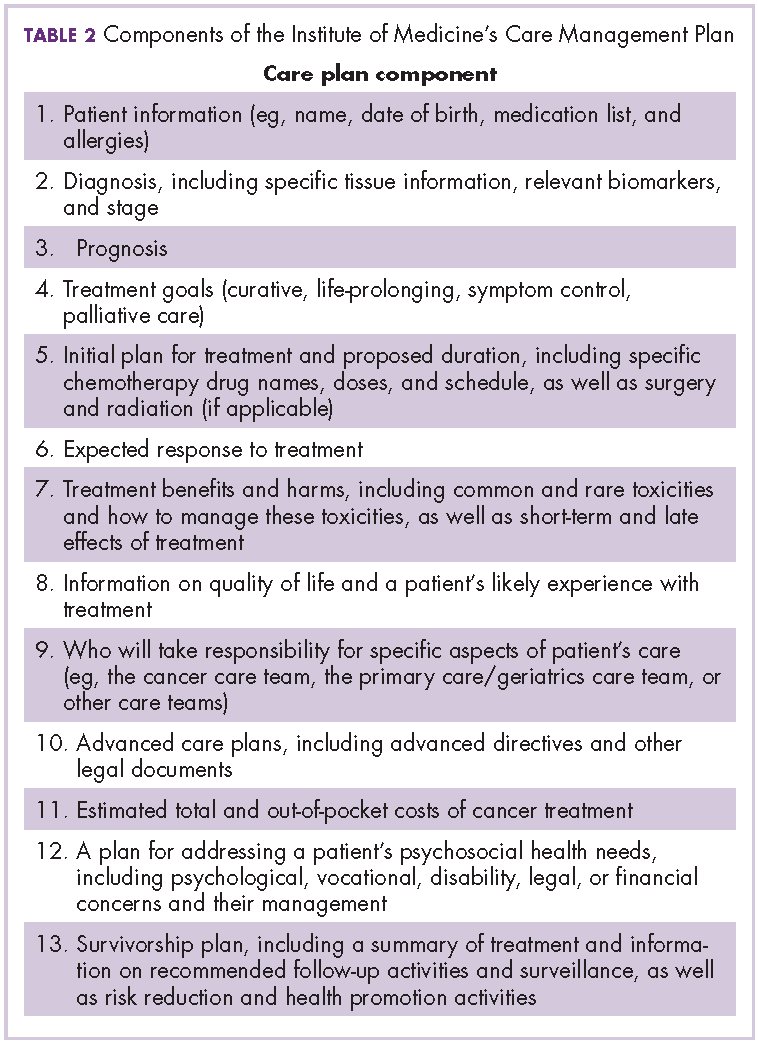
The OCM proposes 10 potential navigation/care coordination functions (Table 1) and does not consider those functions to be the role of one person, but rather a team responsibility. Most of our practices perform at least some of these functions, but they are not formally designated, coordinated, or recorded. A similar condition exists for the IOM care plan, which includes recommendations for treatment and adverse event management (Table 2). The prognosis, toxicity, quality-of-life, and goals-of-care requirements are often found in the physician notes, but not systematically documented or searchable.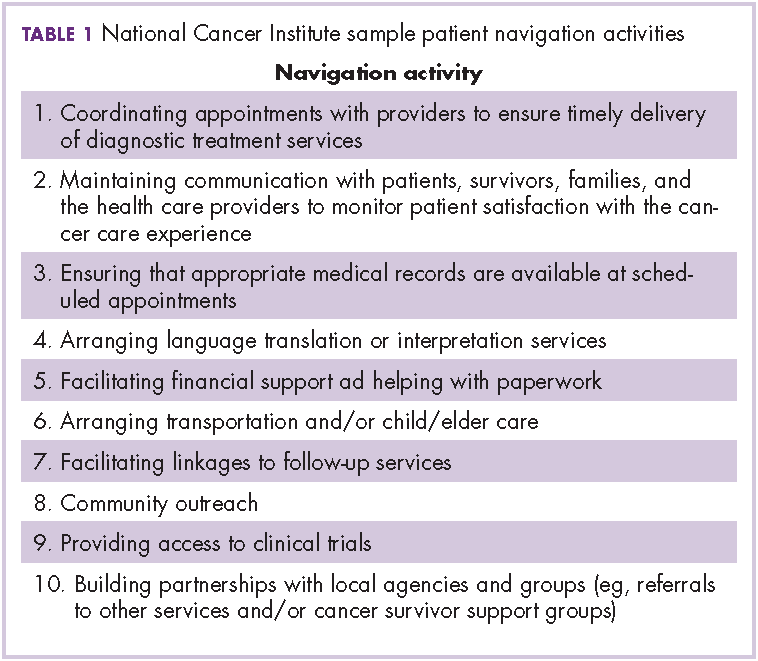
Similar challenges have been observed for continuous quality improvement programs. Although the data are available, they are often not easy to search and, therefore, are difficult to retrieve and report. The OCM, as with any transformational program, must always weigh the benefit of information with the burden of consumption of physician and staff time to collect and input these data.18
Prepilot project work
In October 2015, lead physicians and managers from the 12 participating practices were brought together with analytic, technical, process management, and business experts from USON and McKesson Specialty Health. The objective of the meeting was to define the areas of greatest need for day 1 of the OCM and to be prepared. The challenges were to identify the changes needed to meet the requirements of the OCM while improving the patient experience, sustaining the viability of the community oncology practices, creating teams to deliver more effective care, and using data to bend the cost curve. Accordingly, 4 work streams were created: Care and Support; Content; Technology; and Communications, Revenue Cycle and Incentives.
Care and Support
The key tasks of the Care and Support team were to define the workflows for navigation and the IOM care plan. As a patient’s journey through the clinic was mapped out, it became clear that although multiple personnel could participate in the navigation and care plans, there was no systematic way to organize and record the components of successful navigation. The goals for the pilot were to test various options for navigation and to identify best practices that could be translated into standard operating procedures.
Content
The Content team was charged with identifying available programs that would fit into the OCM requirements. These included advance care planning, survivorship, chemotherapy teaching, risk assessment, pathways, and symptom assessment. A longer-term goal was the development of care paths, a more comprehensive map of the patient’s journey that would include consultations, coordinated care, imaging, labs, and other services.
Technology
The task for the Technology work stream was to identify processes of care that required documentation and to evaluate current and future technology solutions to improve efficiencies. The electronic medical record satisfied for the input of data with relevant clinical details, demographics, disease types, and staging. A web-based pathways tool supported clinical decision-making, as well as compliance to pathways. The Medicare quality metric programs set the stage for development of capture and reporting tools for data from many sources. The pilot would indicate the adequacy of these tools and the need for expansion or development of new functions or programs. Of particular importance was recording the IOM care plan and navigation functions in a searchable format. As care paths are developed, risk prediction, palliative care, and other services need to be encompassed. Finally, technology will support the identification and enrollment of eligible patients, and billing activities.
Communications, Revenue Cycle, and Incentives
The final work stream was Communications, Revenue Cycle, and Incentives. For the pilot, the focus was on revenue cycle. A new category of patient needed to be identified, enrolled, and billed to CMS for services. At the outset, the technology did not address the identification of patients receiving only oral drugs. The office visit, the diagnosis, and the drug claim all had to be aligned for enrollment and billing. It was critical to understand the workload by patient and total volume to estimate the technology and personnel needs to meet the initial number of new OCM patients. Communication refers to both internal and external parties. Education of the entire practice staff regarding transformation will be critical for success.
Of the 12 participating practices, 3 practice sites were selected for the pilot program. Each had fewer than 10 medical oncologists and at least 1 radiation oncologist. Each site had a physician champion and an administrative lead. All of the sites were part of a larger regional oncology practice. A fourth site had independently started a pilot and that experience was shared with the larger group as well. The sites were distributed across the country in 4 different time zones.
The pilot experience
The pilot experience yielded important findings, some expected and some unexpected. The challenges of navigation, the treatment plan, and team building were anticipated. We were surprised at the sheer number of potential candidates and the difficulty in finding eligible candidates. Not to be overlooked was a need for continued and possibly increased emphasis on adherence to pathways and process changes to reduce hospitalizations and emergency department (ED) visits.
Navigation
At the outset, none of the pilot practices had formal navigation processes as outlined in Table 1. Many of the processes, such as coordinating appointments and facilitating follow-up services and financial support, were provided by the practice, but were not identified or coordinated as navigation. The practices, as a first step, defined who was responsible for those services and identified 1 person who would be responsible for their completion. It was agreed that navigation was a process shared by a team and not an individual responsibility, yet the person who would monitor the completion of the tasks was not identified. It soon became apparent that true navigation included more tasks than initially outlined.
Additional tasks included appropriate patient education regarding treatment toxicities, follow-up after chemotherapy or a hospitalization, and coordination of other aspects of the IOM care plan, such as survivorship and advance care planning. Each of the practices recruited staff internally to assume the navigator role, and standard operating procedures were developed for completing and documenting this expanded responsibility. True navigation, however, depends on building the team character while still having 1 or 2 members of the team identified as being responsible for following and documenting the patient’s journey through an episode. To meet those needs, navigators developed ad hoc methods, such as spreadsheets, to track patients. The technology team developed drop-down check lists within the EHR, but the burden of documentation continued. Lastly, an ongoing challenge is how best to designate responsibility and assess how many additional staffers are needed.
IOM Care Management Plan
Before initiation of the pilot project, no practice was providing patients with a comprehensive, written treatment plan. Considerably more than half of the members of the work-stream teams believed that would be difficult to implement. However, the members of the Care and Support work stream made some fundamental assumptions to make the care plan workable: first, all aspects of the plan did not occur at the same time, and were not completed by the same person; second, and critically, items 2-9 of Table 2 could be completed at one time during the early conversations between the physician and patient about the goals of treatment. Diagnosis, prognosis, treatment intent, response rate, quality of life, and toxicities were included in the treatment plan, and the remaining IOM care plan could be discussed, or at least identified, as issues for further discussion with other team members. These components were incorporated into a 1-page document that was either typed into the record and printed out or handwritten and copied for the patient. This became the treatment plan and was ready for use at the start of the pilot.
The physician response to the treatment plan was mixed. One site adopted it enthusiastically and quickly moved to use the plan for all patients. Other sites had variable uptake. One hurdle was defining response rate to therapy and prognosis. Data were provided but they often did not match the conditions of individual patients. Some physicians were uncomfortable with the process. Documentation was difficult because the plans had to be scanned into the EHR. Patients generally responded favorably to the plans and would bring them to teaching or chemotherapy sessions.
As with navigation, the treatment plan challenges pointed the technology team toward the development and implementation of an electronic version of the plan. The pilot allowed members of the technology team to visit the clinics, to evaluate workflows and make assumptions on how to structure a treatment plan electronically.
Team-based care
None of the pilot sites had a formalized structure for team-based care. Team huddles were developed and weekly and daily huddles were encouraged. The weekly huddles took about 15-30 minutes, during which patients scheduled for the coming week were reviewed. All personnel who saw patients were invited – benefit counselors, advanced practice providers, schedulers, lab technicians, medical assistants, office and infusion nurses, social workers, pharmacists, physicians, and lead administrative staff. The daily huddle was smaller and generally included a nurse, a medical assistant, and a physician, at a minimum, to review the patients in the hospital, those to be seen in the clinic that day, and any follow-up information based on scheduled contact following recent treatments or events. In some sites, these huddles were uniformly endorsed, in others, not at all. Although many physicians felt that the functions were being handled informally and the additional time commitment would not improve the process, once they began to attend the meetings, they appreciated the value of the huddles and continued attending them. As the complexity of delivery and documentation becomes more apparent, these will prove indispensable to coordinated care.
24/7 access
Hospitalization is one of the chief drivers of the total cost of care, so the pilot sites were concerned that more needed to be done to reduce unnecessary hospitalizations. One site surveyed the patients coming into the clinic about their previous ED visits. Many of the visits had been for noncancer-related events and the clinic was not aware of many of the many of the visits. These findings prompted a number of changes. Open slots were created daily for patients who needed to be worked in for any areas of concern. The on-call physician, triage nurse, or navigation lead could fill these slots. All patients discharged from the hospital were called within 48 hours after discharge and scheduled for a clinic visit within 1 week. Night and weekend call logs were scrutinized each morning and patients’ calls were returned for any issues related to symptom or toxicity management. At one site, patients were given wallet cards with the clinic number, the treatment regimen, and, on the reverse, all symptoms that would justify calling the clinic. The patients were encouraged to call the clinic earlier rather than later in the day. On the back end, the clinics were to have processes in place so that patient calls would be answered quickly to facilitate same-day evaluations in the clinic.
Enrollment and revenue cycle
The most intractable problem was the identification and enrollment of OCM patients. As already noted, 3 components were necessary for enrollment: a drug charge for Part B or D Medicare, a provider visit, and an approved cancer diagnosis. To identify those patients, the claims system would churn out a weekly list of all eligible patients. However, the claims system had no mechanism to pick up Part D claims for oral medications. This meant that any patient with a provider visit and an appropriate diagnosis was potentially eligible for enrollment. At one site, the list of potential patients was 2-3 times the number of actual candidates. It took 6 weeks of manual chart review to resolving the list. Collectively, the 12 practices could have as many as 20,000 patients eligible for the July 1 enrollment. The pilot allowed the practices to get an early start on recruitment of business office staff and plans to address the backlog of potentially eligible patients. The process of identifying eligible patients for the OCM still needs a better solution because finding the appropriate patients is a critical first step in this model.
Underlying all of these initiatives is communication, both internal and external. We have to select and celebrate best practices. We have to educate our staffs. We will have to demonstrate that we are giving better care to our patients by using patient and provider testimonials and data.
From angst to analytics
The challenges of practice transformation can be daunting. It will be difficult to formalize processes and document data in ways that were untested before the pilot program was set up. However, the pilot accomplished 2 things: it identified additional areas that needed improvement and it demonstrated that the most challenging aspects of the OCM were feasible. Navigation and the IOM care plan were broken down into parts; each component was separately addressed, and programs were put in place to make the pieces manageable and part of an overall movement toward team-based care. The addition of a technology platform has been a key factor for the success of the value-based care initiative. Additional technology support has been enlisted to facilitate the processes, and an electronic version of the treatment plan is being tested. More difficult will be efforts to address the cultural resistance to change, which we hope to do by using data and outcomes from the CMS claims data files. The OCM represents an unprecedented opportunity for measurement of the quality of care we deliver.
We are now well und
Acknowledgment
The authors thank Supriya Srinivasan, PhD, for editorial support.
1. Oncology Care Model. Centers for Medicare and Medicaid Services 2016. https://innovation.cms.gov/initiatives/oncology-care/. Last updated November 14, 2017. Accessed November 16 2016.
2. Mortimer L, Strawbridge L, Lukens E, et al. CMS’ Oncology Care Model: delivering higher value cancer care. Clin Pharmacol Ther. 2017.
3. Medicare Prescription Drug, Improvement and Modernization Act of 2003, Pub Law No. 108-173; 2003.
4. Mathews D. The sequester: absolutely everything you could possibly need to know, in one FAQ. https://www.washingtonpost.com/news/wonk/wp/2013/02/20/the-sequester-absolutely-everything-you-could-possibly-need-to-know-in-one-faq/?utm_term=.a0f3a768399b. Published February 20, 2013. Accessed December 4, 2017.
5. Community Oncology Alliance. 2016 community oncology practice impact report: tracking the changing landscape of cancer care. https://www.communityoncology.org/wp-content/uploads/2016/09/PracticeImpactReport-2016-Report.pdf. Issued October 4, 2016. Accessed April 10, 2017.
6. The Patient Protection and Affordable Care Act, Pub Law No. 111-148; 2010.
7. Centers for Medicare and Medicaid Services. Shared Savings Program 2016. https://www.cms.gov/Medicare/Medicare-Fee-for-Service-Payment/sharedsavingsprogram/index.html?redirect=/sharedsavingsprogram/. Last modified October 12, 2017. Accessed November 16 2016.
8. Dale SB, Ghosh A, Peikes DN, et al. Two-year costs and quality in the comprehensive primary care initiative. N Engl J Med. 2016;374:2345-2356.
9. McWilliams JM, Chernew ME, Landon BE, Schwartz AL. Performance differences in year 1 of pioneer accountable care organizations. N Engl J Med. 2015;372:1927-1936.
10. Rajkumar R, Press MJ, Conway PH. The CMS Innovation Center – a five-year self-assessment. N Engl J Med. 2015;372:1981-1983.
11. Waters TM, Webster JA, Stevens LA, et al. Community oncology medical homes: physician-driven change to improve patient care and reduce costs. J Oncol Pract. 2015;11(6):462-467.
12. Wilfong LS, Hoverman JR, Gosse N, Neubauer MA, Torres V. Changing physician compensation and implementing new technology to enhance pathways compliance. J Clin Oncol. 2016;34(Suppl 7S):Abstr 187.
13. Hoverman JR, Cartwright TH, Patt DA, et al. Pathways, outcomes, and costs in colon cancer: retrospective evaluations in two distinct databases. J Oncol Pract. 2011;7(3 Suppl):52s-59s.
14. Neubauer MA, Hoverman JR, Kolodziej M, et al. Cost effectiveness of evidence-based treatment guidelines for the treatment of non-small-cell lung cancer in the community setting. J Oncol Pract. 2010;6(1):12-18.
15. Hoverman JR, Klein I, Harrison DW, et al. Opening the black box: the impact of an oncology management program consisting of level I pathways and an outbound nurse call system. J Oncol Pract. 2014;10(1):63-67.
16. Newcomer LN, Gould B, Page RD, Donelan SA, Perkins M. Changing physician incentives for affordable, quality cancer care: results of an episode payment model. J Oncol Pract. 2014;10(5):322-326.
17. Meyer JA, Rybowski L, Eichler R. Theory and reality of value-based purchasing: lessons from the pioneers. Rockville, MD.: Agency for Health Care Policy and Research; 1997.
18. Stein CM. Academic clinical research: death by a thousand clicks. Sci Transl Med. 2015;7:318fs349.
19. Churchill W. The end of the beginning. 1st ed. Boston, MA: Little Brown & Co; 1943.
In March 2016, 13 practices affiliated with the US Oncology Network (USON) were invited to participate in the Oncology Care Model (OCM) proposed by the Center for Medicare and Medicaid Services (CMS) and Center for Medicare and Medicaid Innovation (CMMI). The OCM, a novel value-based care model, was designed to provide higher-quality and better-coordinated oncology care at a lower cost to CMS.1 Of the 13 practices, 12 agreed to participate with a start date for the program of July 1, 2016. At least 40% of the practices’ patients were insured by Medicare, and any eligible patients with active cancer were offered an opportunity to enter the program. USON practices treat more than 25,000 patients with a qualifying episode per year and the overall OCM program sees more than 150,000 beneficiaries per year,2 so we anticipated that the OCM would have a substantial impact on each of the 12 practices on USON.
Faced with the scenario of having only 3 months between notification of approval and launch of the OCM, it was imperative that all the practices be proactive in planning and preparing to launch the OCM. With this goal in mind, representatives from all OCM candidate practices convened to anticipate the needs of the OCM and chart out a program to meet those needs. In this article, we discuss the requirements and scope of the OCM, the development of an internal pilot project, the anticipated gains from the pilot, and the results and findings from the pilot, both expected and unexpected.
The road to the Oncology Care Model
The government and oncology practices have been on separate trajectories to the OCM. In the last 15 years, the major intersections of these trajectories had to do with price and not patient outcomes. In 2003, the Medicare Prescription Drug Improvement and Modernization Act (MMA) focused on drug price reductions from an average wholesale price–based schedule to an average sales price–based schedule.3 There was the sequester in 2013,4 and more recently a proposal to restructure the payment for Part B drugs. In the background, recurrent negotiations to fix the calculation for the sustainable growth rate allowed for periodic draconian cuts to the prices of services. The cumulative effect of these price reductions has been to put economic pressure on community oncologists such that many have moved to a hospital environment.5
This contentious relationship with community oncology began to change with the passage of the Affordable Care Act (ACA) in 2010.6 Section 3022 of the ACA established the Medicare Shared Savings Program (MSSP) with the charge to create a new type of health care entity that was responsible for achieving the triple aim of improving population health, improving individual patient care, and bending the cost curve.7 Additional programs, such as the Pioneer Accountable Care Organization (ACO) program and the Comprehensive Primary Care Initiative were established to test alternative payment models.8-10
The ACA also funded the CMMI with a mandate to “test innovative payment and service delivery models” to achieve the triple aim; US$10 billion were appropriated for the years 2011-2019 for this purpose. The CMMI funded a pilot project for cancer care, the COME HOME [Community Oncology MEdical HOME] initiative, to test whether some aspects of care could be transformed or augmented to reduce overall costs or at least reduce the rate of increase. Findings from COME HOME have helped inform the OCM program.11
Over the same period, practices belonging to the USON were paving a path toward value. An electronic health record (EHR) for the entire network was adopted in 2005. A pathways program in which chemotherapy regimens were assessed on cost as well as benefits and toxicity, was started in 2006. Higher-cost regimens with no additional benefits comparable with other evidence-based regimens were deselected for initial treatment choices at the time of initial decision support. This process was streamlined using web-based technology that improved pathways compliance and tracking of off-pathways exceptions.12 Retrospective studies indicated that pathways had the potential to bend the cost curve by reducing drug spending.13,14 USON and its practices also tested a nurse call system (Innovent Oncology) funded by a monthly management fee. This program guided patients through chemotherapy with regular telephonic symptom assessment and discussion of patient-centered values and advance care planning. Results of these programs indicated relative reductions in both drug and hospital expenses.15
Additional experience has come from participation in the United Healthcare Episodes of Care (EOC) initiative, which eliminated the chemotherapy drug incentives, compensating physicians on a per-episode basis instead. This study showed a significant reduction in the total cost of cancer therapy after modifying the fee-for-service system and incorporating feedback data and financial incentives to reward improved outcomes and cost efficiency.16
The Oncology Care Model represents a convergence of purchaser demand and provider readiness. The purchaser holds providers accountable for cost and quality. The data on outcomes and costs will provide an extensive database that can be analyzed by the participating practices to address variations and reduce unnecessary care and preventable costs. Best practices are rewarded.17
The OCM and practice readiness
As a part of the CMS proposal process, practices were required to submit implementation plans by June 30, 2015. The purpose of the implementation plan was to define how a practice could transform over 6 broad domains: 24/7 coverage; EHR certification; navigation and care coordination; continuous quality improvement; incorporation of the Institute of Medicine’s (IOM’s) Care Management Plan; and adherence to nationally recognized guidelines. The periods of patient eligibility for the program were 6-month treatment episodes triggered by a cancer diagnosis, a provider encounter claim, and a Part B or D drug claim specifically identified as a cancer treatment. The episodes could be repeated if the 3 criteria continued to be met. All charges continued to be billed as fee-for-service as before, but in addition, participating practices could bill a monthly enhanced oncology services (MEOS) payment for the duration of an episode. Reducing the total cost of care while meeting performance metrics thresholds would also qualify a practice for performance-based payments.
Of the primary components, EHR certification and adherence to guidelines had been addressed previously, but the other domains represented significant challenges. Although 24/7 physician coverage with access to an EHR is standard for all practices, most practice sites do not have an insight into the frequency of hospital admissions, the ability to efficiently add sick patients to the daily schedule, or a routine call system to assess chemotherapy toxicity.
The OCM proposes 10 potential navigation/care coordination functions (Table 1) and does not consider those functions to be the role of one person, but rather a team responsibility. Most of our practices perform at least some of these functions, but they are not formally designated, coordinated, or recorded. A similar condition exists for the IOM care plan, which includes recommendations for treatment and adverse event management (Table 2). The prognosis, toxicity, quality-of-life, and goals-of-care requirements are often found in the physician notes, but not systematically documented or searchable.
Similar challenges have been observed for continuous quality improvement programs. Although the data are available, they are often not easy to search and, therefore, are difficult to retrieve and report. The OCM, as with any transformational program, must always weigh the benefit of information with the burden of consumption of physician and staff time to collect and input these data.18
Prepilot project work
In October 2015, lead physicians and managers from the 12 participating practices were brought together with analytic, technical, process management, and business experts from USON and McKesson Specialty Health. The objective of the meeting was to define the areas of greatest need for day 1 of the OCM and to be prepared. The challenges were to identify the changes needed to meet the requirements of the OCM while improving the patient experience, sustaining the viability of the community oncology practices, creating teams to deliver more effective care, and using data to bend the cost curve. Accordingly, 4 work streams were created: Care and Support; Content; Technology; and Communications, Revenue Cycle and Incentives.
Care and Support
The key tasks of the Care and Support team were to define the workflows for navigation and the IOM care plan. As a patient’s journey through the clinic was mapped out, it became clear that although multiple personnel could participate in the navigation and care plans, there was no systematic way to organize and record the components of successful navigation. The goals for the pilot were to test various options for navigation and to identify best practices that could be translated into standard operating procedures.
Content
The Content team was charged with identifying available programs that would fit into the OCM requirements. These included advance care planning, survivorship, chemotherapy teaching, risk assessment, pathways, and symptom assessment. A longer-term goal was the development of care paths, a more comprehensive map of the patient’s journey that would include consultations, coordinated care, imaging, labs, and other services.
Technology
The task for the Technology work stream was to identify processes of care that required documentation and to evaluate current and future technology solutions to improve efficiencies. The electronic medical record satisfied for the input of data with relevant clinical details, demographics, disease types, and staging. A web-based pathways tool supported clinical decision-making, as well as compliance to pathways. The Medicare quality metric programs set the stage for development of capture and reporting tools for data from many sources. The pilot would indicate the adequacy of these tools and the need for expansion or development of new functions or programs. Of particular importance was recording the IOM care plan and navigation functions in a searchable format. As care paths are developed, risk prediction, palliative care, and other services need to be encompassed. Finally, technology will support the identification and enrollment of eligible patients, and billing activities.
Communications, Revenue Cycle, and Incentives
The final work stream was Communications, Revenue Cycle, and Incentives. For the pilot, the focus was on revenue cycle. A new category of patient needed to be identified, enrolled, and billed to CMS for services. At the outset, the technology did not address the identification of patients receiving only oral drugs. The office visit, the diagnosis, and the drug claim all had to be aligned for enrollment and billing. It was critical to understand the workload by patient and total volume to estimate the technology and personnel needs to meet the initial number of new OCM patients. Communication refers to both internal and external parties. Education of the entire practice staff regarding transformation will be critical for success.
Of the 12 participating practices, 3 practice sites were selected for the pilot program. Each had fewer than 10 medical oncologists and at least 1 radiation oncologist. Each site had a physician champion and an administrative lead. All of the sites were part of a larger regional oncology practice. A fourth site had independently started a pilot and that experience was shared with the larger group as well. The sites were distributed across the country in 4 different time zones.
The pilot experience
The pilot experience yielded important findings, some expected and some unexpected. The challenges of navigation, the treatment plan, and team building were anticipated. We were surprised at the sheer number of potential candidates and the difficulty in finding eligible candidates. Not to be overlooked was a need for continued and possibly increased emphasis on adherence to pathways and process changes to reduce hospitalizations and emergency department (ED) visits.
Navigation
At the outset, none of the pilot practices had formal navigation processes as outlined in Table 1. Many of the processes, such as coordinating appointments and facilitating follow-up services and financial support, were provided by the practice, but were not identified or coordinated as navigation. The practices, as a first step, defined who was responsible for those services and identified 1 person who would be responsible for their completion. It was agreed that navigation was a process shared by a team and not an individual responsibility, yet the person who would monitor the completion of the tasks was not identified. It soon became apparent that true navigation included more tasks than initially outlined.
Additional tasks included appropriate patient education regarding treatment toxicities, follow-up after chemotherapy or a hospitalization, and coordination of other aspects of the IOM care plan, such as survivorship and advance care planning. Each of the practices recruited staff internally to assume the navigator role, and standard operating procedures were developed for completing and documenting this expanded responsibility. True navigation, however, depends on building the team character while still having 1 or 2 members of the team identified as being responsible for following and documenting the patient’s journey through an episode. To meet those needs, navigators developed ad hoc methods, such as spreadsheets, to track patients. The technology team developed drop-down check lists within the EHR, but the burden of documentation continued. Lastly, an ongoing challenge is how best to designate responsibility and assess how many additional staffers are needed.
IOM Care Management Plan
Before initiation of the pilot project, no practice was providing patients with a comprehensive, written treatment plan. Considerably more than half of the members of the work-stream teams believed that would be difficult to implement. However, the members of the Care and Support work stream made some fundamental assumptions to make the care plan workable: first, all aspects of the plan did not occur at the same time, and were not completed by the same person; second, and critically, items 2-9 of Table 2 could be completed at one time during the early conversations between the physician and patient about the goals of treatment. Diagnosis, prognosis, treatment intent, response rate, quality of life, and toxicities were included in the treatment plan, and the remaining IOM care plan could be discussed, or at least identified, as issues for further discussion with other team members. These components were incorporated into a 1-page document that was either typed into the record and printed out or handwritten and copied for the patient. This became the treatment plan and was ready for use at the start of the pilot.
The physician response to the treatment plan was mixed. One site adopted it enthusiastically and quickly moved to use the plan for all patients. Other sites had variable uptake. One hurdle was defining response rate to therapy and prognosis. Data were provided but they often did not match the conditions of individual patients. Some physicians were uncomfortable with the process. Documentation was difficult because the plans had to be scanned into the EHR. Patients generally responded favorably to the plans and would bring them to teaching or chemotherapy sessions.
As with navigation, the treatment plan challenges pointed the technology team toward the development and implementation of an electronic version of the plan. The pilot allowed members of the technology team to visit the clinics, to evaluate workflows and make assumptions on how to structure a treatment plan electronically.
Team-based care
None of the pilot sites had a formalized structure for team-based care. Team huddles were developed and weekly and daily huddles were encouraged. The weekly huddles took about 15-30 minutes, during which patients scheduled for the coming week were reviewed. All personnel who saw patients were invited – benefit counselors, advanced practice providers, schedulers, lab technicians, medical assistants, office and infusion nurses, social workers, pharmacists, physicians, and lead administrative staff. The daily huddle was smaller and generally included a nurse, a medical assistant, and a physician, at a minimum, to review the patients in the hospital, those to be seen in the clinic that day, and any follow-up information based on scheduled contact following recent treatments or events. In some sites, these huddles were uniformly endorsed, in others, not at all. Although many physicians felt that the functions were being handled informally and the additional time commitment would not improve the process, once they began to attend the meetings, they appreciated the value of the huddles and continued attending them. As the complexity of delivery and documentation becomes more apparent, these will prove indispensable to coordinated care.
24/7 access
Hospitalization is one of the chief drivers of the total cost of care, so the pilot sites were concerned that more needed to be done to reduce unnecessary hospitalizations. One site surveyed the patients coming into the clinic about their previous ED visits. Many of the visits had been for noncancer-related events and the clinic was not aware of many of the many of the visits. These findings prompted a number of changes. Open slots were created daily for patients who needed to be worked in for any areas of concern. The on-call physician, triage nurse, or navigation lead could fill these slots. All patients discharged from the hospital were called within 48 hours after discharge and scheduled for a clinic visit within 1 week. Night and weekend call logs were scrutinized each morning and patients’ calls were returned for any issues related to symptom or toxicity management. At one site, patients were given wallet cards with the clinic number, the treatment regimen, and, on the reverse, all symptoms that would justify calling the clinic. The patients were encouraged to call the clinic earlier rather than later in the day. On the back end, the clinics were to have processes in place so that patient calls would be answered quickly to facilitate same-day evaluations in the clinic.
Enrollment and revenue cycle
The most intractable problem was the identification and enrollment of OCM patients. As already noted, 3 components were necessary for enrollment: a drug charge for Part B or D Medicare, a provider visit, and an approved cancer diagnosis. To identify those patients, the claims system would churn out a weekly list of all eligible patients. However, the claims system had no mechanism to pick up Part D claims for oral medications. This meant that any patient with a provider visit and an appropriate diagnosis was potentially eligible for enrollment. At one site, the list of potential patients was 2-3 times the number of actual candidates. It took 6 weeks of manual chart review to resolving the list. Collectively, the 12 practices could have as many as 20,000 patients eligible for the July 1 enrollment. The pilot allowed the practices to get an early start on recruitment of business office staff and plans to address the backlog of potentially eligible patients. The process of identifying eligible patients for the OCM still needs a better solution because finding the appropriate patients is a critical first step in this model.
Underlying all of these initiatives is communication, both internal and external. We have to select and celebrate best practices. We have to educate our staffs. We will have to demonstrate that we are giving better care to our patients by using patient and provider testimonials and data.
From angst to analytics
The challenges of practice transformation can be daunting. It will be difficult to formalize processes and document data in ways that were untested before the pilot program was set up. However, the pilot accomplished 2 things: it identified additional areas that needed improvement and it demonstrated that the most challenging aspects of the OCM were feasible. Navigation and the IOM care plan were broken down into parts; each component was separately addressed, and programs were put in place to make the pieces manageable and part of an overall movement toward team-based care. The addition of a technology platform has been a key factor for the success of the value-based care initiative. Additional technology support has been enlisted to facilitate the processes, and an electronic version of the treatment plan is being tested. More difficult will be efforts to address the cultural resistance to change, which we hope to do by using data and outcomes from the CMS claims data files. The OCM represents an unprecedented opportunity for measurement of the quality of care we deliver.
We are now well und
Acknowledgment
The authors thank Supriya Srinivasan, PhD, for editorial support.
1. Oncology Care Model. Centers for Medicare and Medicaid Services 2016. https://innovation.cms.gov/initiatives/oncology-care/. Last updated November 14, 2017. Accessed November 16 2016.
2. Mortimer L, Strawbridge L, Lukens E, et al. CMS’ Oncology Care Model: delivering higher value cancer care. Clin Pharmacol Ther. 2017.
3. Medicare Prescription Drug, Improvement and Modernization Act of 2003, Pub Law No. 108-173; 2003.
4. Mathews D. The sequester: absolutely everything you could possibly need to know, in one FAQ. https://www.washingtonpost.com/news/wonk/wp/2013/02/20/the-sequester-absolutely-everything-you-could-possibly-need-to-know-in-one-faq/?utm_term=.a0f3a768399b. Published February 20, 2013. Accessed December 4, 2017.
5. Community Oncology Alliance. 2016 community oncology practice impact report: tracking the changing landscape of cancer care. https://www.communityoncology.org/wp-content/uploads/2016/09/PracticeImpactReport-2016-Report.pdf. Issued October 4, 2016. Accessed April 10, 2017.
6. The Patient Protection and Affordable Care Act, Pub Law No. 111-148; 2010.
7. Centers for Medicare and Medicaid Services. Shared Savings Program 2016. https://www.cms.gov/Medicare/Medicare-Fee-for-Service-Payment/sharedsavingsprogram/index.html?redirect=/sharedsavingsprogram/. Last modified October 12, 2017. Accessed November 16 2016.
8. Dale SB, Ghosh A, Peikes DN, et al. Two-year costs and quality in the comprehensive primary care initiative. N Engl J Med. 2016;374:2345-2356.
9. McWilliams JM, Chernew ME, Landon BE, Schwartz AL. Performance differences in year 1 of pioneer accountable care organizations. N Engl J Med. 2015;372:1927-1936.
10. Rajkumar R, Press MJ, Conway PH. The CMS Innovation Center – a five-year self-assessment. N Engl J Med. 2015;372:1981-1983.
11. Waters TM, Webster JA, Stevens LA, et al. Community oncology medical homes: physician-driven change to improve patient care and reduce costs. J Oncol Pract. 2015;11(6):462-467.
12. Wilfong LS, Hoverman JR, Gosse N, Neubauer MA, Torres V. Changing physician compensation and implementing new technology to enhance pathways compliance. J Clin Oncol. 2016;34(Suppl 7S):Abstr 187.
13. Hoverman JR, Cartwright TH, Patt DA, et al. Pathways, outcomes, and costs in colon cancer: retrospective evaluations in two distinct databases. J Oncol Pract. 2011;7(3 Suppl):52s-59s.
14. Neubauer MA, Hoverman JR, Kolodziej M, et al. Cost effectiveness of evidence-based treatment guidelines for the treatment of non-small-cell lung cancer in the community setting. J Oncol Pract. 2010;6(1):12-18.
15. Hoverman JR, Klein I, Harrison DW, et al. Opening the black box: the impact of an oncology management program consisting of level I pathways and an outbound nurse call system. J Oncol Pract. 2014;10(1):63-67.
16. Newcomer LN, Gould B, Page RD, Donelan SA, Perkins M. Changing physician incentives for affordable, quality cancer care: results of an episode payment model. J Oncol Pract. 2014;10(5):322-326.
17. Meyer JA, Rybowski L, Eichler R. Theory and reality of value-based purchasing: lessons from the pioneers. Rockville, MD.: Agency for Health Care Policy and Research; 1997.
18. Stein CM. Academic clinical research: death by a thousand clicks. Sci Transl Med. 2015;7:318fs349.
19. Churchill W. The end of the beginning. 1st ed. Boston, MA: Little Brown & Co; 1943.
Combo is preferentially active in T-cell lymphomas
LA JOLLA, CA—A 2-drug combination has demonstrated preferential activity in T-cell lymphomas over B-cell lymphomas, according to researchers.
In a small, phase 1/2 study, treatment with oral 5-azacitidine and romidepsin produced a higher overall response rate (ORR) and prolonged progression-free survival (PFS) in patients with T-cell lymphomas.
“In a very limited sample, we’ve definitely observed exquisite activity of the combination in patients with T-cell lymphoma compared to all other subtypes,” said Lorenzo Falchi, MD, of Columbia University Medical Center in New York, New York.
Dr Falchi presented these results at the 10th Annual T-cell Lymphoma Forum.
The research was funded by the Leukemia and Lymphoma Society, the Lymphoma Research Fund at Columbia University, and Celgene.
The phase 1 portion of this study included patients with previously treated non-Hodgkin lymphoma (NHL) or Hodgkin lymphoma. The phase 2 portion included only patients with T-cell lymphomas, newly diagnosed or previously treated.
Thirty-three patients were enrolled—12 with Hodgkin lymphoma, 8 with B-cell NHL, and 13 with T-cell NHL.
The patients’ median age was 54 (range, 23-79). Fifty-seven percent (n=19) were male. Sixty-one percent of patients were non-Hispanic white (n=20), 24% (n=8) were black, and 12% (n=4) were Asian.
“This was a very heavily pretreated patient population,” Dr Falchi noted. “I’d like to emphasize that the median number of prior treatments is 5 [range, 0-15].”
“Over half of patients had had stem cell transplantation [17 autologous and 5 allogeneic]. And, if you look at the subtypes by histology, all patients, pretty much, at some point, received all the standard chemotherapy or treatment approaches that are typically used for that subtype.”
Treatment
Patients were divided into 7 dosing cohorts. Azacitidine doses ranged from 100 mg to 300 mg on days 1-14 or days 1-21 per cycle.
Romidepsin doses ranged from 10 mg/m2 to 14 mg/m2. The drug was given on days 8 and 15 every 21 or 28 days, or it was given on days 8, 15, and 22 every 35 days.
There were 2 dose-limiting toxicities (DLTs) in cohort 2—grade 3 thrombocytopenia and grade 3 pleural effusion. In this cohort, 3 patients received azacitidine at 200 mg on days 1-14 plus romidepsin at 10 mg/m2 on days 8 and 15 every 21 days.
There were 3 DLTs in cohort 7—2 cases of grade 4 neutropenia and 1 case of grade 3 thrombocytopenia. In this cohort, 5 patients received azacitidine at 300 mg on days 1 to 21 plus romidepsin at 14 mg/m2 on days 8, 15, and 22 every 35 days.
Because of the DLTs in cohort 7, cohort 6 was chosen as the maximum tolerated dose. In cohort 6, 3 patients received azacitidine at 300 mg on days 1-14 plus romidepsin at 14 mg/m2 on days 8, 15, and 22 every 35 days.
Patients in the expansion cohort received treatment at the maximum tolerated dose. This cohort included 7 patients with T-cell lymphoma.
Safety
Treatment-emergent adverse events occurring in at least 5% of patients included:
- Anemia—3% grade 3
- Anorexia—9% grade 1
- Back pain—6% grade 2
- Constipation—6% grade 1
- Cough—9% grade 1
- Depression—3% grade 1 and 2
- Diarrhea—15% grade 1 and 6% grade 2
- Dyspnea—3% grade 1 and 2
- Fatigue—21% grade 1, 9% grade 2, and 3% grade 3
- Febrile neutropenia—3% grade 3 and 4
- Fever—6% grade 1 and 3% grade 2
- General disorders and administration site conditions—15% grade 1
- Hyperglycemia—3% grade 3
- Hypokalemia—6% grade 1
- Hypotension—3% grade 3
- Insomnia—6% grade 1
- Oral mucositis—9% grade 1 and 3% grade 2
- Nausea—18% grade 1, 27% grade 2, and 3% grade 3
- Neutrophil count decrease—3% grade 3 and 4
- Pain—3% grade 1 and 6% grade 2
- Pain of skin—3% grade 1 and 2
- Platelet count decrease—6% grade 2, 9% grade 3, and 6% grade 4
- Urinary tract infection—3% grade 3
- Vomiting—18% grade 1 and 21% grade 2.
Efficacy
Twenty-eight patients were evaluable for efficacy. The ORR for these patients was 36% (n=10).
The complete response (CR) rate was 22% (n=6), and the partial response (PR) rate was 14% (n=4). Twenty-five percent of patients (n=7) had stable disease, and 39% (n=11) progressed.
Dr Falchi noted that the ORR was “much higher” in patients with T-cell lymphoma than in those with B-cell lymphoma—80% (n=8) and 11% (n=2), respectively.
The CR rates were 50% (n=5) in T-cell lymphoma patients and 5.5% (n=1) in B-cell patients. PR rates were 30% (n=3) and 5.5% (n=1), respectively. Thirty-nine percent (n=7) of B-cell patients had stable disease, but none of the T-cell patients did.
“Patients with non-T-cell lymphoma were much more likely to progress on treatment,” Dr Falchi noted. “Half of them did so [n=9].”
This is in comparison to the 20% of T-cell lymphoma patients who progressed on treatment (n=2).
Disease subtypes for complete responders included transformed follicular lymphoma (n=1), T-lymphoblastic lymphoma (n=1), adult T-cell leukemia/lymphoma (n=1), extranodal NK/T-cell lymphoma (n=1), and angioimmunoblastic T-cell lymphoma (n=2).
Partial responders had follicular lymphoma (n=1), cutaneous peripheral T-cell lymphoma (n=1), cutaneous anaplastic large-cell lymphoma (n=1), and angioimmunoblastic T-cell lymphoma (n=1).
The 2 responders with B-cell lymphoma (1 CR and 1 PR) ultimately progressed and died.
Of the 8 responders with T-cell lymphoma, 3 have an ongoing CR, and 2 of these patients proceeded to transplant.
One T-cell patient who achieved a CR and proceeded to transplant was lost to follow-up. Another died after transplant.
Two T-cell patients who achieved a PR progressed and died. And 1 patient has an ongoing PR.
In total, 75% of patients (n=21) progressed. The median PFS for the entire study cohort was 3.6 months (range, 1.5-5.7).
The median PFS was 2.2 months (range, 1.1-3.2) for patients with B-cell lymphomas and was not reached for the T-cell lymphoma patients.
Eighty-nine percent of B-cell patients progressed (n=16), as did 40% of T-cell patients (n=4).
Dr Falchi and his colleagues are now conducting studies to correlate the pharmacokinetics of azacitidine-romidepsin with genome-wide methylation and correlate TET2, IDH2, and DNMT3A mutation status with clinical response. ![]()
FDA expands approved use of ferumoxytol injection

The US Food and Drug Administration (FDA) has expanded the approved indication for ferumoxytol injection (Feraheme®).
The drug is now approved to treat adults with iron deficiency anemia (IDA) who cannot tolerate or have had an unsatisfactory response to oral iron.
Ferumoxytol injection was previously approved by the FDA to treat IDA in adults with chronic kidney disease.
“Iron deficiency anemia is a serious and under-treated health condition which negatively impacts quality of life for millions of people, many of whom do not benefit from or cannot tolerate oral iron therapy,” said Michael Auerbach, MD, of Georgetown University School of Medicine in Washington, DC.
“Physicians now have a new option for patients who meet the broader ferumoxytol injection indication that can be administered in 15 minutes, providing a gram of iron in 2 doses as few as 3 days apart.”
The expanded approval for ferumoxytol injection was supported by a trio of phase 3 trials. All 3 trials included IDA patients who could not tolerate or had an unsatisfactory response to oral iron.
In the first trial (NCT01114139), researchers compared ferumoxytol injection to placebo.
The second trial (NCT01114204) was a comparison of ferumoxytol injection and iron sucrose.
In the third trial (NCT02694978), researchers compared ferumoxytol injection to ferric carboxymaltose injection (Injectafer®).
Details on these trials are included in the prescribing information for ferumoxytol injection, which is available at www.feraheme.com.
The prescribing information includes a boxed warning detailing the risk of fatal and serious hypersensitivity reactions, including anaphylaxis, in patients receiving ferumoxytol injection.
Ferumoxytol injection is a product of AMAG Pharmaceuticals, Inc.
The company has a patient access support program called AMAG Assist™. Uninsured or underinsured patients who need help paying for their ferumoxytol injection prescription can call 844-635-2624 to see if they qualify for help. ![]()
Duvelisib combos show promise for PTCL, CTCL
LA JOLLA, CA—Phase 1 results suggest duvelisib combination therapies can be active and well-tolerated in patients with relapsed/refractory T-cell lymphomas.
Researchers said duvelisib had an acceptable safety profile when given in combination with romidepsin or bortezomib to patients with relapsed/refractory peripheral T-cell lymphoma (PTCL) or cutaneous T-cell lymphoma (CTCL).
Duvelisib plus romidepsin produced a 60% overall response rate (ORR) in these patients, and duvelisib plus bortezomib produced a 35% ORR.
Response rates were higher in PTCL patients than CTCL patients.
Neha Mehta-Shah, MD, of Washington University in St. Louis, Missouri, and her colleagues presented these results in a poster at the 10th Annual T-cell Lymphoma Forum.
The research was supported by the Leukemia & Lymphoma Society, Infinity Pharmaceuticals, and Verastem Inc.
This phase 1 trial consists of parallel arms evaluating duvelisib in combination with romidepsin (arm A) or bortezomib (arm B). The trial enrolled patients with PTCL or CTCL that had progressed after at least 1 prior therapy.
All patients received duvelisib at 25 mg, 50 mg, or 75 mg twice daily for 28-day cycles.
Patients in arm A received romidepsin at 10 mg/m2 on days 1, 8, and 15 of each cycle.
Patients in arm B received bortezomib at 1 mg/m2 on days 1, 4, 8, and 11 of each cycle.
Romidepsin combination
Sixteen patients received duvelisib plus romidepsin, and 15 of them were evaluable for efficacy. Eleven patients had PTCL, and 4 had CTCL.
The ORR was 60% (9/16), and the complete response (CR) rate was 27% (n=4). The median time to response was 51 days (range, 49-54).
The ORR was 64% in the PTCL patients and 50% in the CTCL patients. All 4 CRs occurred in PTCL patients, 2 in patients with PTCL not otherwise specified (NOS) and 2 in patients with angioimmunoblastic T-cell lymphoma (AITL).
There were 5 responses among patients who received the 75 mg dose of duvelisib (n=8) and 2 responses each in the 50 mg dose group (n=3) and 25 mg dose group (n=4).
There were no dose-limiting toxicities, so the 75 mg dose of duvelisib was considered the maximum tolerated dose.
All 16 patients were evaluable for safety. There were 2 serious adverse events (AEs) considered possibly related to treatment—grade 3 fatigue and grade 2 aspartate aminotransferase (AST) increase.
There were 2 deaths considered unrelated to treatment—diffuse alveolar hemorrhage after allogeneic transplant and sepsis in the setting of disease progression.
Treatment-related AEs (occurring in at least 2 patients) were fatigue (56%), nausea (50%), altered taste (50%), diarrhea (38%), neutropenia (38%), rash (31%), thrombocytopenia (25%), dysphagia (25%), and anorexia (25%).
Grade 3/4 treatment-related AEs included neutropenia (38%) and thrombocytopenia (6%).
One patient discontinued duvelisib-romidepsin due to toxicity, and 7 discontinued due to progressive disease.
Three patients proceeded to bone marrow transplant/donor lymphocyte infusion, and 4 patients are still receiving study treatment.
Bortezomib combination
There were 17 patients who received duvelisib plus bortezomib—10 with PTCL and 7 with CTCL.
The ORR was 35% (6/17), and the CR rate was 18% (n=3). The median time to response was 52 days (range, 47-57).
The ORR was 50% in PTCL patients and 14% among CTCL patients.
All 3 CRs occurred in the PTCL patients—1 in a patient with AITL, 1 in a patient with PTCL-NOS, and 1 in a patient who had intestinal T-cell lymphoma with B-cell lymphoproliferative disorder.
There were 3 responses among patients who received the 25 mg dose of duvelisib (n=8), 2 responses in the 50 mg dose group (n=3), and 1 response in the 75 mg dose group (n=6).
There was 1 dose-limiting toxicity—pneumonia—in a patient treated at the 25 mg dose.
The 25 mg dose was deemed optimal due to grade 3 alanine transaminase (ALT)/AST elevations observed after cycle 1 with the 50 mg dose (n=3) and the 75 mg dose (n=2).
There were 6 serious AEs considered possibly related to treatment:
- Grade 3 pneumonia (n=2)
- Grade 3 infectious colitis (n=1)
- Grade 3 colitis (n=1)
- Grade 4 ALT/AST elevation (n=1)
- Grade 5 Stevens-Johnson syndrome (n=1).
The fatal case of Stevens-Johnson syndrome was considered possibly related to bortezomib, duvelisib, and trimethoprim-sulfamethoxazole, a medication that was started at the beginning of the study.
Treatment-related AEs (occurring in at least 2 patients) included diarrhea/colitis (71%), ALT/AST increase (41%), rash (24%), neutropenia (24%), nausea/vomiting (24%), chills (24%), fatigue (24%), and alkaline phosphatase increase (12%).
Grade 3/4 AEs included ALT/AST increase (35%), rash (12%), neutropenia (12%), diarrhea/colitis (6%), and alkaline phosphatase increase (6%).
Seven patients discontinued duvelisib-bortezomib due to toxicity, and 8 discontinued due to disease progression. Two patients are still on study treatment. ![]()