User login
TNF inhibitors’ effect on ankylosing spondylitis progression may be greatest after 6 years
The benefits of treatment with TNF-alpha inhibitors in reducing spinal radiographic progression in ankylosing spondylitis became most evident 6-8 years after the biologic therapy was initiated, according to findings from a prospective observational cohort study.
The study enrolled 210 consecutive patients from the Groningen Leeuwarden AS (GLAS) cohort who initiated treatment with TNF-alpha inhibitors during 2004-2012 and who received baseline and biannual radiographs over the 8-year follow-up.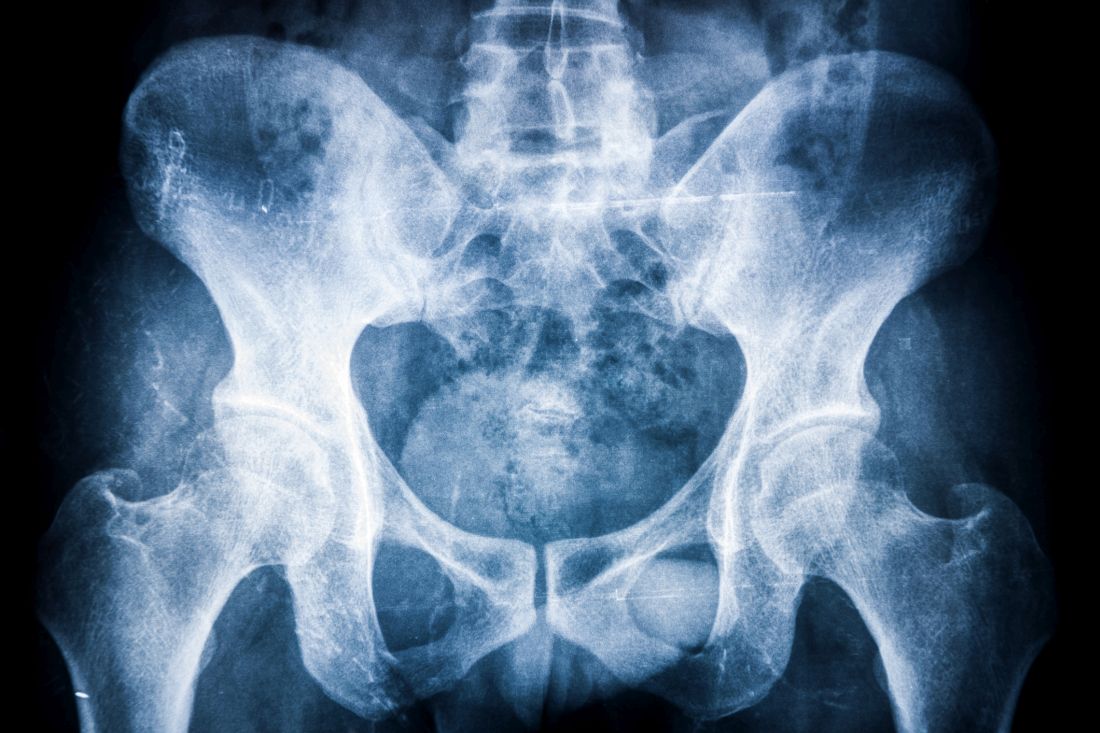
In patients with complete modified Stoke AS Spine Score (mSASSS) data over 8 years of follow-up, the estimated mean spinal radiographic progression was 2.3 points during the first 2 years of treatment and then declined steadily to 1.4 in years 2-4, 1.0 in years 4-6 and 0.8 in years 6-8. This decrease was seen even after adjusting for baseline mSASSS, the presence of syndesmophytes, sex, HLA-B27 status, age, symptom duration, smoking duration, body mass index, disease activity, and NSAID use.
Patients with longer follow-up also showed more use of NSAIDs, higher C-reactive protein levels, and more spinal radiographic damage at baseline. There were, however, significant improvements in all disease activity measures as soon as patients began treatment, and patients also showed a rapid decrease in NSAID use over time, said Fiona Maas of the University Medical Center Groningen (Netherlands) and her associates.
Multiple studies have been conducted into the impact of TNF-alpha inhibitors on spinal radiographic progression in ankylosing spondylitis, but the results have been subject to some debate, the investigators noted.
“It is known that radiographic progression in AS is overall slow and highly variable between patients,” they wrote. “Therefore, differences in patient numbers at the different time points during follow-up can affect the outcome measure of interest, in this case radiographic progression.”
In this study, researchers saw a straightforward linear progression of disease in the first 4 years after treatment was initiated but a deflection from linear progression in years 6 and 8.
“These results may refer to a delayed effect of TNF-alpha inhibitors on radiographic progression and support the TNF brake hypothesis,” they wrote, suggesting that the long-term inhibition of inflammation with TNF-alpha inhibitors diminishes new bone formation over time in patients with longstanding disease.
The GLAS cohort was supported Pfizer. Four authors declared research grants and consulting fees from pharmaceutical companies including Pfizer. No other conflicts of interest were declared.
FROM ARTHRITIS CARE & RESEARCH
Key clinical point: The .
Major finding: Spinal radiographic progression rates on the modified Stoke AS Spine Score in ankylosing spondylitis patients treated with TNF-alpha inhibitors dropped from 2.3 during the first 2 years of treatment to 0.8 in years 6-8 after treatment initiation.
Data source: The Groningen Leeuwarden AS (GLAS) prospective observational cohort study involving 210 patients with ankylosing spondylitis.
Disclosures: The GLAS cohort was supported by Pfizer. Four authors declared research grants and consulting fees from pharmaceutical companies, including Pfizer. No other conflicts of interest were declared.
Birth outcomes unaffected by paternal immunosuppressive therapy
VIENNA – The use of classic systemic immunosuppressive agents by men in the months shortly before conception was not associated with increased risk of low birthweight, preterm birth, or congenital anomalies in their offspring in a large Danish national registry.
“We didn’t see any real safety signals,” Dr. Alexander Egeberg reported at the annual congress of the European Academy of Dermatology and Venereology.
He and his coinvestigators at the University of Copenhagen decided to examine this issue for a simple reason: “We know quite a lot from registry studies about the safety of these drugs when used by women during pregnancy, but very little about the safety of paternal use,” Dr. Egeberg explained.
Methotrexate, azathioprine, and cyclosporine are often prescribed for patients with moderate to severe psoriasis and psoriatic arthritis as well as other chronic inflammatory disorders. Female patients are typically told to stop using these medications if they’re trying to become pregnant, or as soon as they think they might be pregnant, but nearly half of all pregnancies are unintended.
Using linked comprehensive national Danish databases, the investigators scrutinized the medical records of all children born in Denmark during 2004-2010, as well as those of their parents. They identified 2,235 children whose fathers had been on immunosuppressive therapy for a medical condition at any time prior to conception. There were 1,246 fathers who had been on azathioprine, 848 on methotrexate, and 141 on cyclosporine.
Rates of preterm birth, congenital anomalies, and low birthweight were compared in children born to fathers using immunosuppression and in 415,589 children born to fathers with no history of exposure to the medications. These comparisons entailed multivariate regression analyses adjusted for maternal age, parity, smoking status, and the child’s gender. Dr. Egeberg and his colleagues also compared rates of these reproductive complications in the subgroup of children whose fathers had been on the medications within 3 months prior to the estimated time of conception and in children whose fathers had stopped taking the drugs by that point.
None of the adverse neonatal outcomes were significantly increased in ever or recent paternal users of the medications under study, with one exception. Paternal use of cyclosporine within the last 3 months prior to conception was associated with an adjusted 3.7-fold increased likelihood of having a baby with a congenital anomaly. Dr. Egeberg, however, was quick to state that this finding was based on small numbers of exposures: 18 paternal exposures and four affected offspring.
“The cyclosporine finding should be interpreted quite cautiously,” he emphasized.
The reproductive outcomes study was supported by Danish governmental research funds. Dr. Egeberg reported having received research funding from and serving as a consultant to Pfizer and Eli Lilly.
AT THE EADV CONGRESS
Key clinical point:
Major finding: Adjusted rates of congenital anomalies, preterm birth, and low birthweight are not increased in children with paternal use of azathioprine, methotrexate, or cyclosporine prior to conception.
Data source: This retrospective study utilized linked Danish national registries to compare rates of low birthweight, congenital anomalies, and preterm birth in all Danish children born in 2004-2010 depending upon whether or not the father had been on methotrexate, azathioprine, or cyclosporine prior to the pregnancy.
Disclosures: The study was supported by Danish governmental research funds. Dr. Egeberg reported having received research funding from, and serving as a consultant to, Pfizer and Eli Lilly.
VIDEO: DNA-derived Zika vaccine in humans holds promise
BALTIMORE – Hope is high right now for a genetically engineered Zika virus vaccine currently being tested in humans.
“If we saw something, even early on, that we were concerned about, we would stop the trial and re-evaluate it. And that hasn’t happened, so that’s good news,” said Kathleen M. Neuzil, MD, lead investigator of the trial and a professor at the University of Maryland in Baltimore, where she is also director of the Center for Vaccine Development.
Testing of the DNA-based Zika vaccine began in early August. Now that Congress has approved a $1.1 billion funding package, Dr. Neuzil said investigators can rest assured that there is enough funding for the duration of this trial, which ultimately could take 2 years or longer.
Sponsored by the National Institutes of Health, phase I of the trial is being conducted at three U.S. sites, including the University of Maryland’s Vaccine Development Center, the NIH Clinical Center in Bethesda, Md., and Emory University in Atlanta.
Safety and tolerability results from all three sites are expected by year’s end and will inform how to construct phase II, currently set to begin in early 2017. That phase is expected to include a much larger population than the 80 current participants, although the exact numbers are still to be determined, Dr. Neuzil said. Also still unknown is whether phase II will be conducted internationally.
If the vaccine proves effective, it will be a high point in the annals of maternal-fetal medicine, said Christopher Harman, MD, chair of obstetrics and gynecology and director of the division of maternal-fetal medicine at the University of Maryland. “It’s going to become a story where the power of modern medicine has defeated an epidemic that had enormous potential for harm.”
Dr. Harman also predicted that a viable vaccine, combined with infectious disease prevention services globally, will mitigate Zika’s threat to the population, particularly developing fetuses.
In the meantime, there needs to be continued public education about preventing the spread of Zika, as well as rigorous attention to family planning, Dr. Harman said.
“Planned pregnancy is essential,” he said. “This puts the burden on the couple or the woman. Don’t get pregnant if you’re in an endemic area.”
For more about the vaccine trial and how clinicians can counsel patients about the threat of Zika, watch this video recorded at the University of Maryland.
The video associated with this article is no longer available on this site. Please view all of our videos on the MDedge YouTube channel

Cord blood product granted breakthrough designation
Photo courtesy of NHS
The US Food and Drug Administration (FDA) has granted breakthrough therapy designation for NiCord®, a product in development as a graft modality for patients undergoing hematopoietic stem cell transplant to treat high-risk hematologic malignancies.
NiCord consists of cells from a single unit of umbilical cord blood cultured in nicotinamide (a vitamin B derivative) and cytokines that are typically used for expansion (thrombopoietin, interleukin 6, FLT3 ligand, and stem cell factor).
Data from the pilot and phase 1/2 studies of NiCord have suggested the therapy can provide a clinically meaningful improvement in time to neutrophil engraftment over traditional cord blood transplant.
Additional research presented at EBMT 2016 showed that patients who received NiCord had fewer infections, shorter hospital stays, quicker platelet engraftment, and improved non-relapse mortality when compared to patients who received a traditional cord blood transplant.
The phase 3 registration study of NiCord is scheduled to begin before the end of this year.
In addition to breakthrough designation, NiCord also has orphan designation from the FDA as a treatment for patients with acute lymphoblastic leukemia, acute myeloid leukemia, Hodgkin lymphoma, or myelodysplastic syndromes.
NiCord is being developed by Gamida Cell.
About breakthrough designation
The FDA’s breakthrough designation is intended to expedite the development and review of new therapies for serious or life-threatening conditions.
Breakthrough designation entitles the company developing a therapy to more intensive FDA guidance on an efficient and accelerated development program, as well as eligibility for other actions to expedite FDA review, such as a rolling submission and priority review.
To earn breakthrough designation, a treatment must show encouraging early clinical results demonstrating substantial improvement over available therapies with regard to a clinically significant endpoint, or it must fulfill an unmet need. ![]()
Surveys Are Not the Most Effective Way to Improve Patient Satisfaction

What started with a car dealership survey has become a near avalanche of surveys from my credit card, bank, airlines, hotels, and other businesses. Each starts by assuring me that it will take only a minute or two to complete the survey, but if I completed every survey sent my way, it would add up to a significant amount of time. So I’ve stopped responding to nearly all of them, not so much as a form of protest but as part of my overall time-management efforts.
I imagine many of our patients see surveys from hospitals and other healthcare providers similarly: just another one to add to the pile. Patients in their 80s and 90s—a significant portion of hospitalist patients—probably interact a lot less with companies that send satisfaction surveys and so might be more attentive to ones from healthcare organizations. But I suspect that a reasonable portion of older patients rely on a family member to complete them, and this person, often a son or daughter, probably does get a lot of similar surveys. Surely, survey fatigue is influencing the results at least a little.
Healthcare Surveys: HCAHPS
For all the surveying going on, I find it pretty difficult to use HCAHPS results to guide patient-satisfaction improvement efforts. Sure, I can see how individual doctors or different physician groups score compared to one another and try to model my behaviors after the high performers. That is a really valuable thing to do, but it doesn’t get to the granular level I’d like.
One would hope the three physician-specific HCAHPS questions would support drilling down to more actionable information. But every hospitalist group I’ve seen always has the same pattern, scoring from lowest to highest as follows:
- How often did doctors explain things in a way you could understand?
- How often did doctors listen carefully to you?
- How often did doctors treat you with courtesy and respect?
So I don’t think the difference in scores on these questions is very useful in guiding improvement efforts.
Looking beyond HCAHPS
For a few years, our hospitalist group added a very short survey to the brochure describing the practice. I still think that was good idea to ensure accurate attribution and more granular information, but it didn’t yield much value in practice because of a low response rate. Ultimately, we stopped using it because of our hospital risk manager’s concern any such survey could be construed as “coaching” patients in their HCAHPS responses, something the Centers for Medicare & Medicaid Services forbids.
Mark Rudolph, MD, vice president of physician development and patient experience at Sound Physicians, told me about their experience with their employed RNs using tablet computers to survey every patient the day following hospital admission (i.e., while patients were still in the hospital). It seems to me this could be a really valuable tool to provide very granular feedback at the outset of a patient stay when there is still time to address areas in which the patient is less satisfied. They found that for about 30% of patients, the survey uncovered something that could be fixed, such as providing another blanket, determining what time a test was likely to be done, etc. I bet for most patients the fact that a nurse cared enough to ask how things are going and try to remedy problems improved their HCAPHS scores.
Yet after some experience with this approach, Sound Physicians found that, for a number of reasons, this wasn’t as valuable as hoped. They now survey a smaller sample of patients and sometimes adjust the questions based on the known or suspected strengths and weaknesses of individual providers. For one doctor, for example, the survey might ask whether the doctor spent enough time with the patient; for another, it might ask if the doctor spoke clearly, etc.
Dr. Rudolph thinks having someone such as the lead hospitalist observe the doctor while on rounds might ultimately prove more valuable than administering a survey. It will be interesting to see how his group and others around the country evolve their approach to better understand each provider’s strengths and weaknesses and most effective ways to improve patient satisfaction.
How to Improve Patient Satisfaction?
In my April 2012 column, I wrote about several things for hospitalists to consider including in their patient-satisfaction improvement plan. And, of course, there are a lot of additional sources of ideas available just by searching the Internet.
I find it difficult to consistently implement a bundle of multiple different habits, such as always sitting or always rounding with the patient’s bedside nurse, etc. I acknowledge these are proven valuable strategies to improve scores, but I still find it hard to do them consistently.
For some of us, it might be better to pick one thing to focus on. And while I don’t have research data to prove it, I think the single most valuable thing to improve patient satisfaction with hospitalists is to phone patients after discharge. It isn’t as difficult as most assume, and it often leads patients (or the family member you reach) to thank you profusely for the call. I think hospitalists can really benefit from more expressions of gratitude from patients and families, and these calls often provide it.
I’ve learned a few lessons about making post-discharge calls that are detailed in my August 2012 column. TH

Bovine heparin may be comparable to porcine heparin
A new study suggests that heparin derived from cattle may be as effective as heparin derived from pigs, but more research is needed.
Investigators found differences in the structural and molecular characteristics of bovine and porcine heparins, but these differences did not appear to have a significant effect on the drugs’ anticoagulant properties in vitro.
Still, the researchers said it is not clear if these differences affect the drugs’ activity in humans.
Jawed Fareed, PhD, of Loyola University Chicago Stritch School of Medicine in Illinois, and his colleagues conducted this research and reported the results in Clinical and Applied Thrombosis/Hemostasis.
Heparin used in the US now comes from the intestines of pigs that are slaughtered for meat. Seventy-five percent of the heparin used in the US comes from China, which is the world’s largest pork producer.
As heparin is a widely used drug that, in certain cases, has no medical alternatives, the US healthcare system could be vulnerable to fluctuations in the crude heparin supply, according to the US Food and Drug Administration’s Center for Drug Evaluation and Research.
Therefore, the center is evaluating reintroducing bovine heparin to the market in order to avoid shortages, particularly in case the porcine heparin supply is contaminated, as occurred in 2008.
Bovine heparin was voluntarily withdrawn from the market during the 1980s due to worries that it could, in rare cases, cause thrombocytopenia or be contaminated with bovine spongiform encephalopathy (mad cow disease).
According to Dr Fareed, those fears have been put to rest by advancements in manufacturing and quality control that have resulted in purer forms of heparin. Still, some experts remain skeptical about bovine heparin.
With this in mind, Dr Fareed and his colleagues compared individually manufactured batches of bovine heparin (historical samples from a variety of manufacturers) with individually manufactured batches of porcine heparin (current samples from 2 different manufacturers).
The investigators studied heparins isolated from pig intestines (PI), bovine lungs (BL), and bovine intestines (BI).
They found the BL, BI, and PI heparins all produced a concentration-dependent anticoagulant effect. And there was no significant difference in the anti-Xa and anti-IIa potencies of the BL, BI, and PI heparins.
The researchers noted that there were significant structural differences between PI and BI heparins, and it isn’t clear whether these differences would have an impact in patients.
Likewise, although the BL heparin samples were “highly similar” to the PI heparin samples, the BL heparins had a lower molecular weight. And the investigators said it was unclear if this would adversely affect the BL heparins’ pharmacology.
Furthermore, the researchers noted that there was greater variability among the BL heparins than the PI heparins. However, they said this could be due to the multiple historic manufacturers of BL heparins.
The investigators concluded that more research is needed to examine these possibilities. ![]()
FDA says ROCKET AF trial results hold up

The US Food and Drug Administration (FDA) has concluded that results of the ROCKET AF trial were not significantly affected by accuracy issues with the Alere INRatio
Monitor System.
ROCKET AF was the trial used to support the 2011 approval of rivaroxaban (Xarelto) in patients with nonvalvular atrial fibrillation, and the Alere INRatio Monitor System was used to measure international normalized ratios (INRs) in the warfarin arm of the trial.
Critics have questioned the results of ROCKET AF because the INRatio system (INRatio Monitor or INRatio2 Monitor and INRatio Test Strips) has been shown to give falsely low test results.
If the system provided falsely low INR values for patients in the warfarin arm of ROCKET AF, investigators may have given those patients incorrect doses of warfarin. This could increase the risk of bleeding in those patients and give a false impression of the comparative safety of rivaroxaban.
In addition to increasing the risk of bleeding, over-anticoagulation in the warfarin arm might have reduced the rate of ischemic stroke for these patients. This might have distorted the study’s efficacy results in favor of warfarin.
Because the INRatio system was shown to be defective, it was recalled for certain patients in December 2014 and was withdrawn from the US market in July 2016.
Janssen Pharmaceuticals, Inc., the company developing rivaroxaban in cooperation with Bayer, informed the FDA of the issues with the INRatio system, and its possible impact on ROCKET AF, in September 2015.
In response, the FDA conducted a variety of analyses to assess the impact the INRatio system had on the results of ROCKET AF. Janssen also performed its own analyses.
The FDA said the results of these analyses, which are available on the FDA website, suggest the INRatio system had minimal effects on strokes and bleeding in ROCKET AF.
The FDA therefore concluded that rivaroxaban is a safe and effective alternative to warfarin for patients with nonvalvular atrial fibrillation, no changes in rivaroxaban labeling are warranted, and no other major regulatory action should be taken with respect to rivaroxaban.
This corresponds to the opinion of the European Medicine’s Agency, which released a statement earlier this year saying the defect with the INRatio system does not change the overall conclusions of ROCKET AF.
Still, the issues with rivaroxaban are not fully resolved, as a recent investigation published in The BMJ suggested that Janssen and Bayer knew about concerns regarding the accuracy of the INRatio system while ROCKET AF was underway but allowed the system to be used in the trial anyway.
The BMJ said the companies also neglected to mention these concerns to regulatory authorities prior to rivaroxaban’s approval and later failed to notify regulators about the recall of the INRatio system, and its potential impact on ROCKET AF, in a timely manner.
In addition, Janssen, which was responsible for conducting ROCKET AF, did not tell regulators about a safety program the company launched during the trial to address concerns about the INRatio system. ![]()
Plasmapheresis system cleared by FDA
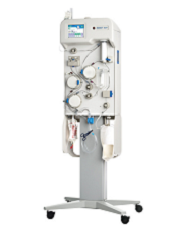
Photo from Business Wire
The US Food and Drug Administration (FDA) has granted 510(k) clearance for the Aurora™ Xi Plasmapheresis System.
The system collects plasma from donated blood and returns the remaining blood components to the donor.
The Aurora Xi Plasmapheresis System features a proprietary filtration-separation method that enables faster collection of source plasma, according to Fresenius Kabi, the company marketing the system.
“The system helps to improve plasma center efficiency and the overall experience for operators and donors,” said Dean Gregory, president, medical devices, Fresenius Kabi USA.
“Faster collection times mean more throughput for our customers, helping maximize the volumes of plasma they collect while assuring a good experience for plasma donors.”
Plasma collected via the Aurora Xi Plasmapheresis System can be used to treat bleeding disorders, burn victims, human immune deficiencies, and other chronic or genetic disorders.
The plasma can also be used to manufacture therapies such as albumin and intravenous immunoglobulin. ![]()
Risk Factors for Early Readmission After Anatomical or Reverse Total Shoulder Arthroplasty
Hospital readmissions are undesirable and expensive.1 The Centers for Medicare & Medicaid Services (CMS) use hospital readmission rates as one measure of healthcare quality and hospital performance.2 In addition, the Patient Protection and Affordable Care Act of 2010 established a provision that decreases payments to hospitals with above-average readmission rates.3 Total knee arthroplasties (TKAs) and total hip arthroplasties (THAs) are among the most common surgical procedures leading to readmission and cost almost $20 billion dollars annually in the Medicare population alone.1 Identifying factors that lead to readmissions after certain popular procedures may be a way to improve healthcare quality and outcomes while decreasing costs.
One such operation is shoulder arthroplasty (SA), which has surged in popularity over the past decade and is projected to increase faster than TKAs and THAs.4-6 SA is used to treat a variety of shoulder conditions, including osteoarthritis, inflammatory arthritis, severe proximal humeral fracture, avascular necrosis, and rotator cuff tear arthropathy.7-12 Much as with knee and hip arthroplasty, good outcomes have been reported with SA: decreased pain, improved range of motion, and high patient satisfaction.10,13 However, there have been few studies of rates of readmission after SA and the associated risk factors.3,14,15 The reported rates of early readmission after SA have ranged from 5.6% to 7.3%.3,14,15 These rates are comparable to rates of readmission after TKA (4.0%-6.6%) and THA (3.5%-8.4%).15-17Recently, CMS introduced legislation to void payments for hospital-acquired conditions (HACs), preventable medical conditions that patients develop during or as a result of their hospital care and that were not present on admission.18 Although many factors contribute to readmission, a recent study regarding all-cause readmission during the first 30 days after discharge found that almost 50% of 30-day readmissions after knee and hip replacements were potentially preventable.19 HACs resulting in readmission after SAs make up 9.3% to 34.5% of all readmissions, after anatomical total shoulder arthroplasties (ATSAs) and reverse total shoulder arthroplasties (RTSAs).3,14 The most common HACs include retained foreign body after surgery, air embolism, falls and trauma, catheter-associated urinary tract infection (CAUTI), surgical-site infection, deep vein thrombosis (DVT), and pulmonary embolism (PE).18 Raines and colleagues16 found that HACs accounted for 41.7% of all complications in knee or hip arthroplasty and that HACs were the greatest predictors of early readmission after both procedures.
We conducted a study to evaluate rates of readmission within 30 days after ATSA and RTSA and to describe the independent risk factors for readmission. We hypothesized that the rate of readmission after SA would be similar to the rate after knee and hip arthroplasty and that readmission risk factors would be similar. Elucidating these rates and associated risk factors may ultimately help to minimize the burden of disability on patients and the burden of financial costs on healthcare institutions.
Materials and Methods
Institutional Review Board approval was not required for this study, and all data used were de-identified to Health Insurance Portability and Accountability Act (HIPAA) standards. We used the American College of Surgeons (ACS) National Surgical Quality Improvement Program (NSQIP) database for this study. The NSQIP was developed in the 1990s to improve surgical quality in the Veterans Health Administration and was later adapted by the ACS.20 NSQIP follows patients for 30 days after operations and provides clinical data and outcome measures that are closely regulated and internally audited.21 The program has continued to expand and now includes more than 400 institutions. The NSQIP database has been validated as a reliable source of surgical outcomes data, including outcomes data for orthopedic procedures, and has been used in other studies of readmissions.17,22
In the present study, the ACS-NSQIP files for the period 2011-2013 were queried for all total shoulder arthroplasties (TSAs) (Current Procedural Terminology [CPT] code 23472, which includes ATSA and RTSA). Descriptive analysis was performed to determine the overall readmission rate as well as the percentages of readmissions for medical and surgical complications. Reasons for readmission were collected from 2012 and 2013 (information from 2011 was absent).
The various patient parameters compiled within the database were examined in a review of ATSAs and RTSAs. Demographics, comorbidities, operative characteristics, and predischarge complications were amassed from these data. Demographics included age, sex, race, body mass index, smoking status, preoperative functional health status, and American Society of Anesthesiologists (ASA) score. Comorbidities included diabetes mellitus, hypertension, chronic corticosteroid use, coagulation disorder, peripheral vascular disease, chronic obstructive pulmonary disease (COPD), cardiac comorbidity (including congestive heart failure, history of myocardial infarction, previous coronary intervention or cardiac surgery, and angina), renal comorbidity (including acute renal failure and preoperative dialysis), neurologic comorbidity (including impaired sensorium, hemiplegia, history of transient ischemic attack, and history of cerebrovascular accident with or without residual deficit), and preoperative blood transfusion. Operative characteristics included resident involvement, operative time more than 1 SD from the mean (>164.4 minutes), intraoperative blood transfusion, and revision surgery. Predischarge complications included pneumonia, CAUTI, DVT, PE, postoperative bleeding that required transfusion, cerebrovascular accident, myocardial infarction, and sepsis. Surgical-site infection, CAUTI, DVT, and PE were selected for analysis because these HACs are common in our cohort.
After the data on these characteristics were collected, univariate analysis was performed to determine association with any readmission. Factors with P < .20 were then entered into multivariate analysis to determine independent risk factors for readmission. This P value was selected to make the model inclusive of any potentially important predictor. Univariate analysis was performed using the Fisher exact test. Multivariate analysis was performed using backward conditional binary logistic regression. Statistical significance was set at P < .05. All analysis was performed with SPSS Version 22.0 (SPSS).
Results
This study included a combined total of 3501 ATSAs and RTSAs performed between 2011 and 2013. The overall readmission rate was 2.7%. The associated diagnosis for readmission was available for 54% of the readmitted patients. Of the known readmission diagnoses, 33% were secondary to HACs. 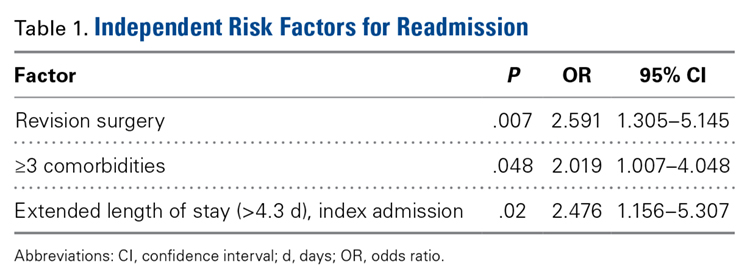
Of the 51 readmissions, 34 (67%) were for medical complications, and 17 (33%) were for surgical complications. Pneumonia was the most common medical complication (11.8%), followed by UTI (7.8%), DVT (5.9%), PE (5.9%), and renal insufficiency (3.9%). Surgical-site infection was the most common surgical complication (13.7%), followed by prosthetic joint dislocation (9.8%) and hematoma (3.9%). 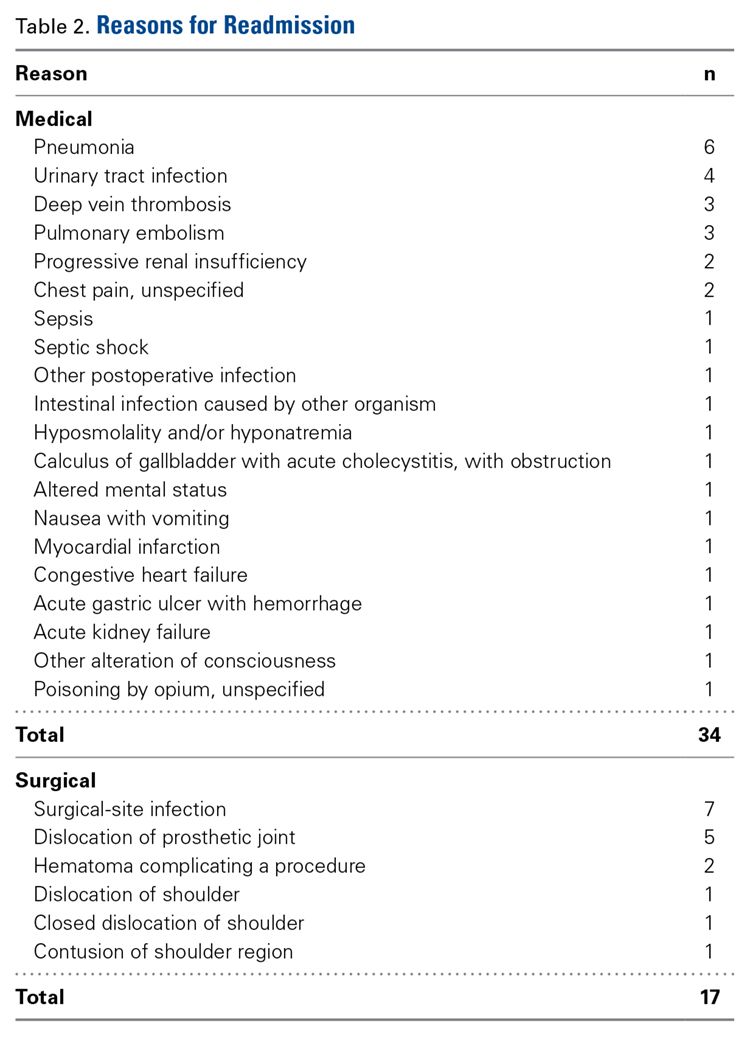
Other risk factors significantly (P < .05) associated with readmission were age over 75 years, dependent functional status, ASA score of 4 or higher, cardiac comorbidity, 2 or more comorbidities, postoperative CAUTI, extended LOS, and revision surgery (Table 3). 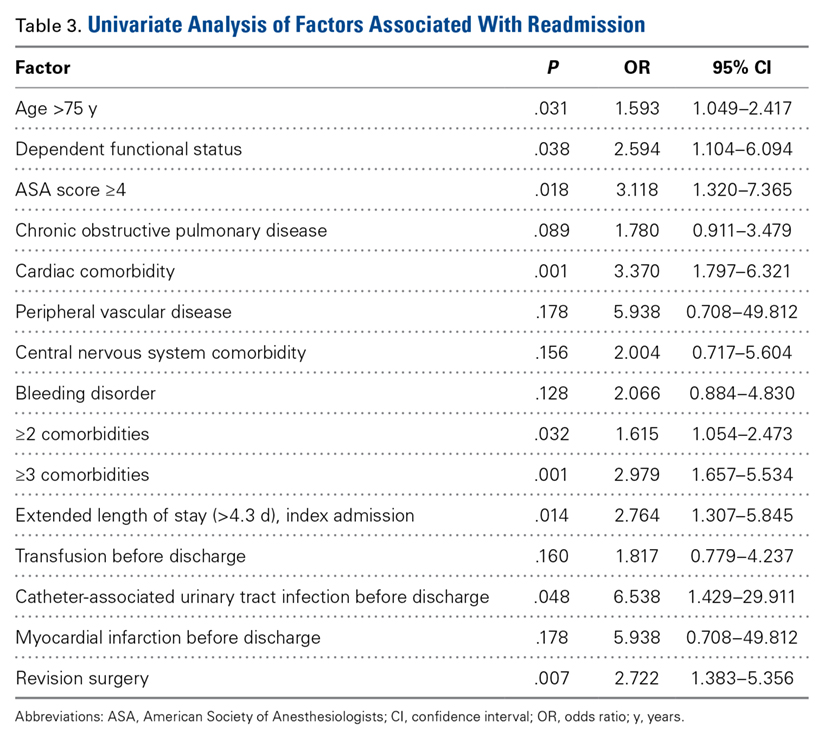
Discussion
Hospital readmissions are important because they represent quality of care and play a role in patient outcomes. Arthroplasty research has focused mainly on readmissions after primary knee and hip replacements.23-25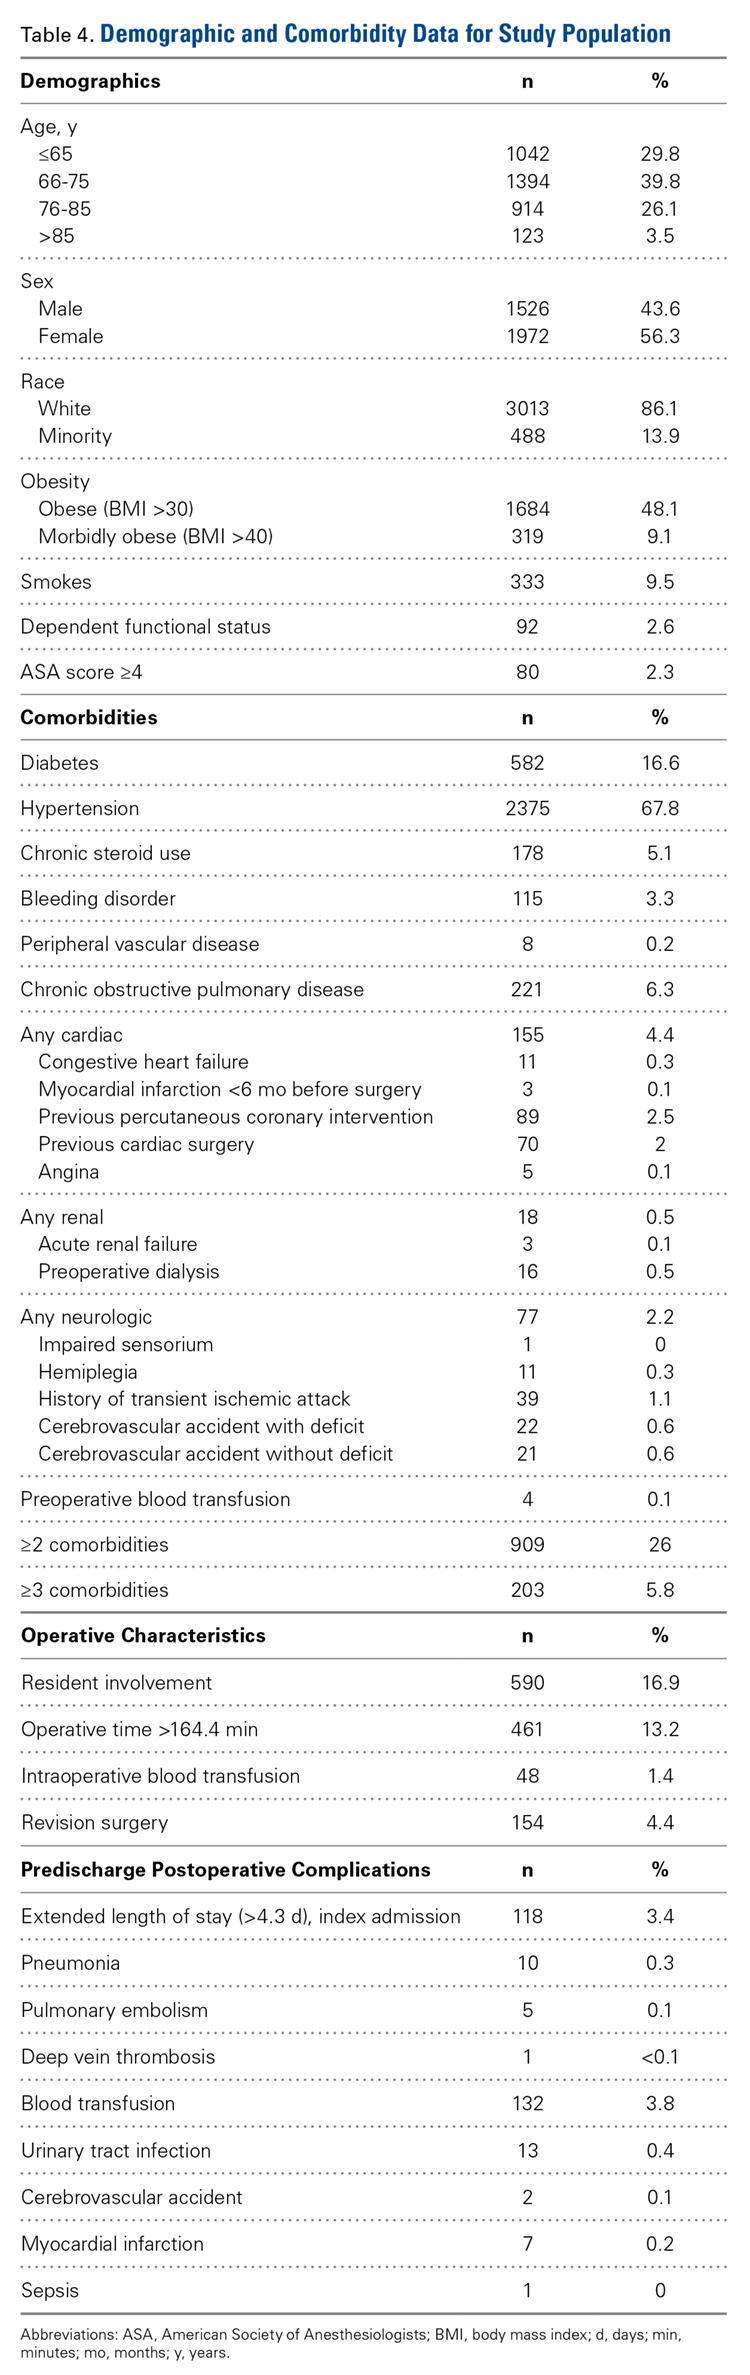
Historical rates of early readmission after SA14 are comparable to those found in our study. Previously identified risk factors have included increasing age, Medicaid insurance status, low-volume surgical centers, and SA type.3 Mahoney and colleagues14 reported a 90-day readmission rate of 5.9%, but, when they removed hemiarthroplasty replacement from the analysis and shortened the readmission timeline to 30 days, the readmission rate was identical to the 2.7% rate in the present study. In their series from a single high-volume institution, the highest 90-day readmission rate was found for hemiarthroplasty (8.8%), followed by RTSA (6.6%) and ATSA (4.5%). In a study by Schairer and colleagues,3 the readmission rate was also influenced by replacement type, but their results differed from those of Mahoney and colleagues.14 Schairer and colleagues3 analyzed data from 7 state inpatient databases and found that the highest readmission rate was associated with RTSA (11.2%), followed by hemiarthroplasty (8.2%) and ATSA (6.0%). In both series, RTSA readmission rates were higher than ATSA readmission rates—consistent with the complication profiles of these procedures, with RTSA often provided as a surgery of last resort, after failure of other procedures, including ATSA.26 The lower 30-day readmission rate in the present study may be attributable to the fact that some surgical and medical complications may not have developed within this short time. Nonetheless, the majority of readmissions typically present within the first 30 days after SA.14,15 Other factors, including hospital volume, surgeon volume, race, and hospital type, may also influence readmission rates but could not be compared between
The present study found that revision surgery, 3 or more comorbidities, and extended LOS (>4.3 days) more than doubled the risk of readmission. Published SA revision rates range from 5% to 42%, with most revisions performed for instability, dislocation, infection, and component loosening.6,29 Complication rates are higher for revision SA than for primary SA, which may explain why revisions predispose patients to readmission.30 Compared with primary SAs, revision SAs are also more likely to be RTSAs, and these salvage procedures have been found to have high complication rates.31 In the present study, the most common comorbidities were hypertension, diabetes, and COPD; the literature supports these as some of the most common comorbid medical conditions in patients who undergo ATSA or RTSA.5,26,32 Furthermore, all 3 of these comorbidities have been shown to be independent predictors of increased postoperative complications in patients who undergo SA, which ultimately would increase the risk of readmission.3,26,33,34 Last, extended LOS has also been shown to increase the risk of unplanned readmissions after orthopedic procedures.35 Risk factors associated with increased LOS after ATSA or RTSA include female sex, advanced age, multiple comorbidities, and postoperative complications.32Several other factors must be noted with respect to individual risk for readmission. In the present study, age over 75 years, dependent functional status, ASA score of 4 or higher, and cardiac comorbidity were found to have a significant association with readmission. Increased age is a risk factor for increased postoperative complications, more medical comorbidities, and increased LOS.34,36 Older people are at higher risk of developing osteoarthritis and rotator cuff tear arthropathy and are more likely to undergo SA.5,6 Older people also are more likely to be dependent, which itself is a risk factor for readmission.19 An ASA score of 3 or 4 has been found to be associated with increased LOS and complications after SA, and cardiac comorbidities predispose patients to a variety of complications.34,36,37In studies that have combined surgical and medical factors, rates of complications early after ATSA and RTSA have ranged from 3.6% to 17.8%.26,38,39 After SAs, medical complications (80%) are more common than surgical complications (20%).39 In the present cohort, many more readmissions were for medical complications (67%) than for surgical complications (33%). In addition, Schairer and colleagues3 found medical complications associated with more than 80% of readmissions after SA.3 Infection was the most common medical reason (pneumonia) and surgical reason (surgical-site infection) for readmission—consistent with findings of other studies.3,35,40 Infection has accounted for 9.4% to 41.4% of readmissions after ATSA and RTSA.3,14In joint arthroplasty, infection occurs more often in patients with coexisting medical comorbidities, leading to higher mortality and increased LOS.41 Prosthetic joint dislocation was common as well—similar to findings in other studies.3,10In the present study, 33% of known readmission diagnoses were secondary to HACs. Surgical-site infection was the most common, followed by CAUTI, DVT, and PE. In another study, of knee and hip arthroplasties, HACs accounted for more than 40% of all complications and were the strongest predictor of early readmission.16 In SA studies, HACs were responsible for 9.3% to 34.5% of readmissions after ATSA and RTSA.3,14 Our finding (33%) is more in line with Mahoney and colleagues14 (34.5%) than Schairer and colleagues3 (9.3%). One explanation for the large discrepancy with Schairer and colleagues3 is that UTI was not among the medical reasons for readmission in their study, but it was in ours. Another difference is that we used a database that included data from multiple institutions. Last, Schairer and colleagues3 excluded revision SAs from their analysis (complication rates are higher for revision SAs than for primary SAs30). They also excluded cases of SA used for fracture (shown to increase the risk for PE42). The US Department of Health and Human Services estimated that patients experienced 1.3 million fewer HACs during the period 2010-2013, corresponding to a 17% decline over the 3 years.43 This translates to an estimated 50,000 fewer mortalities, and $12 billion saved in healthcare costs, over the same period.43 Preventing HACs helps reduce readmission rates while improving patient outcomes and decreasing healthcare costs.
This study had several limitations. We could not differentiate between ATSA and RTSA readmission rates because, for the study period, these procedures are collectively organized under a common CPT code in the NSQIP database. Readmission and complication rates are higher for RTSAs than for ATSAs.3,14 In addition, our data were limited to hospitals that were participating in NSQIP, which could lead to selection bias. We studied rates of only those readmissions and complications that occurred within 30 days, but many complications develop after 30 days, and these increase the readmission rate. Last, reasons for readmission were not recorded for 2011, so this information was available only for the final 2 years of the study. Despite these limitations, NSQIP still allows for a powerful study, as it includes multiple institutions and a very large cohort.
Conclusion
With medical costs increasing, focus has shifted to quality care and good outcomes with the goal of reducing readmissions and complications after various procedures. SA has recently become more popular because of its multiple indications, and this trend will continue. In the present study, the rate of readmission within 30 days after ATSA or RTSA was 2.7%. Revision surgery, 3 or more comorbidities, and extended LOS were independent risk factors that more than doubled the risk of readmission. Understanding the risk factors for short-term readmission will allow for better patient care and decreased costs, and will benefit the healthcare system as a whole.
Am J Orthop. 2016;45(6):E386-E392. Copyright Frontline Medical Communications Inc. 2016. All rights reserved.
1. Jencks SF, Williams MV, Coleman EA. Rehospitalizations among patients in the Medicare fee-for-service program. N Engl J Med. 2009;360(14):1418-1428.
2. Axon RN, Williams MV. Hospital readmission as an accountability measure. JAMA. 2011;305(5):504-505.
3. Schairer WW, Zhang AL, Feeley BT. Hospital readmissions after primary shoulder arthroplasty. J Shoulder Elbow Surg. 2014;23(9):1349-1355.
4. Day JS, Lau E, Ong KL, Williams GR, Ramsey ML, Kurtz SM. Prevalence and projections of total shoulder and elbow arthroplasty in the United States to 2015. J Shoulder Elbow Surg. 2010;19(8):1115-1120.
5. Kim SH, Wise BL, Zhang Y, Szabo RM. Increasing incidence of shoulder arthroplasty in the United States. J Bone Joint Surg Am. 2011;93(24):2249-2254.
6. Jain NB, Yamaguchi K. The contribution of reverse shoulder arthroplasty to utilization of primary shoulder arthroplasty. J Shoulder Elbow Surg. 2014;23(12):1905-1912.
7. Bartelt R, Sperling JW, Schleck CD, Cofield RH. Shoulder arthroplasty in patients aged fifty-five years or younger with osteoarthritis. J Shoulder Elbow Surg. 2011;20(1):123-130.
8. Chalmers PN, Slikker W 3rd, Mall NA, et al. Reverse total shoulder arthroplasty for acute proximal humeral fracture: comparison to open reduction–internal fixation and hemiarthroplasty. J Shoulder Elbow Surg. 2014;23(2):197-204.
9. Norris TR, Iannotti JP. Functional outcome after shoulder arthroplasty for primary osteoarthritis: a multicenter study. J Shoulder Elbow Surg. 2002;11(2):130-135.
10. Wall B, Nové-Josserand L, O’Connor DP, Edwards TB, Walch G. Reverse total shoulder arthroplasty: a review of results according to etiology. J Bone Joint Surg Am. 2007;89(7):1476-1485.
11. Fevang BT, Lygre SH, Bertelsen G, Skredderstuen A, Havelin LI, Furnes O. Good function after shoulder arthroplasty. Acta Orthop. 2012;83(5):467-473.
12. Orfaly RM, Rockwood CA Jr, Esenyel CZ, Wirth MA. Shoulder arthroplasty in cases with avascular necrosis of the humeral head. J Shoulder Elbow Surg. 2007;16(3 suppl):S27-S32.
13. Sperling JW, Cofield RH, Rowland CM. Minimum fifteen-year follow-up of Neer hemiarthroplasty and total shoulder arthroplasty in patients aged fifty years or younger. J Shoulder Elbow Surg. 2004;13(6):604-613.
14. Mahoney A, Bosco JA 3rd, Zuckerman JD. Readmission after shoulder arthroplasty. J Shoulder Elbow Surg. 2014;23(3):377-381.
15. Fehringer EV, Mikuls TR, Michaud KD, Henderson WG, O’Dell JR. Shoulder arthroplasties have fewer complications than hip or knee arthroplasties in US veterans. Clin Orthop Relat Res. 2010;468(3):717-722.
16. Raines BT, Ponce BA, Reed RD, Richman JS, Hawn MT. Hospital acquired conditions are the strongest predictor for early readmission: an analysis of 26,710 arthroplasties. J Arthroplasty. 2015;30(8):1299-1307.
17. Pugely AJ, Callaghan JJ, Martin CT, Cram P, Gao Y. Incidence of and risk factors for 30-day readmission following elective primary total joint arthroplasty: analysis from the ACS-NSQIP. J Arthroplasty. 2013;28(9):1499-1504.
18. Centers for Medicare & Medicaid Services. Hospital-Acquired Conditions. http://www.cms.gov/Medicare/Medicare-Fee-for-Service-Payment/HospitalAcqCond/Hospital-Acquired_Conditions.html. Published 2014. Accessed May 21, 2015.
19. Feigenbaum P, Neuwirth E, Trowbridge L, et al. Factors contributing to all-cause 30-day readmissions: a structured case series across 18 hospitals. Med Care. 2012;50(7):599-605.
20. Hall BL, Hamilton BH, Richards K, Bilimoria KY, Cohen ME, Ko CY. Does surgical quality improve in the American College of Surgeons National Surgical Quality Improvement Program: an evaluation of all participating hospitals. Ann Surg. 2009;250(3):363-376.
21. American College of Surgeons. About ACS NSQIP. http://www.facs.org/quality-programs/acs-nsqip/about. Published 2015. Accessed June 14, 2015.
22. Shiloach M, Frencher SK Jr, Steeger JE, et al. Toward robust information: data quality and inter-rater reliability in the American College of Surgeons National Surgical Quality Improvement Program. J Am Coll Surg. 2010;210(1):6-16.
23. Bini SA, Fithian DC, Paxton LW, Khatod MX, Inacio MC, Namba RS. Does discharge disposition after primary total joint arthroplasty affect readmission rates? J Arthroplasty. 2010;25(1):114-117.
24. Husted H, Otte KS, Kristensen BB, Orsnes T, Kehlet H. Readmissions after fast-track hip and knee arthroplasty. Arch Orthop Trauma Surg. 2010;130(9):1185-1191.
25. Vorhies JS, Wang Y, Herndon J, Maloney WJ, Huddleston JI. Readmission and length of stay after total hip arthroplasty in a national Medicare sample. J Arthroplasty. 2011;26(6 suppl):119-123.
26. Ponce BA, Oladeji LO, Rogers ME, Menendez ME. Comparative analysis of anatomic and reverse total shoulder arthroplasty: in-hospital outcomes and costs. J Shoulder Elbow Surg. 2015;24(3):460-467.
27. Bozic KJ, Maselli J, Pekow PS, Lindenauer PK, Vail TP, Auerbach AD. The influence of procedure volumes and standardization of care on quality and efficiency in total joint replacement surgery. J Bone Joint Surg Am. 2010;92(16):2643-2652.
28. Tsai TC, Orav EJ, Joynt KE. Disparities in surgical 30-day readmission rates for Medicare beneficiaries by race and site of care. Ann Surg. 2014;259(6):1086-1090.
29. Bohsali KI, Wirth MA, Rockwood CA Jr. Complications of total shoulder arthroplasty. J Bone Joint Surg Am. 2006;88(10):2279-2292.
30. Saltzman BM, Chalmers PN, Gupta AK, Romeo AA, Nicholson GP. Complication rates comparing primary with revision reverse total shoulder arthroplasty. J Shoulder Elbow Surg. 2014;23(11):1647-1654.
31. Black EM, Roberts SM, Siegel E, Yannopoulos P, Higgins LD, Warner JJ. Reverse shoulder arthroplasty as salvage for failed prior arthroplasty in patients 65 years of age or younger. J Shoulder Elbow Surg. 2014;23(7):1036-1042.
32. Menendez ME, Baker DK, Fryberger CT, Ponce BA. Predictors of extended length of stay after elective shoulder arthroplasty. J Shoulder Elbow Surg. 2015;24(10):1527-1533.
33. Jain NB, Guller U, Pietrobon R, Bond TK, Higgins LD. Comorbidities increase complication rates in patients having arthroplasty. Clin Orthop Relat Res. 2005;(435):232-238.
34. Martin CT, Gao Y, Pugely AJ, Wolf BR. 30-day morbidity and mortality after elective shoulder arthroscopy: a review of 9410 cases. J Shoulder Elbow Surg. 2013;22(12):1667-1675.e1.
35. Dailey EA, Cizik A, Kasten J, Chapman JR, Lee MJ. Risk factors for readmission of orthopaedic surgical patients. J Bone Joint Surg Am. 2013;95(11):1012-1019.
36. Dunn JC, Lanzi J, Kusnezov N, Bader J, Waterman BR, Belmont PJ Jr. Predictors of length of stay after elective total shoulder arthroplasty in the United States. J Shoulder Elbow Surg. 2015;24(5):754-759.
37. Maile MD, Engoren MC, Tremper KK, Jewell E, Kheterpal S. Worsening preoperative heart failure is associated with mortality and noncardiac complications, but not myocardial infarction after noncardiac surgery: a retrospective cohort study. Anesth Analg. 2014;119(3):522-532.
38. Farng E, Zingmond D, Krenek L, Soohoo NF. Factors predicting complication rates after primary shoulder arthroplasty. J Shoulder Elbow Surg. 2011;20(4):557-563.
39. Waterman BR, Dunn JC, Bader J, Urrea L, Schoenfeld AJ, Belmont PJ Jr. Thirty-day morbidity and mortality after elective total shoulder arthroplasty: patient-based and surgical risk factors. J Shoulder Elbow Surg. 2015;24(1):24-30.
40. Kassin MT, Owen RM, Perez SD, et al. Risk factors for 30-day hospital readmission among general surgery patients. J Am Coll Surg. 2012;215(3):322-330.
41. Poultsides LA, Ma Y, Della Valle AG, Chiu YL, Sculco TP, Memtsoudis SG. In-hospital surgical site infections after primary hip and knee arthroplasty—incidence and risk factors. J Arthroplasty. 2013;28(3):385-389.
42. Young BL, Menendez ME, Baker DK, Ponce BA. Factors associated with in-hospital pulmonary embolism after shoulder arthroplasty. J Shoulder Elbow Surg. 2015;24(10):e271-e278.
43. US Department of Health and Human Services. Efforts to improve patient safety result in 1.3 million fewer patient harms, 50,000 lives saved and $12 billion in health spending avoided [press release]. http://www.hhs.gov/news/press/2014pres/12/20141202a.html. Published December 2, 2014. Accessed May 25, 2015.
Hospital readmissions are undesirable and expensive.1 The Centers for Medicare & Medicaid Services (CMS) use hospital readmission rates as one measure of healthcare quality and hospital performance.2 In addition, the Patient Protection and Affordable Care Act of 2010 established a provision that decreases payments to hospitals with above-average readmission rates.3 Total knee arthroplasties (TKAs) and total hip arthroplasties (THAs) are among the most common surgical procedures leading to readmission and cost almost $20 billion dollars annually in the Medicare population alone.1 Identifying factors that lead to readmissions after certain popular procedures may be a way to improve healthcare quality and outcomes while decreasing costs.
One such operation is shoulder arthroplasty (SA), which has surged in popularity over the past decade and is projected to increase faster than TKAs and THAs.4-6 SA is used to treat a variety of shoulder conditions, including osteoarthritis, inflammatory arthritis, severe proximal humeral fracture, avascular necrosis, and rotator cuff tear arthropathy.7-12 Much as with knee and hip arthroplasty, good outcomes have been reported with SA: decreased pain, improved range of motion, and high patient satisfaction.10,13 However, there have been few studies of rates of readmission after SA and the associated risk factors.3,14,15 The reported rates of early readmission after SA have ranged from 5.6% to 7.3%.3,14,15 These rates are comparable to rates of readmission after TKA (4.0%-6.6%) and THA (3.5%-8.4%).15-17Recently, CMS introduced legislation to void payments for hospital-acquired conditions (HACs), preventable medical conditions that patients develop during or as a result of their hospital care and that were not present on admission.18 Although many factors contribute to readmission, a recent study regarding all-cause readmission during the first 30 days after discharge found that almost 50% of 30-day readmissions after knee and hip replacements were potentially preventable.19 HACs resulting in readmission after SAs make up 9.3% to 34.5% of all readmissions, after anatomical total shoulder arthroplasties (ATSAs) and reverse total shoulder arthroplasties (RTSAs).3,14 The most common HACs include retained foreign body after surgery, air embolism, falls and trauma, catheter-associated urinary tract infection (CAUTI), surgical-site infection, deep vein thrombosis (DVT), and pulmonary embolism (PE).18 Raines and colleagues16 found that HACs accounted for 41.7% of all complications in knee or hip arthroplasty and that HACs were the greatest predictors of early readmission after both procedures.
We conducted a study to evaluate rates of readmission within 30 days after ATSA and RTSA and to describe the independent risk factors for readmission. We hypothesized that the rate of readmission after SA would be similar to the rate after knee and hip arthroplasty and that readmission risk factors would be similar. Elucidating these rates and associated risk factors may ultimately help to minimize the burden of disability on patients and the burden of financial costs on healthcare institutions.
Materials and Methods
Institutional Review Board approval was not required for this study, and all data used were de-identified to Health Insurance Portability and Accountability Act (HIPAA) standards. We used the American College of Surgeons (ACS) National Surgical Quality Improvement Program (NSQIP) database for this study. The NSQIP was developed in the 1990s to improve surgical quality in the Veterans Health Administration and was later adapted by the ACS.20 NSQIP follows patients for 30 days after operations and provides clinical data and outcome measures that are closely regulated and internally audited.21 The program has continued to expand and now includes more than 400 institutions. The NSQIP database has been validated as a reliable source of surgical outcomes data, including outcomes data for orthopedic procedures, and has been used in other studies of readmissions.17,22
In the present study, the ACS-NSQIP files for the period 2011-2013 were queried for all total shoulder arthroplasties (TSAs) (Current Procedural Terminology [CPT] code 23472, which includes ATSA and RTSA). Descriptive analysis was performed to determine the overall readmission rate as well as the percentages of readmissions for medical and surgical complications. Reasons for readmission were collected from 2012 and 2013 (information from 2011 was absent).
The various patient parameters compiled within the database were examined in a review of ATSAs and RTSAs. Demographics, comorbidities, operative characteristics, and predischarge complications were amassed from these data. Demographics included age, sex, race, body mass index, smoking status, preoperative functional health status, and American Society of Anesthesiologists (ASA) score. Comorbidities included diabetes mellitus, hypertension, chronic corticosteroid use, coagulation disorder, peripheral vascular disease, chronic obstructive pulmonary disease (COPD), cardiac comorbidity (including congestive heart failure, history of myocardial infarction, previous coronary intervention or cardiac surgery, and angina), renal comorbidity (including acute renal failure and preoperative dialysis), neurologic comorbidity (including impaired sensorium, hemiplegia, history of transient ischemic attack, and history of cerebrovascular accident with or without residual deficit), and preoperative blood transfusion. Operative characteristics included resident involvement, operative time more than 1 SD from the mean (>164.4 minutes), intraoperative blood transfusion, and revision surgery. Predischarge complications included pneumonia, CAUTI, DVT, PE, postoperative bleeding that required transfusion, cerebrovascular accident, myocardial infarction, and sepsis. Surgical-site infection, CAUTI, DVT, and PE were selected for analysis because these HACs are common in our cohort.
After the data on these characteristics were collected, univariate analysis was performed to determine association with any readmission. Factors with P < .20 were then entered into multivariate analysis to determine independent risk factors for readmission. This P value was selected to make the model inclusive of any potentially important predictor. Univariate analysis was performed using the Fisher exact test. Multivariate analysis was performed using backward conditional binary logistic regression. Statistical significance was set at P < .05. All analysis was performed with SPSS Version 22.0 (SPSS).
Results
This study included a combined total of 3501 ATSAs and RTSAs performed between 2011 and 2013. The overall readmission rate was 2.7%. The associated diagnosis for readmission was available for 54% of the readmitted patients. Of the known readmission diagnoses, 33% were secondary to HACs.
Of the 51 readmissions, 34 (67%) were for medical complications, and 17 (33%) were for surgical complications. Pneumonia was the most common medical complication (11.8%), followed by UTI (7.8%), DVT (5.9%), PE (5.9%), and renal insufficiency (3.9%). Surgical-site infection was the most common surgical complication (13.7%), followed by prosthetic joint dislocation (9.8%) and hematoma (3.9%).
Other risk factors significantly (P < .05) associated with readmission were age over 75 years, dependent functional status, ASA score of 4 or higher, cardiac comorbidity, 2 or more comorbidities, postoperative CAUTI, extended LOS, and revision surgery (Table 3).
Discussion
Hospital readmissions are important because they represent quality of care and play a role in patient outcomes. Arthroplasty research has focused mainly on readmissions after primary knee and hip replacements.23-25
Historical rates of early readmission after SA14 are comparable to those found in our study. Previously identified risk factors have included increasing age, Medicaid insurance status, low-volume surgical centers, and SA type.3 Mahoney and colleagues14 reported a 90-day readmission rate of 5.9%, but, when they removed hemiarthroplasty replacement from the analysis and shortened the readmission timeline to 30 days, the readmission rate was identical to the 2.7% rate in the present study. In their series from a single high-volume institution, the highest 90-day readmission rate was found for hemiarthroplasty (8.8%), followed by RTSA (6.6%) and ATSA (4.5%). In a study by Schairer and colleagues,3 the readmission rate was also influenced by replacement type, but their results differed from those of Mahoney and colleagues.14 Schairer and colleagues3 analyzed data from 7 state inpatient databases and found that the highest readmission rate was associated with RTSA (11.2%), followed by hemiarthroplasty (8.2%) and ATSA (6.0%). In both series, RTSA readmission rates were higher than ATSA readmission rates—consistent with the complication profiles of these procedures, with RTSA often provided as a surgery of last resort, after failure of other procedures, including ATSA.26 The lower 30-day readmission rate in the present study may be attributable to the fact that some surgical and medical complications may not have developed within this short time. Nonetheless, the majority of readmissions typically present within the first 30 days after SA.14,15 Other factors, including hospital volume, surgeon volume, race, and hospital type, may also influence readmission rates but could not be compared between
The present study found that revision surgery, 3 or more comorbidities, and extended LOS (>4.3 days) more than doubled the risk of readmission. Published SA revision rates range from 5% to 42%, with most revisions performed for instability, dislocation, infection, and component loosening.6,29 Complication rates are higher for revision SA than for primary SA, which may explain why revisions predispose patients to readmission.30 Compared with primary SAs, revision SAs are also more likely to be RTSAs, and these salvage procedures have been found to have high complication rates.31 In the present study, the most common comorbidities were hypertension, diabetes, and COPD; the literature supports these as some of the most common comorbid medical conditions in patients who undergo ATSA or RTSA.5,26,32 Furthermore, all 3 of these comorbidities have been shown to be independent predictors of increased postoperative complications in patients who undergo SA, which ultimately would increase the risk of readmission.3,26,33,34 Last, extended LOS has also been shown to increase the risk of unplanned readmissions after orthopedic procedures.35 Risk factors associated with increased LOS after ATSA or RTSA include female sex, advanced age, multiple comorbidities, and postoperative complications.32Several other factors must be noted with respect to individual risk for readmission. In the present study, age over 75 years, dependent functional status, ASA score of 4 or higher, and cardiac comorbidity were found to have a significant association with readmission. Increased age is a risk factor for increased postoperative complications, more medical comorbidities, and increased LOS.34,36 Older people are at higher risk of developing osteoarthritis and rotator cuff tear arthropathy and are more likely to undergo SA.5,6 Older people also are more likely to be dependent, which itself is a risk factor for readmission.19 An ASA score of 3 or 4 has been found to be associated with increased LOS and complications after SA, and cardiac comorbidities predispose patients to a variety of complications.34,36,37In studies that have combined surgical and medical factors, rates of complications early after ATSA and RTSA have ranged from 3.6% to 17.8%.26,38,39 After SAs, medical complications (80%) are more common than surgical complications (20%).39 In the present cohort, many more readmissions were for medical complications (67%) than for surgical complications (33%). In addition, Schairer and colleagues3 found medical complications associated with more than 80% of readmissions after SA.3 Infection was the most common medical reason (pneumonia) and surgical reason (surgical-site infection) for readmission—consistent with findings of other studies.3,35,40 Infection has accounted for 9.4% to 41.4% of readmissions after ATSA and RTSA.3,14In joint arthroplasty, infection occurs more often in patients with coexisting medical comorbidities, leading to higher mortality and increased LOS.41 Prosthetic joint dislocation was common as well—similar to findings in other studies.3,10In the present study, 33% of known readmission diagnoses were secondary to HACs. Surgical-site infection was the most common, followed by CAUTI, DVT, and PE. In another study, of knee and hip arthroplasties, HACs accounted for more than 40% of all complications and were the strongest predictor of early readmission.16 In SA studies, HACs were responsible for 9.3% to 34.5% of readmissions after ATSA and RTSA.3,14 Our finding (33%) is more in line with Mahoney and colleagues14 (34.5%) than Schairer and colleagues3 (9.3%). One explanation for the large discrepancy with Schairer and colleagues3 is that UTI was not among the medical reasons for readmission in their study, but it was in ours. Another difference is that we used a database that included data from multiple institutions. Last, Schairer and colleagues3 excluded revision SAs from their analysis (complication rates are higher for revision SAs than for primary SAs30). They also excluded cases of SA used for fracture (shown to increase the risk for PE42). The US Department of Health and Human Services estimated that patients experienced 1.3 million fewer HACs during the period 2010-2013, corresponding to a 17% decline over the 3 years.43 This translates to an estimated 50,000 fewer mortalities, and $12 billion saved in healthcare costs, over the same period.43 Preventing HACs helps reduce readmission rates while improving patient outcomes and decreasing healthcare costs.
This study had several limitations. We could not differentiate between ATSA and RTSA readmission rates because, for the study period, these procedures are collectively organized under a common CPT code in the NSQIP database. Readmission and complication rates are higher for RTSAs than for ATSAs.3,14 In addition, our data were limited to hospitals that were participating in NSQIP, which could lead to selection bias. We studied rates of only those readmissions and complications that occurred within 30 days, but many complications develop after 30 days, and these increase the readmission rate. Last, reasons for readmission were not recorded for 2011, so this information was available only for the final 2 years of the study. Despite these limitations, NSQIP still allows for a powerful study, as it includes multiple institutions and a very large cohort.
Conclusion
With medical costs increasing, focus has shifted to quality care and good outcomes with the goal of reducing readmissions and complications after various procedures. SA has recently become more popular because of its multiple indications, and this trend will continue. In the present study, the rate of readmission within 30 days after ATSA or RTSA was 2.7%. Revision surgery, 3 or more comorbidities, and extended LOS were independent risk factors that more than doubled the risk of readmission. Understanding the risk factors for short-term readmission will allow for better patient care and decreased costs, and will benefit the healthcare system as a whole.
Am J Orthop. 2016;45(6):E386-E392. Copyright Frontline Medical Communications Inc. 2016. All rights reserved.
1. Jencks SF, Williams MV, Coleman EA. Rehospitalizations among patients in the Medicare fee-for-service program. N Engl J Med. 2009;360(14):1418-1428.
2. Axon RN, Williams MV. Hospital readmission as an accountability measure. JAMA. 2011;305(5):504-505.
3. Schairer WW, Zhang AL, Feeley BT. Hospital readmissions after primary shoulder arthroplasty. J Shoulder Elbow Surg. 2014;23(9):1349-1355.
4. Day JS, Lau E, Ong KL, Williams GR, Ramsey ML, Kurtz SM. Prevalence and projections of total shoulder and elbow arthroplasty in the United States to 2015. J Shoulder Elbow Surg. 2010;19(8):1115-1120.
5. Kim SH, Wise BL, Zhang Y, Szabo RM. Increasing incidence of shoulder arthroplasty in the United States. J Bone Joint Surg Am. 2011;93(24):2249-2254.
6. Jain NB, Yamaguchi K. The contribution of reverse shoulder arthroplasty to utilization of primary shoulder arthroplasty. J Shoulder Elbow Surg. 2014;23(12):1905-1912.
7. Bartelt R, Sperling JW, Schleck CD, Cofield RH. Shoulder arthroplasty in patients aged fifty-five years or younger with osteoarthritis. J Shoulder Elbow Surg. 2011;20(1):123-130.
8. Chalmers PN, Slikker W 3rd, Mall NA, et al. Reverse total shoulder arthroplasty for acute proximal humeral fracture: comparison to open reduction–internal fixation and hemiarthroplasty. J Shoulder Elbow Surg. 2014;23(2):197-204.
9. Norris TR, Iannotti JP. Functional outcome after shoulder arthroplasty for primary osteoarthritis: a multicenter study. J Shoulder Elbow Surg. 2002;11(2):130-135.
10. Wall B, Nové-Josserand L, O’Connor DP, Edwards TB, Walch G. Reverse total shoulder arthroplasty: a review of results according to etiology. J Bone Joint Surg Am. 2007;89(7):1476-1485.
11. Fevang BT, Lygre SH, Bertelsen G, Skredderstuen A, Havelin LI, Furnes O. Good function after shoulder arthroplasty. Acta Orthop. 2012;83(5):467-473.
12. Orfaly RM, Rockwood CA Jr, Esenyel CZ, Wirth MA. Shoulder arthroplasty in cases with avascular necrosis of the humeral head. J Shoulder Elbow Surg. 2007;16(3 suppl):S27-S32.
13. Sperling JW, Cofield RH, Rowland CM. Minimum fifteen-year follow-up of Neer hemiarthroplasty and total shoulder arthroplasty in patients aged fifty years or younger. J Shoulder Elbow Surg. 2004;13(6):604-613.
14. Mahoney A, Bosco JA 3rd, Zuckerman JD. Readmission after shoulder arthroplasty. J Shoulder Elbow Surg. 2014;23(3):377-381.
15. Fehringer EV, Mikuls TR, Michaud KD, Henderson WG, O’Dell JR. Shoulder arthroplasties have fewer complications than hip or knee arthroplasties in US veterans. Clin Orthop Relat Res. 2010;468(3):717-722.
16. Raines BT, Ponce BA, Reed RD, Richman JS, Hawn MT. Hospital acquired conditions are the strongest predictor for early readmission: an analysis of 26,710 arthroplasties. J Arthroplasty. 2015;30(8):1299-1307.
17. Pugely AJ, Callaghan JJ, Martin CT, Cram P, Gao Y. Incidence of and risk factors for 30-day readmission following elective primary total joint arthroplasty: analysis from the ACS-NSQIP. J Arthroplasty. 2013;28(9):1499-1504.
18. Centers for Medicare & Medicaid Services. Hospital-Acquired Conditions. http://www.cms.gov/Medicare/Medicare-Fee-for-Service-Payment/HospitalAcqCond/Hospital-Acquired_Conditions.html. Published 2014. Accessed May 21, 2015.
19. Feigenbaum P, Neuwirth E, Trowbridge L, et al. Factors contributing to all-cause 30-day readmissions: a structured case series across 18 hospitals. Med Care. 2012;50(7):599-605.
20. Hall BL, Hamilton BH, Richards K, Bilimoria KY, Cohen ME, Ko CY. Does surgical quality improve in the American College of Surgeons National Surgical Quality Improvement Program: an evaluation of all participating hospitals. Ann Surg. 2009;250(3):363-376.
21. American College of Surgeons. About ACS NSQIP. http://www.facs.org/quality-programs/acs-nsqip/about. Published 2015. Accessed June 14, 2015.
22. Shiloach M, Frencher SK Jr, Steeger JE, et al. Toward robust information: data quality and inter-rater reliability in the American College of Surgeons National Surgical Quality Improvement Program. J Am Coll Surg. 2010;210(1):6-16.
23. Bini SA, Fithian DC, Paxton LW, Khatod MX, Inacio MC, Namba RS. Does discharge disposition after primary total joint arthroplasty affect readmission rates? J Arthroplasty. 2010;25(1):114-117.
24. Husted H, Otte KS, Kristensen BB, Orsnes T, Kehlet H. Readmissions after fast-track hip and knee arthroplasty. Arch Orthop Trauma Surg. 2010;130(9):1185-1191.
25. Vorhies JS, Wang Y, Herndon J, Maloney WJ, Huddleston JI. Readmission and length of stay after total hip arthroplasty in a national Medicare sample. J Arthroplasty. 2011;26(6 suppl):119-123.
26. Ponce BA, Oladeji LO, Rogers ME, Menendez ME. Comparative analysis of anatomic and reverse total shoulder arthroplasty: in-hospital outcomes and costs. J Shoulder Elbow Surg. 2015;24(3):460-467.
27. Bozic KJ, Maselli J, Pekow PS, Lindenauer PK, Vail TP, Auerbach AD. The influence of procedure volumes and standardization of care on quality and efficiency in total joint replacement surgery. J Bone Joint Surg Am. 2010;92(16):2643-2652.
28. Tsai TC, Orav EJ, Joynt KE. Disparities in surgical 30-day readmission rates for Medicare beneficiaries by race and site of care. Ann Surg. 2014;259(6):1086-1090.
29. Bohsali KI, Wirth MA, Rockwood CA Jr. Complications of total shoulder arthroplasty. J Bone Joint Surg Am. 2006;88(10):2279-2292.
30. Saltzman BM, Chalmers PN, Gupta AK, Romeo AA, Nicholson GP. Complication rates comparing primary with revision reverse total shoulder arthroplasty. J Shoulder Elbow Surg. 2014;23(11):1647-1654.
31. Black EM, Roberts SM, Siegel E, Yannopoulos P, Higgins LD, Warner JJ. Reverse shoulder arthroplasty as salvage for failed prior arthroplasty in patients 65 years of age or younger. J Shoulder Elbow Surg. 2014;23(7):1036-1042.
32. Menendez ME, Baker DK, Fryberger CT, Ponce BA. Predictors of extended length of stay after elective shoulder arthroplasty. J Shoulder Elbow Surg. 2015;24(10):1527-1533.
33. Jain NB, Guller U, Pietrobon R, Bond TK, Higgins LD. Comorbidities increase complication rates in patients having arthroplasty. Clin Orthop Relat Res. 2005;(435):232-238.
34. Martin CT, Gao Y, Pugely AJ, Wolf BR. 30-day morbidity and mortality after elective shoulder arthroscopy: a review of 9410 cases. J Shoulder Elbow Surg. 2013;22(12):1667-1675.e1.
35. Dailey EA, Cizik A, Kasten J, Chapman JR, Lee MJ. Risk factors for readmission of orthopaedic surgical patients. J Bone Joint Surg Am. 2013;95(11):1012-1019.
36. Dunn JC, Lanzi J, Kusnezov N, Bader J, Waterman BR, Belmont PJ Jr. Predictors of length of stay after elective total shoulder arthroplasty in the United States. J Shoulder Elbow Surg. 2015;24(5):754-759.
37. Maile MD, Engoren MC, Tremper KK, Jewell E, Kheterpal S. Worsening preoperative heart failure is associated with mortality and noncardiac complications, but not myocardial infarction after noncardiac surgery: a retrospective cohort study. Anesth Analg. 2014;119(3):522-532.
38. Farng E, Zingmond D, Krenek L, Soohoo NF. Factors predicting complication rates after primary shoulder arthroplasty. J Shoulder Elbow Surg. 2011;20(4):557-563.
39. Waterman BR, Dunn JC, Bader J, Urrea L, Schoenfeld AJ, Belmont PJ Jr. Thirty-day morbidity and mortality after elective total shoulder arthroplasty: patient-based and surgical risk factors. J Shoulder Elbow Surg. 2015;24(1):24-30.
40. Kassin MT, Owen RM, Perez SD, et al. Risk factors for 30-day hospital readmission among general surgery patients. J Am Coll Surg. 2012;215(3):322-330.
41. Poultsides LA, Ma Y, Della Valle AG, Chiu YL, Sculco TP, Memtsoudis SG. In-hospital surgical site infections after primary hip and knee arthroplasty—incidence and risk factors. J Arthroplasty. 2013;28(3):385-389.
42. Young BL, Menendez ME, Baker DK, Ponce BA. Factors associated with in-hospital pulmonary embolism after shoulder arthroplasty. J Shoulder Elbow Surg. 2015;24(10):e271-e278.
43. US Department of Health and Human Services. Efforts to improve patient safety result in 1.3 million fewer patient harms, 50,000 lives saved and $12 billion in health spending avoided [press release]. http://www.hhs.gov/news/press/2014pres/12/20141202a.html. Published December 2, 2014. Accessed May 25, 2015.
Keeping Watch for Sepsis
Sepsis begins outside the hospital for 80% of patients, according to a recent CDC evaluation, reported in Vital Signs. CDC researchers who reviewed medical records of 246 adults and 79 children at 4 New York hospitals in Albany and Rochester found that 7 in 10 patients with sepsis had recently used health care services or had chronic diseases requiring frequent medical care.
Related: The Role of Procalcitonin in the Management of Infectious Diseases
Sepsis is most common in adults aged ≥ 65 years, infants < 1 year, people with weakened immune systems, or people with chronic conditions, such as diabetes. Nearly all the adults (97%) had at least 1 comorbidity, and 70% of children who developed sepsis had a health condition that may have put them at risk.
Although multiple infections and organisms were implicated, Staphylococcus aureus, Escherichia coli, and some types of Streptococcus were identified most often. Among adults with sepsis, 35% had a lung infection, 25% had a urinary tract infection, 11% had a gastrointestinal infection, and 11% had a skin infection.
Related: Mass Transit for Viruses
Most of the patients had recent interactions with the health care system before admission with sepsis, which likely reflects their vulnerability to infection, the researchers say, “it also suggests that health care facilities and providers could play a central role in sepsis prevention.” The CDC report advises the following for health care providers:
- Follow infection control requirements;
- Ensure that patients receive recommended vaccines (such as flu and pneumococcal);
- Educate patients and families, stressing the need to seek care if they see signs of severe infection or sepsis;
- “Think sepsis”—know the signs and symptoms and treat them early;
- Act fast—order tests to identify infection, start antibiotics and other care immediately; document dose, duration, and purpose; and
- Check patient progress frequently; reassess antibiotic therapy at 24 to 48 hours or sooner to change therapy if needed