User login
New cases of child COVID-19 drop for fifth straight week
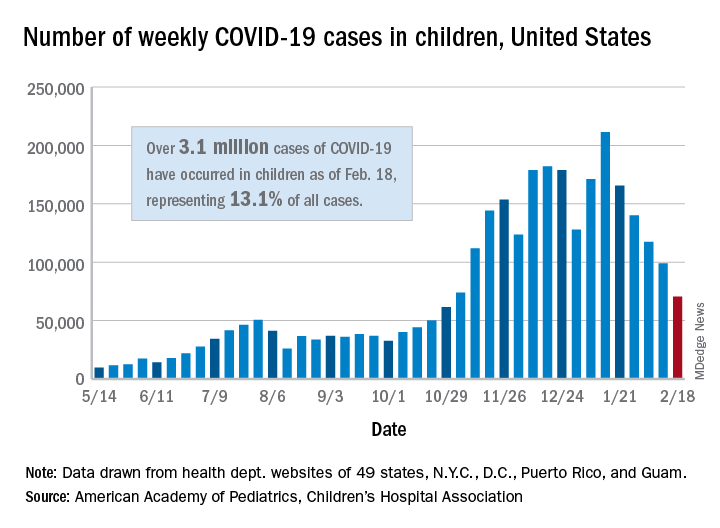
The fifth consecutive week with a decline has the number of new COVID-19 cases in children at its lowest level since late October, according to a report from the American Academy of Pediatrics and the Children’s Hospital Association.
, when 61,000 cases were reported, the AAP and CHA said in their weekly COVID-19 report.
The cumulative number of COVID-19 cases in children is now just over 3.1 million, which represents 13.1% of cases among all ages in the United States, based on data gathered from the health departments of 49 states (excluding New York), the District of Columbia, New York City, Puerto Rico, and Guam.
More children in California (439,000) have been infected than in any other state, while Illinois (176,000), Florida (145,000), Tennessee (137,000), Arizona (127,000), Ohio (121,000), and Pennsylvania (111,000) are the only other states with more than 100,000 cases, the AAP/CHA report shows.
Proportionally, the children of Wyoming have been hardest hit: Pediatric cases represent 19.4% of all cases in the state. The other four states with proportions of 18% or more are Alaska, Vermont, South Carolina, and Tennessee. Cumulative rates, however, tell a somewhat different story, as North Dakota leads with just over 8,500 cases per 100,000 children, followed by Tennessee (7,700 per 100,000) and Rhode Island (7,000 per 100,000), the AAP and CHA said.
Deaths in children, which had not been following the trend of fewer new cases over the last few weeks, dropped below double digits for the first time in a month. The six deaths that occurred during the week of Feb. 12-18 bring the total to 247 since the start of the pandemic in the 43 states, along with New York City and Guam, that are reporting such data, according to the report.
Cellulitis treatment recommendations

He noticed discomfort today and saw that his left lower leg had redness and was warm. He does not recall scratches or injury to his leg. He has not had fever or chills. He has no other symptoms. His diabetes has been well controlled with diet and metformin.
On exam, his blood pressure is 120/70, pulse is 80, temperature is 37 degrees Celsius.
In the left lower extremity, the patient had 1+ edema at the ankle, with a 14-cm x 20-cm warm, erythematous area just above the ankle and extending proximally.
His labs found an HCT of 44 and a WBC of 12,000. What do you recommend?
A) Vascular duplex exam
B) 1st generation cephalosporin
C) 1st generation cephalosporin + TMP/Sulfa
D) Oral clindamycin
E) IV vancomycin
This patient has cellulitis and should receive a beta lactam antibiotic, which will have the best coverage and lowest minimal inhibitory concentration for the likely organism, beta hemolytic streptococci. Clindamycin would likely work, but it has greater side effects. This patient does not need coverage for methicillin-resistant staphylococcus aureus (MRSA). I know many of you, if not most, know this, but I want to go through relevant data and formal recommendations, because of a recent call I received from a patient.
My patient had a full body rash after receiving cephalexin + TMP/sulfa [trimethoprim-sulfamethoxazole] treatment for cellulitis. In recent years the addition of TMP/sulfa to strep treatment to also cover MRSA has become popular, especially in emergency department and urgent care settings.
Moran and colleagues studied cephalexin + TMP/sulfa vs. cephalexin and placebo in patients with uncomplicated cellulitis.1 The outcome measured was clinical cure, and there was no difference between groups; clinical cure occurred in 182 (83.5%) of 218 participants in the cephalexin plus TMP/sulfa group vs. 165 (85.5%) of 193 in the cephalexin group (difference, −2.0%; 95% confidence interval, −9.7% to 5.7%; P = .50).
Jeng and colleagues studied patients admitted for a cellulitis, and evaluated the patients’ response to beta-lactam antibiotics.2 Patients had acute and convalescent serologies for beta hemolytic strep. Almost all evaluable patients with positive strep studies (97%) responded to beta-lactams, and 21 of 23 (91%) with negative studies responded to beta-lactams (overall response rate 95%). This study was done during a time of high MRSA prevalence.
The most recent Infectious Diseases Society of America guidelines for skin and soft tissue infections, recommend oral penicillin, cephalexin, dicloxacillin, or clindamycin for mild cellulitis, and IV equivalent if patients have moderate cellulitis.3 If abscesses are present, then drainage is recommended and MRSA coverage. Kamath and colleagues reported on how closely guidelines for skin and soft tissue infections were followed.4 In patients with mild cellulitis, only 36% received guideline-suggested antibiotics. The most common antibiotic prescribed that was outside the guidelines was trimethoprim-sulfamethoxazole.
Myth: Cellulitis treatment should include MRSA coverage.
My advice: Stick with beta-lactam antibiotics, unless an abscess is present. There is no need to add MRSA coverage for initial treatment of mild to moderate cellulitis.
Dr. Paauw is professor of medicine in the division of general internal medicine at the University of Washington, Seattle, and he serves as third-year medical student clerkship director at the University of Washington. He is a member of the editorial advisory board of Internal Medicine News. Dr. Paauw has no conflicts to disclose. Contact him at imnews@mdedge.com.
References
1. Moran GJ et al. Effect of cephalexin plus trimethoprim-sulfamethoxazole vs. cephalexin alone on clinical cure of uncomplicated cellulitis: A randomized clinical trial. JAMA 2017 May 23;317(20):2088-96.
2. Jeng Arthur et al. The role of beta-hemolytic streptococci in causing diffuse, nonculturable cellulitis. Medicine. 2010;July;89(4):217-26.
3. Stevens DL et al. Practice guidelines for the diagnosis and management of skin and soft tissue infections: 2014 update by the Infectious Diseases Society of America. Clin Infect Dis. 2014;59(2):e10-e52.
4. Kamath RS et al. Guidelines vs. actual management of skin and soft tissue infections in the emergency department. Open Forum Infect Dis. 2018 Jan 12;5(1):ofx188.
Accessing data during EHR downtime
Reducing loss of efficiency
Electronic health record (EHR) implementations involve long downtimes, which are an under-recognized patient safety risk, as clinicians are forced to switch to completely manual, paper-based, and important unfamiliar workflows to care for their acutely ill patients, said Subha Airan-Javia, MD, FAMIA, a hospitalist at the University of Pennsylvania, Philadelphia.

“In this setting, we discovered an unanticipated benefit of our tool [Carelign, initially built to digitize the handoff process] as a clinical resource during EHR downtime, giving clinicians access to critical data as well as an electronic platform to collaborate as a team around the care of their patients,” she said.
There are two important takeaways from their study on this issue. “The first is that Carelign was able to give clinicians access to clinical data that would otherwise have been unavailable, including vitals, labs, medications, care plans and care team assignments,” Dr. Airan-Javia said. “This undoubtedly mitigated patient safety risks during the EHR downtime.”
The second: “As many clinicians know, any change in workflow, even for a few hours, can make providing a high level of patient care very difficult,” she added. “During a downtime without a tool like Carelign, clinicians have to rely on paper and bedside charts, writing notes on paper and then re-typing them into the EHR when it is back up. This adds to the already excessive amount of administrative work that is burning clinicians out.” Using a tool like Carelign means no such loss in efficiency.
“A tool like Carelign, particularly because it is something that can be used without having to integrate it with the EHR, can put some control back into a hospitalist’s hands, to have a say in their workflow,” Dr. Airan-Javia said. “In a world where EHRs are designed to optimize billing, it can be game-changer to have a tool like Carelign that was created by a practicing clinician, for clinicians. Anyone interested in this area is welcome to reach out to me at subhaairan@gmail.com for collaboration or more information.”
Reference
1. Airan-Javia SL, et al. Mind the gap: Revolutionizing the EHR downtime experience with an interoperable workflow tool. Abstract published at Hospital Medicine 2019, March 24-27, National Harbor, Md. Abstract 380. https://www.shmabstracts.com/abstract/mind-the-gap-revolutionizing-the-ehr-downtime-experience-with-an-interoperable-workflow-tool/. Accessed Dec 11, 2019.
Reducing loss of efficiency
Reducing loss of efficiency
Electronic health record (EHR) implementations involve long downtimes, which are an under-recognized patient safety risk, as clinicians are forced to switch to completely manual, paper-based, and important unfamiliar workflows to care for their acutely ill patients, said Subha Airan-Javia, MD, FAMIA, a hospitalist at the University of Pennsylvania, Philadelphia.
“In this setting, we discovered an unanticipated benefit of our tool [Carelign, initially built to digitize the handoff process] as a clinical resource during EHR downtime, giving clinicians access to critical data as well as an electronic platform to collaborate as a team around the care of their patients,” she said.
There are two important takeaways from their study on this issue. “The first is that Carelign was able to give clinicians access to clinical data that would otherwise have been unavailable, including vitals, labs, medications, care plans and care team assignments,” Dr. Airan-Javia said. “This undoubtedly mitigated patient safety risks during the EHR downtime.”
The second: “As many clinicians know, any change in workflow, even for a few hours, can make providing a high level of patient care very difficult,” she added. “During a downtime without a tool like Carelign, clinicians have to rely on paper and bedside charts, writing notes on paper and then re-typing them into the EHR when it is back up. This adds to the already excessive amount of administrative work that is burning clinicians out.” Using a tool like Carelign means no such loss in efficiency.
“A tool like Carelign, particularly because it is something that can be used without having to integrate it with the EHR, can put some control back into a hospitalist’s hands, to have a say in their workflow,” Dr. Airan-Javia said. “In a world where EHRs are designed to optimize billing, it can be game-changer to have a tool like Carelign that was created by a practicing clinician, for clinicians. Anyone interested in this area is welcome to reach out to me at subhaairan@gmail.com for collaboration or more information.”
Reference
1. Airan-Javia SL, et al. Mind the gap: Revolutionizing the EHR downtime experience with an interoperable workflow tool. Abstract published at Hospital Medicine 2019, March 24-27, National Harbor, Md. Abstract 380. https://www.shmabstracts.com/abstract/mind-the-gap-revolutionizing-the-ehr-downtime-experience-with-an-interoperable-workflow-tool/. Accessed Dec 11, 2019.
Variants spur new FDA guidance on COVID vaccines, tests, drugs
The United States is currently facing three main variant threats, according to the Centers for Disease Control and Prevention: B.1.1.7, which originated in the United Kingdom; B.1.351 from South Africa; and the P.1 variant, which originated in Brazil.
Acting FDA Commissioner Janet Woodcock, MD, said on a telephone press briefing call Feb. 22 that the FDA has already been communicating with individual manufacturers as they assess the variants’ effect on their products, but these guidelines are issued for the sake of transparency and to welcome scientific input.
Tailoring may be necessary
Dr. Woodcock emphasized that, “at this time, available data suggest the FDA-authorized vaccines are effective in protecting circulating strains of SARS-CoV-2.” However, in the event the strains start to show resistance, it may be necessary to tailor the vaccine to the variant.
In that case, effectiveness of a modified vaccine should be determined by data from clinical immunogenicity studies, which would compare a recipient’s immune response with virus variants induced by the modified vaccine against the immune response to the authorized vaccine, the guidance states.
Manufacturers should also study the vaccine in both nonvaccinated people and people fully vaccinated with the authorized vaccine, according to the guidance.
Peter Marks, MD, PhD, director of the FDA’s Center for Biologics Evaluation and Research, said on the call that the clinical immunogenicity data is needed to understand, for instance, whether a new vaccine strain is able to cover the new and old strain or whether it just covers the new strain. Information is also needed to understand whether the modified vaccine, when given to someone fully vaccinated, will still promote a positive response without introducing safety concerns.
Further discussions will be necessary to decide whether future modified vaccines may be authorized without the need for clinical studies.
Variants and testing
The FDA’s updated guidance for test developers, Policy for Evaluating Impact of Viral Mutations on COVID-19 Tests, includes information that test performance can be influenced by the sequence of the variant, prevalence of the variant in the population, or design of the test. For example, molecular tests designed to detect multiple SARS-CoV-2 genetic targets are less susceptible to genetic variants than tests designed to detect a single genetic target.
The FDA already issued a safety alert on Jan. 8 to caution that genetic mutations to the virus in a patient sample can potentially change the performance of a diagnostic test. The FDA identified three tests that had been granted emergency-use authorization (EUA) that are known to be affected.
However, Dr. Woodcock said on the call, “at this time the impact does not appear to be significant.”
Updated guidance for therapeutics
The FDA has issued new guidance on the effect of variants on monoclonal antibody treatments.
“The FDA is aware that some of the monoclonal antibodies that have been authorized are less active against some of the SARS-CoV-2 variants that have emerged,” the FDA noted in its press release. “This guidance provides recommendations on efficient approaches to the generation of ... manufacturing and controls data that could potentially support an EUA for monoclonal antibody products that may be effective against emerging variants.”
While the FDA is monitoring the effects of variants, manufacturers bear a lot of the responsibility as well.
The FDA added: “With these guidances, the FDA is encouraging developers of drugs or biological products targeting SARS-CoV-2 to continuously monitor genomic databases for emerging SARS-CoV-2 variants and evaluate phenotypically any specific variants in the product target that are becoming prevalent or could potentially impact its activity.”
Dr.Woodcock added that “we urge all Americans to continue to get tested, get their vaccines when available, and follow important heath measures such as handwashing, masking, and social distancing.”
A version of this article first appeared on Medscape.com.
Pandemic puts patients with psoriatic disease off seeking medical help
More than half of respondents to a recent survey looking at how the COVID-19 pandemic has affected people with psoriasis or psoriatic arthritis (PsA) said that they had avoided seeking medical care in person with a doctor or at a hospital.

Moreover, around a quarter had their appointment with a rheumatologist canceled, rescheduled, or conducted virtually. Another 1 in 10 had their treatment plan disrupted, and 6% had to change or stop treatment entirely.
The mental health impact of living with these conditions during the pandemic was also notable, said Rachael Manion, the executive director of the Canadian Association of Psoriasis Patients (CAPP), which conducted the survey in collaboration with the Canadian Psoriasis Network (CPN) and Unmasking Psoriasis.
“It’s important to know that there have been a lot of different impacts of the pandemic on people living with psoriatic arthritis and psoriasis. Mental health in particular has had a really big hit as a result,” she said at the Canadian Arthritis Research Conference: Research with Impact.
“About half of the people who responded to our survey noted that their mental health was ‘worse’ or ‘much worse’ during the pandemic,” she said at the meeting, which was sponsored by the Arthritis Society, the Canadian Rheumatology Association, and Canada’s Institute of Musculoskeletal Health and Arthritis. Anxiety and feelings of isolation were reported by a respective 57% and 58% of respondents, and 40% reported depression.
“We can compare that to our earlier information around depression,” Ms. Manion said, which showed that, prior to the pandemic, 24% of people with psoriasis and 23% of those with PsA had said they experienced depression.
“What I found alarming looking at these results was that about a third of people were experiencing despair. Now that’s a really big, scary, overwhelming emotion that has a lot of burden on your mental health,” Ms. Manion said.
Despite the substantial effects on mental health, only 29% of respondents said they had been able to access mental health services during the pandemic.
To look at the impact of the COVID-19 pandemic on the psoriasis and PsA community in Canada, three patient advocacy groups – CAPP, CPN, and Unmasking Psoriasis – codeveloped a survey to look at the disease experience before and after the start of the COVID-19 pandemic. The survey was performed once, with 830 respondents providing information on their lives with psoriasis or PsA in the months before the start of the pandemic and at the time they were surveyed in September and October 2020.
Most of the survey respondents lived in Ontario, Quebec, British Columbia, or Alberta, although other provinces or territories were represented. Almost all respondents (96%) had psoriasis, and 60% also had PsA.
Pre-COVID, nearly half (49%) of patients said that they had not been seen by a rheumatologist, and 39% had not seen a dermatologist for treatment. Asked why, 56% and 27%, respectively, had not been referred, 9% and 15% said they had no specialist located nearby, and 7% and 10% stated that the wait list was too long.
“This tells us that there’s a lot more work that can be done and a lot more education of general practitioners and family medicine professionals about the benefits and the value of specialized care for psoriatic arthritis,” Ms. Manion suggested.
Before the pandemic, joint pain was occurring in 88% of patients, stiffness in 71%, and joint swelling in 67%. Disease flares or sudden periods of worsening occurred on a daily basis for 17%, and around one in five (21%) experienced multiple flares every month.
Prepandemic data also highlighted the negative impact that living with psoriasis or PsA has on people’s ability to sleep, interactions and intimacy with others, and on their school or work lives.
During the pandemic, around a quarter (26%) of respondents said they had worse or much worse access to employment, as well as its benefits such as a stable income (24%). A minority of respondent also described worse access to prescription medication (15%) and over-the-counter medication (13%).
“There are all kinds of things going on for patients in our community: changes to their work, changes to their drug coverage, their ability to sleep and sleep well, their mental health, and their ability to access care and treatments as part of their disease management,” Ms. Manion said.
Her final message to health care professionals was: “I just want to encourage you to continue to check in with your patients about what their experiences have been during the pandemic, and to really consider those impacts as you’re working with them to manage their disease.”
The survey received funding support from AbbVie, Bausch Health, Boehringer Ingelheim, Janssen, LEO Pharma, and Novartis.
More than half of respondents to a recent survey looking at how the COVID-19 pandemic has affected people with psoriasis or psoriatic arthritis (PsA) said that they had avoided seeking medical care in person with a doctor or at a hospital.
Moreover, around a quarter had their appointment with a rheumatologist canceled, rescheduled, or conducted virtually. Another 1 in 10 had their treatment plan disrupted, and 6% had to change or stop treatment entirely.
The mental health impact of living with these conditions during the pandemic was also notable, said Rachael Manion, the executive director of the Canadian Association of Psoriasis Patients (CAPP), which conducted the survey in collaboration with the Canadian Psoriasis Network (CPN) and Unmasking Psoriasis.
“It’s important to know that there have been a lot of different impacts of the pandemic on people living with psoriatic arthritis and psoriasis. Mental health in particular has had a really big hit as a result,” she said at the Canadian Arthritis Research Conference: Research with Impact.
“About half of the people who responded to our survey noted that their mental health was ‘worse’ or ‘much worse’ during the pandemic,” she said at the meeting, which was sponsored by the Arthritis Society, the Canadian Rheumatology Association, and Canada’s Institute of Musculoskeletal Health and Arthritis. Anxiety and feelings of isolation were reported by a respective 57% and 58% of respondents, and 40% reported depression.
“We can compare that to our earlier information around depression,” Ms. Manion said, which showed that, prior to the pandemic, 24% of people with psoriasis and 23% of those with PsA had said they experienced depression.
“What I found alarming looking at these results was that about a third of people were experiencing despair. Now that’s a really big, scary, overwhelming emotion that has a lot of burden on your mental health,” Ms. Manion said.
Despite the substantial effects on mental health, only 29% of respondents said they had been able to access mental health services during the pandemic.
To look at the impact of the COVID-19 pandemic on the psoriasis and PsA community in Canada, three patient advocacy groups – CAPP, CPN, and Unmasking Psoriasis – codeveloped a survey to look at the disease experience before and after the start of the COVID-19 pandemic. The survey was performed once, with 830 respondents providing information on their lives with psoriasis or PsA in the months before the start of the pandemic and at the time they were surveyed in September and October 2020.
Most of the survey respondents lived in Ontario, Quebec, British Columbia, or Alberta, although other provinces or territories were represented. Almost all respondents (96%) had psoriasis, and 60% also had PsA.
Pre-COVID, nearly half (49%) of patients said that they had not been seen by a rheumatologist, and 39% had not seen a dermatologist for treatment. Asked why, 56% and 27%, respectively, had not been referred, 9% and 15% said they had no specialist located nearby, and 7% and 10% stated that the wait list was too long.
“This tells us that there’s a lot more work that can be done and a lot more education of general practitioners and family medicine professionals about the benefits and the value of specialized care for psoriatic arthritis,” Ms. Manion suggested.
Before the pandemic, joint pain was occurring in 88% of patients, stiffness in 71%, and joint swelling in 67%. Disease flares or sudden periods of worsening occurred on a daily basis for 17%, and around one in five (21%) experienced multiple flares every month.
Prepandemic data also highlighted the negative impact that living with psoriasis or PsA has on people’s ability to sleep, interactions and intimacy with others, and on their school or work lives.
During the pandemic, around a quarter (26%) of respondents said they had worse or much worse access to employment, as well as its benefits such as a stable income (24%). A minority of respondent also described worse access to prescription medication (15%) and over-the-counter medication (13%).
“There are all kinds of things going on for patients in our community: changes to their work, changes to their drug coverage, their ability to sleep and sleep well, their mental health, and their ability to access care and treatments as part of their disease management,” Ms. Manion said.
Her final message to health care professionals was: “I just want to encourage you to continue to check in with your patients about what their experiences have been during the pandemic, and to really consider those impacts as you’re working with them to manage their disease.”
The survey received funding support from AbbVie, Bausch Health, Boehringer Ingelheim, Janssen, LEO Pharma, and Novartis.
FROM CARC 2021
New light cast on type 2 MI aims to sharpen diagnosis, therapy
The hospital and postdischarge course of patients diagnosed with type 2 myocardial infarction, triggered when myocardial oxygen demand outstrips supply, differs in telling ways from those with the more common atherothrombotic type 1 MI, suggests a new registry analysis that aims to lift a cloud of confusion surrounding their management.
The observational study of more than 250,000 patients with either form of MI, said to be the largest of its kind, points to widespread unfamiliarity with distinctions between the two, and the diagnostic and therapeutic implications of misclassification. It suggests, in particular, that type 2 MI may be grossly underdiagnosed and undertreated.
The minority of patients with type 2 MI were more likely female and to have heart failure (HF), renal disease, valve disease, or atrial fibrillation, and less likely to have a lipid disorder, compared with those with type 1 MI. They were one-fifth as likely to be referred for coronary angiography and 20 times less likely to undergo revascularization.
Indeed, only about 2% of the type 2 cohort ultimately underwent percutaneous coronary intervention (PCI) or coronary bypass surgery (CABG). Yet the analysis suggests that cardiovascular risk climbs regardless of MI type and that in patients with type 2 MI, coronary revascularization might well cut the risk of death in half over the short term.
There were also disparities in clinical outcomes in the analysis, based on data from the final 3 months of 2017 in the Nationwide Readmissions Database, which reportedly documents almost 60% of hospitalizations in the United States.
For example, those with type 1 or type 2 MI – as characterized in the then-current third Universal Definition of Myocardial Infarction and today’s UDMI-4 – were comparably at risk for both 30-day all-cause readmission and HF readmission. But type 2 patients were less likely to die in the hospital or be readmitted within 30 days for recurrent MI.
Revascularization uncertainty
Importantly, the study’s 3-month observation period immediately followed the debut of a code specifically for type 2 MI in the ICD-10-CM system.
Type 2 accounted for about 15% of MIs during that period, the percentage climbing sharply from the first to the third month. That suggests clinicians were still getting used to the code during the early weeks, “undercoding” for type-2 MI at first but less so after some experience, Cian P. McCarthy, MB, BCh, BAO, Massachusetts General Hospital, Boston, said in an interview.
“I can imagine that as people become more aware of the coding, using it more often, the proportion of type 2 MI relative to the total MI cases will probably be much higher,” said McCarthy, lead author on the study published online Feb. 15, 2021, in the Journal of the American College of Cardiology.
What had been understood about type 2 MI came largely from single-center studies, he said. This “first national study of type-2 MI in the United States” sought to determine whether such findings are hospital specific or “representative of what people are doing nationally.”
The new analysis largely confirms that patients with type 2 MI are typically burdened with multiple comorbidities, Dr. McCarthy said, but also suggests that type 2 often was, and likely still is, incorrectly classified as type 1. So, it was “surprising” that they were rarely referred for angiography. “Only 1 in 50 received revascularization.”
Those diagnosed with type-2 MI were far less likely to receive coronary angiography (10.9% vs. 57.3%), PCI (1.7% vs. 38.5%), or CABG (0.4% vs. 7.8%) (P < .001 for all three differences), the report noted.
That, Dr. McCarthy said, “clearly shows that clinicians are uncertain about whether revascularization is beneficial” in type 2 MI.
Coding not in sync with UDMI
If there is confusion in practice about differentiating type 2 from type 1 MI, it likely has multiple sources, and one may be inconsistencies in how the UDMI and relevant ICD codes are applied in practice.
For example, the coding mandate is always to classify ST-segment elevation MI and non-STEMI as type 1, yet UDMI-4 itself states that a type 2 MI may be either STEMI or non-STEMI, noted Dr. McCarthy, as well as an editorial accompanying the report.
“It also can be difficult at times to distinguish type 2 MI from the diagnosis of myocardial injury,” both of which are partly defined by elevated cardiac troponin (cTn), adds the editorial, from Kristian Thygesen, MD, DSc, Aarhus (Denmark) University Hospital, Aarhus, Denmark, and Allan S. Jaffe, MD, Mayo Clinic, Rochester, Minn.
Crucially, but potentially sometimes overlooked, a diagnosis of infarction requires evidence of ischemia along with the biomarker elevation, whereas myocardial injury is defined by raised cTn without evidence of ischemia. Yet there is no ICD-10-CM code for “nonischemic myocardial injury,” Dr. Thygesen and Dr. Jaffe observed.
“Instead, the new ICD-10-CM coding includes a proxy called ‘non-MI troponin elevation due to an underlying cause,’ ” they wrote. “Unfortunately, although some have advocated using this code for myocardial injury, it is not specific for an elevated cTn value and could represent any abnormal laboratory measurements.” The code could be “misleading” and thus worsen the potential for miscoding and “misattribution of MI diagnoses.”
In the current study, 84.6% of the cohort were classified with type 1 MI, 14.8% with type 2, and 0.6% with both types. Of those with type 1 MI, 22.1% had STEMI, 76.4% had non-STEMI with the remainder “unspecified.”
“I think the introduction of ICD codes for type-2 MI is helpful in that we can study type 2 MI more broadly, across institutions, and try and get a better sense of its outcomes and how these patients are treated,” Dr. McCarthy said. But the coding system’s deficiencies may often lead to misclassification of patients. Especially, patients with type 2 STEMI may be miscoded as having type-1 STEMI, and those with only myocardial injury may be miscoded as having type 2 MI.
Most type 2 MI is a complication
A profile of patients with type 2 MI may be helpful for making distinctions. The analysis showed that, compared with patients with type 1 MI, they were slightly but significantly older and more likely to have clinical depression, alcohol or other substance abuse disorder, and to be female. They also had more heart failure (27.9% vs. 10.9%), kidney disease (35.7% vs. 25.7%), atrial fibrillation (31% vs. 21%), and anemia (26% vs. 18.9%) (P < .001 for all differences).
Type 2 patients were less likely to have CV risk factors usually associated with plaque instability and atherothrombosis, including a history of smoking, dyslipidemia, MI, PCI, or CABG (P < .001 for all differences), the group noted.
Of the 37,765 patients with type 2 MI, 91% received the diagnosis as secondary to another condition, including sepsis in 24.5%, hypertension in 16.9%, arrhythmias in 6.1%, respiratory failure in 4.3%, and pneumonia in 2.8% of cases.
In multivariate analyses, patients with type 2 MI, compared with type 1, showed lower risks of in-hospital death and readmission for MI within 30 days. Their 30-day risks of readmission from any cause and from MI were similar.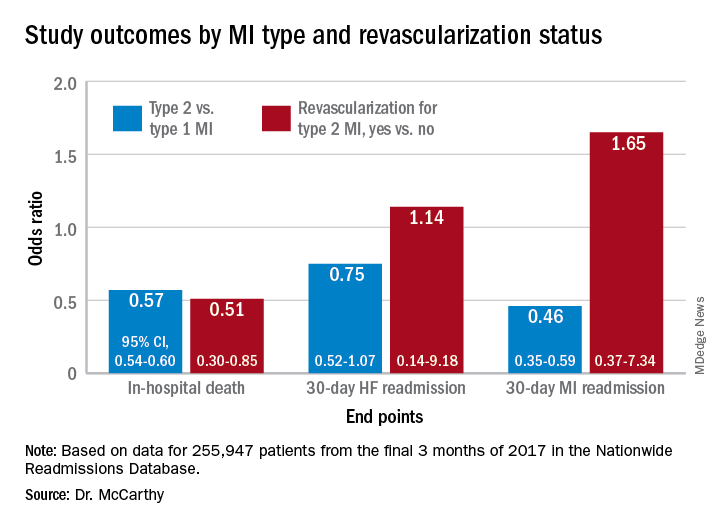
In-hospital mortality was lower for patients with type 2 MI who underwent revascularization, compared with those who did not, “but they were a very select, small proportion of the patient group. I would say there are probably unmeasured confounders,” Dr. McCarthy said.
“There’s a real kind of equipoise, so I think we desperately need a trial to guide us on whether revascularization is beneficial.”
Dr. McCarthy has disclosed no relevant financial relationships. Dr. Thygesen disclosed no relevant financial relationships. Dr. Jaffe disclosed serving as a consultant for Abbott, Roche, Siemens, Beckman-Coulter, Radiometer, ET Healthcare, Sphingotec, Brava, Quidel, Amgen, Novartis, and Medscape for educational activities.
A version of this article first appeared on Medscape.com.
Frozen sections can guide biopsies for giant cell arteritis, but are they feasible?
Positive findings from frozen sections of a first temporal artery biopsy can effectively identify giant cell arteritis, ruling out in those cases the need to perform a second biopsy on the contralateral side and arguing against the use of simultaneous bilateral biopsies, according to results from a retrospective study of nearly 800 patients who underwent the procedure at the Mayo Clinic during 2010-2018.

Although temporal artery biopsy (TAB) remains the standard diagnostic test for giant cell arteritis (GCA), second TAB procedures are often performed in patients with a high level of suspicion for GCA, which may result in unnecessary treatments and complications, Devon A. Cohen, MD, of the Mayo Clinic, Rochester, Minn., and colleagues wrote. (Dr. Cohen is now a clinical fellow in ophthalmology at the Massachusetts Eye and Ear Infirmary.)
At the Mayo Clinic, TAB specimens are first examined with frozen sections at the time of the biopsy; this process, followed within days by formalin-fixed tissue permanent sections, is unique to Mayo. “A frozen section–guided sequential TAB is commonly performed, with the results of the first biopsy obtained within minutes, which determines the need for evaluation of the contralateral side,” the researchers said. However, the use of frozen sections to evaluate patients with GCA has not been well studied.
In a retrospective cohort study published in JAMA Ophthalmology, the researchers identified TAB patients aged 40 years and older who underwent TAB procedures between Jan. 1, 2010, and Dec. 1, 2018, at the Mayo Clinic. The average age of the patients was 72 years, and 41% were men.
Strong positive predictions from frozen sections
The researchers analyzed 1,162 TABs from 795 patients using frozen and permanent histologic sections.
Overall, 119 patients (15.0%) and 138 TABs had positive permanent section findings, and 103 (86.6%) of these patients also had positive frozen section findings, including 4 false positives and 20 false negatives. The frozen section specificity and sensitivity was 99.4% and 83.2%, respectively, for detecting inflammation suggestive of GCA, and the positive and negative predictive values were 96.1% and 96.6%, respectively. Positive and negative likelihood ratios for frozen section were 140.6 and 0.17, respectively.
In a multivariate analysis, the odds of a positive permanent section TAB significantly increased with age (odds ratio, 1.04), vision loss (OR, 2.72), diplopia (OR, 3.33), headache (OR, 2.32), weight loss (OR, 2.37), and anorexia (OR, 5.65).
A total of 60 patients underwent bilateral TABs, and 307 patients underwent bilateral frozen section–guided sequential TABs; the discordance rates based on permanent sections were 5.0% and 5.5%, respectively.
Those discordance rates are “an important result applying to everyone working with patients suspected for GCA,” Patricia Chévez-Barrios, MD, of Houston Methodist Hospital, wrote in an accompanying editorial. “This is on the low end of what was previously published (3%-40%) and supports the relative low need for bilateral synchronous TAB for the diagnosis of GCA.”
A key issue in GCA diagnosis is the need to confirm inflammation, Dr. Chévez-Barrios said. “The surgeon must obtain a significant portion of the artery, and the pathologist should review several sections and levels of the tissue to confidently say whether there is inflammation or no.”
Frozen sections can spare patients from second procedures
The findings suggest a role for frozen section to help to determine whether a unilateral or bilateral simultaneous TAB should be performed, the study authors noted.
“If the frozen section is positive on the first TAB, a contralateral TAB is deferred, given the very low false-positive rate (0.6%). However, if the frozen section does not align with the permanent section result, in particular if the frozen section is positive but permanent section is negative, the patient returns for a TAB on the contralateral side if the GCA suspicion remains high,” they said.
The use of frozen sections requires ideal conditions in order to be effective, Dr. Chévez-Barrios said. The Mayo Clinic approach “is only possible because of their appropriate hospital setting, the training of the histotechnologists, and the experience of the pathologists interpreting the stains and sections. For most pathology laboratories outside of the Mayo Clinic, frozen sections on arteries are the exception and are used only in specific scenarios.”
In addition, the American College of Rheumatology recommends that patients with a high suspicion of GCA should begin corticosteroids as soon as laboratory studies are obtained; “As a result, if a TAB is performed after treatment begins, the typical active pattern of inflammation in the artery changes,” Dr. Chévez-Barrios said. “This further challenges the diagnosis in a frozen section setting because of the need for immunohistochemistry.” Although frozen sections are feasible in specialized settings such as the Mayo Clinic, most patients receive adequate diagnosis and treatment based on permanent sections.
The study findings were limited by several factors including the use of data from patients at a single center and the unique setup of the Mayo Clinic to perform rapid processing of frozen sections, the researchers noted.
“Additionally, we acknowledge that there is controversy regarding the clinical interpretation of healed arteritis. At our institution, healed arteritis is interpreted in the context of patient clinical characteristics and radiographic findings, which may differ from other institutions and may impact the results of this study,” they said.
Overall, the results support the potential of frozen sections in guiding TAB, although “more studies with a comparative analysis of laboratory results, clinical symptoms, and patient demographic characteristics between positive and negative frozen and permanent TAB results are needed to confirm our findings,” they concluded.
The study received no outside funding. One author reported receiving grants from Eli Lilly and Kiniksa Pharmaceuticals as well as personal fees from Genentech-Roche and Sanofi. Dr. Chévez-Barrios had no financial conflicts to disclose.
Positive findings from frozen sections of a first temporal artery biopsy can effectively identify giant cell arteritis, ruling out in those cases the need to perform a second biopsy on the contralateral side and arguing against the use of simultaneous bilateral biopsies, according to results from a retrospective study of nearly 800 patients who underwent the procedure at the Mayo Clinic during 2010-2018.
Although temporal artery biopsy (TAB) remains the standard diagnostic test for giant cell arteritis (GCA), second TAB procedures are often performed in patients with a high level of suspicion for GCA, which may result in unnecessary treatments and complications, Devon A. Cohen, MD, of the Mayo Clinic, Rochester, Minn., and colleagues wrote. (Dr. Cohen is now a clinical fellow in ophthalmology at the Massachusetts Eye and Ear Infirmary.)
At the Mayo Clinic, TAB specimens are first examined with frozen sections at the time of the biopsy; this process, followed within days by formalin-fixed tissue permanent sections, is unique to Mayo. “A frozen section–guided sequential TAB is commonly performed, with the results of the first biopsy obtained within minutes, which determines the need for evaluation of the contralateral side,” the researchers said. However, the use of frozen sections to evaluate patients with GCA has not been well studied.
In a retrospective cohort study published in JAMA Ophthalmology, the researchers identified TAB patients aged 40 years and older who underwent TAB procedures between Jan. 1, 2010, and Dec. 1, 2018, at the Mayo Clinic. The average age of the patients was 72 years, and 41% were men.
Strong positive predictions from frozen sections
The researchers analyzed 1,162 TABs from 795 patients using frozen and permanent histologic sections.
Overall, 119 patients (15.0%) and 138 TABs had positive permanent section findings, and 103 (86.6%) of these patients also had positive frozen section findings, including 4 false positives and 20 false negatives. The frozen section specificity and sensitivity was 99.4% and 83.2%, respectively, for detecting inflammation suggestive of GCA, and the positive and negative predictive values were 96.1% and 96.6%, respectively. Positive and negative likelihood ratios for frozen section were 140.6 and 0.17, respectively.
In a multivariate analysis, the odds of a positive permanent section TAB significantly increased with age (odds ratio, 1.04), vision loss (OR, 2.72), diplopia (OR, 3.33), headache (OR, 2.32), weight loss (OR, 2.37), and anorexia (OR, 5.65).
A total of 60 patients underwent bilateral TABs, and 307 patients underwent bilateral frozen section–guided sequential TABs; the discordance rates based on permanent sections were 5.0% and 5.5%, respectively.
Those discordance rates are “an important result applying to everyone working with patients suspected for GCA,” Patricia Chévez-Barrios, MD, of Houston Methodist Hospital, wrote in an accompanying editorial. “This is on the low end of what was previously published (3%-40%) and supports the relative low need for bilateral synchronous TAB for the diagnosis of GCA.”
A key issue in GCA diagnosis is the need to confirm inflammation, Dr. Chévez-Barrios said. “The surgeon must obtain a significant portion of the artery, and the pathologist should review several sections and levels of the tissue to confidently say whether there is inflammation or no.”
Frozen sections can spare patients from second procedures
The findings suggest a role for frozen section to help to determine whether a unilateral or bilateral simultaneous TAB should be performed, the study authors noted.
“If the frozen section is positive on the first TAB, a contralateral TAB is deferred, given the very low false-positive rate (0.6%). However, if the frozen section does not align with the permanent section result, in particular if the frozen section is positive but permanent section is negative, the patient returns for a TAB on the contralateral side if the GCA suspicion remains high,” they said.
The use of frozen sections requires ideal conditions in order to be effective, Dr. Chévez-Barrios said. The Mayo Clinic approach “is only possible because of their appropriate hospital setting, the training of the histotechnologists, and the experience of the pathologists interpreting the stains and sections. For most pathology laboratories outside of the Mayo Clinic, frozen sections on arteries are the exception and are used only in specific scenarios.”
In addition, the American College of Rheumatology recommends that patients with a high suspicion of GCA should begin corticosteroids as soon as laboratory studies are obtained; “As a result, if a TAB is performed after treatment begins, the typical active pattern of inflammation in the artery changes,” Dr. Chévez-Barrios said. “This further challenges the diagnosis in a frozen section setting because of the need for immunohistochemistry.” Although frozen sections are feasible in specialized settings such as the Mayo Clinic, most patients receive adequate diagnosis and treatment based on permanent sections.
The study findings were limited by several factors including the use of data from patients at a single center and the unique setup of the Mayo Clinic to perform rapid processing of frozen sections, the researchers noted.
“Additionally, we acknowledge that there is controversy regarding the clinical interpretation of healed arteritis. At our institution, healed arteritis is interpreted in the context of patient clinical characteristics and radiographic findings, which may differ from other institutions and may impact the results of this study,” they said.
Overall, the results support the potential of frozen sections in guiding TAB, although “more studies with a comparative analysis of laboratory results, clinical symptoms, and patient demographic characteristics between positive and negative frozen and permanent TAB results are needed to confirm our findings,” they concluded.
The study received no outside funding. One author reported receiving grants from Eli Lilly and Kiniksa Pharmaceuticals as well as personal fees from Genentech-Roche and Sanofi. Dr. Chévez-Barrios had no financial conflicts to disclose.
FROM JAMA OPHTHALMOLOGY
Using engineered T cells reduced acute, chronic GVHD
A novel T-cell engineered product, Orca-T (Orca Bio), was associated with lower incidence of both acute and chronic graft-versus-host disease (GVHD) and more than double the rate of GVHD-free and relapse-free survival, compared with the current standard of care for patients undergoing hematopoietic stem cell transplants (HSCT), investigators said.
In both a multicenter phase 1 trial (NCT04013685) and single-center phase 1/2 trial (NCT01660607) with a total of 50 patients, those who received Orca-T with single-agent GVHD prophylaxis had a 1-year GVHD-free and relapse-free survival rate of 75%, compared with 31% for patients who received standard of care with two-agent prophylaxis, reported Everett H. Meyer, MD, PhD, from the Stanford (Calif.) University.
“Orca-T has good evidence for reduced acute graft-versus-host disease, reduced chromic graft-versus-host disease, and a low nonrelapse mortality,” he said at the Transplant & Cellular Therapies Meetings.
The product can be quickly manufactured and delivered to treatment centers across the continental United States, with “vein-to-vein” time of less than 72 hours, he said at the meeting held by the American Society for Blood and Marrow Transplantation and the Center for International Blood and Marrow Transplant Research.
Orca-T consists of highly purified, donor-derived T-regulatory (Treg) cells that are sorted and delivered on day 0 with hematopoietic stem cells, without immunosuppressants, followed 2 days later with infusion of a matching dose of conventional T cells.
“The Treg cells are allowed to expand to create the right microenvironment for the [conventional T cells],” he explained.
In preclinical studies, donor-derived, high-purity Tregs delivered prior to adoptive transfer of conventional T cells prevented GVHD while maintaining graft-versus-tumor immunity, he said.
Two T-cell infusions
He reported updated results from current studies on a total of 50 adults, with a cohort of 144 patients treated concurrently with standard of care as controls.
The Orca-T–treated patients had a median age of 47 and 52% were male. Indications for transplant included acute myeloid and acute lymphoblastic leukemia, chronic myeloid leukemia, B-cell lymphoma, myelodysplastic syndrome/myelofibrosis, and other unspecified indications.
In both the Orca-T and control cohorts, patients underwent myeloablative conditioning from 10 to 2 days prior to stem cell infusion.
As noted patients in the experimental arm received infusion of hematopoietic stem/progenitor cells and Tregs, followed 2 days later by conventional T-cell infusion, and, on the day after that, tacrolimus at a target dose of 4.6 ng/mL. The conventional T cells were reserved from donor apheresis and were otherwise unmanipulated prior to infusion into the recipient, Dr. Meyer noted.
Patients in the standard-of-care arm received tacrolimus on the day before standard infusion of the apheresis product, followed by methotrexate prophylaxis on days 1, 3, 6 and 11.
Time to neutrophil engraftment, platelet engraftment, and from day 0 to hospital discharge were all significantly shorter in the Orca-T group, at 12 versus 14 days (P < .0001), 11 vs. 17 days (P < .0001), and 15 vs. 17 days (P = .01) respectively.
At 100 days of follow-up, the rate of grade 2 or greater acute GVHD was 30% among standard-of-care patients versus 10% among Orca-T–treated patients. At 1-year follow-up, respective rates of chronic GVHD were 46% vs. 3%.
Safety
“In general, the protocol is extremely well tolerated by our patients. We’ve seen no exceptional infectious disease complications, and we’ve seen no other major complications,” Dr. Meyer said.
Cytomegalovirus prophylaxis was used variably, depending on the center and on the attending physician. Epstein-Barr virus reactivation occurred in eight patients, with one requiring therapy, but there was no biopsy or radiographic evidence of posttransplant lymphoproliferative disorder.
In all, 18% of patients had serious adverse events during the reporting period, all of which resolved. There were no treatment-related deaths in the Orca-T arm, compared with 11% of controls.
Engraftment differences explored
In the question-and-answer session following the presentation, Christopher J. Gamper, MD, PhD, from the Johns Hopkins Hospital in Baltimore, told Dr. Meyer that “your outcomes from Orca-T look excellent,” and asked about the cost differential, compared with similar, unmanipulated transplants performed with standard GVHD prophylaxis.
“Is this recovered by lower costs for treatment of GVHD?” he asked.
“I have not done an economic cost analysis of course, and I think others may be looking into this,” Dr. Meyer replied. “Graft engineering can be expensive, although it’s an engineering proposition and one could imagine that the costs will go down substantially over time.”
Session moderator Alan Hanash, MD, PhD, from Memorial Sloan Kettering Cancer Center in New York, commented on the differences in engraftment between the experimental controls arms, and asked Dr. Meyer: “Do you think this is due to the difference in prophylaxis? Absence of methotrexate? Do you think that it could be a direct impact of regulatory T cells on hematopoietic engraftment?”
“Certainly not having methotrexate is beneficial for engraftment, and may account for the differences we see, Dr. Meyer said. “However, it is possible that Tregs could be playing a facilitative role. There certainly is good preclinical literature that Tregs, particularly in the bone marrow space, can facilitate bone marrow engraftment.”
The Orca-T trials are sponsored by Orca Bio and Stanford, with support from the National Institutes of Health. Dr. Meyer receives research support from Orca and is a scientific adviser to GigaGen, Triursus, Incyte, and Indee Labs. Dr. Hanash and Dr. Gamper had no relevant disclosures.
FROM TCT 2021
COVID cuts internists’ happiness in life outside work
Before the pandemic, a large majority of internists reported that they were generally happy with life outside of work, although by specialty, they were near the bottom in happiness.
But this year’s Medscape Internist Lifestyle, Happiness & Burnout Report 2021 shows a sharp drop, with just 55% of respondents saying they are somewhat or very happy in life outside work, compared with 78% last year.
Internists were not alone among the more than 12,000 physicians who responded to the survey. The contrast from last year’s report was clear for physicians in general and reflects COVID-19’s substantial toll on clinicians.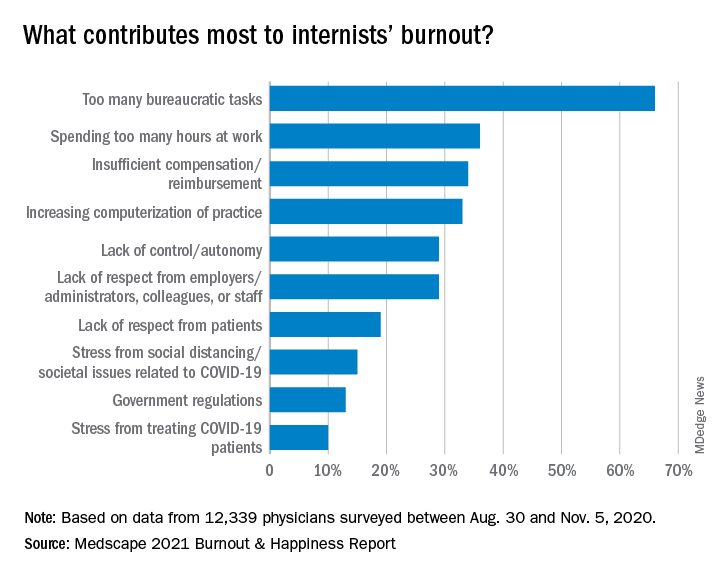
Just 58% of physicians overall reported happy lives outside work, down from 82% last year.
Perhaps not surprising, given the particular demands on certain specialties, physicians in infectious disease were the least happy, at 45%, followed by pulmonologists (47%) and rheumatologists and intensivists, at 49%.
The highest happiness level was reported by those in diabetes and endocrinology, at 73% this year, but that proportion was also substantially lower than the 89% from last year.
Burnout has ‘strong impact on lives’
The percentage of internists who reported burnout or depression, however, has stayed fairly consistent.
More than half (52%) said that burnout had a strong or severe impact on their lives, and nearly 1 in 10 said it was severe enough that they are considering leaving medicine.
One percent of the internists who responded to the survey said they had attempted suicide, and 12% said they had thoughts of suicide but had not attempted it.
Most of those reporting burnout (82%) said it started before the COVID-19 pandemic, but 18% said it began with the pandemic.
Notably, though, physicians ranked problems related to stress from COVID-19 near the bottom among burnout drivers. The top factor, by far, again, was “too many bureaucratic tasks.”
A large majority (78%) of internists work online for up to 10 hours a week, a number that could grow as telemedicine grows.
Exercise is top coping method
Responses gave a peek into how physicians are coping with burnout. Among internists, 49% put exercise at the top. Isolating themselves from others was the next most popular choice, at 45%. Eating junk food and drinking alcohol were further down the list, at 34% and 24%, respectively.
Few internists said they drink alcohol daily, a finding consistent with past years. In fact, 29% said they don’t drink at all, and 26% said they have fewer than one alcoholic drink per week. Only 7% said they had seven or more drinks per week.
The National Institute on Alcohol Abuse and Alcoholism advises that men not have more than 14 alcoholic drinks per week and that women not have more than 7.
Work-life balance topped list of concerns
By far, internists said work-life balance was their top workplace concern. Nearly half (48%) chose that answer, more than twice the percentage who said compensation was the biggest concern (21%).
Asked whether they would take a salary cut for more work-life balance, a similar proportion (46%) said yes.
Forty-three percent of internists manage to take 3-4 weeks of vacation, and 10% take at least 5 weeks, similar to reported vacation time in last year’s survey.
The vast majority are in committed relationships, with 79% reporting that they are married, and 5% reporting that they are living with a partner. Of those who are married, 48% described the marriage as very good; 32%, good; 16%, fair; 2%, poor; and 1%, very poor; 1% preferred not to answer.
One in five internists said their spouse was a physician, and 24% said their spouse worked in the health care field but not as a physician.
Pandemic has increased burnout
Douglas S. Paauw, MD, and Eileen Barrett, MD, two members of the Internal Medicine News editorial advisory board, said they were not surprised by the survey findings.

“There is more burnout since the pandemic,” said Dr. Paauw, professor of medicine in the division of general internal medicine at the University of Washington, Seattle, and third-year medical student clerkship director at the University of Washington. “People may be working more hours, higher stress, but also, some may be working less hours, are socially isolated, taking on a new role of helping their kids in virtual education, andn living in cramped quarters with family that they may not be accustomed to spending so much time with.”
“Also, most physicians love travel, to detress, get back in balance, and that has by and large been taken away by the pandemic,” Dr. Paauw noted. “Unfortunately, bureaucracy did not go away during the pandemic!
Dr. Barrett, an internal medicine hospitalist, said, “It is most concerning to me today that 12% have had thoughts of suicide, and yet 39% are too busy to seek care for depression or burnout, and 17% aren’t seeking due to fear it will be disclosed,”
“Credentialing, medical license applications, and malpractice insurance applications can and must be changed posthaste to support physicians and stop stigmatizing mental health diagnoses and mental health care,” she said. “Removing application questions about physician mental health will be consistent with recommendations from the Federation of State Medical Boards, medical professional societies, and the Americans with Disabilities Act, and is something actionable and achievable for every organization to do in 2021.” “From a public policy perspective, I am deeply concerned about the physician workforce and how patients will be able to receive care from exhausted, burned out physicians who may be reducing their clinical hours to restore their personal happiness – understandably so,” added Dr. Barrett, who is associate professor in the division of hospital medicine, department of internal medicine, at the University of New Mexico, Albuquerque.
She pointed out that there are mental health resources available for physicians that don’t go through their employers or insurance such as www.emotionalppe.org/.
A version of this article first appeared on Medscape.com.
Katie Lennon contributed to this report.
Before the pandemic, a large majority of internists reported that they were generally happy with life outside of work, although by specialty, they were near the bottom in happiness.
But this year’s Medscape Internist Lifestyle, Happiness & Burnout Report 2021 shows a sharp drop, with just 55% of respondents saying they are somewhat or very happy in life outside work, compared with 78% last year.
Internists were not alone among the more than 12,000 physicians who responded to the survey. The contrast from last year’s report was clear for physicians in general and reflects COVID-19’s substantial toll on clinicians.
Just 58% of physicians overall reported happy lives outside work, down from 82% last year.
Perhaps not surprising, given the particular demands on certain specialties, physicians in infectious disease were the least happy, at 45%, followed by pulmonologists (47%) and rheumatologists and intensivists, at 49%.
The highest happiness level was reported by those in diabetes and endocrinology, at 73% this year, but that proportion was also substantially lower than the 89% from last year.
Burnout has ‘strong impact on lives’
The percentage of internists who reported burnout or depression, however, has stayed fairly consistent.
More than half (52%) said that burnout had a strong or severe impact on their lives, and nearly 1 in 10 said it was severe enough that they are considering leaving medicine.
One percent of the internists who responded to the survey said they had attempted suicide, and 12% said they had thoughts of suicide but had not attempted it.
Most of those reporting burnout (82%) said it started before the COVID-19 pandemic, but 18% said it began with the pandemic.
Notably, though, physicians ranked problems related to stress from COVID-19 near the bottom among burnout drivers. The top factor, by far, again, was “too many bureaucratic tasks.”
A large majority (78%) of internists work online for up to 10 hours a week, a number that could grow as telemedicine grows.
Exercise is top coping method
Responses gave a peek into how physicians are coping with burnout. Among internists, 49% put exercise at the top. Isolating themselves from others was the next most popular choice, at 45%. Eating junk food and drinking alcohol were further down the list, at 34% and 24%, respectively.
Few internists said they drink alcohol daily, a finding consistent with past years. In fact, 29% said they don’t drink at all, and 26% said they have fewer than one alcoholic drink per week. Only 7% said they had seven or more drinks per week.
The National Institute on Alcohol Abuse and Alcoholism advises that men not have more than 14 alcoholic drinks per week and that women not have more than 7.
Work-life balance topped list of concerns
By far, internists said work-life balance was their top workplace concern. Nearly half (48%) chose that answer, more than twice the percentage who said compensation was the biggest concern (21%).
Asked whether they would take a salary cut for more work-life balance, a similar proportion (46%) said yes.
Forty-three percent of internists manage to take 3-4 weeks of vacation, and 10% take at least 5 weeks, similar to reported vacation time in last year’s survey.
The vast majority are in committed relationships, with 79% reporting that they are married, and 5% reporting that they are living with a partner. Of those who are married, 48% described the marriage as very good; 32%, good; 16%, fair; 2%, poor; and 1%, very poor; 1% preferred not to answer.
One in five internists said their spouse was a physician, and 24% said their spouse worked in the health care field but not as a physician.
Pandemic has increased burnout
Douglas S. Paauw, MD, and Eileen Barrett, MD, two members of the Internal Medicine News editorial advisory board, said they were not surprised by the survey findings.
“There is more burnout since the pandemic,” said Dr. Paauw, professor of medicine in the division of general internal medicine at the University of Washington, Seattle, and third-year medical student clerkship director at the University of Washington. “People may be working more hours, higher stress, but also, some may be working less hours, are socially isolated, taking on a new role of helping their kids in virtual education, andn living in cramped quarters with family that they may not be accustomed to spending so much time with.”
“Also, most physicians love travel, to detress, get back in balance, and that has by and large been taken away by the pandemic,” Dr. Paauw noted. “Unfortunately, bureaucracy did not go away during the pandemic!
Dr. Barrett, an internal medicine hospitalist, said, “It is most concerning to me today that 12% have had thoughts of suicide, and yet 39% are too busy to seek care for depression or burnout, and 17% aren’t seeking due to fear it will be disclosed,”
“Credentialing, medical license applications, and malpractice insurance applications can and must be changed posthaste to support physicians and stop stigmatizing mental health diagnoses and mental health care,” she said. “Removing application questions about physician mental health will be consistent with recommendations from the Federation of State Medical Boards, medical professional societies, and the Americans with Disabilities Act, and is something actionable and achievable for every organization to do in 2021.” “From a public policy perspective, I am deeply concerned about the physician workforce and how patients will be able to receive care from exhausted, burned out physicians who may be reducing their clinical hours to restore their personal happiness – understandably so,” added Dr. Barrett, who is associate professor in the division of hospital medicine, department of internal medicine, at the University of New Mexico, Albuquerque.
She pointed out that there are mental health resources available for physicians that don’t go through their employers or insurance such as www.emotionalppe.org/.
A version of this article first appeared on Medscape.com.
Katie Lennon contributed to this report.
Tips offered for treating co-occurring ADHD and SUDs
When Frances R. Levin, MD, began her clinical psychiatry career in the mid-1990s, she spent a lot of time educating colleagues about the validity of an ADHD diagnosis in adults.

“That’s no longer an issue,” Dr. Levin, the Kennedy-Leavy Professor of Psychiatry at Columbia University, New York, said during an annual psychopharmacology update held by the Nevada Psychiatric Association. “But at the time, we often thought, ‘ADHD is something that’s specific to people who are stimulant users.’ In fact, what we found over the years was that these rates are elevated in a range of substance use populations.”
According to National Comorbidity Survey, a nontreatment sample of more than 3,000 adults, individuals who have SUD have two to three times the risk of having ADHD, while individuals who have ADHD have about three times the rate of having an SUD, compared with those who don’t (Am J Psychiatry. 2006;163[4]:716-23). “When you move to treatment samples, the rates also remain quite high,” said Dr. Levin, who is also chief of the division of substance use disorders at the medical center.
“In the general population, the rates of ADHD are 2%-4%. When we look at people who are coming in specifically for treatment of their SUD, the rates are substantially higher, ranging from 10% to 24%.”
According to a 2014 review of medical literature, potential reasons for the association between ADHD and SUD vary and include underlying biologic deficits, such as parental SUDs and genetics; conduct disorder symptoms, such as defiance, rule breaking, and delinquency; poor performance in school, such as low grades, grade retention, or drop-out; and social difficulties, such as rejection from conventional groups or few quality friendships (Annu Rev Clin Psychol. 2014;10:607-39). Other potential pathways include neurocognitive deficits, stress-negative affect models, impulsive anger, and other underlying traits.
One key reason to treat ADHD in patients with SUDs is that they tend to develop the SUD earlier when the ADHD is present, Dr. Levin said. They’re also less likely to be retained in treatment and have a reduced likelihood of going into remission if dependence develops. “Even when they do achieve remission, it seems to take longer for people to reach remission,” she said. “They have more treatment exposure yet do less well in treatment. This can make it more challenging to treat this population.”
One common assumption from clinicians regarding patients with ADHD and a concomitant SUD is that standard treatments for ADHD do not work in active substance users. Another is that, even if treatments work for ADHD, they do not affect the substance use disorder. “Understandably, there is also concern that active substance abusers will misuse and divert their medications,” she said. “Finally, there are often additional psychiatric comorbidities that may make it harder to effectively treat individuals with ADHD and SUD.”
Since 2002, 15 double-blind outpatient studies using stimulants/atomoxetine to treat substance abusers with ADHD have appeared in the medical literature, Dr. Levin said. Only three have included adolescents. “That’s surprising, because up to 40% of kids who come in for treatment, often for cannabis use disorder, will have ADHD, yet there is very little guidance from empirical studies as to how to best treat them,” she said. “There have been several studies looking at atomoxetine to treat substance abusers with ADHD, but results have been mixed. In the cannabis use populations, atomoxetine has not been shown to be effective in treating the substance use disorder, and results are mixed regarding superiority in reducing ADHD symptoms. There is one study showing that ADHD is more likely to be improved in adults with alcohol use disorders with mixed results regarding the alcohol use.”
Overall, most of the outpatient and inpatient studies conducted in this population have demonstrated some signal in terms of reducing ADHD, she said, while a minority of the outpatient studies suggest some benefit in terms of substance use. “What’s interesting is that when you see a response in terms of the ADHD, you often see an improvement in the substance use as well,” Dr. Levin said. “This potentially suggests that patients may be self-medicating their ADHD symptoms or that if the ADHD responds to treatment, then the patient may benefit from the psychosocial interventions that targets the SUD.”
A separate meta-analysis involving more than 1,000 patients found mixed results from pharmacologic interventions and concluded that, while they modestly improved ADHD symptoms, no beneficial effect was seen on drug abstinence or on treatment discontinuation (J Psychopharmacol. 2015 Jan;29[1]:15-23). “I would argue that you don’t need to be as nihilistic about this as the meta-analysis might suggest, because the devil’s in the details,” said Dr. Levin, whose own research was included in the work.
“First of all, many of the studies had high drop-out rates. The outcome measures were variable, and some of the studies used formulations with poor bioavailability. Also, trials that evaluated atomoxetine or stimulants were combined, which may be problematic given the different mechanisms of action. Further, the meta-analysis did not include two recent placebo-controlled trials in adults with stimulant-use disorders that both found that higher dosing of a long-acting stimulant resulted in greater improvements in ADHD symptoms and stimulant use” (Addict. 2014;109[3]:440-9 and JAMA Psychiatry. 2015;72[6]:593-602).
Dr. Levin went on to note that there are few empirical data to guide treatment for those who have multiple psychiatric disorders, let alone treatment for ADHD and SUDs without additional psychiatric disorders. The challenge is what to treat first and/or how to treat the concomitant conditions safely.
“Generally, if possible, treat what is most clinically impairing first,” she said. “Overall, both stimulants and atomoxetine may work for ADHD even in the presence of additional depression, anxiety disorders, and substance use disorders.”
She cautioned against treating a patient with ADHD medication if there is a preexisting psychosis or bipolar illness. “If you start a stimulant or atomoxetine and psychosis or mania occurs, you clearly want to stop the medication and reassess,” she said. Researchers found that the risk of precipitating mania with a stimulant is uncommon if you alleviate symptoms first with a mood stabilizer. “This is a situation where you probably want to treat the bipolar illness first, but it does not preclude the treatment of ADHD once the mood stabilization has occurred,” she said.
In patients with ADHD and anxiety, she often treats the ADHD first, “because oftentimes the anxiety is driven by the procrastination and the inability to get things done,” she explained. “It’s important to determine whether the anxiety is an independent disorder rather than symptoms of ADHD. Inner restlessness can be described as anxiety.”
When there are concerns that preclude the use of a controlled medication, there are medications, in addition to atomoxetine, that might be considered. While bupropion is not Food and Drug Administration approved for ADHD, it might be useful in comorbid mood disorders for nicotine dependence. Other off-label medications that may help include guanfacine, modafinil, and tricyclic antidepressants.
“To date, robust dosing of long-acting amphetamine or methylphenidate formulations have been shown to be effective for patients with stimulant-use disorder, but as mentioned earlier, the data only come from two studies,” she said.
In order to determine whether stimulant treatment is yielding a benefit in a patient with co-occurring ADHD and SUD, she recommends carrying out a structured assessment of ADHD symptoms. Monitoring for functional improvement is also key.
“If there is no improvement in social, occupational, or academic settings and the patient is still actively using drugs, then there is no reason to keep prescribing,” she said. Close monitoring for cardiovascular or other psychiatric symptoms are key as well. Further, for those individuals with both ADHD and a substance-use disorder, it is critical that both are targeted for treatment.
Dr. Levin reported that she has received research, training, or salary support from the National Institute on Drug Abuse, New York state, and the Substance Abuse and Mental Health Services Administration. She has also received or currently receives industry support from Indivior and U.S. World Meds and for medication and from Major League Baseball. In addition, Dr. Levin has been an unpaid scientific advisory board member for Alkermes, Indivior, and Novartis.
When Frances R. Levin, MD, began her clinical psychiatry career in the mid-1990s, she spent a lot of time educating colleagues about the validity of an ADHD diagnosis in adults.
“That’s no longer an issue,” Dr. Levin, the Kennedy-Leavy Professor of Psychiatry at Columbia University, New York, said during an annual psychopharmacology update held by the Nevada Psychiatric Association. “But at the time, we often thought, ‘ADHD is something that’s specific to people who are stimulant users.’ In fact, what we found over the years was that these rates are elevated in a range of substance use populations.”
According to National Comorbidity Survey, a nontreatment sample of more than 3,000 adults, individuals who have SUD have two to three times the risk of having ADHD, while individuals who have ADHD have about three times the rate of having an SUD, compared with those who don’t (Am J Psychiatry. 2006;163[4]:716-23). “When you move to treatment samples, the rates also remain quite high,” said Dr. Levin, who is also chief of the division of substance use disorders at the medical center.
“In the general population, the rates of ADHD are 2%-4%. When we look at people who are coming in specifically for treatment of their SUD, the rates are substantially higher, ranging from 10% to 24%.”
According to a 2014 review of medical literature, potential reasons for the association between ADHD and SUD vary and include underlying biologic deficits, such as parental SUDs and genetics; conduct disorder symptoms, such as defiance, rule breaking, and delinquency; poor performance in school, such as low grades, grade retention, or drop-out; and social difficulties, such as rejection from conventional groups or few quality friendships (Annu Rev Clin Psychol. 2014;10:607-39). Other potential pathways include neurocognitive deficits, stress-negative affect models, impulsive anger, and other underlying traits.
One key reason to treat ADHD in patients with SUDs is that they tend to develop the SUD earlier when the ADHD is present, Dr. Levin said. They’re also less likely to be retained in treatment and have a reduced likelihood of going into remission if dependence develops. “Even when they do achieve remission, it seems to take longer for people to reach remission,” she said. “They have more treatment exposure yet do less well in treatment. This can make it more challenging to treat this population.”
One common assumption from clinicians regarding patients with ADHD and a concomitant SUD is that standard treatments for ADHD do not work in active substance users. Another is that, even if treatments work for ADHD, they do not affect the substance use disorder. “Understandably, there is also concern that active substance abusers will misuse and divert their medications,” she said. “Finally, there are often additional psychiatric comorbidities that may make it harder to effectively treat individuals with ADHD and SUD.”
Since 2002, 15 double-blind outpatient studies using stimulants/atomoxetine to treat substance abusers with ADHD have appeared in the medical literature, Dr. Levin said. Only three have included adolescents. “That’s surprising, because up to 40% of kids who come in for treatment, often for cannabis use disorder, will have ADHD, yet there is very little guidance from empirical studies as to how to best treat them,” she said. “There have been several studies looking at atomoxetine to treat substance abusers with ADHD, but results have been mixed. In the cannabis use populations, atomoxetine has not been shown to be effective in treating the substance use disorder, and results are mixed regarding superiority in reducing ADHD symptoms. There is one study showing that ADHD is more likely to be improved in adults with alcohol use disorders with mixed results regarding the alcohol use.”
Overall, most of the outpatient and inpatient studies conducted in this population have demonstrated some signal in terms of reducing ADHD, she said, while a minority of the outpatient studies suggest some benefit in terms of substance use. “What’s interesting is that when you see a response in terms of the ADHD, you often see an improvement in the substance use as well,” Dr. Levin said. “This potentially suggests that patients may be self-medicating their ADHD symptoms or that if the ADHD responds to treatment, then the patient may benefit from the psychosocial interventions that targets the SUD.”
A separate meta-analysis involving more than 1,000 patients found mixed results from pharmacologic interventions and concluded that, while they modestly improved ADHD symptoms, no beneficial effect was seen on drug abstinence or on treatment discontinuation (J Psychopharmacol. 2015 Jan;29[1]:15-23). “I would argue that you don’t need to be as nihilistic about this as the meta-analysis might suggest, because the devil’s in the details,” said Dr. Levin, whose own research was included in the work.
“First of all, many of the studies had high drop-out rates. The outcome measures were variable, and some of the studies used formulations with poor bioavailability. Also, trials that evaluated atomoxetine or stimulants were combined, which may be problematic given the different mechanisms of action. Further, the meta-analysis did not include two recent placebo-controlled trials in adults with stimulant-use disorders that both found that higher dosing of a long-acting stimulant resulted in greater improvements in ADHD symptoms and stimulant use” (Addict. 2014;109[3]:440-9 and JAMA Psychiatry. 2015;72[6]:593-602).
Dr. Levin went on to note that there are few empirical data to guide treatment for those who have multiple psychiatric disorders, let alone treatment for ADHD and SUDs without additional psychiatric disorders. The challenge is what to treat first and/or how to treat the concomitant conditions safely.
“Generally, if possible, treat what is most clinically impairing first,” she said. “Overall, both stimulants and atomoxetine may work for ADHD even in the presence of additional depression, anxiety disorders, and substance use disorders.”
She cautioned against treating a patient with ADHD medication if there is a preexisting psychosis or bipolar illness. “If you start a stimulant or atomoxetine and psychosis or mania occurs, you clearly want to stop the medication and reassess,” she said. Researchers found that the risk of precipitating mania with a stimulant is uncommon if you alleviate symptoms first with a mood stabilizer. “This is a situation where you probably want to treat the bipolar illness first, but it does not preclude the treatment of ADHD once the mood stabilization has occurred,” she said.
In patients with ADHD and anxiety, she often treats the ADHD first, “because oftentimes the anxiety is driven by the procrastination and the inability to get things done,” she explained. “It’s important to determine whether the anxiety is an independent disorder rather than symptoms of ADHD. Inner restlessness can be described as anxiety.”
When there are concerns that preclude the use of a controlled medication, there are medications, in addition to atomoxetine, that might be considered. While bupropion is not Food and Drug Administration approved for ADHD, it might be useful in comorbid mood disorders for nicotine dependence. Other off-label medications that may help include guanfacine, modafinil, and tricyclic antidepressants.
“To date, robust dosing of long-acting amphetamine or methylphenidate formulations have been shown to be effective for patients with stimulant-use disorder, but as mentioned earlier, the data only come from two studies,” she said.
In order to determine whether stimulant treatment is yielding a benefit in a patient with co-occurring ADHD and SUD, she recommends carrying out a structured assessment of ADHD symptoms. Monitoring for functional improvement is also key.
“If there is no improvement in social, occupational, or academic settings and the patient is still actively using drugs, then there is no reason to keep prescribing,” she said. Close monitoring for cardiovascular or other psychiatric symptoms are key as well. Further, for those individuals with both ADHD and a substance-use disorder, it is critical that both are targeted for treatment.
Dr. Levin reported that she has received research, training, or salary support from the National Institute on Drug Abuse, New York state, and the Substance Abuse and Mental Health Services Administration. She has also received or currently receives industry support from Indivior and U.S. World Meds and for medication and from Major League Baseball. In addition, Dr. Levin has been an unpaid scientific advisory board member for Alkermes, Indivior, and Novartis.
FROM NPA 2021