User login
Men underrepresented in clinical trials of laser hair removal, review finds
PHOENIX – .

To characterize the sex of patients in trials evaluating hair removal with energy-based devices, Dr. Lee, an internal medicine intern at Beth Israel Deaconess Medical Center, Boston, and Jessica Labadie, MD, director of lasers and cosmetic surgery at the Icahn School of Medicine at Mount Sinai, New York, conducted a systematic review using PubMed with the search query hair AND laser AND removal AND (dermatology OR skin OR cutaneous). They limited the analysis to English-language clinical trials that investigated a laser and light-based therapy as an intervention and if hair reduction was an outcome, and excluded studies that did not include the face as a treatment area and laser hair removal for diseases with disproportionate occurrence in females or males, such as polycystic ovarian syndrome or pseudofolliculitis barbae.
Of 121 articles identified from the PubMed search, 28 studies involving 3,882 patients treated with lasers or intense pulsed light (IPL) for hair removal were included in the final analysis. Of these 28 articles, 22 (79%) reported the sex of trial participants. The population of these 22 studies included 3,104 (88.7%) females, 384 (11.0%) males, and 11 (0.003%) nonbinary identifying patients. None of the studies evaluated laser hair removal outcomes by sex.
“This study adds to the current knowledge of laser hair removal as a part of gender-affirming care by characterizing the representation of assigned sexes of patients in clinical trials evaluating the effectiveness of laser hair removal,” Dr. Lee told this news organization. “It highlights the underrepresentation of people assigned to male sex at birth in these clinical trials, despite this population’s potential interest in laser hair removal as a part of gender-affirming care.”
She acknowledged certain limitations of the review, including the absence of reporting on sex in the demographic sections of many trials and the exclusion of trials that did not include treatment of the face. “Clinicians need to be aware of the underrepresentation of men in clinical trials evaluating laser hair removal, and this may limit their understanding of treatment outcomes in this particular cohort,” she concluded. “Clinicians should emphasize inclusivity in future laser hair removal clinical trials and include outcomes by sex.”
The study “looks at an important aspect of clinical trials in the device-based space,” said Omar A. Ibrahimi, MD, PhD, medical director of the Connecticut Skin Institute, Stamford, who was not involved in the study and was asked to comment on the results. “Laser hair removal is the most commonly performed procedure in aesthetic energy-based device dermatology. While these trials are often very small compared to drug trials, it highlights that men are a very underrepresented cohort in laser hair removal trials,” he said. “More recently, there is an increased interest in gender-affirming procedures, and this has highlighted the need to ensure we include a diverse spectrum of patients in devices-based research studies. This is a very challenging mandate but certainly one we should strive for to make efforts to be more inclusive when designing these clinical studies so that the information we gain from these studies is more broadly applicable.”
The researchers reported having no financial disclosures. Dr. Ibrahimi disclosed that he is a member of the advisory board for Accure Acne, AbbVie, Cutera, Lutronic, Blueberry Therapeutics, Cytrellis, and Quthero, and holds stock in many device and pharmaceutical companies.
PHOENIX – .
To characterize the sex of patients in trials evaluating hair removal with energy-based devices, Dr. Lee, an internal medicine intern at Beth Israel Deaconess Medical Center, Boston, and Jessica Labadie, MD, director of lasers and cosmetic surgery at the Icahn School of Medicine at Mount Sinai, New York, conducted a systematic review using PubMed with the search query hair AND laser AND removal AND (dermatology OR skin OR cutaneous). They limited the analysis to English-language clinical trials that investigated a laser and light-based therapy as an intervention and if hair reduction was an outcome, and excluded studies that did not include the face as a treatment area and laser hair removal for diseases with disproportionate occurrence in females or males, such as polycystic ovarian syndrome or pseudofolliculitis barbae.
Of 121 articles identified from the PubMed search, 28 studies involving 3,882 patients treated with lasers or intense pulsed light (IPL) for hair removal were included in the final analysis. Of these 28 articles, 22 (79%) reported the sex of trial participants. The population of these 22 studies included 3,104 (88.7%) females, 384 (11.0%) males, and 11 (0.003%) nonbinary identifying patients. None of the studies evaluated laser hair removal outcomes by sex.
“This study adds to the current knowledge of laser hair removal as a part of gender-affirming care by characterizing the representation of assigned sexes of patients in clinical trials evaluating the effectiveness of laser hair removal,” Dr. Lee told this news organization. “It highlights the underrepresentation of people assigned to male sex at birth in these clinical trials, despite this population’s potential interest in laser hair removal as a part of gender-affirming care.”
She acknowledged certain limitations of the review, including the absence of reporting on sex in the demographic sections of many trials and the exclusion of trials that did not include treatment of the face. “Clinicians need to be aware of the underrepresentation of men in clinical trials evaluating laser hair removal, and this may limit their understanding of treatment outcomes in this particular cohort,” she concluded. “Clinicians should emphasize inclusivity in future laser hair removal clinical trials and include outcomes by sex.”
The study “looks at an important aspect of clinical trials in the device-based space,” said Omar A. Ibrahimi, MD, PhD, medical director of the Connecticut Skin Institute, Stamford, who was not involved in the study and was asked to comment on the results. “Laser hair removal is the most commonly performed procedure in aesthetic energy-based device dermatology. While these trials are often very small compared to drug trials, it highlights that men are a very underrepresented cohort in laser hair removal trials,” he said. “More recently, there is an increased interest in gender-affirming procedures, and this has highlighted the need to ensure we include a diverse spectrum of patients in devices-based research studies. This is a very challenging mandate but certainly one we should strive for to make efforts to be more inclusive when designing these clinical studies so that the information we gain from these studies is more broadly applicable.”
The researchers reported having no financial disclosures. Dr. Ibrahimi disclosed that he is a member of the advisory board for Accure Acne, AbbVie, Cutera, Lutronic, Blueberry Therapeutics, Cytrellis, and Quthero, and holds stock in many device and pharmaceutical companies.
AT ASLMS 2023
A legacy of unfair admissions
This is where people related to successful alumni and/or big donors can get preferential admission, possibly over more qualified people.
All of us likely experienced this from one side or another, though realistically I haven’t thought about it years. My kids went to the same state school I did, but I’m pretty sure I had nothing to do with their being accepted. I never gave the school a single donation, nor did I call anyone there to try and get them in. Not that anyone would have known who I was if I’d tried. I’m just another one of many who went there, preserved only in some filing cabinet of transcripts somewhere.
I’m all for the legacy system ending, though, for one simple reason: It’s not fair.

If someone is qualified, great. They should be admitted on their own merits. But if they’re not, they shouldn’t get into medical school just because one (or both) of their parents went there, or is a VIP, or paid for a new library wing.
The reason I’m writing this is because the recent reporting did bring back a memory.
A long time ago, when I was in college, I hung out with other premed students. We knew we were all competing with each other for the same spots at the state medical school, but also knew that we wouldn’t all get in there. That didn’t make us enemies, it was just the truth. It’s that point in life where ANY medical school admission is all you want.
Pete (not his real name) was a nice guy, but his grades weren’t the best. His MCAT scores lagged behind the rest of us in the clique, and ... he didn’t care.
Pete’s dad had graduated from the state medical school, and was still on staff there. He was now on the teaching staff ... and on the school’s admissions board. To Pete, tests and grades didn’t matter. His admission was assured.
So it was no surprise when he got in ahead of the rest of us with better qualifications. Most of us, including me, did get in somewhere, so we were still happy. We just had to move farther and pay more, but that’s life.
I really didn’t think much about Pete again after that. I was now in medical school, I had a whole new social group, and more importantly I didn’t really have time to think of much beyond when the next exam was.
Then I moved home, and started residency. During my PGY-2 year we had a changing group of medical students assigned to my wards rotation.
And, as you probably guessed, one of them was Pete.
Pete was in his last year of medical school. But we’d both started in the same year, and now I was 2 years ahead of him. I didn’t ask him what happened, but another medical student told me he wasn’t known to be the best student, but the university refused to drop him, and just kept setting him back a class here, a year there.
Maybe they’d have done the same for anyone, but I doubt it.
I never saw Pete again after that. When I looked him up online tonight he’s not listed as being a doctor, and isn’t even in medicine. Granted, a lot of doctors have left medicine, and maybe he did too.
But the more likely reason is that Pete never should have been there in the first place. He got in as a legacy, taking a medical school slot from someone who may have been more capable and driven.
And that just doesn’t seem right to me. It didn’t then and it doesn’t now.
Dr. Block has a solo neurology practice in Scottsdale, Ariz.
This is where people related to successful alumni and/or big donors can get preferential admission, possibly over more qualified people.
All of us likely experienced this from one side or another, though realistically I haven’t thought about it years. My kids went to the same state school I did, but I’m pretty sure I had nothing to do with their being accepted. I never gave the school a single donation, nor did I call anyone there to try and get them in. Not that anyone would have known who I was if I’d tried. I’m just another one of many who went there, preserved only in some filing cabinet of transcripts somewhere.
I’m all for the legacy system ending, though, for one simple reason: It’s not fair.
If someone is qualified, great. They should be admitted on their own merits. But if they’re not, they shouldn’t get into medical school just because one (or both) of their parents went there, or is a VIP, or paid for a new library wing.
The reason I’m writing this is because the recent reporting did bring back a memory.
A long time ago, when I was in college, I hung out with other premed students. We knew we were all competing with each other for the same spots at the state medical school, but also knew that we wouldn’t all get in there. That didn’t make us enemies, it was just the truth. It’s that point in life where ANY medical school admission is all you want.
Pete (not his real name) was a nice guy, but his grades weren’t the best. His MCAT scores lagged behind the rest of us in the clique, and ... he didn’t care.
Pete’s dad had graduated from the state medical school, and was still on staff there. He was now on the teaching staff ... and on the school’s admissions board. To Pete, tests and grades didn’t matter. His admission was assured.
So it was no surprise when he got in ahead of the rest of us with better qualifications. Most of us, including me, did get in somewhere, so we were still happy. We just had to move farther and pay more, but that’s life.
I really didn’t think much about Pete again after that. I was now in medical school, I had a whole new social group, and more importantly I didn’t really have time to think of much beyond when the next exam was.
Then I moved home, and started residency. During my PGY-2 year we had a changing group of medical students assigned to my wards rotation.
And, as you probably guessed, one of them was Pete.
Pete was in his last year of medical school. But we’d both started in the same year, and now I was 2 years ahead of him. I didn’t ask him what happened, but another medical student told me he wasn’t known to be the best student, but the university refused to drop him, and just kept setting him back a class here, a year there.
Maybe they’d have done the same for anyone, but I doubt it.
I never saw Pete again after that. When I looked him up online tonight he’s not listed as being a doctor, and isn’t even in medicine. Granted, a lot of doctors have left medicine, and maybe he did too.
But the more likely reason is that Pete never should have been there in the first place. He got in as a legacy, taking a medical school slot from someone who may have been more capable and driven.
And that just doesn’t seem right to me. It didn’t then and it doesn’t now.
Dr. Block has a solo neurology practice in Scottsdale, Ariz.
FDA moves to curb misuse of ADHD meds
“The current prescribing information for some prescription stimulants does not provide up-to-date warnings about the harms of misuse and abuse, and particularly that most individuals who misuse prescription stimulants get their drugs from other family members or peers,” the FDA said in a drug safety communication.![]()
Going forward, updated drug labels will clearly state that patients should never share their prescription stimulants with anyone, and the boxed warning will describe the risks of misuse, abuse, addiction, and overdose consistently for all medicines in the class, the FDA said.
The boxed warning will also advise heath care professionals to monitor patients closely for signs and symptoms of misuse, abuse, and addiction.
Patient medication guides will be updated to educate patients and caregivers about these risks.
The FDA encourages prescribers to assess patient risk of misuse, abuse, and addiction before prescribing a stimulant and to counsel patients not to share the medication.
Friends and family
A recent literature review by the FDA found that friends and family members are the most common source of prescription stimulant misuse and abuse (nonmedical use). Estimates of such use range from 56% to 80%.
Misuse/abuse of a patient’s own prescription make up 10%-20% of people who report nonmedical stimulant use.
Less commonly reported sources include drug dealers or strangers (4%-7% of people who report nonmedical use) and the Internet (1%-2%).
The groups at highest risk for misuse/abuse of prescription stimulants are young adults aged 18-25 years, college students, and adolescents and young adults who have been diagnosed with ADHD, the FDA said.
Recent data from the Centers for Disease Control and Prevention show that during the first year of the COVID-19 pandemic, prescriptions for stimulants increased 10% among older children and adults.
A version of this article first appeared on Medscape.com.
Statins appear to guard against liver disease progression
The Swedish population-based study found that adults with noncirrhotic CLD who were on statin therapy had a statistically significant 40% lower risk of developing severe liver disease, compared with matched patients who were not on statin therapy.
The statin users were also less apt to progress to cirrhosis or hepatocellular carcinoma (HCC) and to die of liver disease, Rajani Sharma, MD, MSc, division of digestive and liver diseases, Columbia University Irving Medical Center, New York, and colleagues reported.
Their study was published online in Clinical Gastroenterology and Hepatology.
More than just cholesterol lowering
The study “continues the theme that cholesterol-lowering statins are good for a lot more things than just lowering cholesterol,” William Carey, MD, who wasn’t involved with the study, said in an interview.
The results are “very consistent with other trials that show that people with liver disease on statins do better in many respects than those who are not on statins,” said Dr. Carey, acting head of the hepatology section, department of gastroenterology, hepatology, and nutrition, Cleveland Clinic.
“The effects are not trivial,” Dr. Carey added. “It’s a very significant advantage in terms of fibrosis progression and survival.”
Statins have been shown to inhibit inflammatory pathways, promote endothelial cell function, and reduce hepatic stellate cell activity, suggesting that statins could lessen the progression of liver fibrosis, Dr. Sharma and coauthors wrote.
A few prior studies have looked at the effects of statins in noncirrhotic CLD specifically, but most only included patients with viral hepatitis, and the identification of precirrhotic liver disease was largely based on fibrosis scores or ICD coding, leading to a risk for misclassification and heterogeneity in results, they wrote.
Using histopathology data in a nationwide Swedish cohort, Dr. Sharma and colleagues identified 3862 adults with noncirrhotic CLD who were statin users and a like number of propensity score–matched nonstatin users with noncirrhotic CLD. The adults with CLD included in the study were required to have a liver biopsy showing fibrosis or inflammation between the years 1969 and 2017 and at least one ICD code for CLD.
In both groups, 45% of patients had nonalcoholic fatty liver disease (NAFLD), 22% had alcohol-related liver disease (ALD), 18% had viral hepatitis, and 15% had autoimmune hepatitis (AIH).
The analysis found 234 (6.1%) statin users developed severe liver disease versus 276 (7.1%) nonusers, with incidence rates of 10.5 versus 18.1 per 1,000 person-years, respectively.
Statin use was associated with a statistically significant 40% lower rate of severe liver disease (hazard ratio, 0.60; 95% confidence interval, 0.48-0.74).
This was the case in ALD (HR, 0.30; 95% CI, 0.19-0.49) and NAFLD (HR, 0.68; 95% CI 0.45-1.00), but the results were not statistically significant for individuals with viral hepatitis (HR, 0.76; 95% CI, 0.51-1.14) or AIH (HR, 0.88; 0.48-1.58).
Statin use had a protective association in both prefibrosis and fibrosis stages at diagnosis, the researchers reported.
Statin use was also associated with lower rates of progression to cirrhosis (HR, 0.62; 95% CI, 0.49-0.78), HCC (HR, 0.44; 95% CI, 0.27-0.71) and liver-related death or liver transplant (HR, 0.55; 95% CI, 0.36-0.82).
The authors noted that their “study provides the most robust estimates available thus far.” However, they cautioned that “prospective randomized controlled trials are necessary in order to recommend statin use in clinical practice.”
‘Reassuring and pleasantly surprising’
The study is “very interesting, reassuring, and pleasantly surprising,” Scott L. Friedman, MD, chief of the division of liver diseases and dean for therapeutic discovery at the Icahn School of Medicine at Mount Sinai. New York, said in an interview.
“Statins have been around for a long time, and in earlier days, there was fear of using them because they might induce liver injury. But ample and consistent data exclude the possibility that they are more toxic in patients with liver disease,” said Dr. Friedman, who was not associated with this research.
“What’s interesting and new about this paper is that those studies that have looked at the effects of statins on liver disease have primarily focused on patients who have cirrhosis because there’s some scientific evidence [that] statins can lead to vasodilation and reduce the elevated liver blood flow that occurs in cirrhosis,” he explained.
“Instead, this study, which is quite sizable, includes patients who do not have evidence of cirrhosis based on biopsies. The results suggest that statins have a significant protective effect in these patients,” Dr. Friedman said.
The study was supported by the Karolinska Institute in Stockholm, the Columbia University Irving Medical Center, the Swedish Research Council, the Swedish Cancer Society, and the U.S. National Institutes of Health. Dr. Sharma is a consultant for Takeda and Volv. Other coauthors reported current or past relationships with Bristol-Myers Squibb, Gilead, Salix, and GlaxoSmithKline. Dr. Carey and Dr. Friedman reported no relevant financial relationships.
A version of this article originally appeared on Medscape.com.
FROM CLINICAL GASTROENTEROLOGY AND HEPATOLOGY
Facial, hand, and foot dermatitis: Lebrikizumab and dupilumab show efficacy in new studies
in a secondary analysis of randomized, double-blind, placebo-controlled phase 3 trials of the drug, Jenny E. Murase, MD, reported at the annual Revolutionizing Atopic Dermatitis conference.
At week 16 in the ADvocate 1, ADvocate 2, and ADhere trials, with and without concomitant topical corticosteroid (TCS) use, at least 58% of treated patients experienced improvement in facial dermatitis, and 62% or more experienced improvement in hand dermatitis – statistically significant differences over placebo.
“Lebrikizumab was efficacious in clearing and improving facial and hand dermatitis, burdensome and difficult-to-treat areas, in most patients with moderate to severe AD,” said Dr. Murase, of the department of dermatology at the University of California, San Francisco, and director of medical dermatology consultative services and patch testing for the Palo Alto (Calf.) Foundation Medical Group.

In another late-breaking abstract presented at the RAD conference, the injectable biologic dupilumab – now in its 6th year on the market – was reported by Jonathan I. Silverberg, MD, PhD, MPH, to “rapidly and significantly” improve the signs, symptoms, and quality of life in some adults and adolescents with moderate to severe hand and foot AD in a recently completed phase 3 trial of dupilumab.
Lebrikizumab results for facial, hand dermatitis
The ADvocate 1 and ADvocate 2 trials evaluated lebrikizumab monotherapy and randomized patients to receive 250 mg subcutaneously every 2 weeks (after a 500-mg loading dose at baseline and week 2) or placebo. (Patients who received any corticosteroid as a rescue medication were considered nonresponders.) The ADhere trial compared low to mid–potency TCS plus lebrikizumab, using the same dosing of lebrikizumab as in the ADvocate studies, versus TCS plus placebo.
In all three trials, with a total of more than 1,000 participants, clinicians assessed for the presence or absence of facial or hand dermatitis at baseline. At week 16, they then assessed the change from baseline based on a 4-point scale of cleared, improved, no change, and worsened. “Improvement” was defined as cleared or improved.
Both facial and hand dermatitis were identified in a majority of patients at baseline. For instance, in ADvocate 1, facial dermatitis was identified in 71.4% of patients in the lebrikizumab group and 80.9% of those in the placebo group. Hand dermatitis was identified in 72% and 73% of the treatment and placebo groups, respectively.
Across the trials, at 16 weeks, 58%-69% of adult and adolescent patients receiving lebrikizumab had improvement in facial dermatitis, compared with 22%-46% on placebo. For hand dermatitis, 62%-73% experienced improvement, compared with 19%-43% on placebo, respectively. Proportions of improved patients in both the lebrikizumab and placebo groups were highest in the ADhere trial, Dr. Murase reported.
In the ADvocate trials, 16 weeks marked the end of the induction phase and the start of a 36-week maintenance period. The ADhere trial was a 16-week study. Overall results from ADhere were published in January in JAMA Dermatology, and results from the 16-week induction period of the ADvocate trials were published in March in the New England Journal of Medicine.
Lebrikizumab received fast-track designation for AD by the Food and Drug Administration in 2019. Regulatory decisions in the United States and the European Union are expected later this year, according to a press release from Eli Lilly, the drug’s developer.

Asked to comment on the study results, Zelma Chiesa Fuxench, MD, MSCE, assistant professor of dermatology at the University of Pennsylvania, Philadelphia, called the post-hoc results promising. “While newer, more targeted treatments for AD offer the possibility of overall improvement and long-term disease control, we do not have sufficient data to help guide us when it comes to selecting treatment based on which area of the body is affected,” she explained. Most published findings have used “overall scores and not scores stratified by body region.”
The new findings, “help expand our current understanding of how the drug works for different areas of the body,” which can help inform treatment discussions with patients, she added.
AD can be especially challenging to treat when it involves “what are considered to be more sensitive areas such as the face or hands,” said Dr. Chiesa Fuxench. Challenges may include poor tolerance to topical medications, concerns for safety with long-term use, and the need for constant reapplication.
“Those of us who treat a large number of AD patients suspect that the impact and/or burden of AD may be different depending on what areas of the body are affected,” but more data are needed, she added. Limitations of the study, she noted, include “that the study may not have been adequately powered and that the sample size was small.”
Dupilumab result for hand, foot dermatitis
The phase 3 LIBERTY-AD-HAFT trial randomized 133 patients with moderate to severe atopic hand and/or foot dermatitis to a 16-week course of dupilumab (Dupixent) monotherapy, 300 mg every 2 weeks in adults and 200 or 300 mg every 2 weeks in adolescents, or placebo. Patients were then followed during a 12-week safety follow-up period.

Significantly more patients in the dupilumab group achieved the primary endpoint of a hand and foot Investigator Global Assessment (IGA) score of 0/1 at 16 weeks: 40.3% vs. 16.7% in the placebo group (P = .003). Statistical significance was reached at week 8, reported Dr. Silverberg, professor of dermatology and director of clinical research at George Washington University, Washington. Dupilumab, a human monoclonal IgG4 antibody that inhibits IL-4 and IL-13 signaling, is FDA approved for treating moderate to severe AD in patients age 6 months and older, among other indications.
In addition, the proportion of patients achieving a 4-point or greater improvement in the weekly average of daily hand and foot Peak Pruritus Numerical Rating Scale (PPNRS), the key secondary endpoint, was about fourfold greater with dupilumab: 52.2%, compared with 13.6% on placebo (P < .0001). This reduction in itch reached statistical significance by week 1. Dupilumab-treated patients also experienced significant improvement in other lesion measures and in Quality of Life in Hand Eczema Questionnaire scores, Dr. Silverberg noted.
The patients had a mean age in their 30s and a mean duration of atopic hand and/or foot dermatitis of 15-16 years. For more than one-quarter of patients, morphology was hyperkeratotic, which “has to be one of the toughest subsets to affect positive change in,” he said.
About 40% of patients had lesions on the hands only, and more than half had lesions on both hands and feet. “This is pretty realistic – we generally don’t see much isolated foot dermatitis in the AD population,” Dr. Silverberg said.
About 70%-75% had concomitant AD outside of the hands and feet, mostly of moderate severity. Patients with positive patch tests or whose hand and foot eczema was believed to be driven by irritants were excluded from the trial, as were patients who had used TCS or other topical treatments within 2 weeks of the baseline visit.
Rescue medication use was low (3% with dupilumab vs. 21% with placebo), and adverse events were “pretty consistent with everything we’ve seen with dupilumab,” said Dr. Silverberg.
Commenting on this study, Dr. Chiesa Fuxench said she was “excited to see [the findings], as hand and foot AD can often be quite challenging to treat in clinic.” The improvements in overall disease scores, itch, and quality of life scores – with fairly good tolerance – are “reassuring and what we would expect based on our current experience with dupilumab,” she said.
The lebrikizumab study was funded by Dermira, a wholly owned subsidiary of Eli Lilly. The dupilumab study was sponsored by Sanofi and Regeneron Pharmaceuticals. Some of the data were also reported by lead investigator Eric Simpson, MD, of Oregon Health and Science University at the annual meeting of the American Academy of Dermatology in March 2023.
Dr. Murase reported consulting/advising for Eli Lilly, Leo Pharma, UCB, Sanofi-Genzyme, and non-CME speaking/honoraria for UCB and Regeneron. Dr. Silverberg reported consulting fees and fees for non-CME services from Sanofi Genzyme, Regeneron, Pfizer, and other companies. Dr. Chiesa Fuxench, who was a speaker at the RAD meeting but was not involved in the studies, disclosed receiving honoraria for CME work in AD sponsored by education grants from Regeneron/Sanofi, and grant/research support from Lilly, Regeneron, and Sanofi, among other disclosures.
in a secondary analysis of randomized, double-blind, placebo-controlled phase 3 trials of the drug, Jenny E. Murase, MD, reported at the annual Revolutionizing Atopic Dermatitis conference.
At week 16 in the ADvocate 1, ADvocate 2, and ADhere trials, with and without concomitant topical corticosteroid (TCS) use, at least 58% of treated patients experienced improvement in facial dermatitis, and 62% or more experienced improvement in hand dermatitis – statistically significant differences over placebo.
“Lebrikizumab was efficacious in clearing and improving facial and hand dermatitis, burdensome and difficult-to-treat areas, in most patients with moderate to severe AD,” said Dr. Murase, of the department of dermatology at the University of California, San Francisco, and director of medical dermatology consultative services and patch testing for the Palo Alto (Calf.) Foundation Medical Group.
In another late-breaking abstract presented at the RAD conference, the injectable biologic dupilumab – now in its 6th year on the market – was reported by Jonathan I. Silverberg, MD, PhD, MPH, to “rapidly and significantly” improve the signs, symptoms, and quality of life in some adults and adolescents with moderate to severe hand and foot AD in a recently completed phase 3 trial of dupilumab.
Lebrikizumab results for facial, hand dermatitis
The ADvocate 1 and ADvocate 2 trials evaluated lebrikizumab monotherapy and randomized patients to receive 250 mg subcutaneously every 2 weeks (after a 500-mg loading dose at baseline and week 2) or placebo. (Patients who received any corticosteroid as a rescue medication were considered nonresponders.) The ADhere trial compared low to mid–potency TCS plus lebrikizumab, using the same dosing of lebrikizumab as in the ADvocate studies, versus TCS plus placebo.
In all three trials, with a total of more than 1,000 participants, clinicians assessed for the presence or absence of facial or hand dermatitis at baseline. At week 16, they then assessed the change from baseline based on a 4-point scale of cleared, improved, no change, and worsened. “Improvement” was defined as cleared or improved.
Both facial and hand dermatitis were identified in a majority of patients at baseline. For instance, in ADvocate 1, facial dermatitis was identified in 71.4% of patients in the lebrikizumab group and 80.9% of those in the placebo group. Hand dermatitis was identified in 72% and 73% of the treatment and placebo groups, respectively.
Across the trials, at 16 weeks, 58%-69% of adult and adolescent patients receiving lebrikizumab had improvement in facial dermatitis, compared with 22%-46% on placebo. For hand dermatitis, 62%-73% experienced improvement, compared with 19%-43% on placebo, respectively. Proportions of improved patients in both the lebrikizumab and placebo groups were highest in the ADhere trial, Dr. Murase reported.
In the ADvocate trials, 16 weeks marked the end of the induction phase and the start of a 36-week maintenance period. The ADhere trial was a 16-week study. Overall results from ADhere were published in January in JAMA Dermatology, and results from the 16-week induction period of the ADvocate trials were published in March in the New England Journal of Medicine.
Lebrikizumab received fast-track designation for AD by the Food and Drug Administration in 2019. Regulatory decisions in the United States and the European Union are expected later this year, according to a press release from Eli Lilly, the drug’s developer.
Asked to comment on the study results, Zelma Chiesa Fuxench, MD, MSCE, assistant professor of dermatology at the University of Pennsylvania, Philadelphia, called the post-hoc results promising. “While newer, more targeted treatments for AD offer the possibility of overall improvement and long-term disease control, we do not have sufficient data to help guide us when it comes to selecting treatment based on which area of the body is affected,” she explained. Most published findings have used “overall scores and not scores stratified by body region.”
The new findings, “help expand our current understanding of how the drug works for different areas of the body,” which can help inform treatment discussions with patients, she added.
AD can be especially challenging to treat when it involves “what are considered to be more sensitive areas such as the face or hands,” said Dr. Chiesa Fuxench. Challenges may include poor tolerance to topical medications, concerns for safety with long-term use, and the need for constant reapplication.
“Those of us who treat a large number of AD patients suspect that the impact and/or burden of AD may be different depending on what areas of the body are affected,” but more data are needed, she added. Limitations of the study, she noted, include “that the study may not have been adequately powered and that the sample size was small.”
Dupilumab result for hand, foot dermatitis
The phase 3 LIBERTY-AD-HAFT trial randomized 133 patients with moderate to severe atopic hand and/or foot dermatitis to a 16-week course of dupilumab (Dupixent) monotherapy, 300 mg every 2 weeks in adults and 200 or 300 mg every 2 weeks in adolescents, or placebo. Patients were then followed during a 12-week safety follow-up period.
Significantly more patients in the dupilumab group achieved the primary endpoint of a hand and foot Investigator Global Assessment (IGA) score of 0/1 at 16 weeks: 40.3% vs. 16.7% in the placebo group (P = .003). Statistical significance was reached at week 8, reported Dr. Silverberg, professor of dermatology and director of clinical research at George Washington University, Washington. Dupilumab, a human monoclonal IgG4 antibody that inhibits IL-4 and IL-13 signaling, is FDA approved for treating moderate to severe AD in patients age 6 months and older, among other indications.
In addition, the proportion of patients achieving a 4-point or greater improvement in the weekly average of daily hand and foot Peak Pruritus Numerical Rating Scale (PPNRS), the key secondary endpoint, was about fourfold greater with dupilumab: 52.2%, compared with 13.6% on placebo (P < .0001). This reduction in itch reached statistical significance by week 1. Dupilumab-treated patients also experienced significant improvement in other lesion measures and in Quality of Life in Hand Eczema Questionnaire scores, Dr. Silverberg noted.
The patients had a mean age in their 30s and a mean duration of atopic hand and/or foot dermatitis of 15-16 years. For more than one-quarter of patients, morphology was hyperkeratotic, which “has to be one of the toughest subsets to affect positive change in,” he said.
About 40% of patients had lesions on the hands only, and more than half had lesions on both hands and feet. “This is pretty realistic – we generally don’t see much isolated foot dermatitis in the AD population,” Dr. Silverberg said.
About 70%-75% had concomitant AD outside of the hands and feet, mostly of moderate severity. Patients with positive patch tests or whose hand and foot eczema was believed to be driven by irritants were excluded from the trial, as were patients who had used TCS or other topical treatments within 2 weeks of the baseline visit.
Rescue medication use was low (3% with dupilumab vs. 21% with placebo), and adverse events were “pretty consistent with everything we’ve seen with dupilumab,” said Dr. Silverberg.
Commenting on this study, Dr. Chiesa Fuxench said she was “excited to see [the findings], as hand and foot AD can often be quite challenging to treat in clinic.” The improvements in overall disease scores, itch, and quality of life scores – with fairly good tolerance – are “reassuring and what we would expect based on our current experience with dupilumab,” she said.
The lebrikizumab study was funded by Dermira, a wholly owned subsidiary of Eli Lilly. The dupilumab study was sponsored by Sanofi and Regeneron Pharmaceuticals. Some of the data were also reported by lead investigator Eric Simpson, MD, of Oregon Health and Science University at the annual meeting of the American Academy of Dermatology in March 2023.
Dr. Murase reported consulting/advising for Eli Lilly, Leo Pharma, UCB, Sanofi-Genzyme, and non-CME speaking/honoraria for UCB and Regeneron. Dr. Silverberg reported consulting fees and fees for non-CME services from Sanofi Genzyme, Regeneron, Pfizer, and other companies. Dr. Chiesa Fuxench, who was a speaker at the RAD meeting but was not involved in the studies, disclosed receiving honoraria for CME work in AD sponsored by education grants from Regeneron/Sanofi, and grant/research support from Lilly, Regeneron, and Sanofi, among other disclosures.
AT RAD 2023
FDA approves new drug to manage menopausal hot flashes
The Food and Drug Administration has approved the oral medication fezolinetant (Veozah) for the treatment of moderate to severe hot flashes in menopausal women, according to an FDA statement. The approved dose is 45 mg once daily.
Fezolinetant, a neurokinin 3 (NK3) receptor antagonist, is the first drug of its kind to earn FDA approval for the vasomotor symptoms associated with menopause, according to the statement. The drug works by binding to the NK3 receptor, which plays a role in regulating body temperature, and blocking its activity. Fezolinetant is not a hormone, and can be taken by women for whom hormones are contraindicated, such as those with a history of vaginal bleeding, stroke, heart attack, blood clots, or liver disease, the FDA stated.
The approval was based on data from the SKYLIGHT 2 trial, results of which were presented at the annual meeting of the Endocrine Society, reported by this news organization, and published in the Journal of Clinical Endocrinology and Metabolism.
In the two-phase trial, women were randomized to 30 mg or 45 mg of fezolinetant or a placebo. After 12 weeks, women in placebo groups were rerandomized to fezolinetant for a 40-week safety study.
The study population included women aged 40-65 years, with an average minimum of seven moderate-to-severe hot flashes per day. The study included 120 sites in North America and Europe.
At 12 weeks, both placebo and fezolinetant patients experienced reductions in moderate to severe vasomotor symptoms of approximately 60%, as well as a significant decrease in vasomotor symptom severity.
The FDA statement noted that patients should undergo baseline blood work before starting fezolinetant to test for liver infection or damage, and the prescribing information includes a warning for liver injury; blood work should be repeated at 3, 6, and 9 months after starting the medication, according to the FDA and a press release from the manufacturer Astellas.
The most common side effects associated with fezolinetant include abdominal pain, diarrhea, insomnia, back pain, hot flashes, and elevated liver values, according to the FDA statement. The FDA granted Astellas Pharma’s application a Priority Review designation. Astellas has priced the drug at $550 for a 30-day supply, significantly higher than the Institute for Clinical and Economic Review’s previously recommended range of $2,000 to $2,500 per year.
Full prescribing information is available here.
A healthy 36-year-old female presented with 4 days of itchy lesions on the right upper extremity
Additionally, Orthopox DNA by PCR and Monkeypox (mpox) virus DNA by PCR were detected. Herpes simplex virus and bacterial viral cultures were negative. Valacyclovir was started at the time of presentation and the patient’s lesions resolved without sequelae.
Mpox is a zoonotic double-stranded DNA virus that is part of the Orthopoxvirus family, including the West African and Central African variants. This disease presents similarly to smallpox, so most mpox research was conducted around the time smallpox was eradicated. It was not until 1970, when the disease was isolated from a patient with suspected smallpox in the Democratic Republic of the Congo (DRC), that human mpox was considered a distinct disease. An epidemic outbreak in the United States occurred in 2003 related to infected prairie dogs, and travel-related outbreaks have been more recently reported up until May 2022, in which mpox was reported in nonendemic areas including North America, Europe, and Australia. Most cases in this outbreak occurred in men who have sex with men (MSM), but this is not always the case, and mpox is not necessarily considered a sexually transmitted infection. Mpox presents similarly to smallpox and VZV, so using laboratory tests is important in diagnosing and tracking this disease.
Although it is not easily transmitted, the disease can spread through bodily secretions both directly and indirectly. Mpox typically begins with a prodrome that includes fever, headache, myalgia, and fatigue. This is followed by lymphadenopathy that precedes and coincides with rash development. The lymph nodes are firm, tender, may be painful, and are a defining factor in presentation that differs from smallpox and varicella. The rash typically starts on the face, then presents on the body in a centrifugal distribution. However, cases related to sexual transmission present with anogenital lesions. The lesions are characterized by a progression from maculopapular to vesiculopustular, and can vary widely in quantity.
Notably, individuals are contagious from the onset of the prodrome until the lesions have scabbed over and fallen off. The eruptive nature of the later lesions poses a threat of secondary infection, and is often accompanied by a second febrile period that signifies deterioration of the patient’s condition. Other signs of secondary infection are variable and include pulmonary symptoms, vomiting, diarrhea, ocular infections, and in rare cases, encephalitis. These sequelae are more common in unvaccinated and immunocompromised individuals. Long-term complications of mpox include pitted scarring from cutaneous lesions with children being more susceptible to severe disease. The mortality rate for the disease is very low. (As of May 10, 2023, there have been 30,395 mpox cases reported in the United States, and 42 deaths, according to the Centers for Disease Control and Prevention.)
There are a variety of diagnostic tests that can aid in mpox identification, but they are most strongly supported when combined with clinical and epidemiological data. The best, least invasive method includes collection of lesion exudate or crust on a swab, and viral DNA is best preserved by keeping the specimen in a cool, dry, and dark environment. PCR is considered the standard, and electron microscopy and immunohistochemistry are valid tests, but all modalities require sophisticated technicians with the proper laboratory equipment. This is limiting because many cases present in underserved areas that lack the facilities for proper, real-time analysis. Antigen and antibody-based tests can be used, but cross-reactivity of other orthopoxviridae limits confirmation of mpox infection. Vaccination status, history and location must be considered.
Vaccination is the chief form of prevention for mpox, although it is not considered entirely protective. Smallpox vaccination provides protection, but widespread administration of the vaccine is no longer practiced, and an estimated 70% of the global population is no longer vaccinated. Vaccination is recommended for anyone at risk of exposure, but as this is a live, attenuated vaccine, the immune status of the patient is important to keep in mind. Tecovirimat and other antiviral medications including cidofovir and brincidofovir may be considered in severe cases.
This case is unique as our patient, who had no known risk factors for mpox, presented with mpox and VZV, simultaneously. Although clinical presentation and epidemiological patterns between these diseases differ, there have been a limited number of cases of coinfection reported in the literature, mainly in the DRC where mpox is endemic. Diagnosis must be made by separate laboratory tests and there are differences in presentation between independent and coinfection for these viruses. Notably, patients with mpox/VZV coinfection may be less likely to present with lesions on the face, thorax, arms, palms, and soles than those with only mpox but experience a higher lesion burden than those afflicted by only VZV. Coinfection may be related to reactivation of dormant VZV, or increased susceptibility to secondary infection when infected with one virus.
This case and photo were submitted by Lucas Shapiro, BS, of the Dr. Kiran C. Patel College of Osteopathic Medicine at Nova Southeastern University, Fort Lauderdale, Fla., and Donna Bilu Martin, MD.
Dr. Bilu Martin is a board-certified dermatologist in private practice at Premier Dermatology, MD, in Aventura, Fla. More diagnostic cases are available at mdedge.com/dermatology. To submit a case for possible publication, send an email to dermnews@mdedge.com.
References
1. Macneil A et al. Clin Infect Dis. 2009 Jan 1;48(1):e6-8.
2. Di Gennaro F et al. Microorganisms. 2022 Aug 12;10(8):1633.
3. Hughes CM et al. Am J Trop Med Hyg. 2020 Dec 7;104(2):604-11.
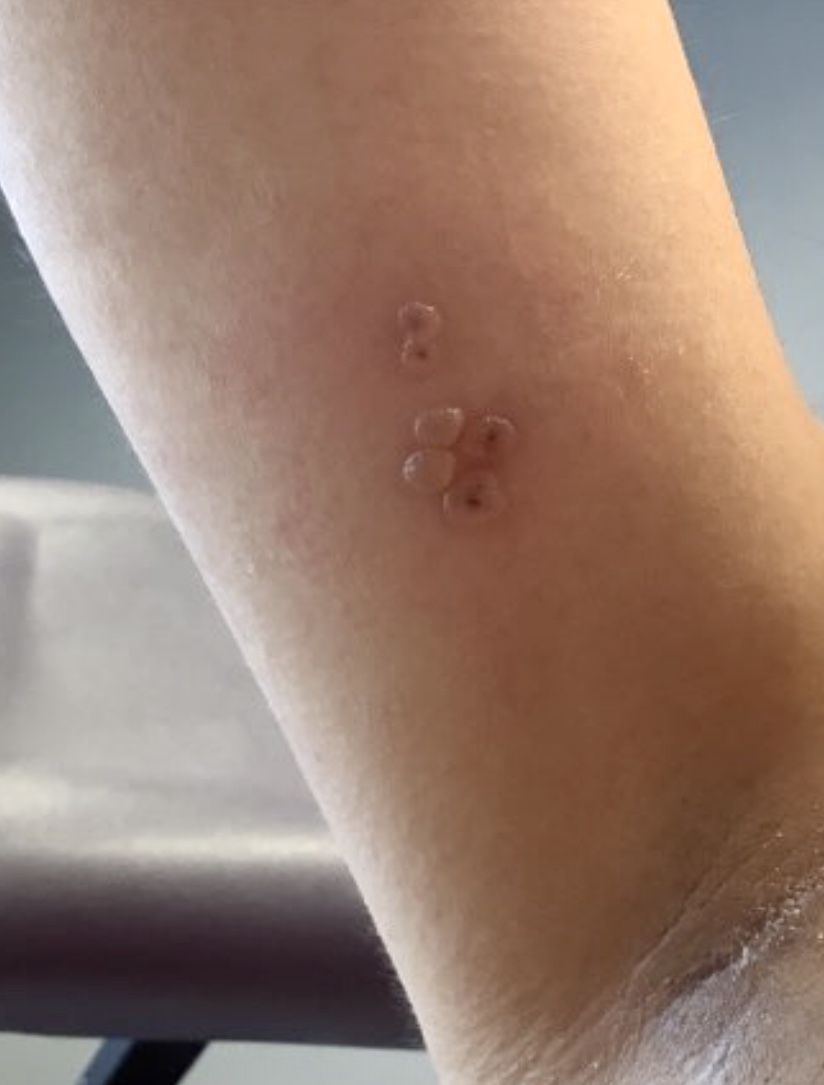
CGM completes picture of A1c in type 2 diabetes
in a post hoc analysis of the SWITCH PRO clinical trial.
TIR was inversely related to A1c, with the strongest correlation following treatment intensification.
However, “there was a wide scatter of data, indicating that TIR (and other metrics) provides information about glycemic control that cannot be discerned from A1c alone, and which at least complements it,” Ronald M. Goldenberg, MD, from LMC Diabetes & Endocrinology in Thornhill, Ont., and colleagues write in their article published in Diabetes Therapy.
Other work has shown that more than a third of people with type 2 diabetes are not achieving the internationally recommended A1c target of < 7% to 8.5%, they note.
When used with A1c, CGM data – such as TIR, time below range (TBR), and time above range (TAR) – “provide a more complete picture of glucose levels throughout the day and night,” they write.
“This may help empower people with diabetes to better manage their condition, giving them practical insights into the factors driving daily fluctuations in glucose levels, such as diet, exercise, insulin dosage, and insulin timing,” they add. “These metrics may also be used to inform treatment decisions by health care professionals.”
“Ultimately,” the researchers conclude, “it is hoped that the use of these new metrics should lead to an improved quality of glycemic control and, in turn, to a reduction in the number of diabetes-related complications.”
‘Important study’
Invited to comment, Celeste C. Thomas, MD, who was not involved with the research, said: “This study is important because it is consistent with previous analyses that found a correlation between TIR and A1c.”
But, “I was surprised by the scatter plots which identified participants with TIR of 70% that also had A1c > 9%,” she added. “This highlights the importance of using multiple glycemic metrics to understand an individual’s risk for diabetes complications and to be aware of the limitations of the metrics.”
Dr. Thomas, from the University of Chicago, also noted that CGM is used in endocrinology clinics and increasingly in primary care clinics, “often to determine glycemic patterns to optimize therapeutic management but also to review TIR and, importantly, time below range to reduce the incidence of hypoglycemia.”
And people with type 2 diabetes are using CGM, Dr. Thomas noted, to understand their individual responses to medications, food choices, sleep quality and duration, exercise, and other day-to-day variables that affect glucose levels. “In my clinical practice, the information provided by personal CGM is empowering,” she said.
Effective April 4, 2023, Medicare “allows for the coverage of CGM in patients [with type 2 diabetes] treated with one injection of insulin daily and those not taking insulin but with a history of hypoglycemia,” Dr. Thomas noted, whereas “previously, patients needed to be prescribed at least three injections of insulin daily. Other insurers will hopefully soon follow.”
“I foresee CGM and TIR being widely used in clinical practice for people living with type 2 diabetes,” she said, “especially those who have ever had an A1c over 8%, those with a history of hypoglycemia, and those treated with medications that are known to cause hypoglycemia.”
How does TIR compare with A1c?
Dr. Goldenberg and colleagues set out to better understand how the emerging TIR metric compares with the traditional A1c value.
They performed a post-hoc analysis of data from the phase 4 SWITCH PRO study of basal insulin–treated patients with type 2 diabetes with at least one risk factor for hypoglycemia.
The patients were treated with insulin degludec or glargine 100 during a 16-week titration and 2-week maintenance phase, and then crossed over to the other treatment for the same time periods.
Glycemic control was evaluated using a blinded professional CGM (Abbott Freestyle Libro Pro). The primary outcome was TIR, which was defined as the percentage of time spent in the blood glucose range of 70-180 mg/dL.
There were 419 participants in the full analysis. Patients were a mean age of 63 and 48% were men. They had a mean body mass index of 32 kg/m2 and had diabetes for a mean of 15 years.
There was a moderate inverse linear correlation between TIR and A1c at baseline, which became stronger following treatment intensification during the maintenance periods in the full cohort, and in a subgroup of patients with median A1c ≥ 7.5% (212 patients).
This correlation between TIR and A1c was poorer in the subgroup of patients with baseline median A1c < 7.5% (307 patients).
The data were widely scattered, “supporting the premise that A1c and TIR can be relatively crude surrogates of each other when it comes to individual patients,” Dr. Goldenberg and colleagues note.
Where individual patients have both low A1c and low TIR values, this might indicate frequent episodes of hypoglycemia.
A few individual patients had TIR > 70% but A1c approaching 9%. These patients may have different red blood cell physiology whereby A1c does not reflect average glycemic values, the researchers suggest.
The study was sponsored by Novo Nordisk and several authors are Novo Nordisk employees. The complete author disclosures are listed with the article. Dr. Thomas has reported no relevant financial relationships.
A version of this article first appeared on Medscape.com.
FROM DIABETES THERAPY
Key red flags for early-onset colorectal cancer
As the number of cases of early-onset colorectal cancer (CRC) diagnosed before age 50 continues to rise, early detection has become increasingly important.
The signs and symptoms are abdominal pain, rectal bleeding, diarrhea, and iron-deficiency anemia.
Two symptoms in particular – rectal bleeding and iron-deficiency anemia – point to the need for timely endoscopy and follow-up, the researchers say.
“Colorectal cancer is not simply a disease affecting older people; we want younger adults to be aware of and act on these potentially very telling signs and symptoms – particularly because people under 50 are considered to be at low risk, and they don’t receive routine colorectal cancer screening,” senior investigator Yin Cao, ScD, with Washington University School of Medicine, St. Louis, said in a news release.
“It’s also crucial to spread awareness among primary care doctors, gastroenterologists, and emergency medicine doctors,” Dr. Cao added. “To date, many early-onset colorectal cancers are detected in emergency rooms, and there often are significant diagnostic delays with this cancer.”
The study was published online in the Journal of the National Cancer Institute.
Although previous research has identified rectal bleeding, iron-deficiency anemia, and rectal/abdominal pain as symptoms of early-onset CRC, most studies “have aggregated symptoms till the time of diagnosis,” which limits their use for early detection, the authors explain.
In the current study, the researchers analyzed data from more than 5,000 cases of early-onset CRC and from more than 22,000 control patients using the IBM MarketScan commercial database.
Dr. Cao and colleagues found that between 3 months and 2 years before diagnosis, abdominal pain, rectal bleeding, diarrhea, and iron-deficiency anemia each indicated an increased risk for early-onset CRC.
Among patients with early-onset CRC, 19.3% presented with one or more of the four red flags between 3 months and 2 years prior to the index date; 15.6% had one symptom, and 3.7% had two or more.
After multivariable adjustment, having one symptom almost doubled the risk for early-onset CRC (odds ratio, 1.94); having two symptoms increased risk by more than threefold (OR, 3.59); and having three or more boosted the risk by more than 6.5-fold (OR, 6.52).
Abdominal pain was associated with a 34% higher risk of early-onset CRC (11.6% among case patients vs. 7.7% among controls; OR, 1.34).
Although not as common, rectal bleeding was associated with the highest odds for early-onset CRC (7.2% case patients vs. 1.3% controls; OR, 5.13).
The other predictive signs and symptoms included diarrhea (2.8% case patients vs. 1.4% controls; OR, 1.43) and iron-deficiency anemia (2.3% case patients vs. 0.9% controls; OR, 2.07).
No differences were observed by gender for each sign or symptom.
Among patients with a red-flag symptom who presented between 3 months and 2 years before diagnosis, for those with early-onset CRC, the median diagnostic interval was 8.7 months.
The researchers suggest that clinicians prioritize prompt diagnostic workups for patients younger than 50 who present with rectal bleeding and/or iron-deficiency anemia and that they also keep abdominal pain and diarrhea in mind as early symptoms.
Dr. Cao noted that since most early-onset CRC cases “have been and will continue to be diagnosed after symptom presentation, it is crucial to recognize these red-flag signs and symptoms promptly and conduct a diagnostic workup as soon as possible.
“By doing so, we can diagnose the disease earlier, which in turn can reduce the need for more aggressive treatment and improve patients’ quality of life and survival rates,” said Dr. Cao.
The study was supported by grants from the National Institutes of Health. The authors declared no conflicts of interest.
A version of this article originally appeared on Medscape.com.
FROM JOURNAL OF THE NATIONAL CANCER INSTITUTE
ChatGPT delivers credible answers to colonoscopy queries
, new research suggests.
“This study shows that a conversational AI program can generate credible medical information in response to common patient questions,” say the investigators, led by Tsung-Chun Lee, MD, division of gastroenterology and hepatology, Taipei Medical University Shuang Ho Hospital, New Taipei City, Taiwan.
“With dedicated domain training, there is meaningful potential to optimize clinical communication to patients undergoing colonoscopy,” they add.
The study was published online in Gastroenterology.
ChatGPT, developed by OpenAI, is a natural language processing tool that allows users to have personalized conversations with an artificial intelligence (AI) bot capable of providing a detailed response to any question posed.
For their first-of-its-kind study, Dr. Lee and colleagues assessed the quality of ChatGPT-generated answers to eight common patient questions about colonoscopy, including what a colonoscopy entails, why it’s performed, how to prepare for it, potential complications, what to expect after the procedure, and what happens with a positive/negative result.
They retrieved the questions from the websites of three randomly selected top hospitals for gastroenterology and gastrointestinal surgery and had ChatGPT (Jan. 30, 2023, version) answer the questions twice.
Using plagiarism detection software, they found that text similarity was extremely low between ChatGPT answers and those on hospital websites (0%-16%). Text similarity ranged from 28% to 77% between the two ChatGPT answers for the same question, except on the question of what to do after a positive colonoscopy result, which had 0% text similarity.
To objectively gauge the quality of the ChatGPT answers, four gastroenterologists (two senior gastroenterologists and two fellows) rated 36 pairs of common questions and answers on a seven-point Likert scale according to ease of understanding, scientific adequacy, and satisfaction with the answer.
The gastroenterologists rated the ChatGPT answers highly and similarly to non-AI answers for all three quality indicators, with some AI scores even higher than non-AI scores.
Interestingly, they could correctly identify AI-generated answers only 48% of the time. Three raters had an accuracy of less than 50%, whereas one (a fellow) was 81% accurate.
The researchers note that publications about ChatGPT in PubMed grew 10-fold from Feb. 3 to April 14, 2023, with topics such as board examinations authorship, editorial policies, medical education, and clinical decision support.
Although in their early days, ChatGPT and other AI bots may represent a “transformative innovation” in how medical information is created by physicians and consumed by patients, they say.
It could also be a time-saver for health care professionals.
“AI-generated medical information, with appropriate provider oversight, accreditation, and periodic surveillance, could improve efficiency of care and free providers for more cognitively intensive patient communications,” they add.
However, several challenges remain, such as the lack of clinical evidence in constructing AI-generated answers.
In addition, AI-generated answers were written at significantly higher reading levels than were answers on hospital websites, which could be a barrier for some patients.
The study received no specific funding. The authors have declared no relevant conflicts of interest.
A version of this article first appeared on Medscape.com.
FROM GASTROENTEROLOGY